Download as ODP, PPTX

![Work of Ramachandran
A Ramachandran plot (also known as a
Ramachandran diagram or a [φ,ψ] plot),
originally developed in 1963 by G. N.
Ramachandran, C. Ramakrishnan, and V.
Sasisekharan
Initially proposed a modelled structure on
collagen as a two bonded system based on the
formation of two inter hydrogen bonds between
their structures](https://image.slidesharecdn.com/11-150314133251-conversion-gate01/75/11-ramachandran-plot-3-2048.jpg)
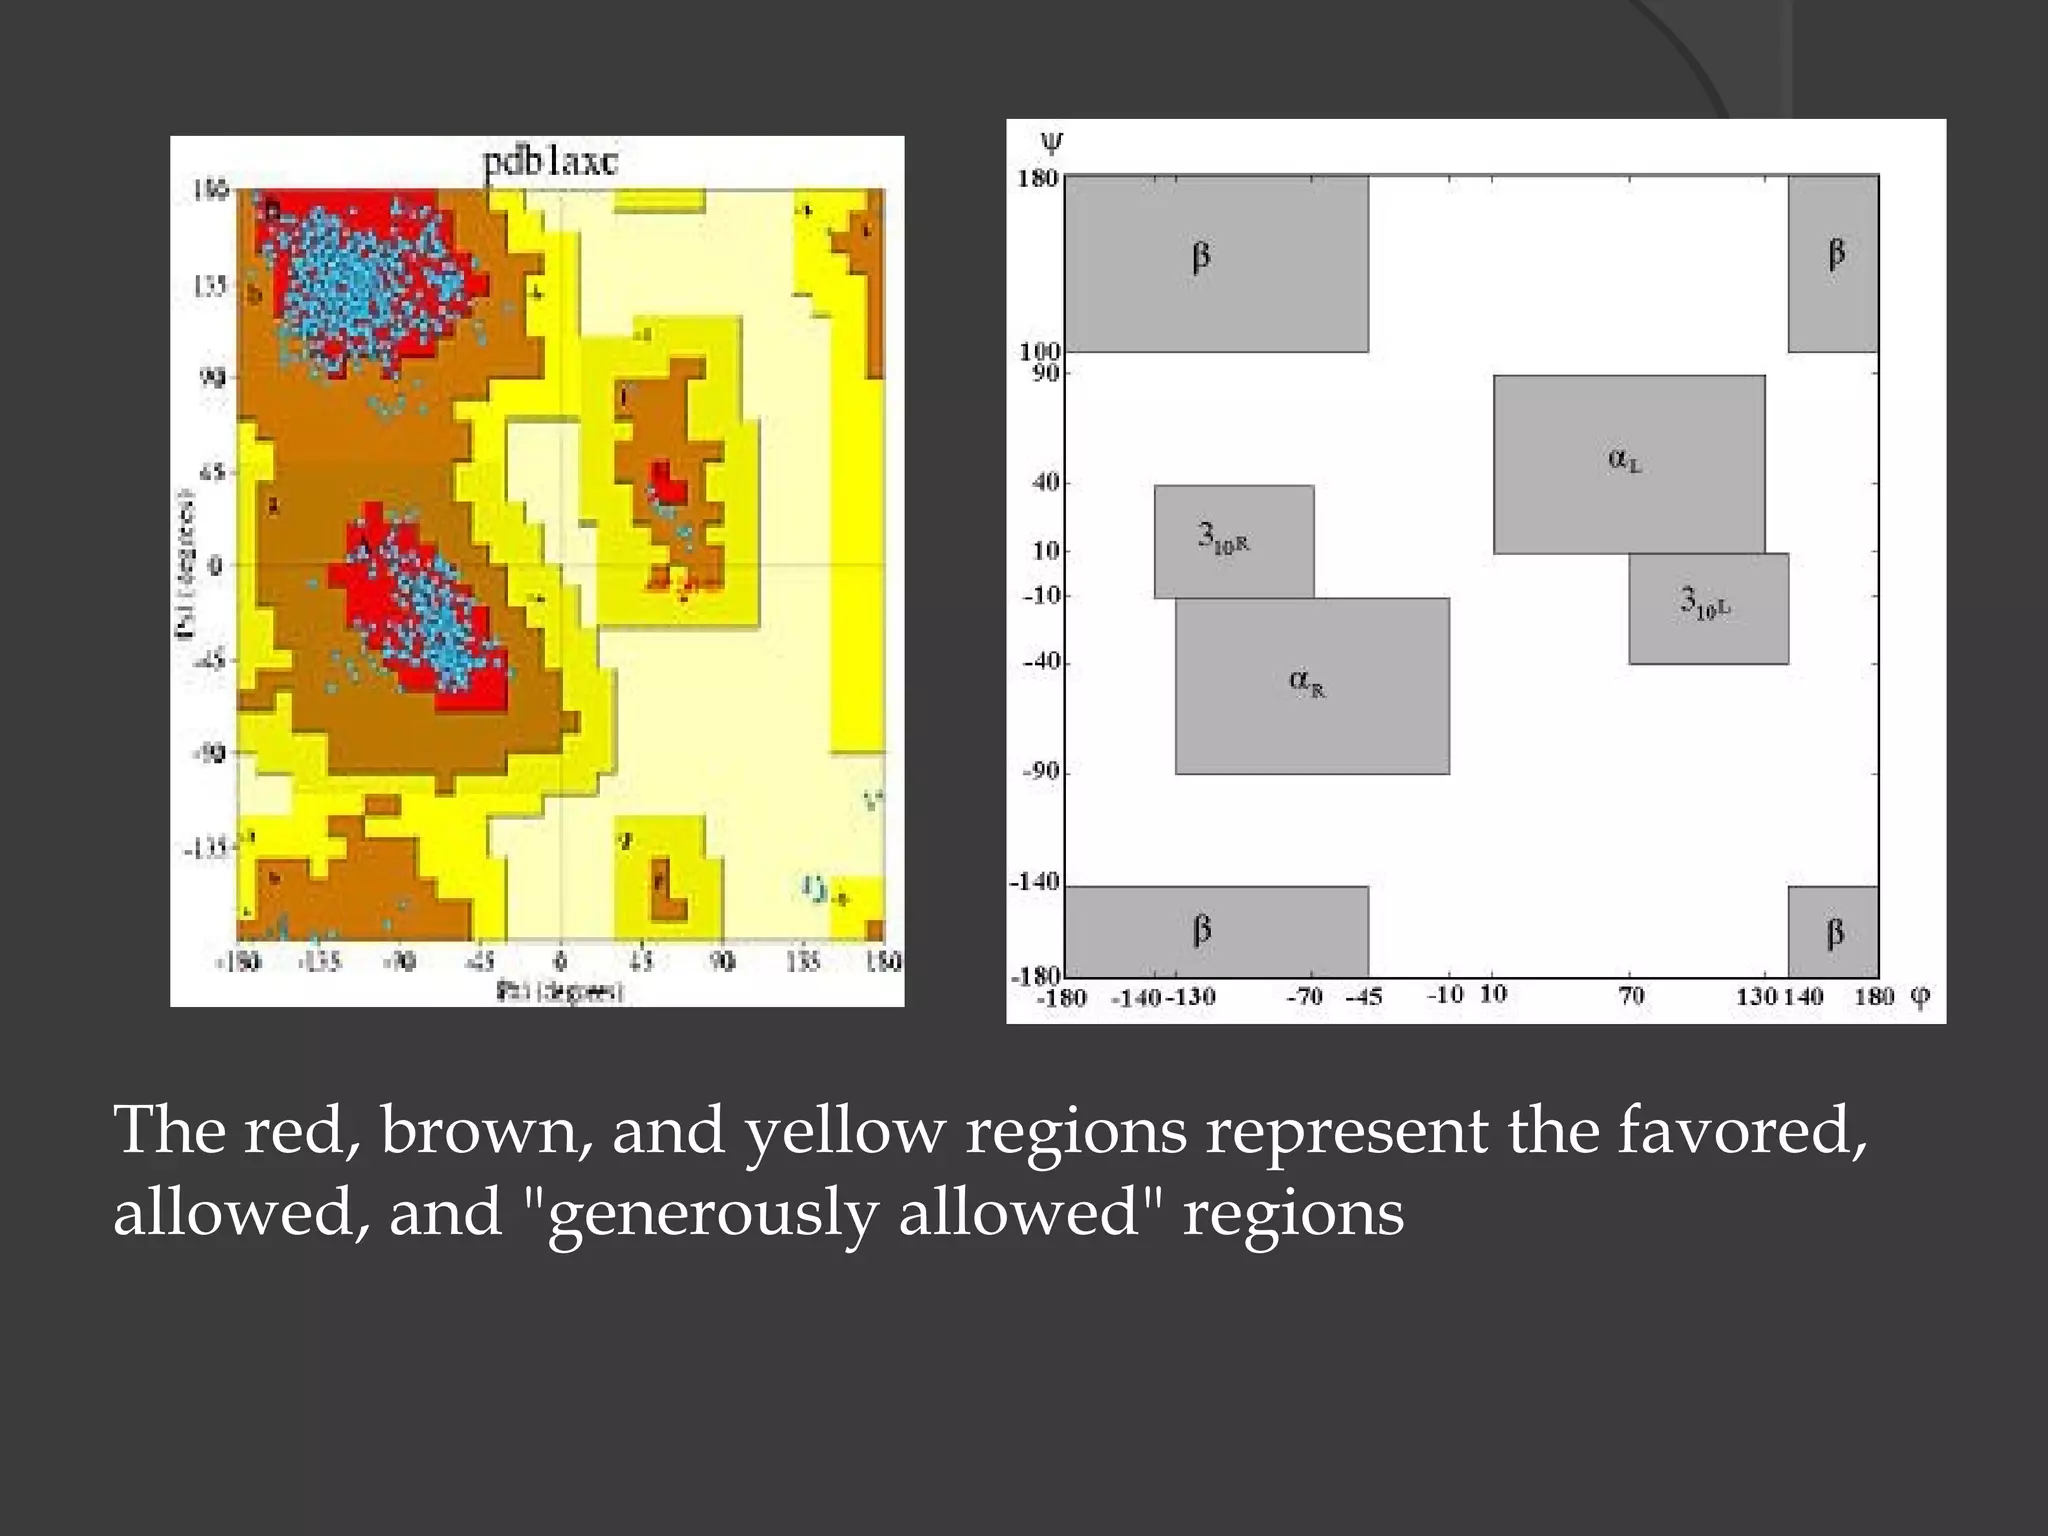

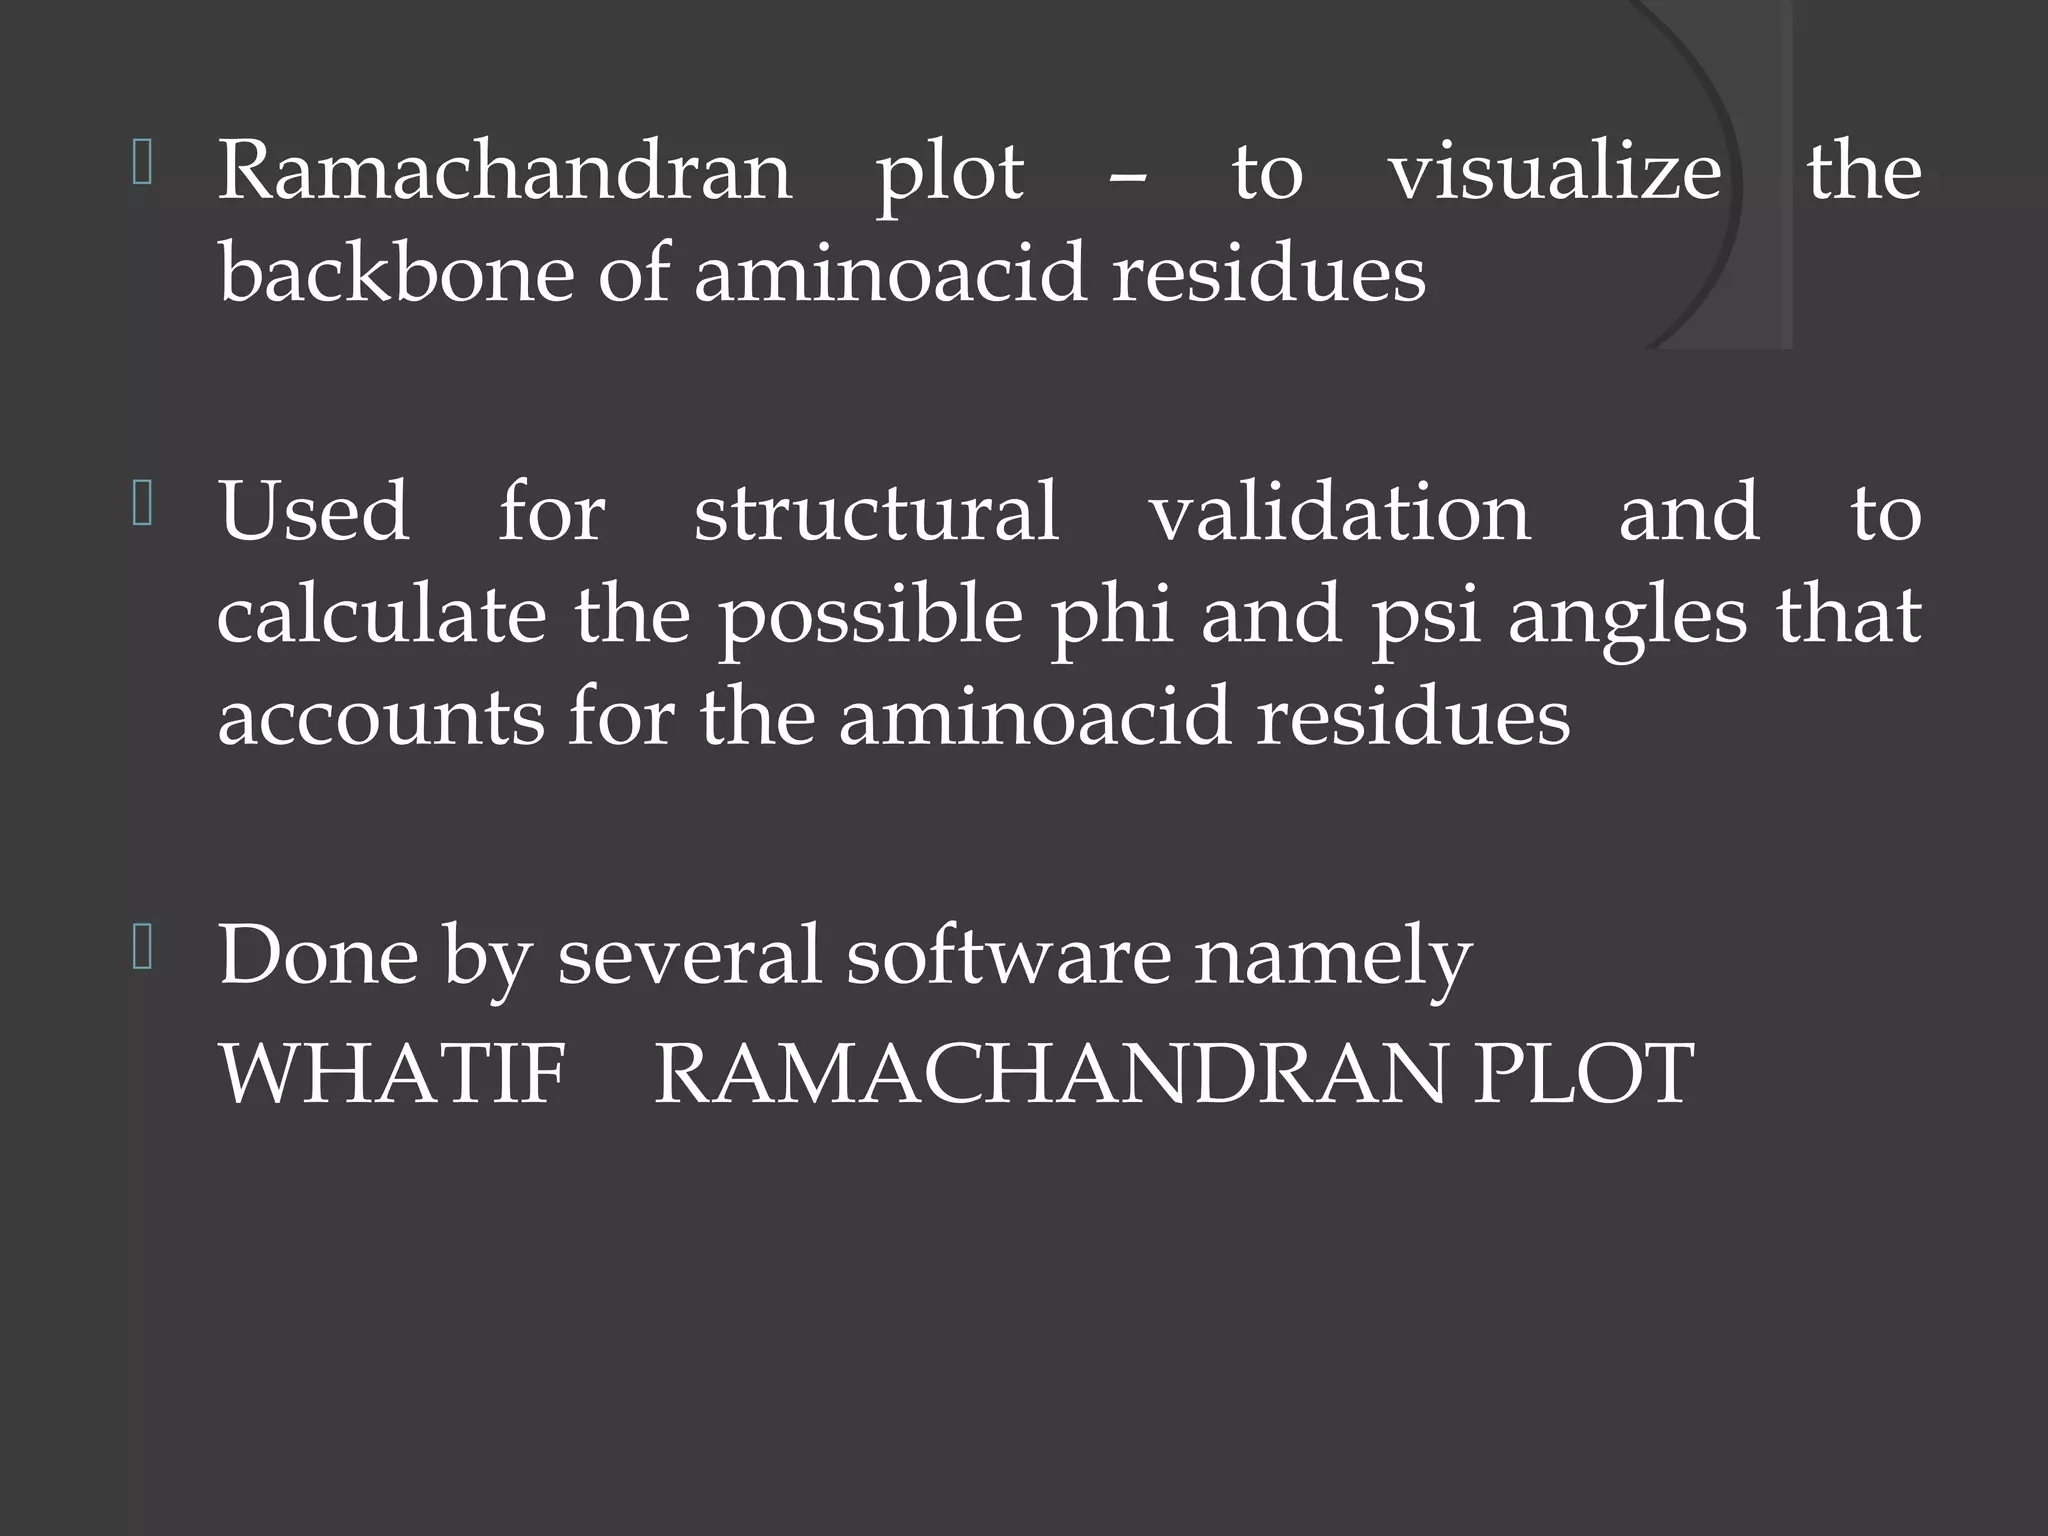
A Ramachandran plot visualizes the backbone of amino acid residues by plotting the possible phi and psi dihedral angles, which were originally developed by Ramachandran et al. in 1963. It shows favored, allowed, and generously allowed regions based on analysis of protein crystal structures. Two high density regions correspond to alpha helices and beta sheets. Ramachandran plots are used for protein structure validation and show amino acid preferences and distributions observed in protein data bank structures.
Introduces the Ramachandran plot, visualizing amino acid backbone; validates structure, calculates phi-psi angles.
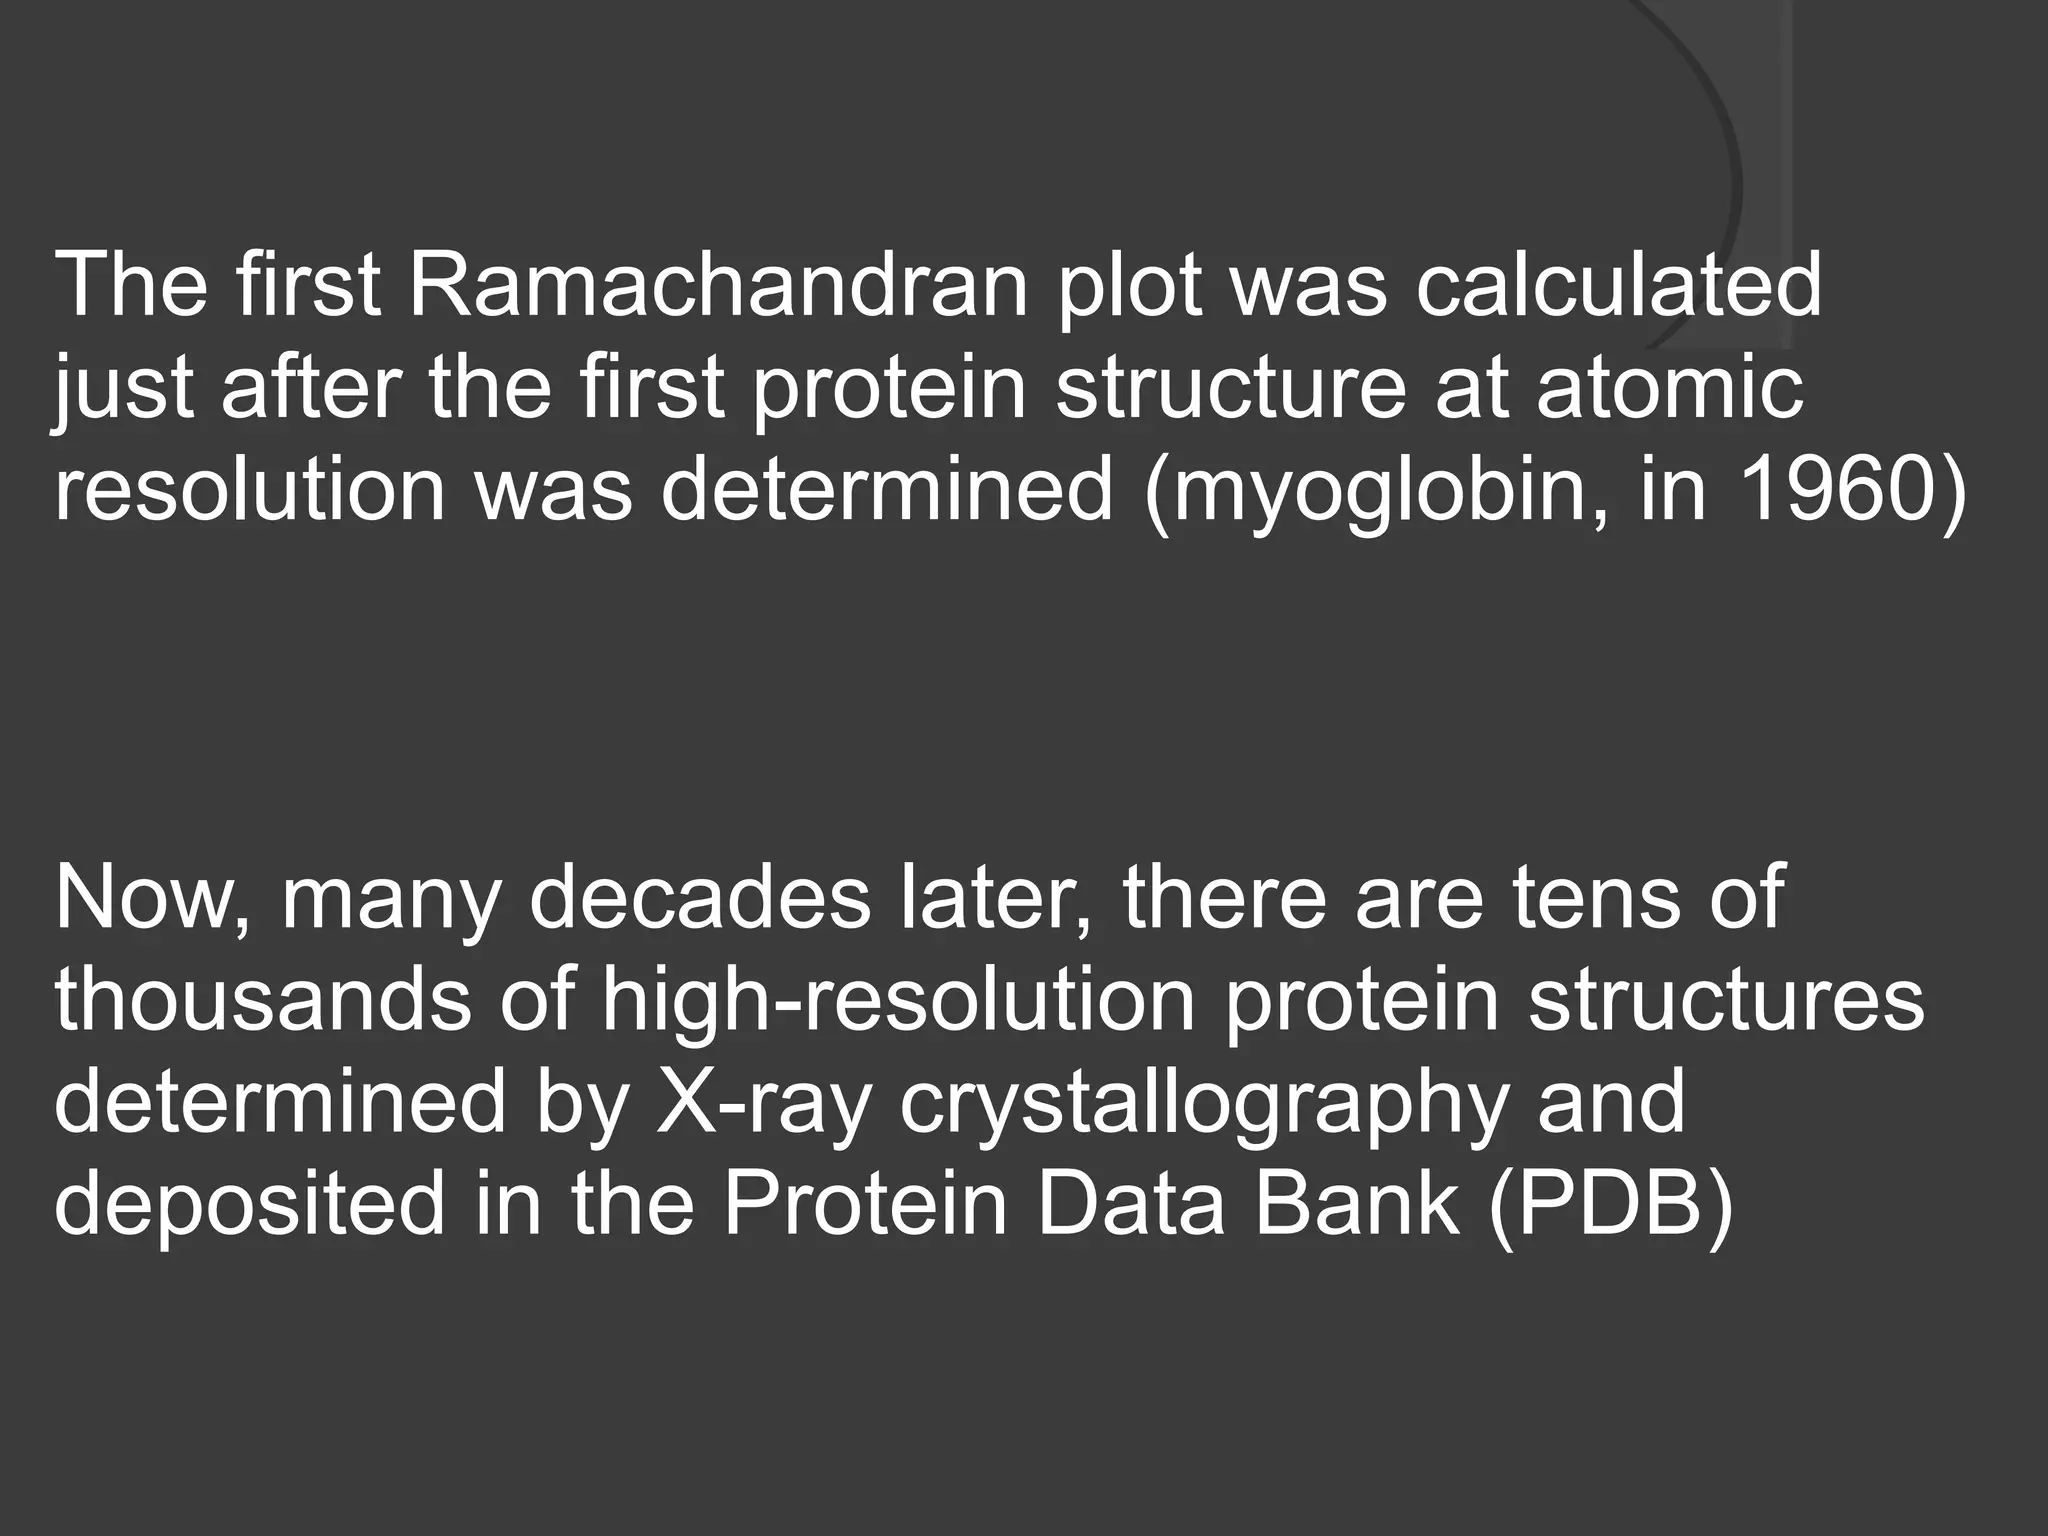
Details origin by Ramachandran et al. in '63 post myoglobin's resolution; significant protein structures in PDB.
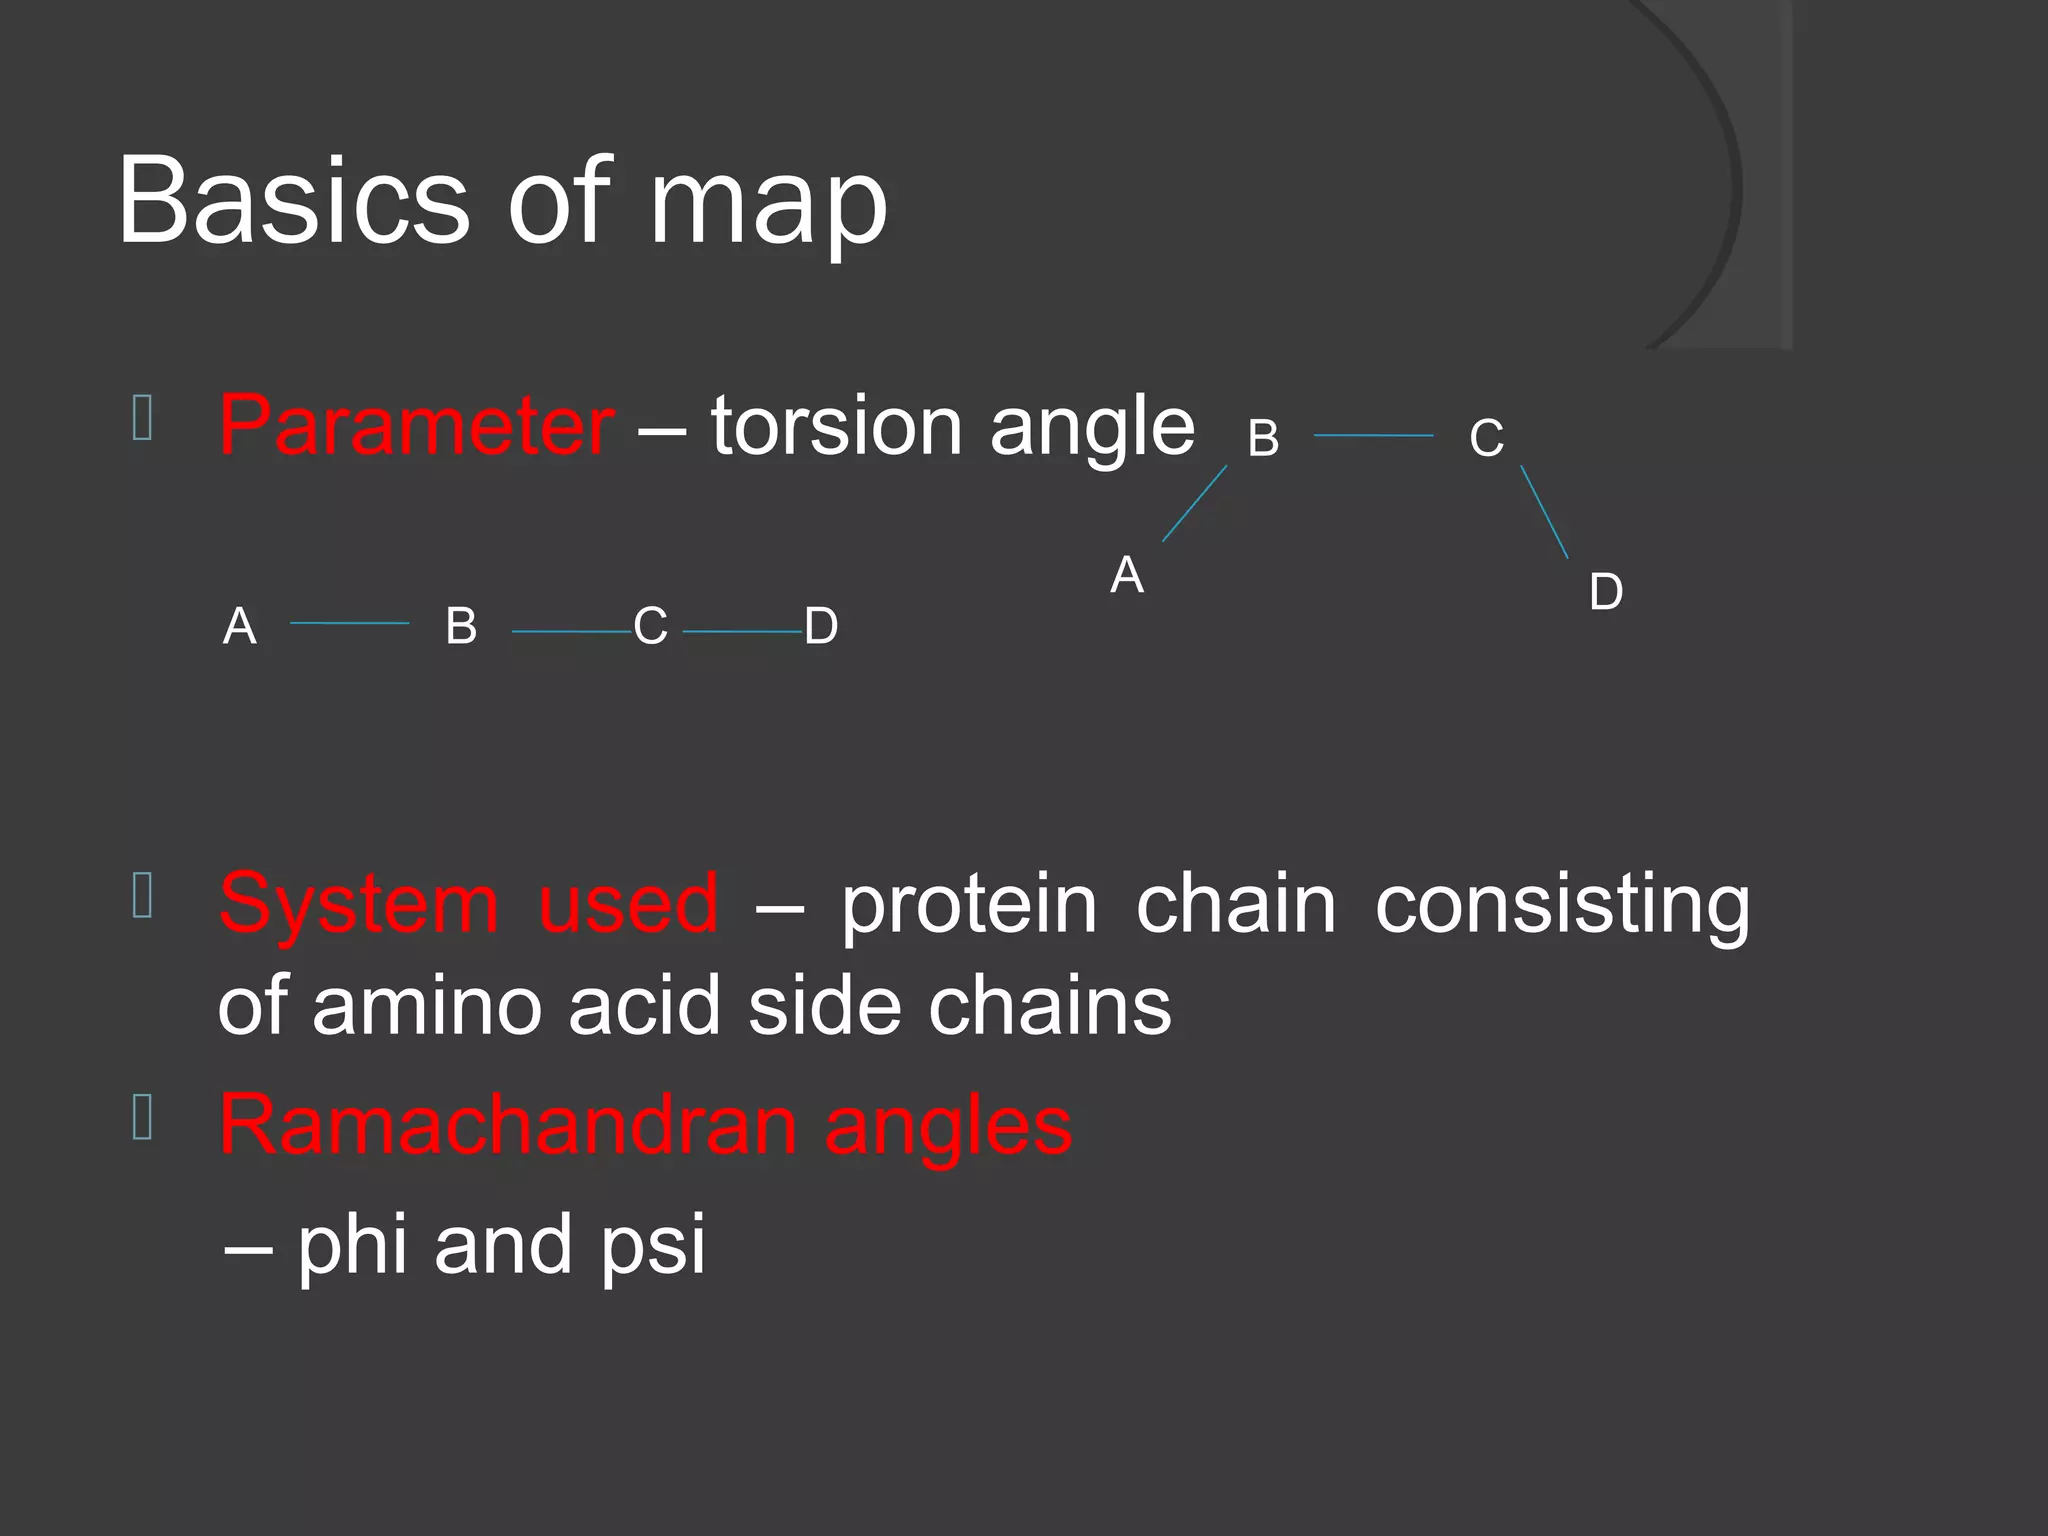
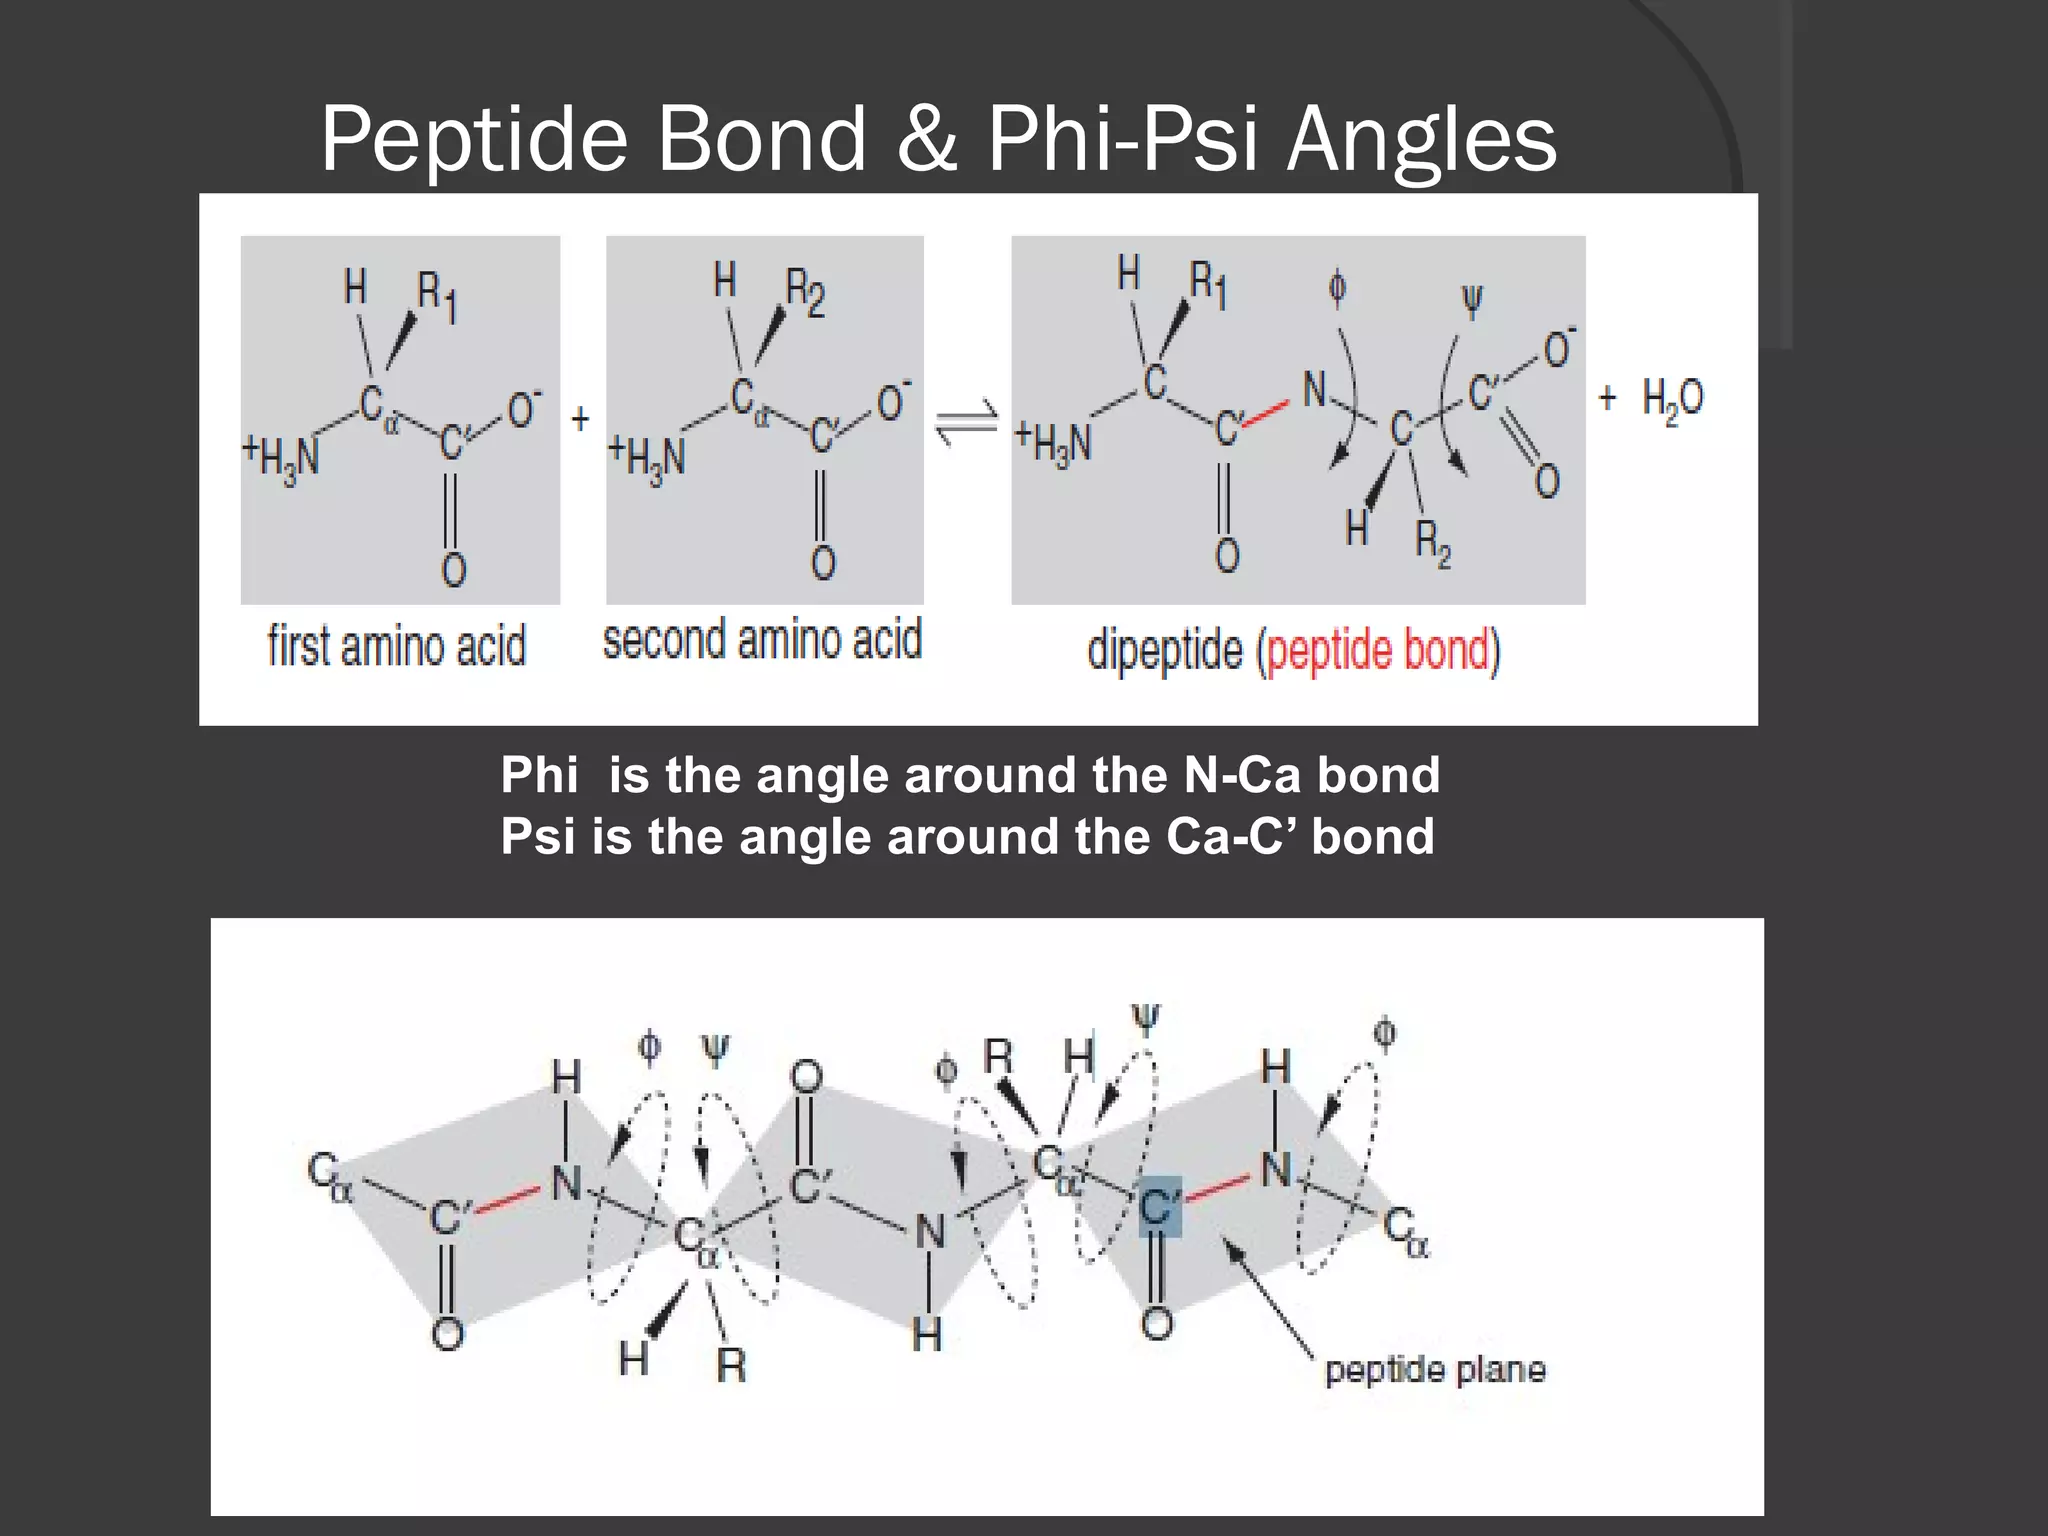
Discusses parameters (torsion angles), specific angles phi (N-Ca) and psi (Ca-C’); essential for protein analysis.
Analyzes crystal structure limits; identifies 'favored', 'allowed', and 'generously allowed' regions on plot.
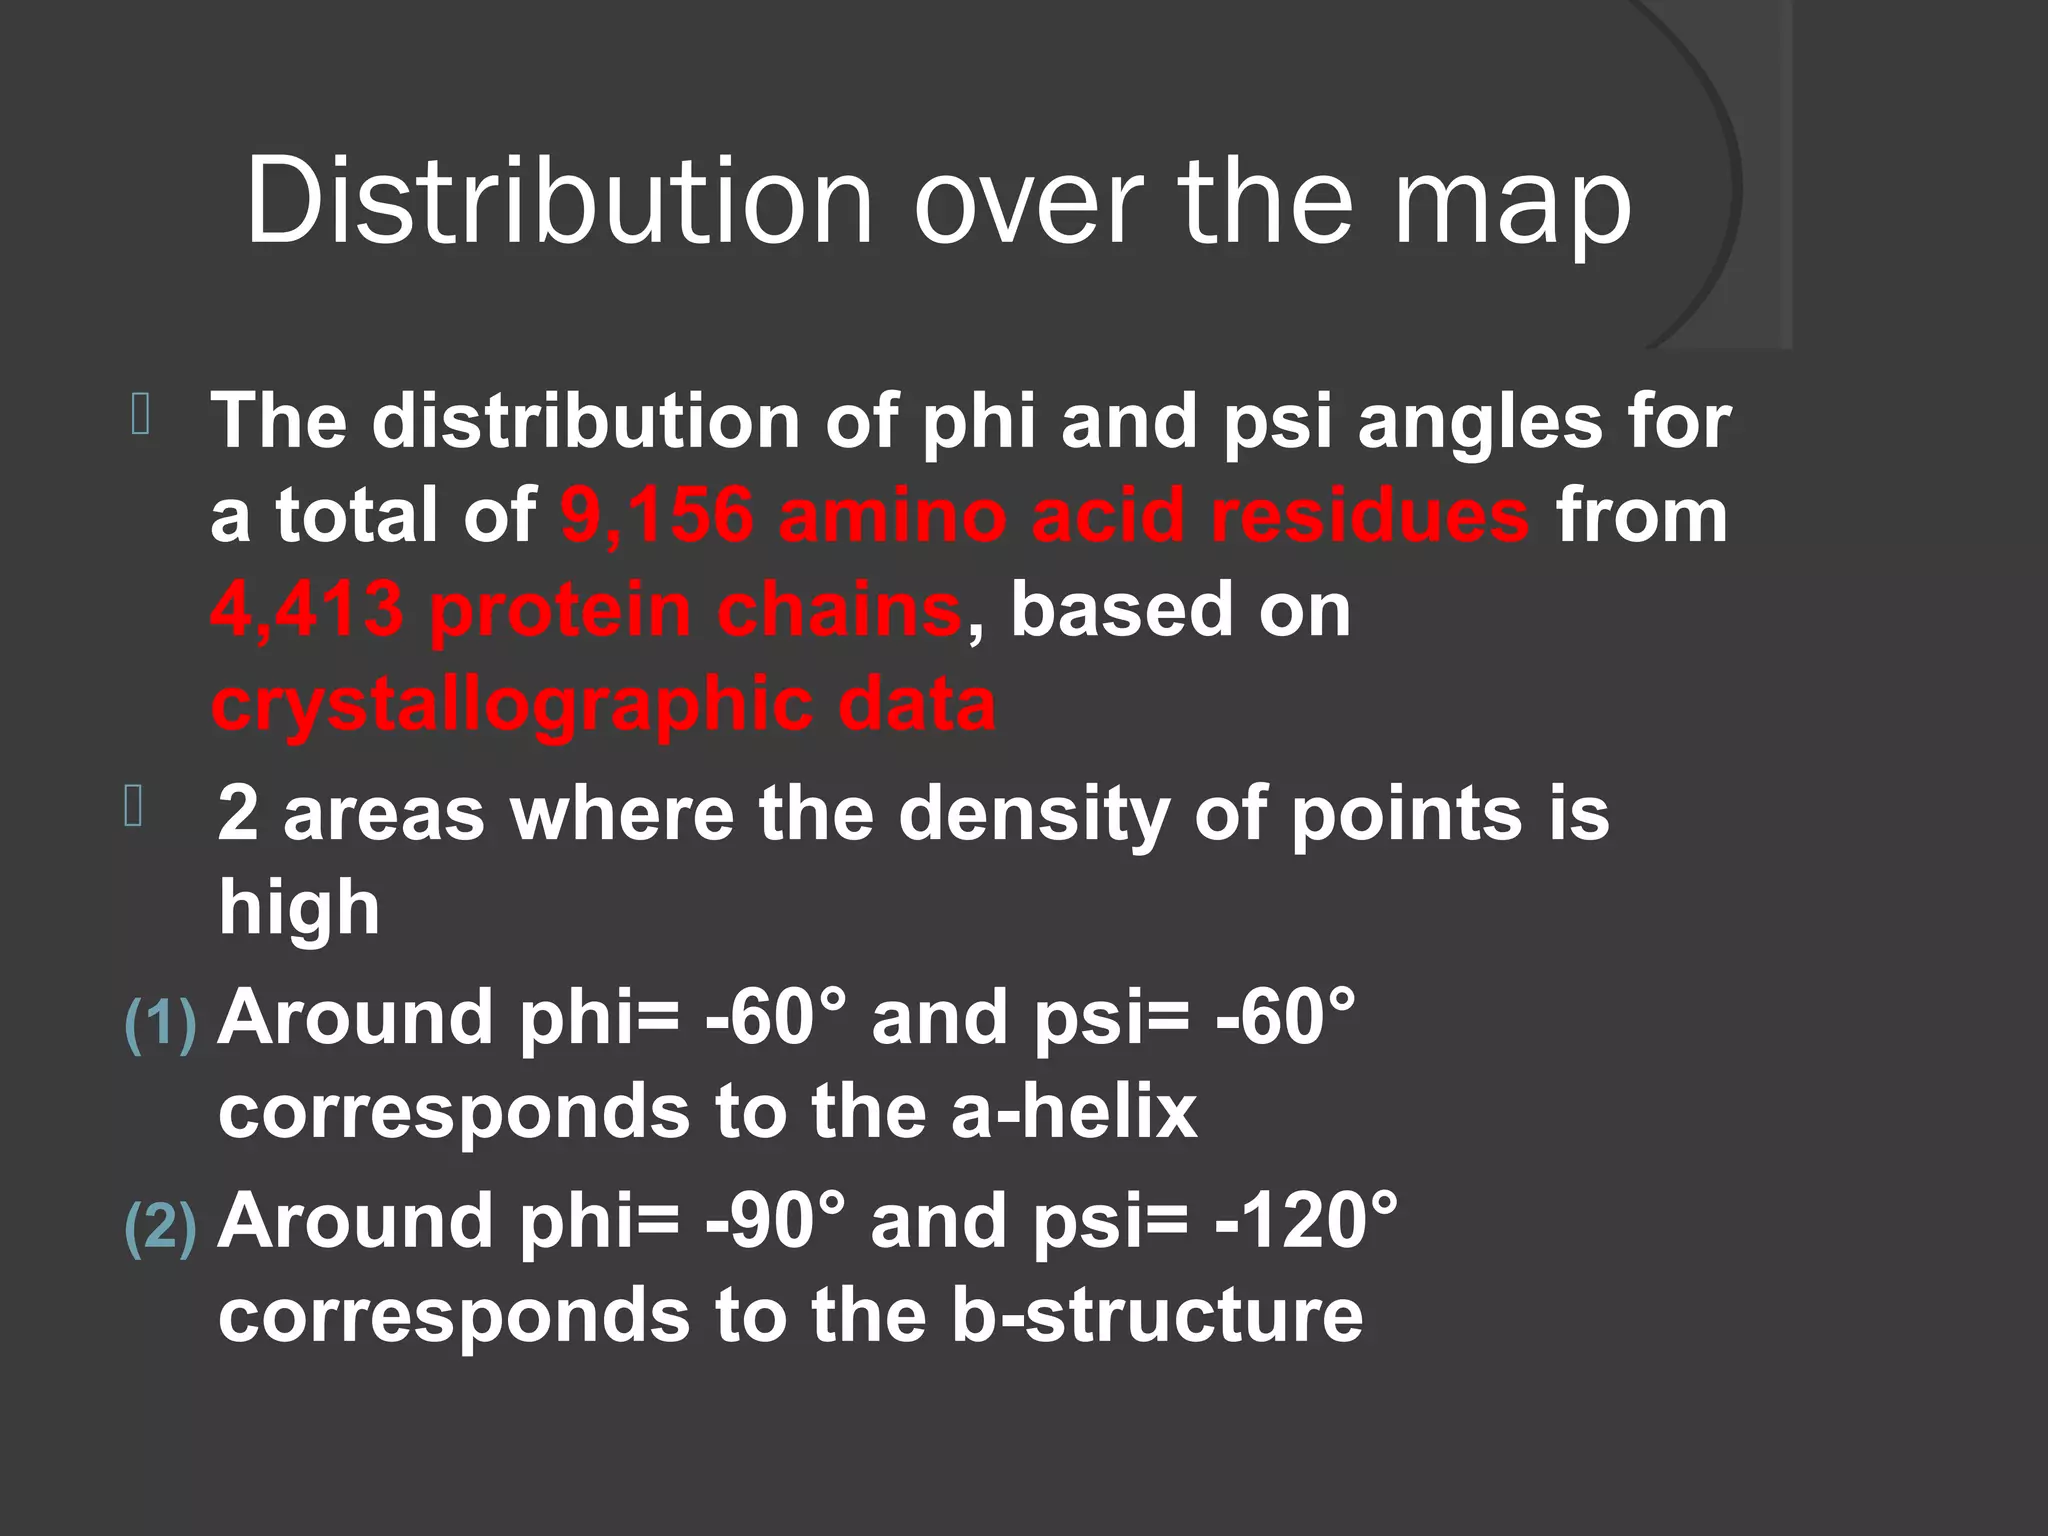
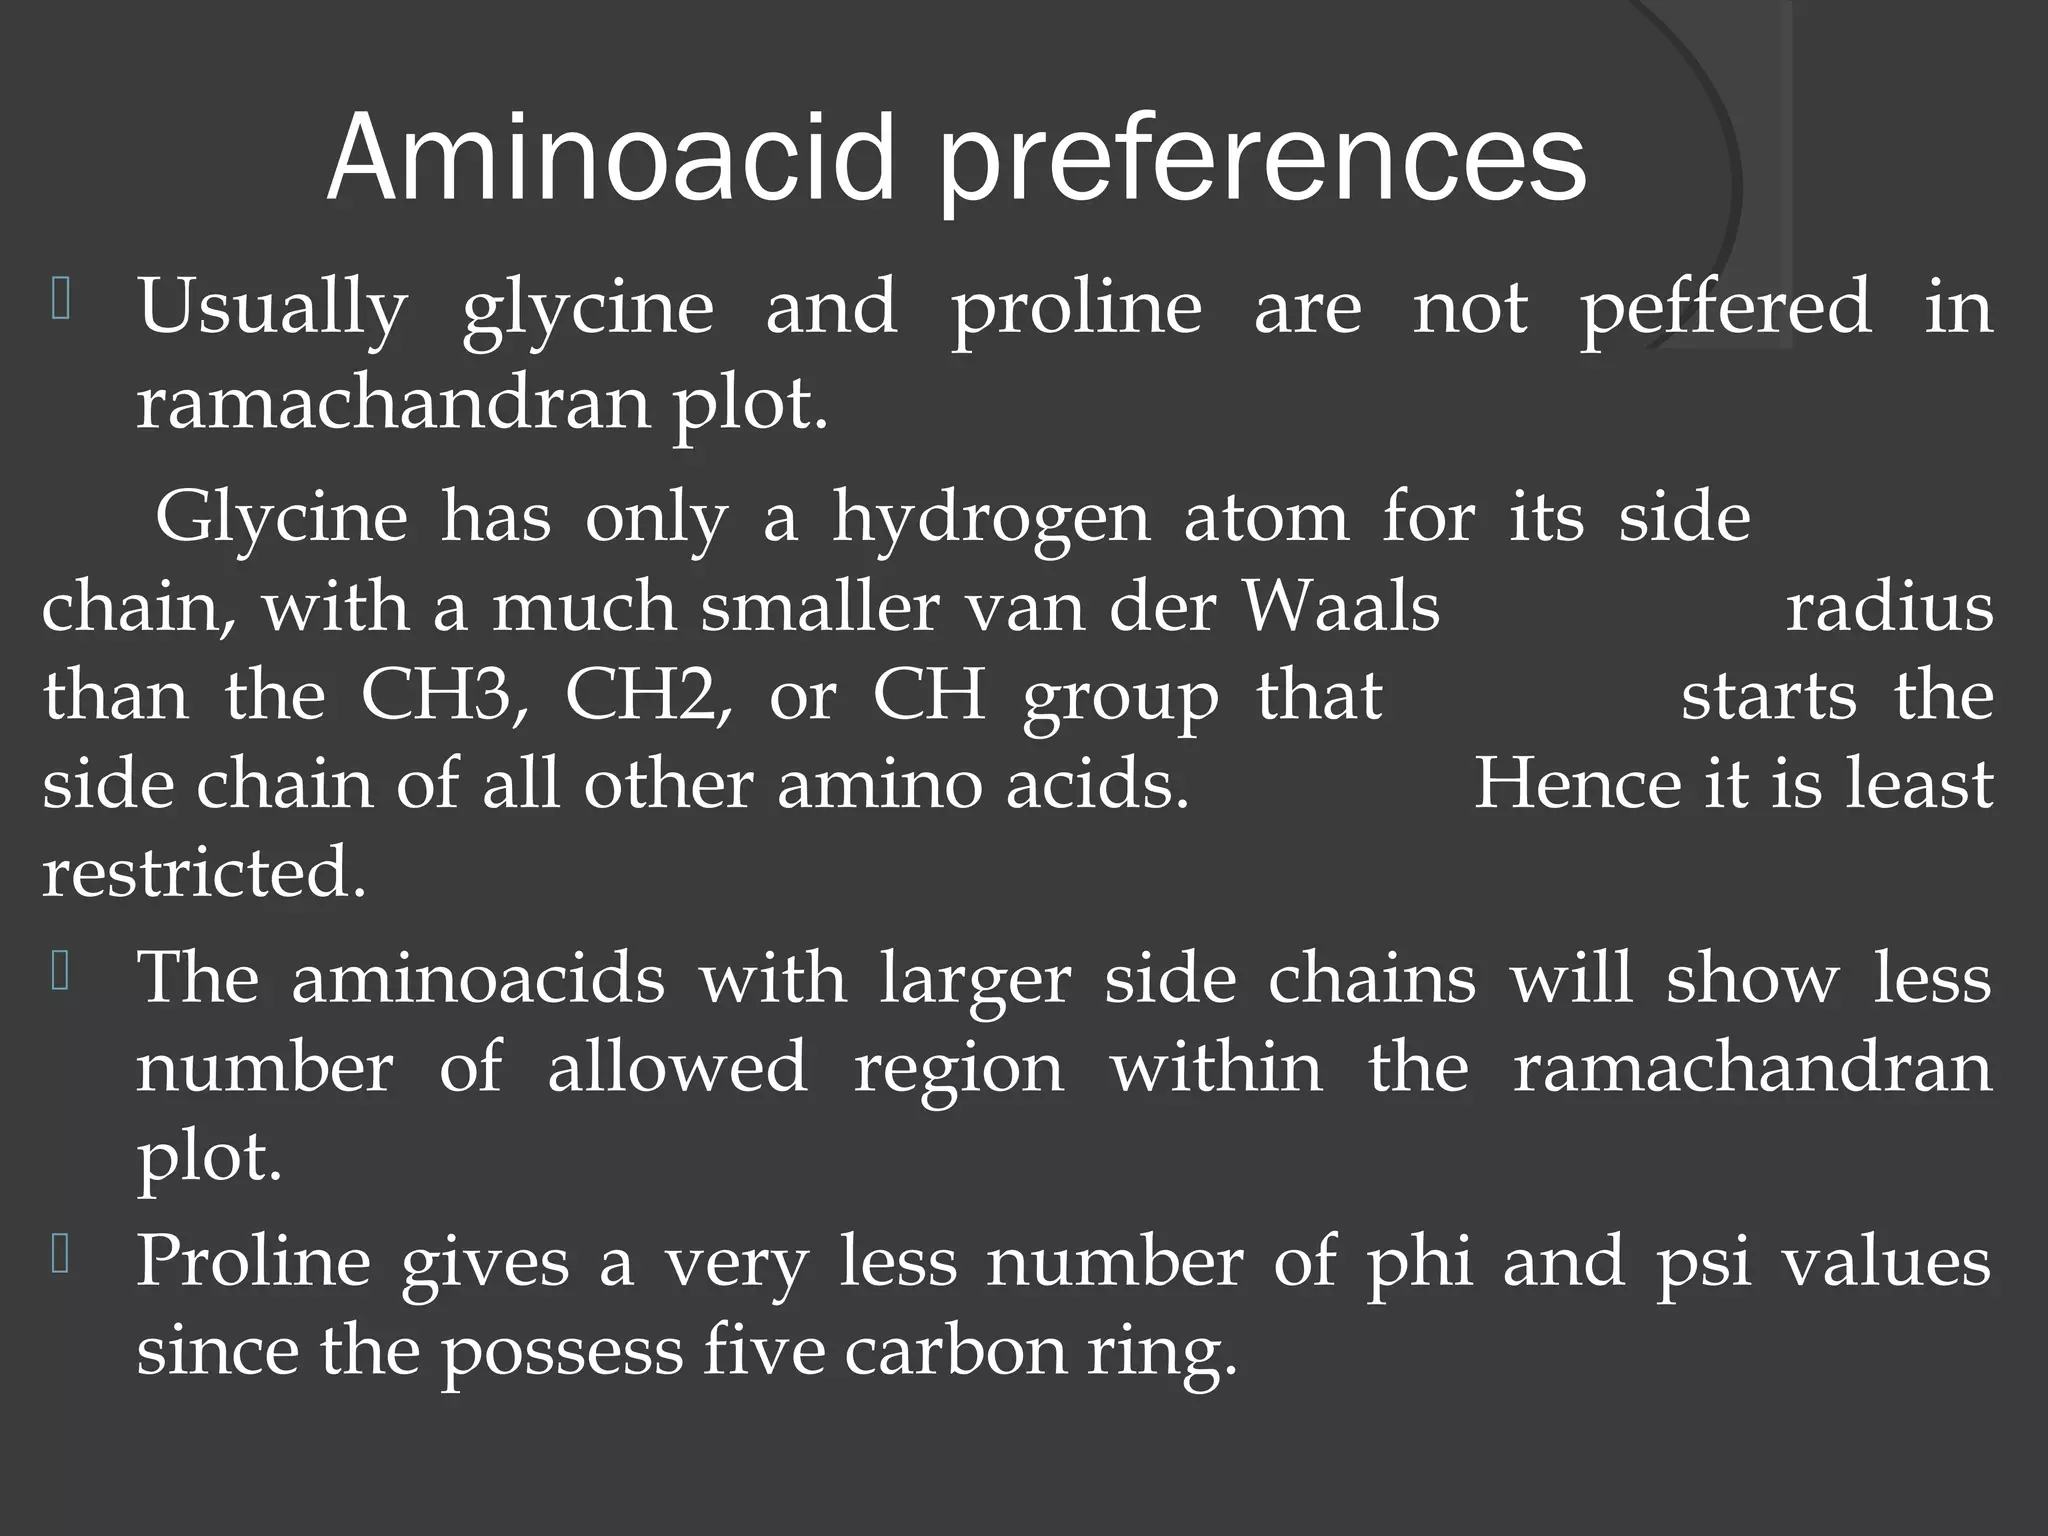
Presents phi-psi angles from 9,156 residues; identifies common structural patterns and amino acid preferences.
Describes theoretical use of phi-psi values and empirical distribution for structure validation.