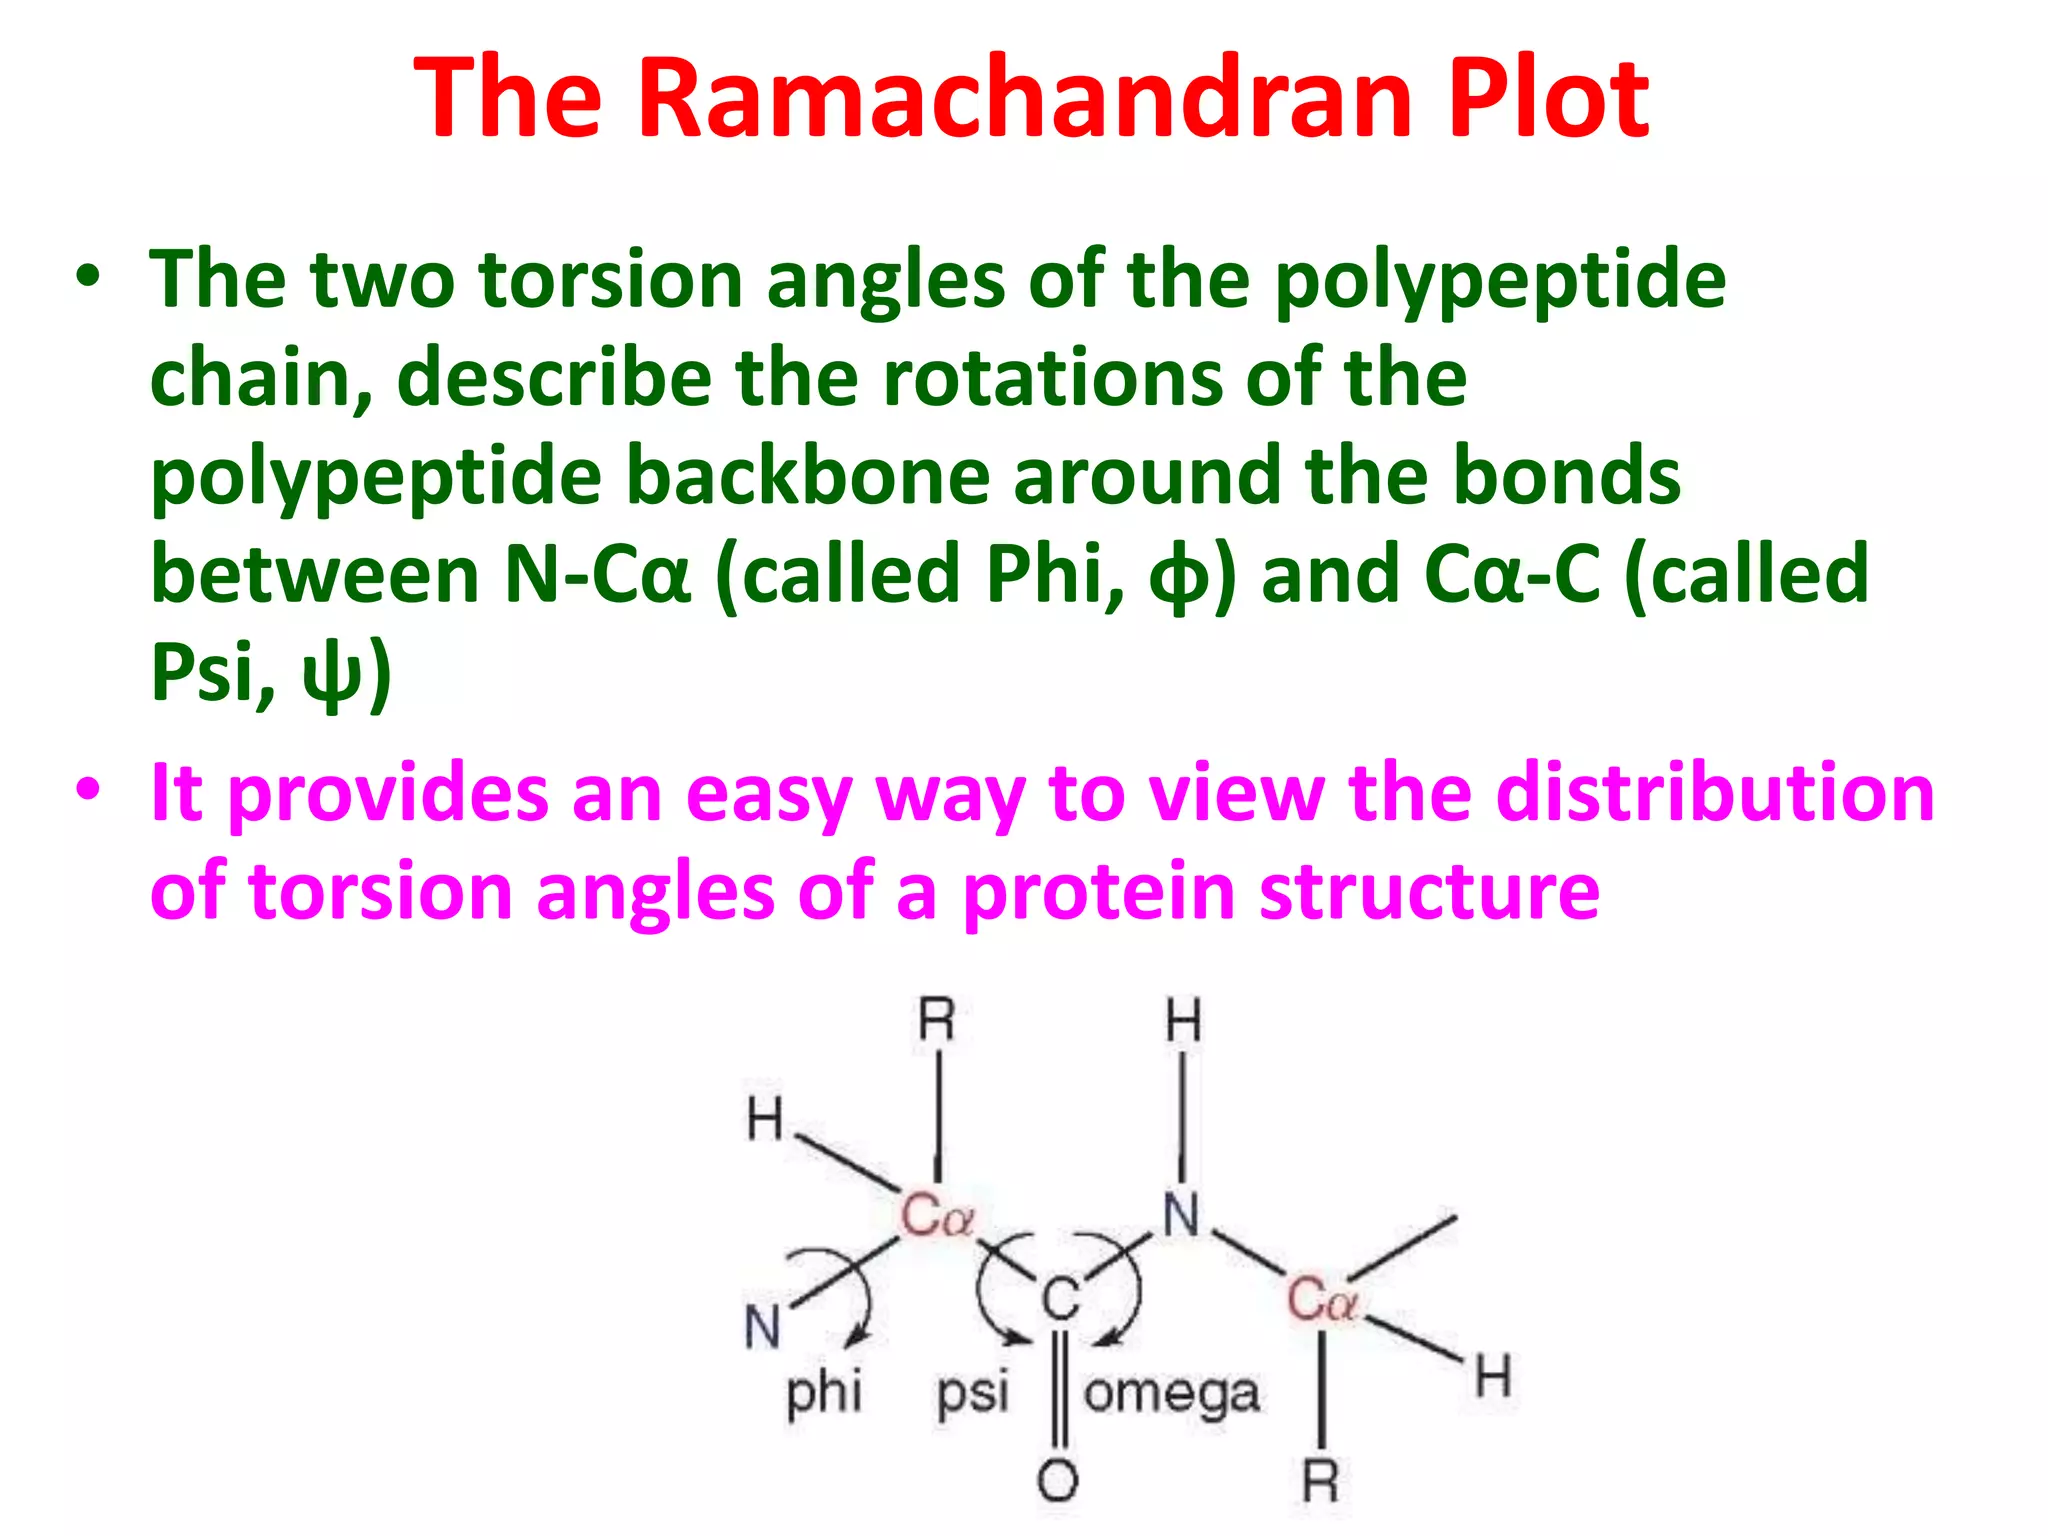
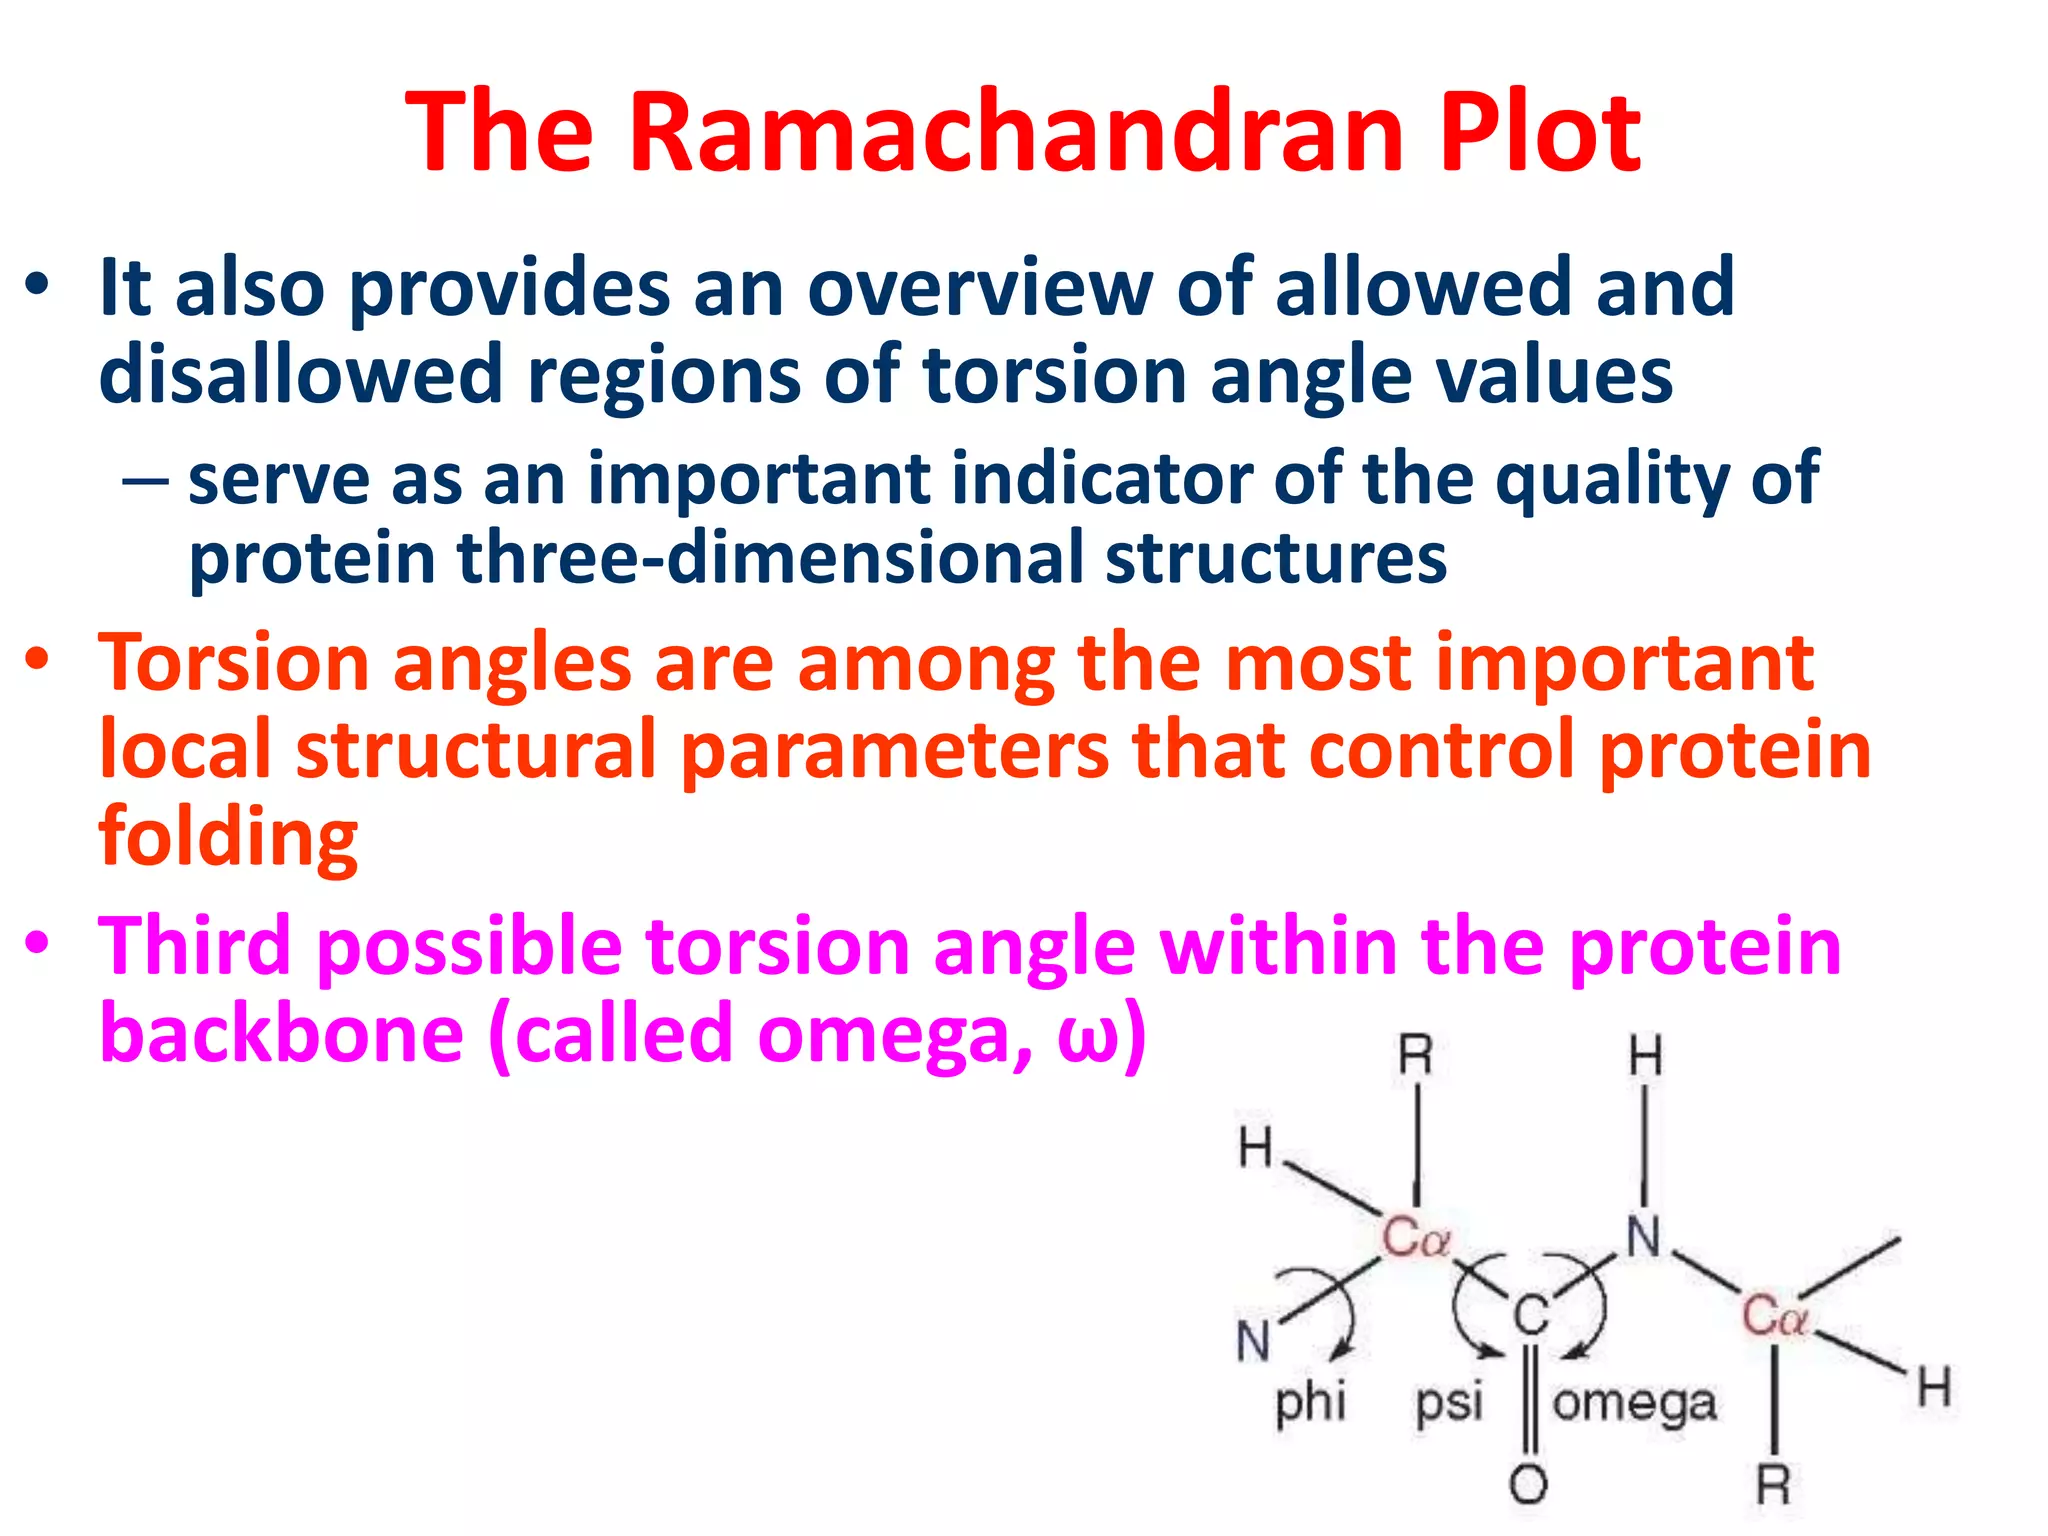
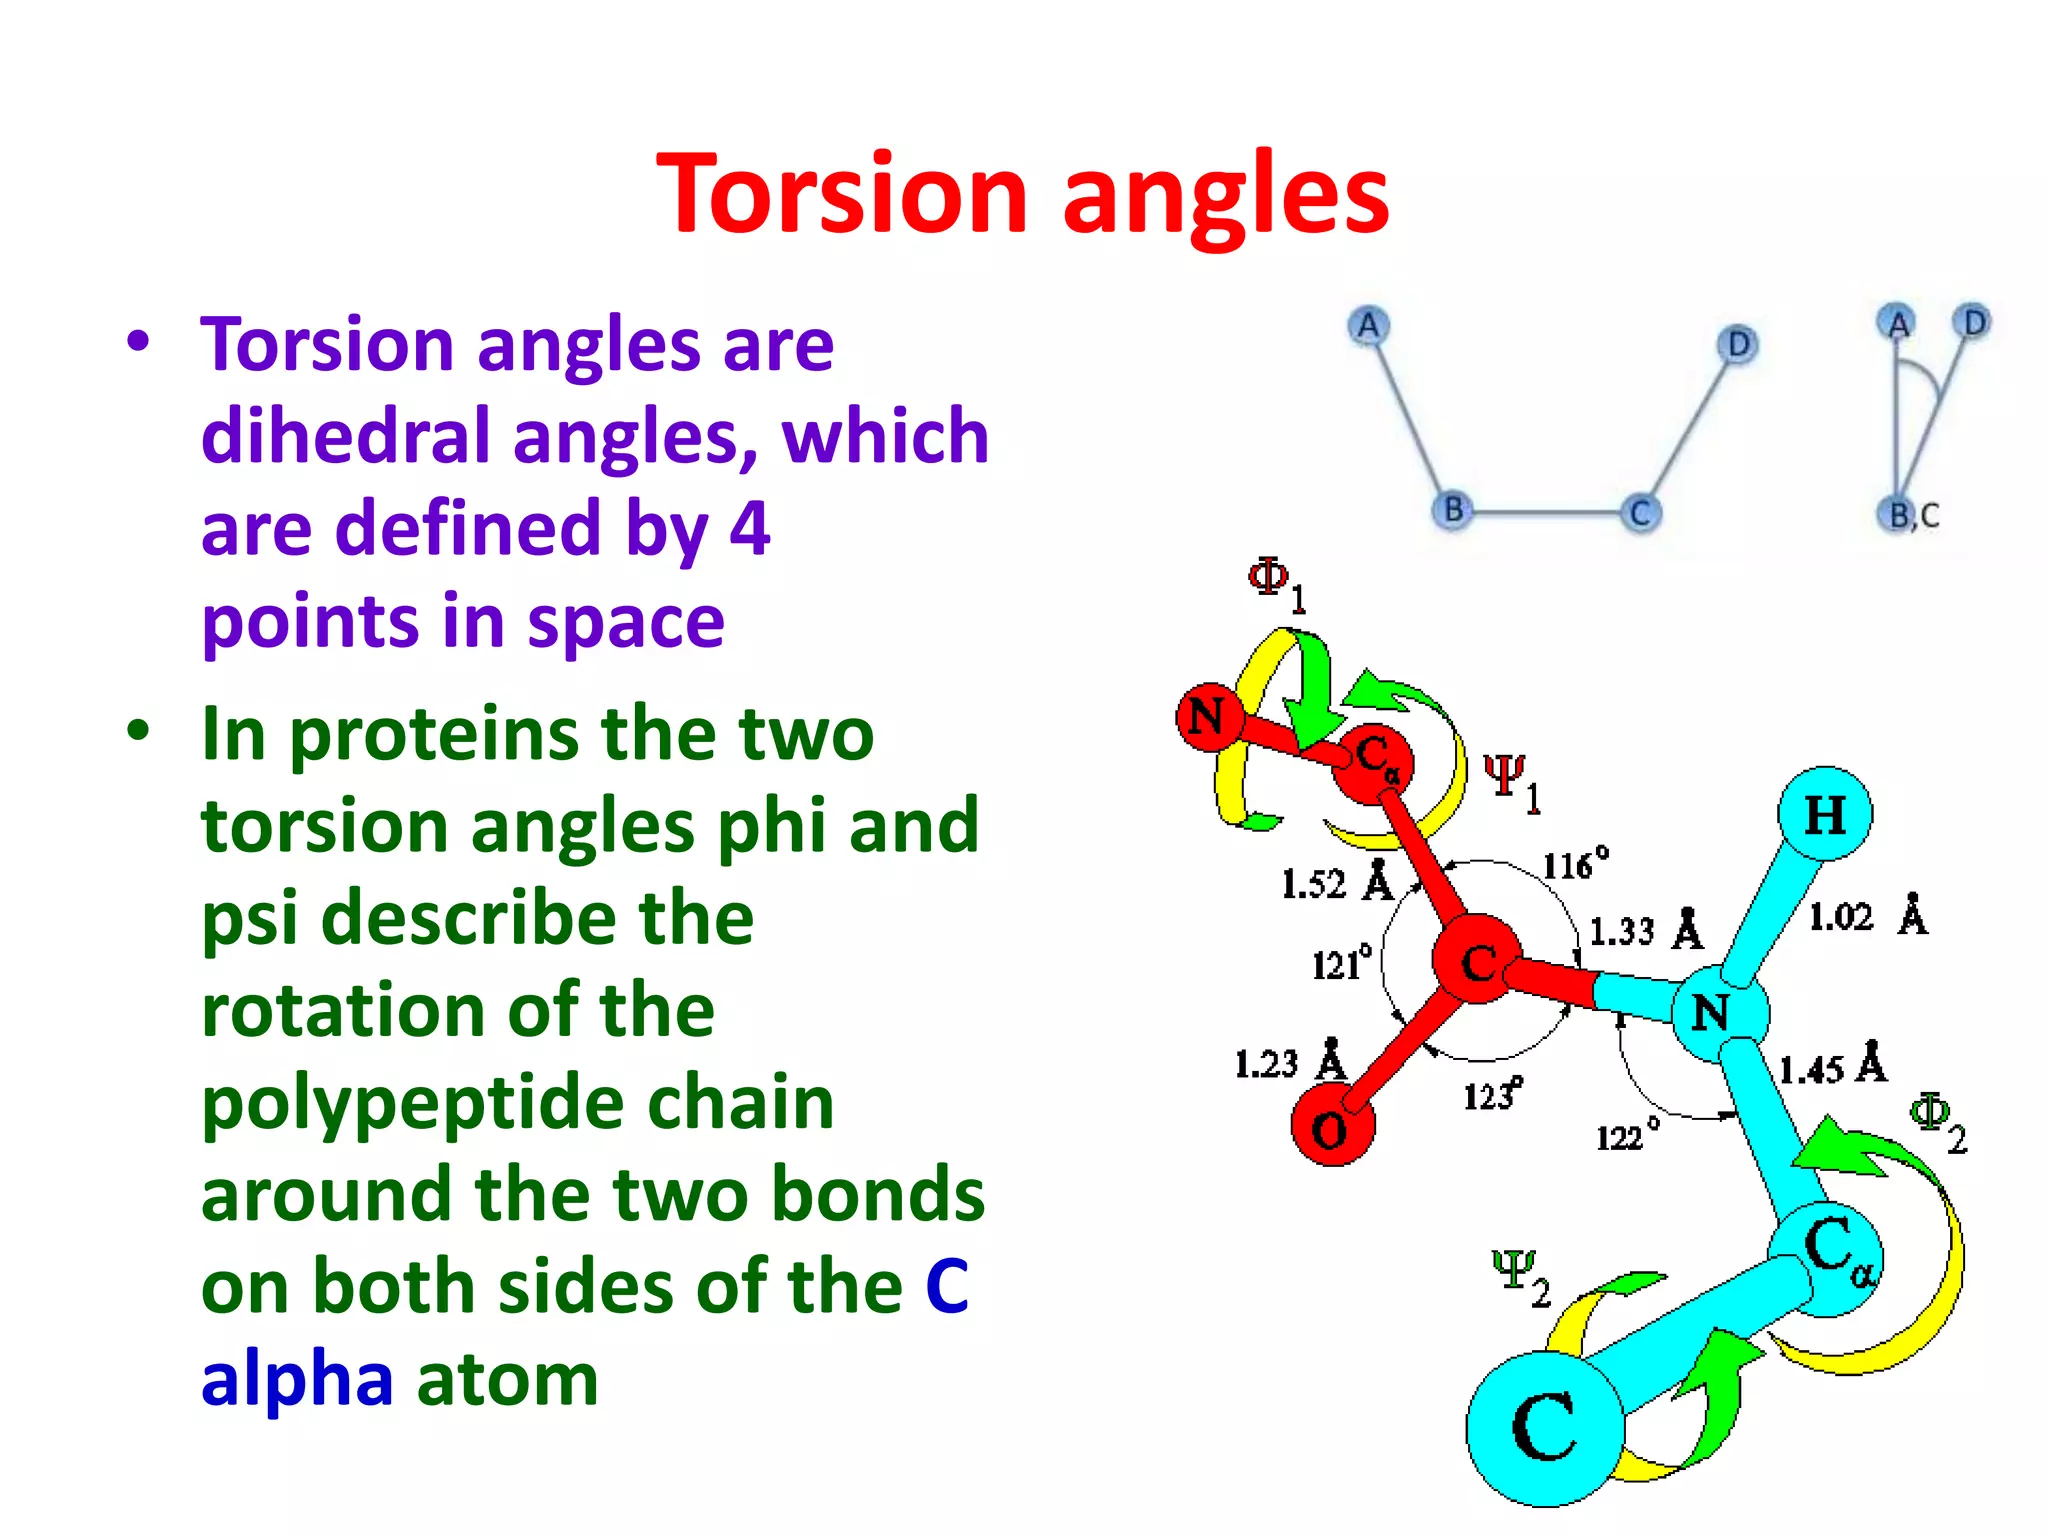
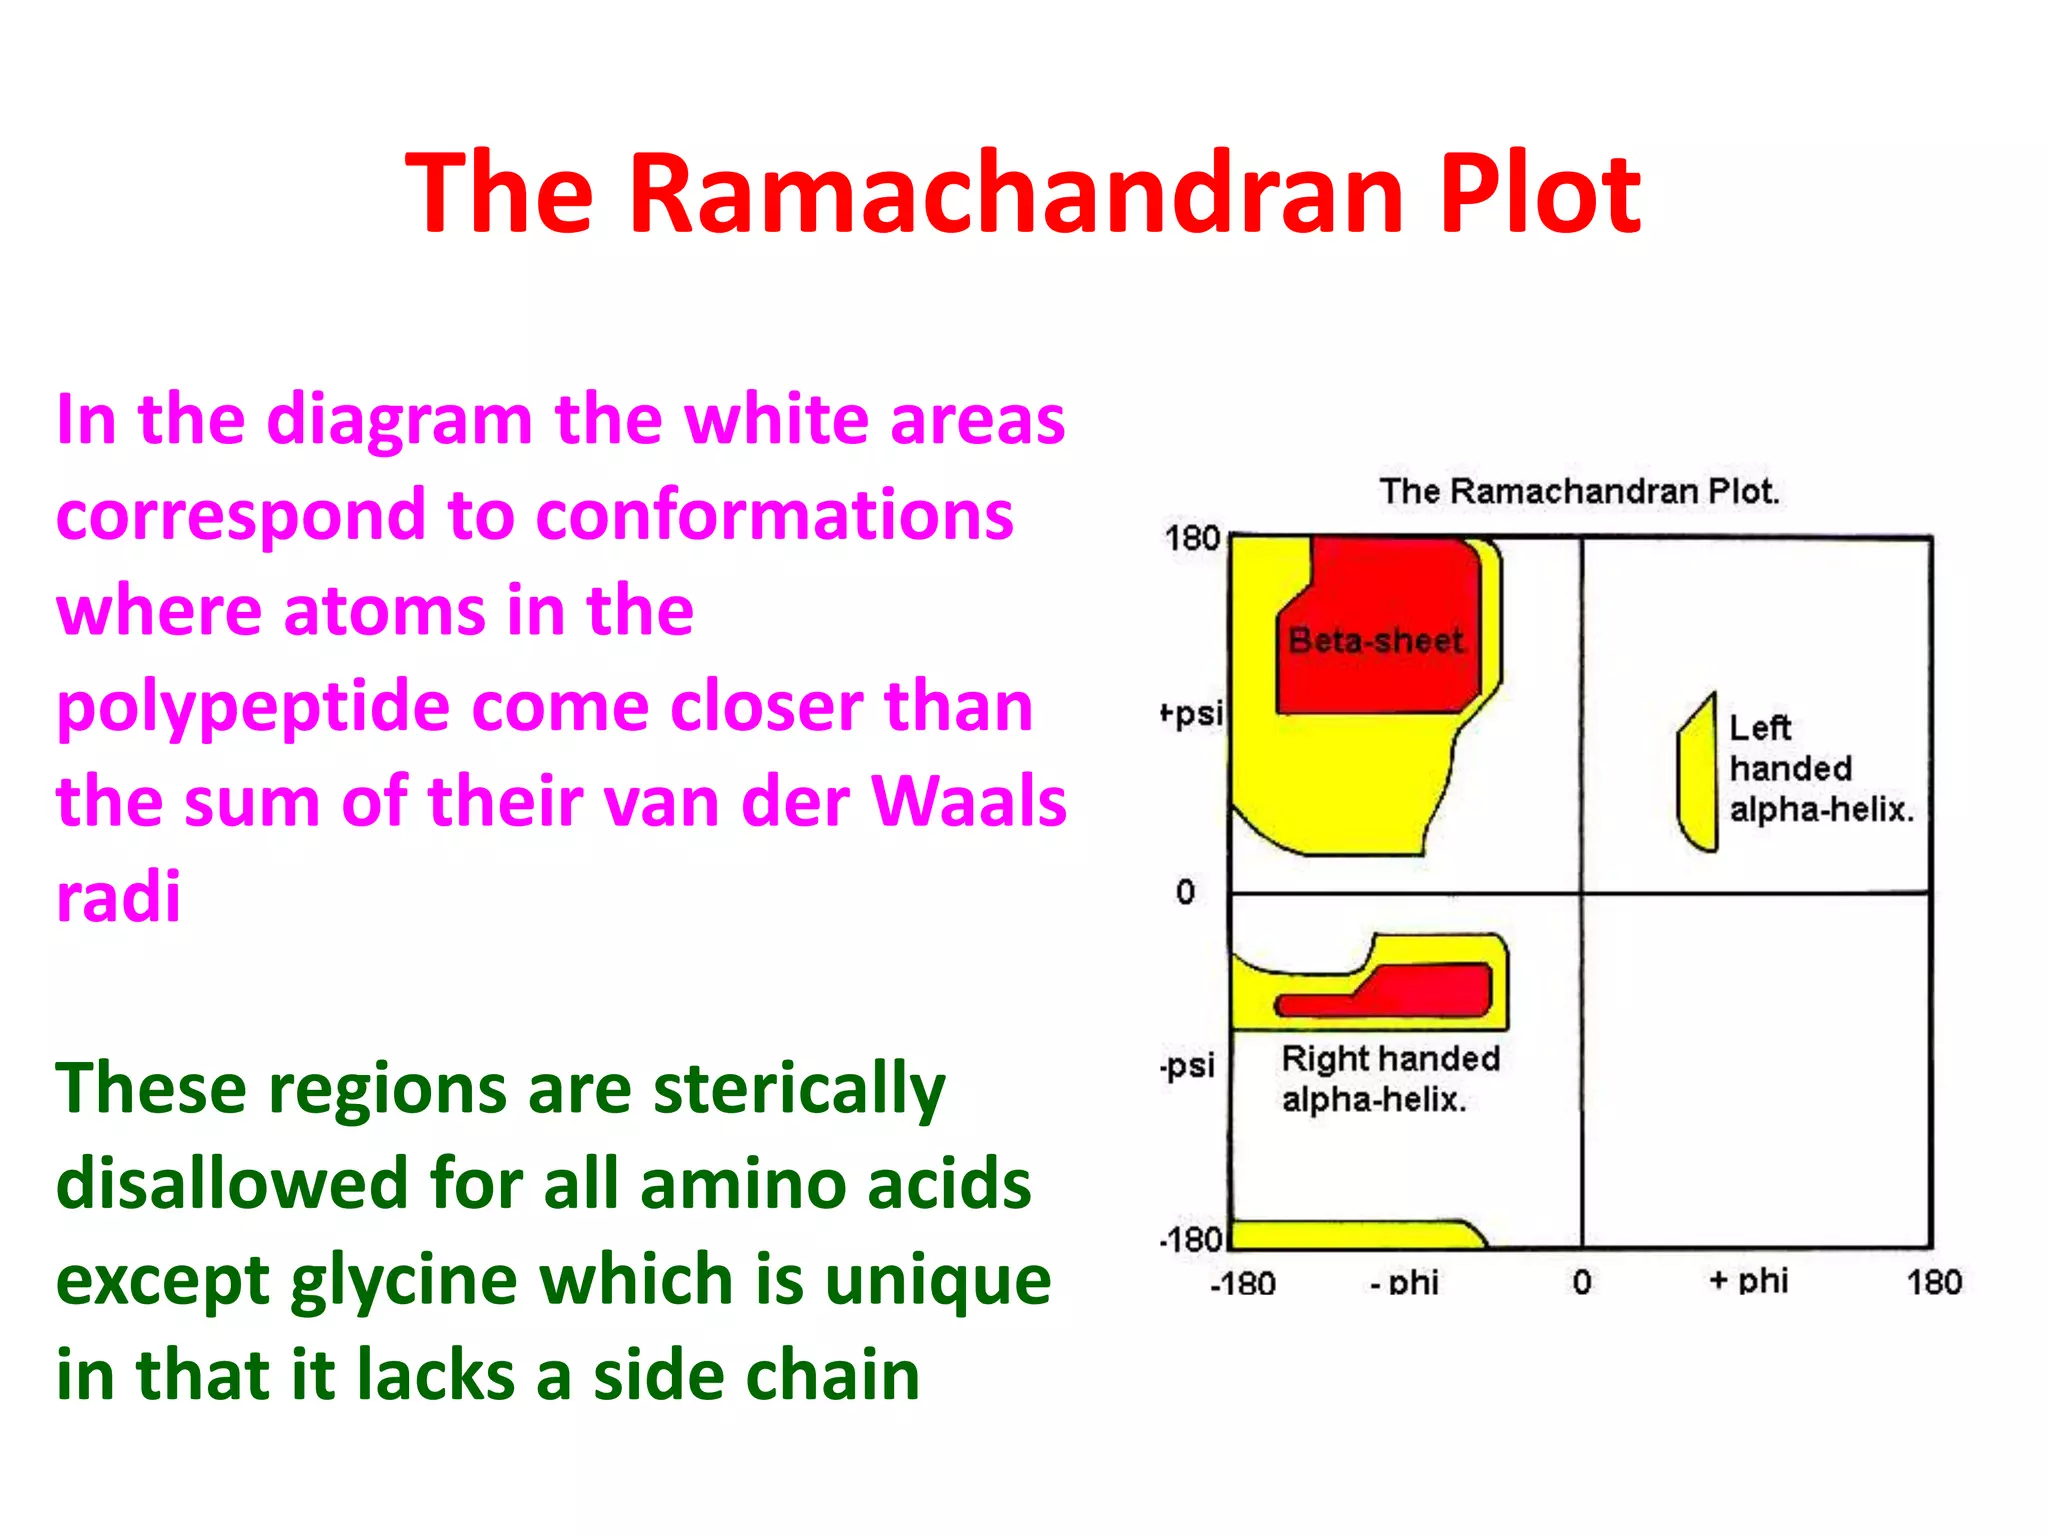
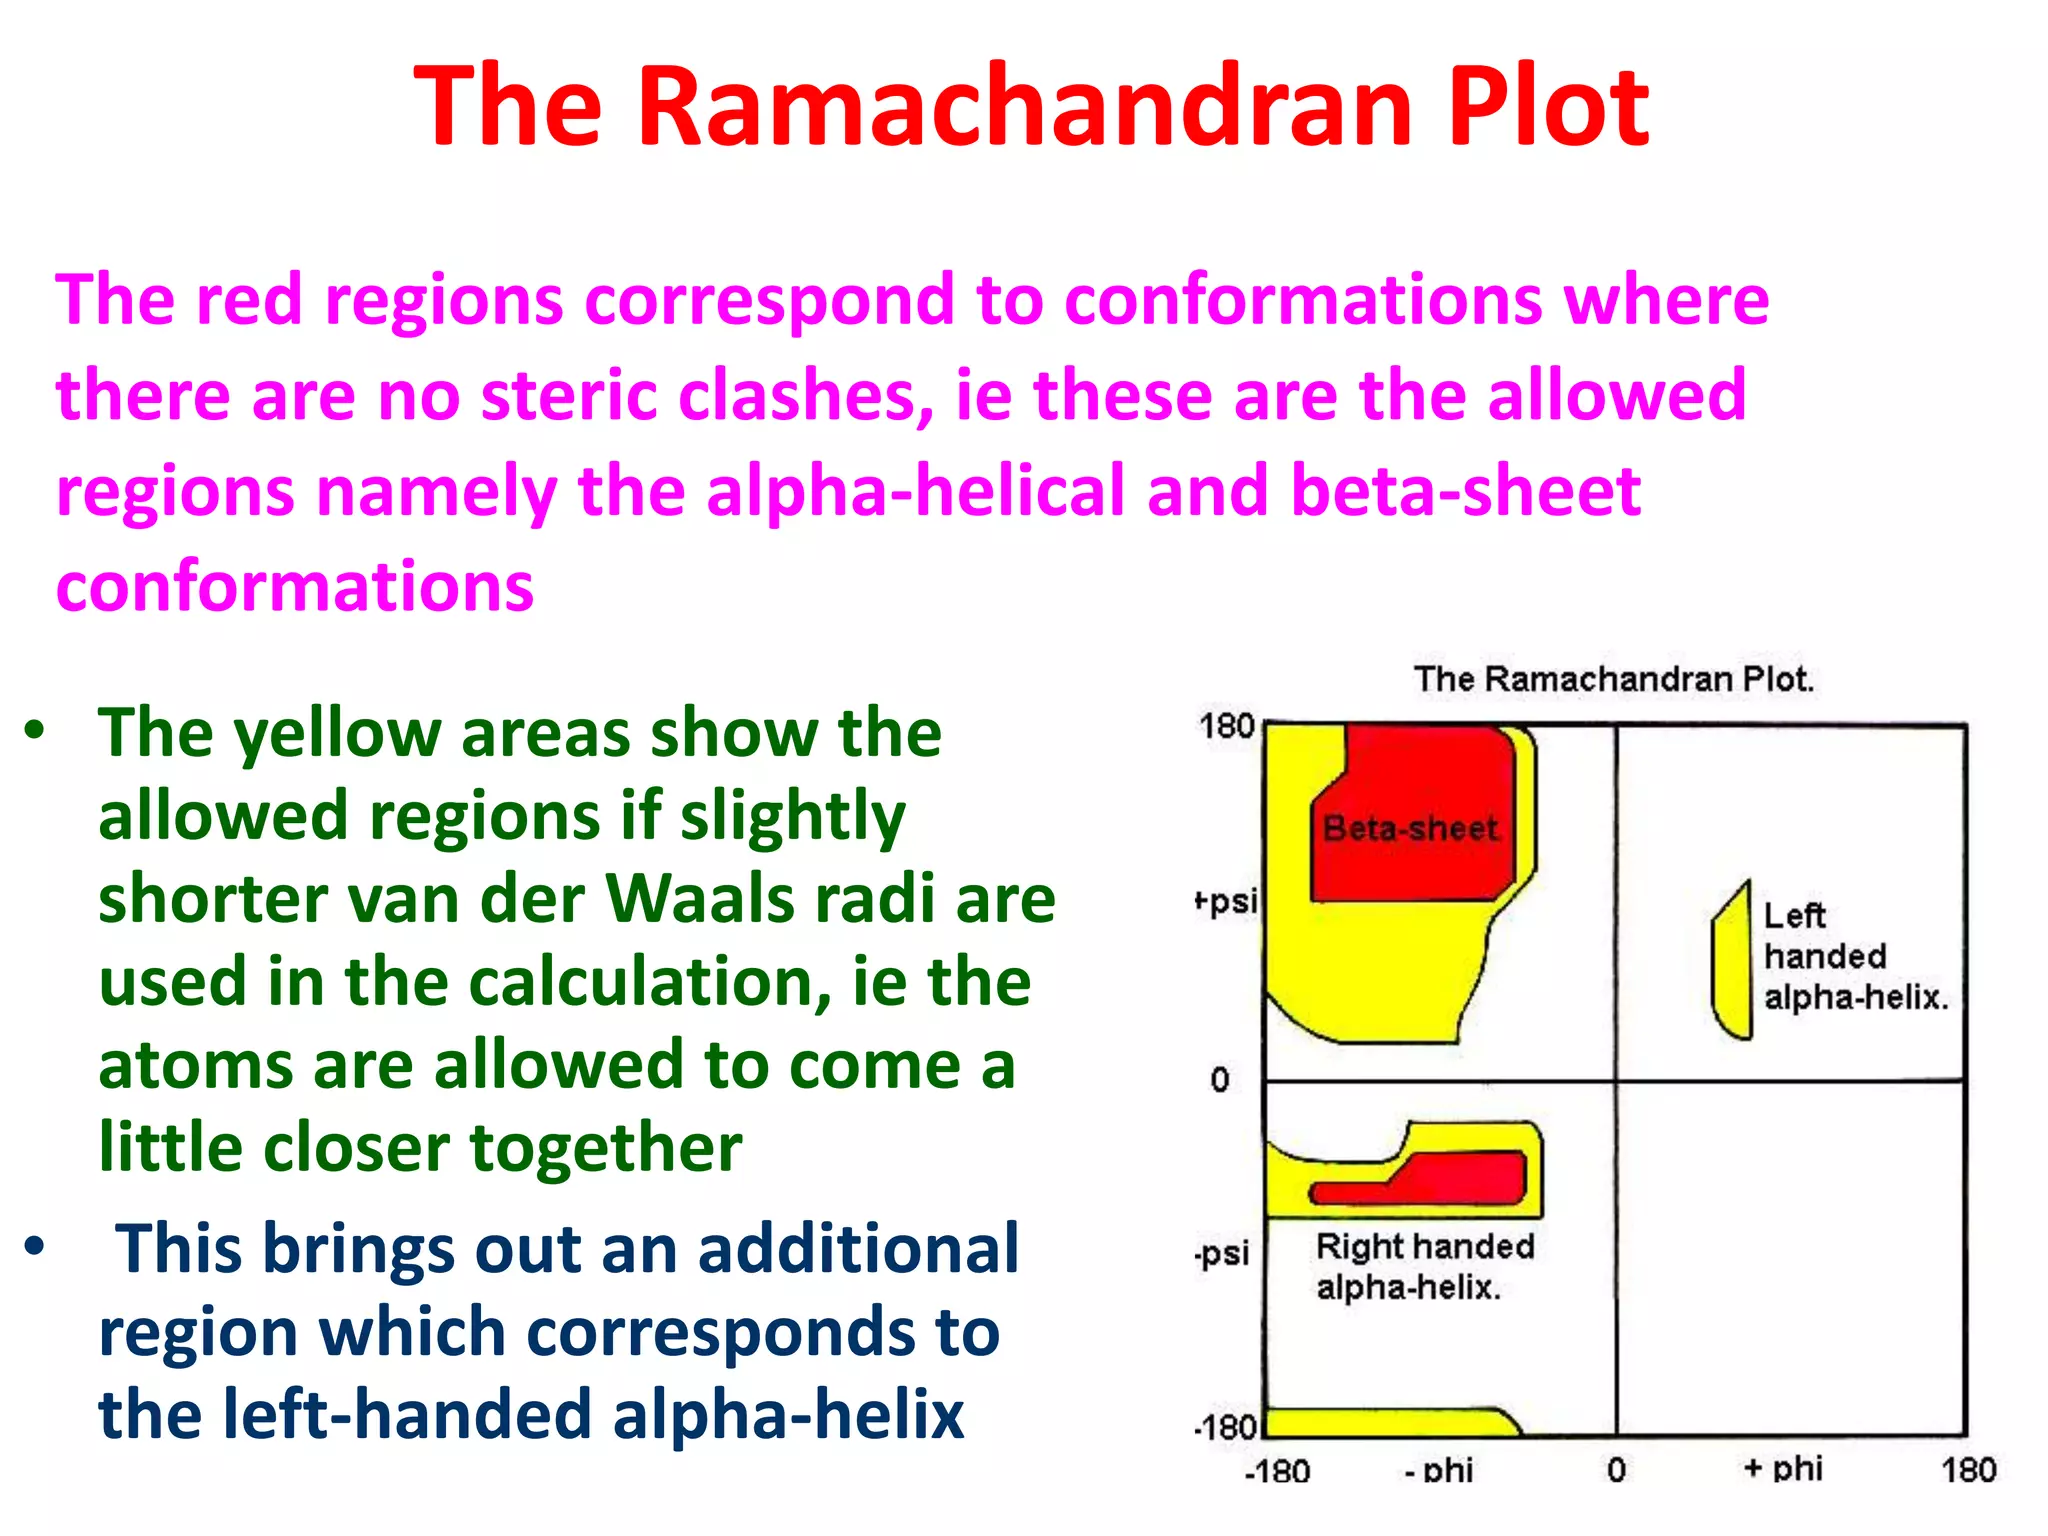
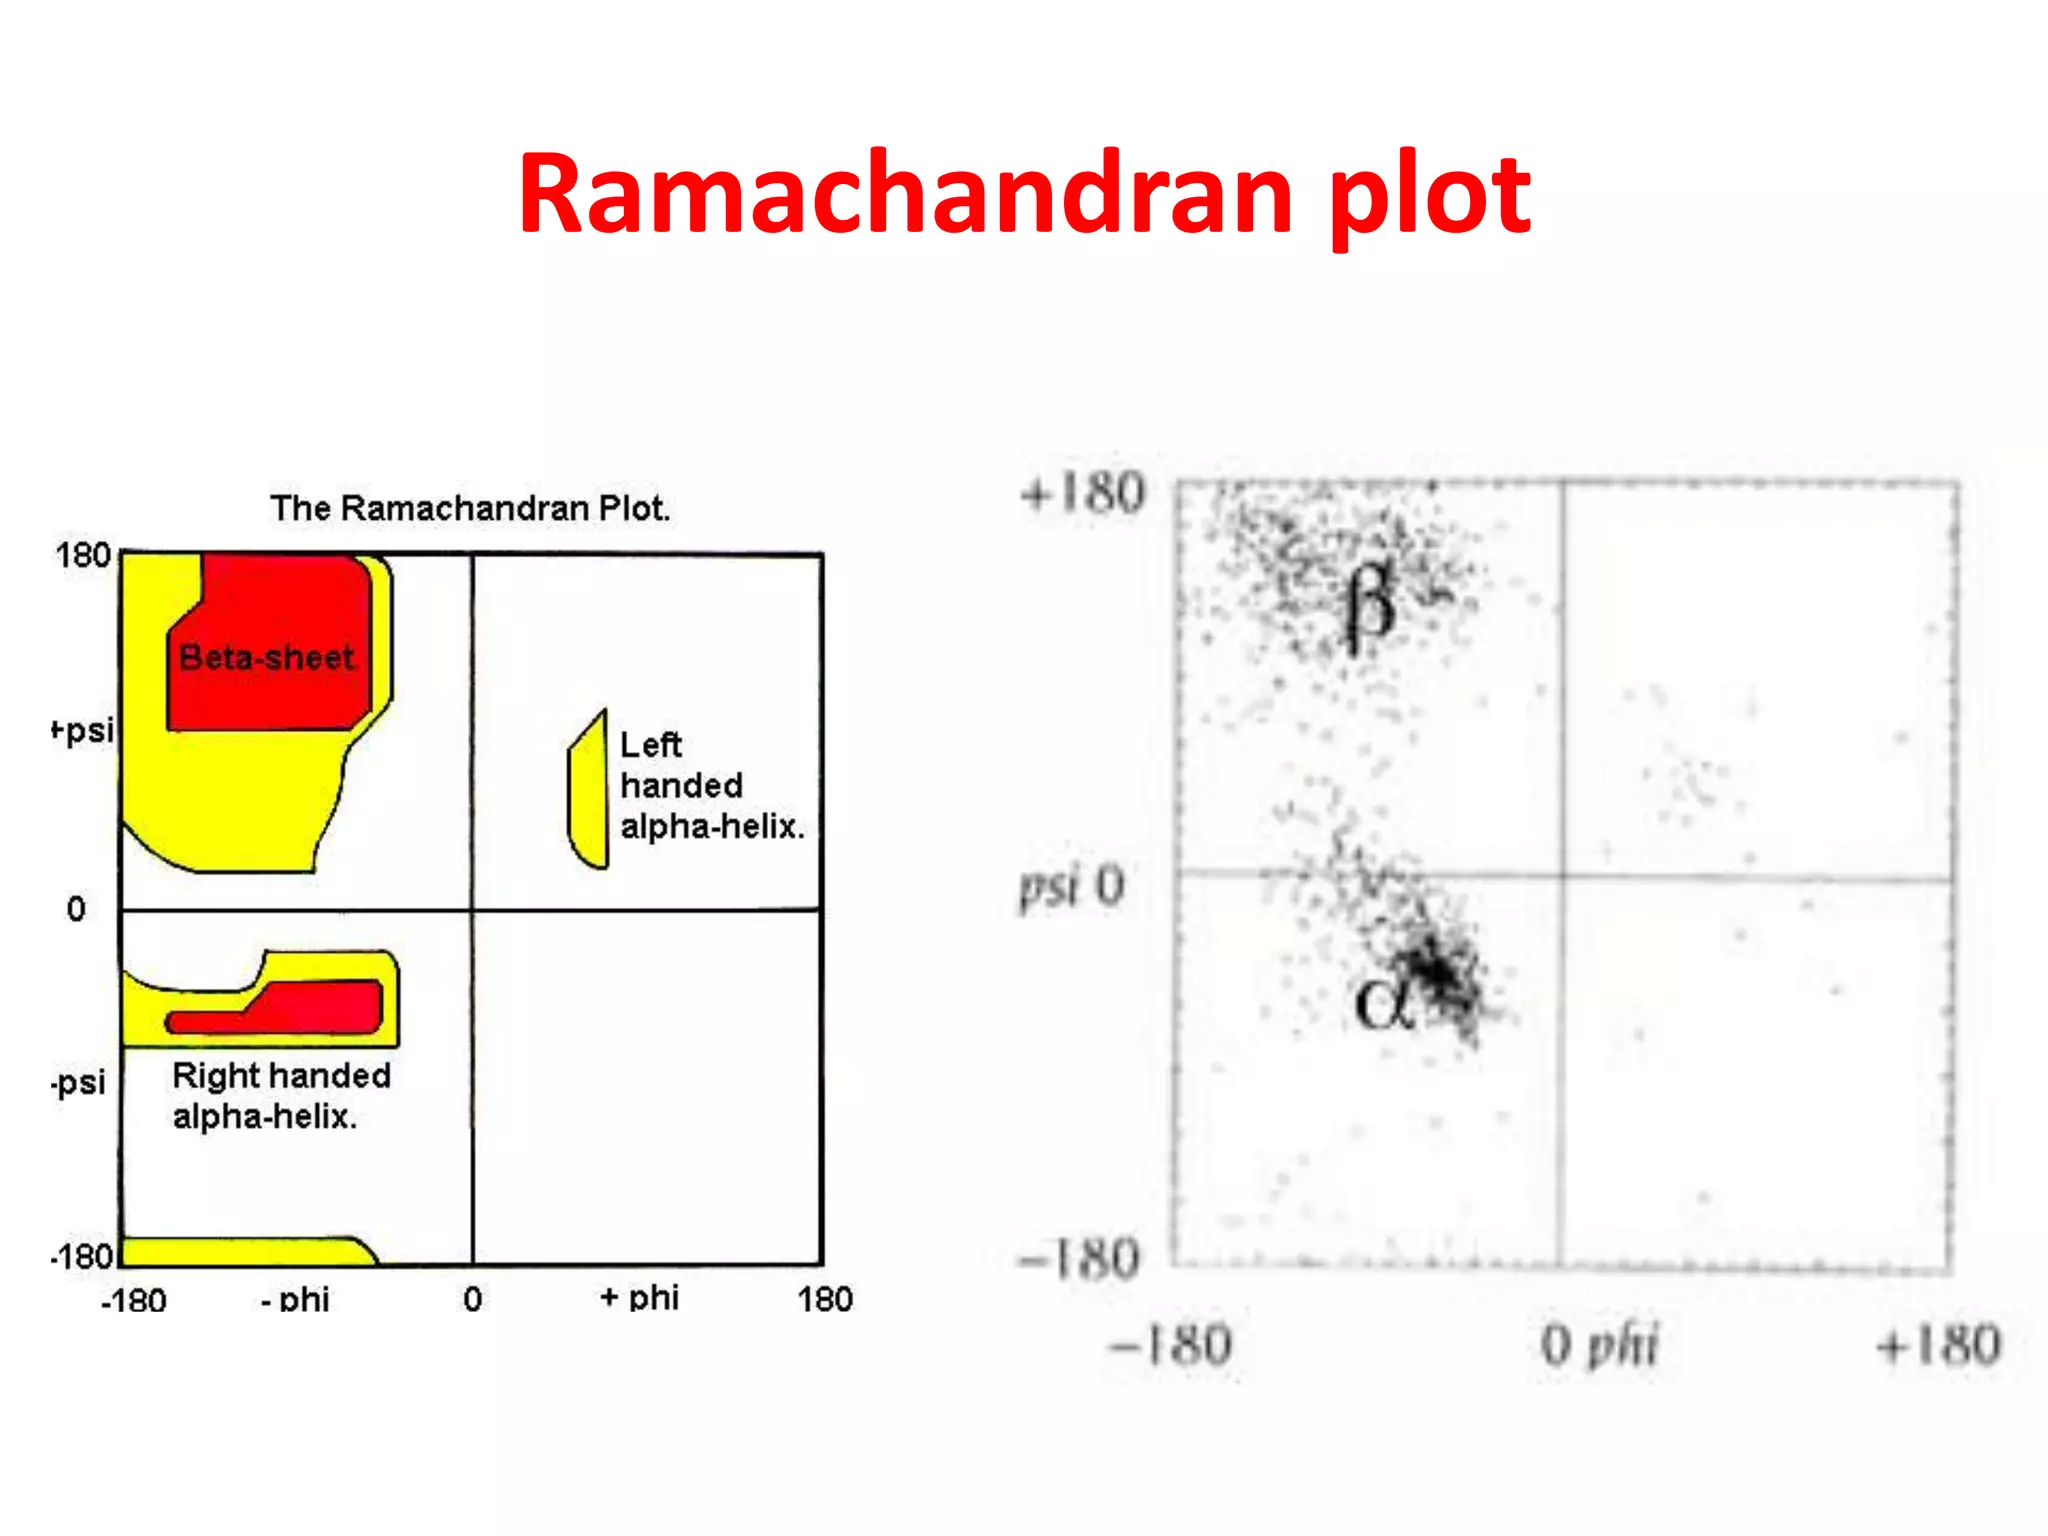
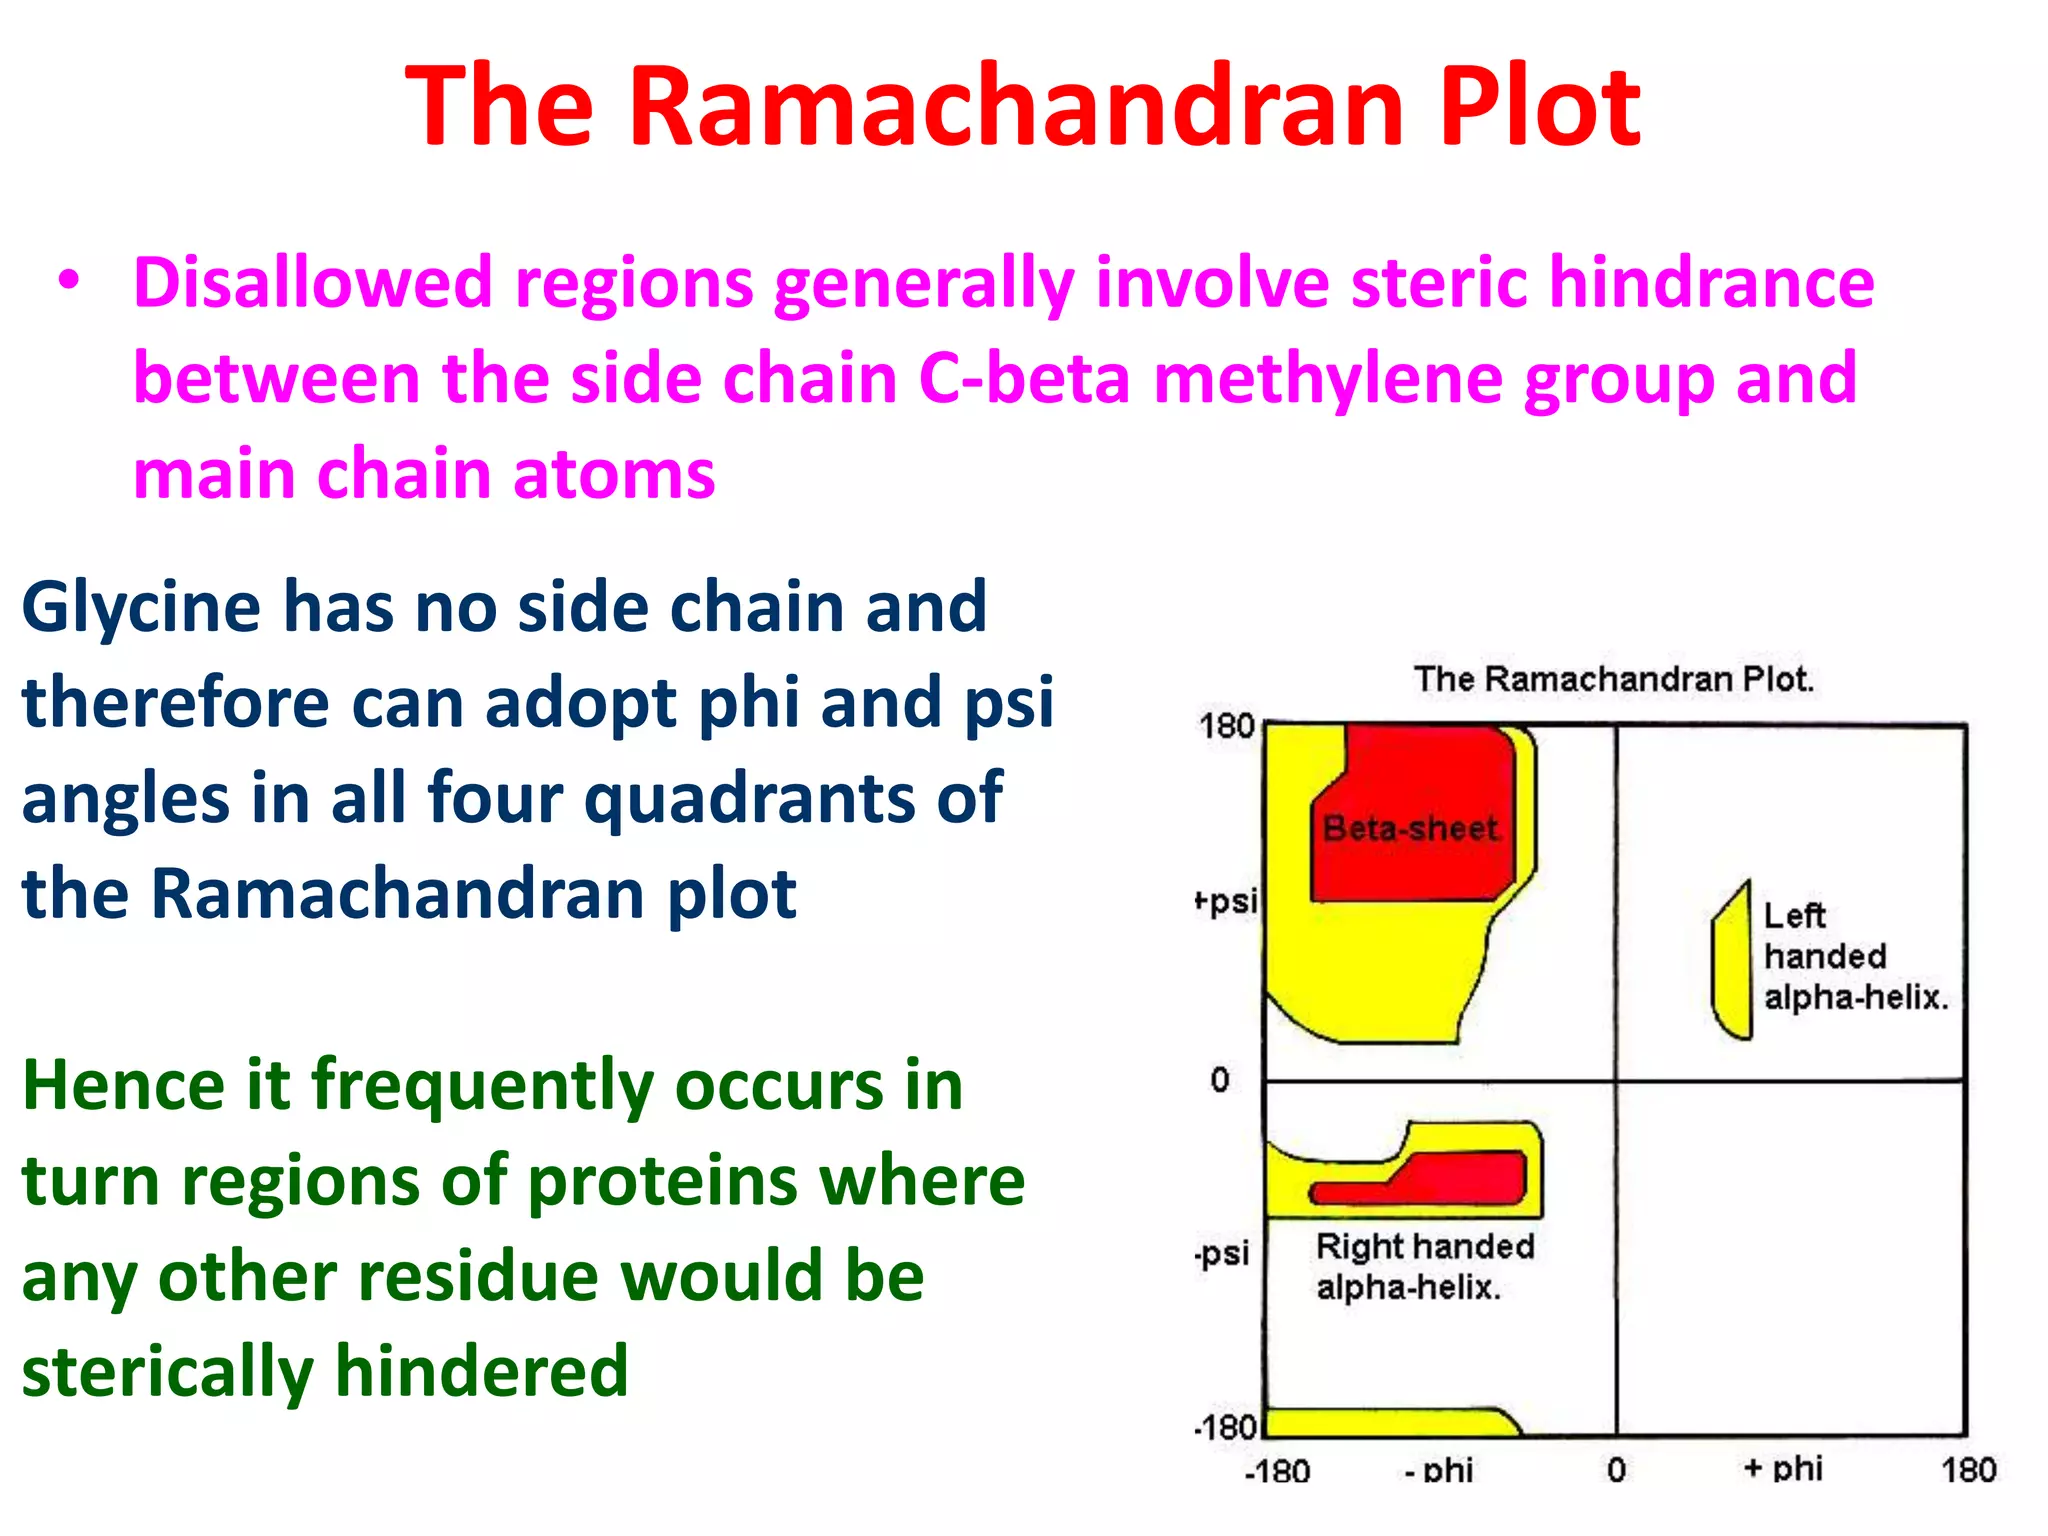
The Ramachandran Plot
Dr. Radhakrishna G Pillai
Department of Life Sciences
University of Calicut
The Ramachandran Plot
• The two torsion angles of the polypeptide
chain, describe the rotations of the
polypeptide backbone around the bonds
between N-Cα (called Phi, φ) and Cα-C (called
Psi, ψ)
• It provides an easy way to view the distribution
of torsion angles of a protein structure
The Ramachandran Plot
• It also provides an overview of allowed and
disallowed regions of torsion angle values
– serve as an important indicator of the quality of
protein three-dimensional structures
• Torsion angles are among the most important
local structural parameters that control protein
folding
• Third possible torsion angle within the protein
backbone (called omega, ω)
The Ramachandran Plot
• if we would have a way to predict the Ramachandran
angles for a particular protein, we would be able to predict
its 3D folding
• The reason is that these angles provide the flexibility
required for the polypeptide backbone to adopt a certain
fold, since ω is essentially flat and fixed to 180 degrees
– This is due to the partial double-bond character of the
peptide bond, which
– restricts rotation around the C-N bond, placing two
successive alpha-carbons and C, O, N and H between
them in one plane
– Thus, rotation of the protein chain can be described as
rotation of the peptide bond planes relative to each
other
Torsion angles
• Torsion angles are
dihedral angles, which
are defined by 4
points in space
• In proteins the two
torsion angles phi and
psi describe the
rotation of the
polypeptide chain
around the two bonds
on both sides of the C
alpha atom
Dihedral angle
• The standard IUPAC definition of a dihedral angle is
illustrated in the figure below
• A, B, C and D illustrate the position of the 4 atoms
used to define the dihedral angle
• The rotation takes place around the central B-C bond
• The view on the right is along the B-C bond with
atom A placed at 12 o'clock
• The rotation around the B-C bond is described by the
A-B-D angle shown of the right figure: Positive angles
correspond to clockwise rotation
Protein backbone
The psi angle is the angle
around the -CA-C- bond
The omega angle is the
angle around the -C-N-
bond (i.e. the peptide
bond)
The protein backbone can be described in terms of the phi,
psi and omega torsion angles of the bonds:
The phi angle is the angle around the -N-CA- bond (where
'CA' is the alpha-carbon)
The Ramachandran Plot
In a polypeptide the main chain N-Calpha and Calpha-C bonds
relatively are free to rotate. These rotations are represented by
the torsion angles phi and psi, respectively
• G N Ramachandran used computer models of small polypeptides
to systematically vary phi and psi with the objective of finding
stable conformations
• For each conformation, the structure was examined for close
contacts between atoms
• Atoms were treated as hard spheres with dimensions
corresponding to their van der Waals radii
• Therefore, phi and psi angles which cause spheres to collide
correspond to sterically disallowed conformations of the
polypeptide backbone
The Ramachandran Plot
In the diagram the white areas
correspond to conformations
where atoms in the
polypeptide come closer than
the sum of their van der Waals
radi
These regions are sterically
disallowed for all amino acids
except glycine which is unique
in that it lacks a side chain
The Ramachandran Plot
• The yellow areas show the
allowed regions if slightly
shorter van der Waals radi are
used in the calculation, ie the
atoms are allowed to come a
little closer together
• This brings out an additional
region which corresponds to
the left-handed alpha-helix
The red regions correspond to conformations where
there are no steric clashes, ie these are the allowed
regions namely the alpha-helical and beta-sheet
conformations
Ramachandran plot
The Ramachandran Plot
• L-amino acids cannot form extended regions of left-
handed helix
– but occassionally individual residues adopt this
conformation
– These residues are usually glycine but can also be
asparagine or aspartate where the side chain forms a
hydrogen bond with the main chain and therefore
stabilises this otherwise unfavourable conformation
– The 3(10) helix occurs close to the upper right of the
alpha-helical region and is on the edge of allowed region
indicating lower stability
310 helix
• A 310 helix is a type of secondary
structure
• found (often) in proteins and
polypeptides
• Top view of the same helix shown
to the right
• Three carbonyl groups are pointing
upwards towards the viewer
– spaced roughly 120° apart on the
circle
– corresponding to 3.0 amino-acid
residues per turn of the helix
The Ramachandran Plot
• Disallowed regions generally involve steric hindrance
between the side chain C-beta methylene group and
main chain atoms
Glycine has no side chain and
therefore can adopt phi and psi
angles in all four quadrants of
the Ramachandran plot
Hence it frequently occurs in
turn regions of proteins where
any other residue would be
sterically hindered

Ramachandran plot

  • 1.
    The Ramachandran Plot Dr.Radhakrishna G Pillai Department of Life Sciences University of Calicut
  • 2.
    The Ramachandran Plot •The two torsion angles of the polypeptide chain, describe the rotations of the polypeptide backbone around the bonds between N-Cα (called Phi, φ) and Cα-C (called Psi, ψ) • It provides an easy way to view the distribution of torsion angles of a protein structure
  • 3.
    The Ramachandran Plot •It also provides an overview of allowed and disallowed regions of torsion angle values – serve as an important indicator of the quality of protein three-dimensional structures • Torsion angles are among the most important local structural parameters that control protein folding • Third possible torsion angle within the protein backbone (called omega, ω)
  • 4.
    The Ramachandran Plot •if we would have a way to predict the Ramachandran angles for a particular protein, we would be able to predict its 3D folding • The reason is that these angles provide the flexibility required for the polypeptide backbone to adopt a certain fold, since ω is essentially flat and fixed to 180 degrees – This is due to the partial double-bond character of the peptide bond, which – restricts rotation around the C-N bond, placing two successive alpha-carbons and C, O, N and H between them in one plane – Thus, rotation of the protein chain can be described as rotation of the peptide bond planes relative to each other
  • 5.
    Torsion angles • Torsionangles are dihedral angles, which are defined by 4 points in space • In proteins the two torsion angles phi and psi describe the rotation of the polypeptide chain around the two bonds on both sides of the C alpha atom
  • 6.
    Dihedral angle • Thestandard IUPAC definition of a dihedral angle is illustrated in the figure below • A, B, C and D illustrate the position of the 4 atoms used to define the dihedral angle • The rotation takes place around the central B-C bond • The view on the right is along the B-C bond with atom A placed at 12 o'clock • The rotation around the B-C bond is described by the A-B-D angle shown of the right figure: Positive angles correspond to clockwise rotation
  • 7.
    Protein backbone The psiangle is the angle around the -CA-C- bond The omega angle is the angle around the -C-N- bond (i.e. the peptide bond) The protein backbone can be described in terms of the phi, psi and omega torsion angles of the bonds: The phi angle is the angle around the -N-CA- bond (where 'CA' is the alpha-carbon)
  • 8.
    The Ramachandran Plot Ina polypeptide the main chain N-Calpha and Calpha-C bonds relatively are free to rotate. These rotations are represented by the torsion angles phi and psi, respectively • G N Ramachandran used computer models of small polypeptides to systematically vary phi and psi with the objective of finding stable conformations • For each conformation, the structure was examined for close contacts between atoms • Atoms were treated as hard spheres with dimensions corresponding to their van der Waals radii • Therefore, phi and psi angles which cause spheres to collide correspond to sterically disallowed conformations of the polypeptide backbone
  • 9.
    The Ramachandran Plot Inthe diagram the white areas correspond to conformations where atoms in the polypeptide come closer than the sum of their van der Waals radi These regions are sterically disallowed for all amino acids except glycine which is unique in that it lacks a side chain
  • 10.
    The Ramachandran Plot •The yellow areas show the allowed regions if slightly shorter van der Waals radi are used in the calculation, ie the atoms are allowed to come a little closer together • This brings out an additional region which corresponds to the left-handed alpha-helix The red regions correspond to conformations where there are no steric clashes, ie these are the allowed regions namely the alpha-helical and beta-sheet conformations
  • 11.
  • 12.
    The Ramachandran Plot •L-amino acids cannot form extended regions of left- handed helix – but occassionally individual residues adopt this conformation – These residues are usually glycine but can also be asparagine or aspartate where the side chain forms a hydrogen bond with the main chain and therefore stabilises this otherwise unfavourable conformation – The 3(10) helix occurs close to the upper right of the alpha-helical region and is on the edge of allowed region indicating lower stability
  • 13.
    310 helix • A310 helix is a type of secondary structure • found (often) in proteins and polypeptides • Top view of the same helix shown to the right • Three carbonyl groups are pointing upwards towards the viewer – spaced roughly 120° apart on the circle – corresponding to 3.0 amino-acid residues per turn of the helix
  • 14.
    The Ramachandran Plot •Disallowed regions generally involve steric hindrance between the side chain C-beta methylene group and main chain atoms Glycine has no side chain and therefore can adopt phi and psi angles in all four quadrants of the Ramachandran plot Hence it frequently occurs in turn regions of proteins where any other residue would be sterically hindered

Editor's Notes

  • #3 Ramachandran angles -after the Indian physicist who first introduced the Ramachandran plot, (RAMACHANDRAN GN, RAMAKRISHNAN C, SASISEKHARAN V., J Mol Biol., 7:95-99)
  • #6 A dihedral angle is the angle between two intersecting planes. In chemistry it is theangle between planes through two sets of three atoms, having two atoms in common. In solid geometry it is defined as the union of a line and two half-planes that have this line as a common edge.