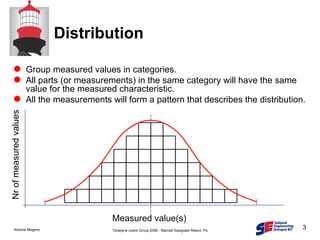
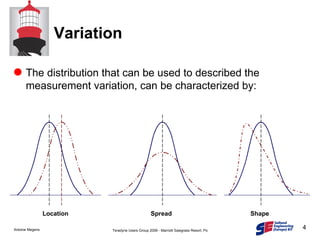
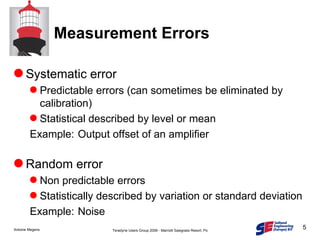
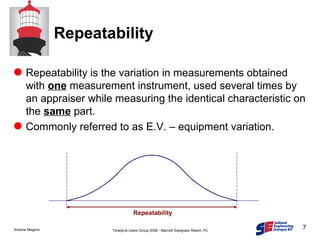
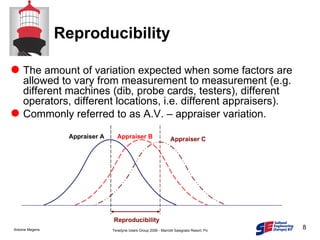
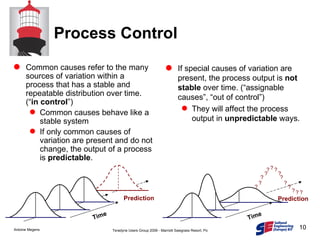
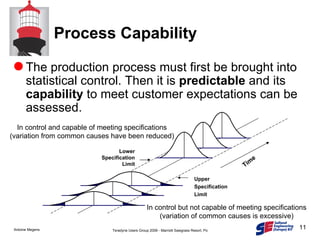
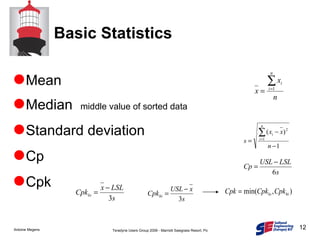
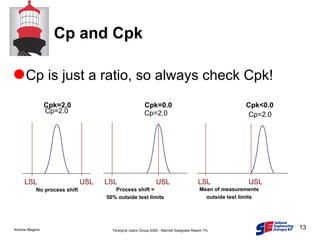
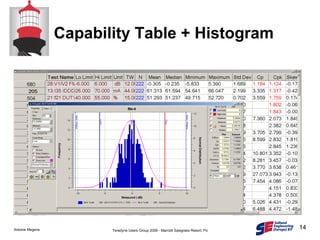
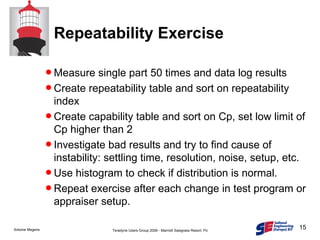
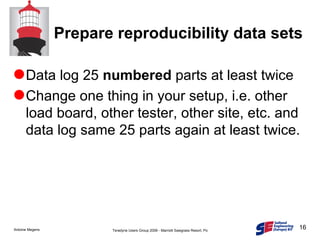
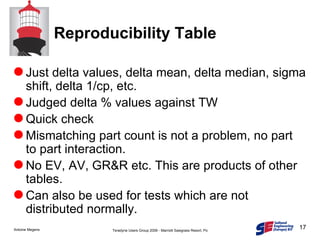
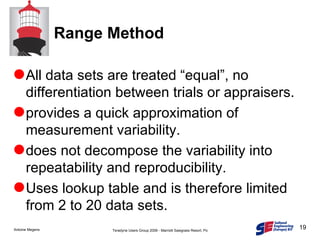
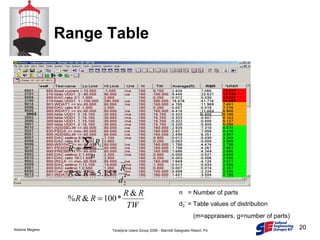
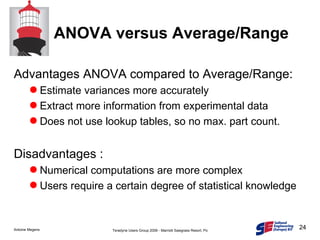
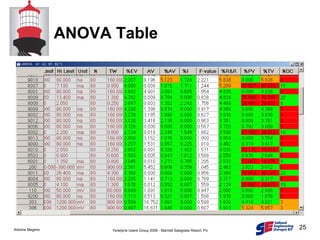
R&R Investigation Using Standard Data Analysis Tools   Antoine Megens, Salland Engineering [email_address]
Contents Distribution and Variation Measurement Errors Process Control and Capability Basic Statistics Repeatability Reproducibility Range Method Average/Range Method ANOVA Method
Distribution Group measured values in categories.  All parts (or measurements) in the same category will have the same value for the measured characteristic. All the measurements will form a pattern that describes the distribution. Measured value(s) Nr of measured values
Variation The distribution that can be used to described the measurement variation, can be characterized by: Location Spread Shape
Measurement Errors Systematic error Predictable errors (can sometimes be eliminated by calibration) Statistical described by level or mean Example: Output offset of an amplifier Random error Non predictable errors Statistically described by variation or standard deviation Example: Noise
Measurement errors are often dependent on: Time Instruments Range We can generally classify measurement errors in: Measurement Errors (cont’d) Bias Stability Linearity Repeatability Reproducibility GRR or Gage R&R
Repeatability Repeatability is the variation in measurements obtained with  one  measurement instrument, used several times by an appraiser while measuring the identical characteristic on the  same  part. Commonly referred to as E.V. – equipment variation. Repeatability
Reproducibility The amount of variation expected when some factors are allowed to vary from measurement to measurement (e.g. different machines (dib, probe cards, testers), different operators, different locations, i.e. different appraisers). Commonly referred to as A.V. – appraiser variation. Reproducibility Appraiser A Appraiser B Appraiser C
Gage R&R Gage repeatability and reproducibility is the combined estimate of measurement system repeatability and reproducibility. May or may not include the effects of time. Appraiser A Appraiser B Appraiser C GRR
Process Control Common causes refer to the many sources of variation within a process that has a stable and repeatable distribution over time. (“ in control ”) Common causes behave like a stable system  If only common causes of variation are present and do not change, the output of a process is  predictable . If special causes of variation are present, the process output is  not stable  over time. (“assignable causes”, “out of control”) They will affect the process output in  unpredictable  ways. Prediction Time Prediction Time ? ? ? ? ? ? ? ? ? ? ? ? ? ?
Process Capability The production process must first be brought into statistical control. Then it is  predictable  and its  capability  to meet customer expectations can be assessed. Time Upper  Specification Limit Lower Specification Limit In control but not capable of meeting specifications (variation of common causes is excessive) In control and capable of meeting specifications (variation from common causes have been reduced)
Basic Statistics Mean Median  middle value of sorted data Standard deviation Cp Cpk
Cp and Cpk Cp is just a ratio, so always check Cpk! Cpk=0.0 Cpk<0.0 Cpk=2.0 LSL USL Cp=2.0 Process shift = 50% outside test limits LSL USL Cp=2.0 Mean of measurements outside test limits LSL USL Cp=2.0 No process shift
Capability Table + Histogram
Repeatability Exercise Measure single part 50 times and data log results Create repeatability table and sort on repeatability index Create capability table and sort on Cp, set low limit of Cp higher than 2 Investigate bad results and try to find cause of instability: settling time, resolution, noise, setup, etc. Use histogram to check if distribution is normal. Repeat exercise after each change in test program or appraiser setup.
Prepare reproducibility data sets Data log 25  numbered  parts at least twice Change one thing in your setup, i.e. other load board, other tester, other site, etc. and data log same 25 parts again at least twice.
Reproducibility Table Just delta values, delta mean, delta median, sigma shift, delta 1/cp, etc. Judged delta % values against TW Quick check Mismatching part count is not a problem, no part to part interaction. No EV, AV, GR&R etc. This are products of other tables. Can also be used for tests which are not distributed normally.
Reproducibility Table + Box Plot
Range Method All data sets are treated “equal”, no differentiation between trials or appraisers. provides a quick approximation of measurement variability. does not decompose the variability into repeatability and reproducibility. Uses lookup table and is therefore limited from 2 to 20 data sets.
Range Table n  = Number of parts d 2 *  = Table values of distribution  (m=appraisers, g=number of parts)
Average Range Method provides an estimate of both repeatability and reproducibility. Unlike Range method it will decompose the measurement system in repeatability and reproducibility, but not their interaction. Provide information concerning the causes of measurement system or gage error. Uses a lookup table and is thus limited to population size of 20 parts for some products.
Average Range + Range Control
ANOVA Used to analyse the measurement error and other sources of variability of data in a measurement system study. Variance can be decomposed in four categories: Parts Appraisers Interaction between parts and appraisers Replication error due to the gage.
ANOVA versus Average/Range Advantages ANOVA compared to Average/Range: Estimate variances more accurately Extract more information from experimental data Does not use lookup tables, so no max. part count. Disadvantages : Numerical computations are more complex Users require a certain degree of statistical knowledge
ANOVA Table
Tools Filter options for mismatching data sets: part count test count limits Test Map tool to “map” test for data set A to other test in data set B, fix mismatching test flows. Data Manager to create duplicates and attach site filters for site-to-site compare.
Filters Be careful with filters It is better to have good data sets then using a data set with a filter. Do understand the effect of options of the filters before using. It is very powerful but can ruin your analysis. For R&R be sure you examine the right data.  Filter functionality will be extend in new releases, new options will be added.
Thank You Questions?

R&R Analysis Using SEDana

  • 1.
    R&R Investigation UsingStandard Data Analysis Tools Antoine Megens, Salland Engineering [email_address]
  • 2.
    Contents Distribution andVariation Measurement Errors Process Control and Capability Basic Statistics Repeatability Reproducibility Range Method Average/Range Method ANOVA Method
  • 3.
    Distribution Group measuredvalues in categories. All parts (or measurements) in the same category will have the same value for the measured characteristic. All the measurements will form a pattern that describes the distribution. Measured value(s) Nr of measured values
  • 4.
    Variation The distributionthat can be used to described the measurement variation, can be characterized by: Location Spread Shape
  • 5.
    Measurement Errors Systematicerror Predictable errors (can sometimes be eliminated by calibration) Statistical described by level or mean Example: Output offset of an amplifier Random error Non predictable errors Statistically described by variation or standard deviation Example: Noise
  • 6.
    Measurement errors areoften dependent on: Time Instruments Range We can generally classify measurement errors in: Measurement Errors (cont’d) Bias Stability Linearity Repeatability Reproducibility GRR or Gage R&R
  • 7.
    Repeatability Repeatability isthe variation in measurements obtained with one measurement instrument, used several times by an appraiser while measuring the identical characteristic on the same part. Commonly referred to as E.V. – equipment variation. Repeatability
  • 8.
    Reproducibility The amountof variation expected when some factors are allowed to vary from measurement to measurement (e.g. different machines (dib, probe cards, testers), different operators, different locations, i.e. different appraisers). Commonly referred to as A.V. – appraiser variation. Reproducibility Appraiser A Appraiser B Appraiser C
  • 9.
    Gage R&R Gagerepeatability and reproducibility is the combined estimate of measurement system repeatability and reproducibility. May or may not include the effects of time. Appraiser A Appraiser B Appraiser C GRR
  • 10.
    Process Control Commoncauses refer to the many sources of variation within a process that has a stable and repeatable distribution over time. (“ in control ”) Common causes behave like a stable system If only common causes of variation are present and do not change, the output of a process is predictable . If special causes of variation are present, the process output is not stable over time. (“assignable causes”, “out of control”) They will affect the process output in unpredictable ways. Prediction Time Prediction Time ? ? ? ? ? ? ? ? ? ? ? ? ? ?
  • 11.
    Process Capability Theproduction process must first be brought into statistical control. Then it is predictable and its capability to meet customer expectations can be assessed. Time Upper Specification Limit Lower Specification Limit In control but not capable of meeting specifications (variation of common causes is excessive) In control and capable of meeting specifications (variation from common causes have been reduced)
  • 12.
    Basic Statistics MeanMedian middle value of sorted data Standard deviation Cp Cpk
  • 13.
    Cp and CpkCp is just a ratio, so always check Cpk! Cpk=0.0 Cpk<0.0 Cpk=2.0 LSL USL Cp=2.0 Process shift = 50% outside test limits LSL USL Cp=2.0 Mean of measurements outside test limits LSL USL Cp=2.0 No process shift
  • 14.
  • 15.
    Repeatability Exercise Measuresingle part 50 times and data log results Create repeatability table and sort on repeatability index Create capability table and sort on Cp, set low limit of Cp higher than 2 Investigate bad results and try to find cause of instability: settling time, resolution, noise, setup, etc. Use histogram to check if distribution is normal. Repeat exercise after each change in test program or appraiser setup.
  • 16.
    Prepare reproducibility datasets Data log 25 numbered parts at least twice Change one thing in your setup, i.e. other load board, other tester, other site, etc. and data log same 25 parts again at least twice.
  • 17.
    Reproducibility Table Justdelta values, delta mean, delta median, sigma shift, delta 1/cp, etc. Judged delta % values against TW Quick check Mismatching part count is not a problem, no part to part interaction. No EV, AV, GR&R etc. This are products of other tables. Can also be used for tests which are not distributed normally.
  • 18.
  • 19.
    Range Method Alldata sets are treated “equal”, no differentiation between trials or appraisers. provides a quick approximation of measurement variability. does not decompose the variability into repeatability and reproducibility. Uses lookup table and is therefore limited from 2 to 20 data sets.
  • 20.
    Range Table n = Number of parts d 2 * = Table values of distribution (m=appraisers, g=number of parts)
  • 21.
    Average Range Methodprovides an estimate of both repeatability and reproducibility. Unlike Range method it will decompose the measurement system in repeatability and reproducibility, but not their interaction. Provide information concerning the causes of measurement system or gage error. Uses a lookup table and is thus limited to population size of 20 parts for some products.
  • 22.
    Average Range +Range Control
  • 23.
    ANOVA Used toanalyse the measurement error and other sources of variability of data in a measurement system study. Variance can be decomposed in four categories: Parts Appraisers Interaction between parts and appraisers Replication error due to the gage.
  • 24.
    ANOVA versus Average/RangeAdvantages ANOVA compared to Average/Range: Estimate variances more accurately Extract more information from experimental data Does not use lookup tables, so no max. part count. Disadvantages : Numerical computations are more complex Users require a certain degree of statistical knowledge
  • 25.
  • 26.
    Tools Filter optionsfor mismatching data sets: part count test count limits Test Map tool to “map” test for data set A to other test in data set B, fix mismatching test flows. Data Manager to create duplicates and attach site filters for site-to-site compare.
  • 27.
    Filters Be carefulwith filters It is better to have good data sets then using a data set with a filter. Do understand the effect of options of the filters before using. It is very powerful but can ruin your analysis. For R&R be sure you examine the right data. Filter functionality will be extend in new releases, new options will be added.
  • 28.