Downloaded 880 times

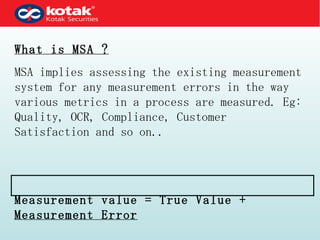
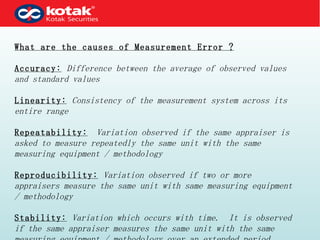

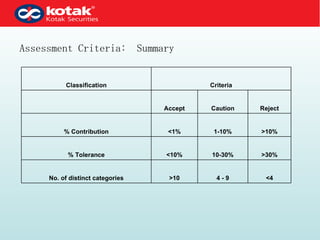
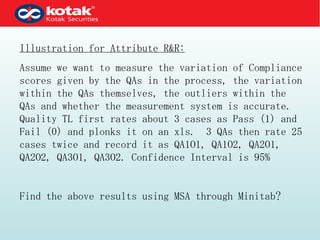
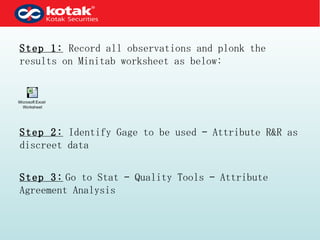
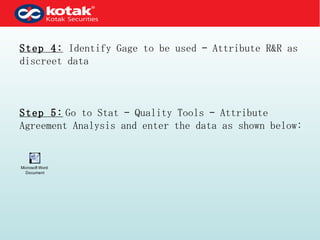

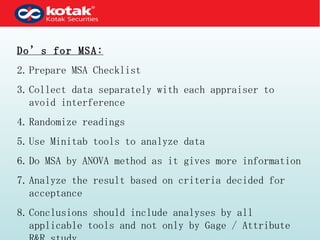


The document discusses measurement system analysis (MSA) which assesses measurement errors in processes. Key causes of measurement error include accuracy, linearity, repeatability, reproducibility, and stability. MSA helps identify accuracy and precision of measurement systems and assess reasons for variation between quality appraisers. The illustration shows how to conduct MSA using Minitab to analyze continuous quality score data from 3 appraisers measuring 3 cases twice each. Results are analyzed against acceptance criteria to evaluate the measurement system.