Downloaded 82 times
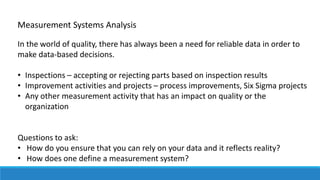
![%Tolerance metric
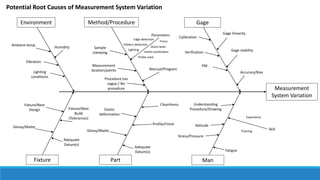
Measurement System Variation (Total GR&R)
Tolerance
Total Variation (Part-To-Part + Total GR&R)
Part-To-Part Variation
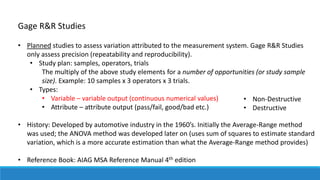
%Tolerance metric
Sigma Multiplier
GR&R [% Tolerance] =
Measurement System Variation (Total GR&R)
Tolerance
=
Measurement System Variation (Total GR&R)StdDev xSigma Multiplier
Tolerance
Reproducibility
Repeatability
Repeatability [% Tolerance] =
Tolerance
Repeatability
Reproducibility [% Tolerance] =
Tolerance
Reproducibility
;](https://image.slidesharecdn.com/measurementsystemsanalysis-variablegagerrstudies-170817145512/85/Measurement-Systems-Analysis-Variable-Gage-R-R-Study-Metrics-Applications-and-Root-Cause-Analysis-9-320.jpg)
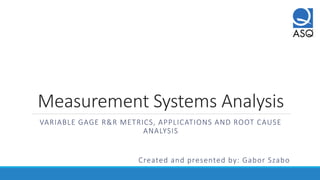
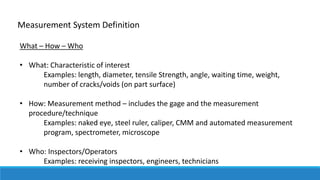
![Area of
Uncertainty
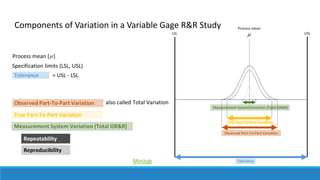
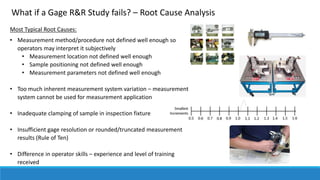
%Tolerance metric - Application
• Application: inspections where the inspection
result is compared to a specification and an
accept/reject decision is made.
Examples: inspection activities (receiving
inspection, in-process inspections, etc.)
Measurement System Variation
LSL USL
Tolerance
Area of
Uncertainty
Measurement System Variation
GR&R [% Tolerance] =
Measurement System Variation (Total GR&R)
Tolerance
• Sample selection: Since the Total Variation component is not part of the %Tolerance
formula, sample selection does not have an affect on the %Tolerance result.
%Tolerance = 15%
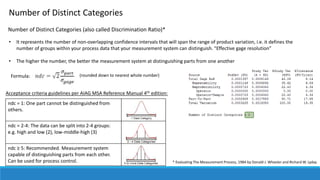
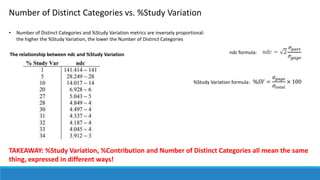
• Acceptance criteria guidelines for %Tolerance per AIAG MSA Reference Manual 4th edition:
< 10% Acceptable measurement system.
10 – 30% May be acceptable for some applications. Decision should be based on feature criticality, cost of measurement device, etc.
> 30% Unacceptable measurement system. Every effort should be made to improve the measurement system.
Type I or II errors](https://image.slidesharecdn.com/measurementsystemsanalysis-variablegagerrstudies-170817145512/85/Measurement-Systems-Analysis-Variable-Gage-R-R-Study-Metrics-Applications-and-Root-Cause-Analysis-11-320.jpg)
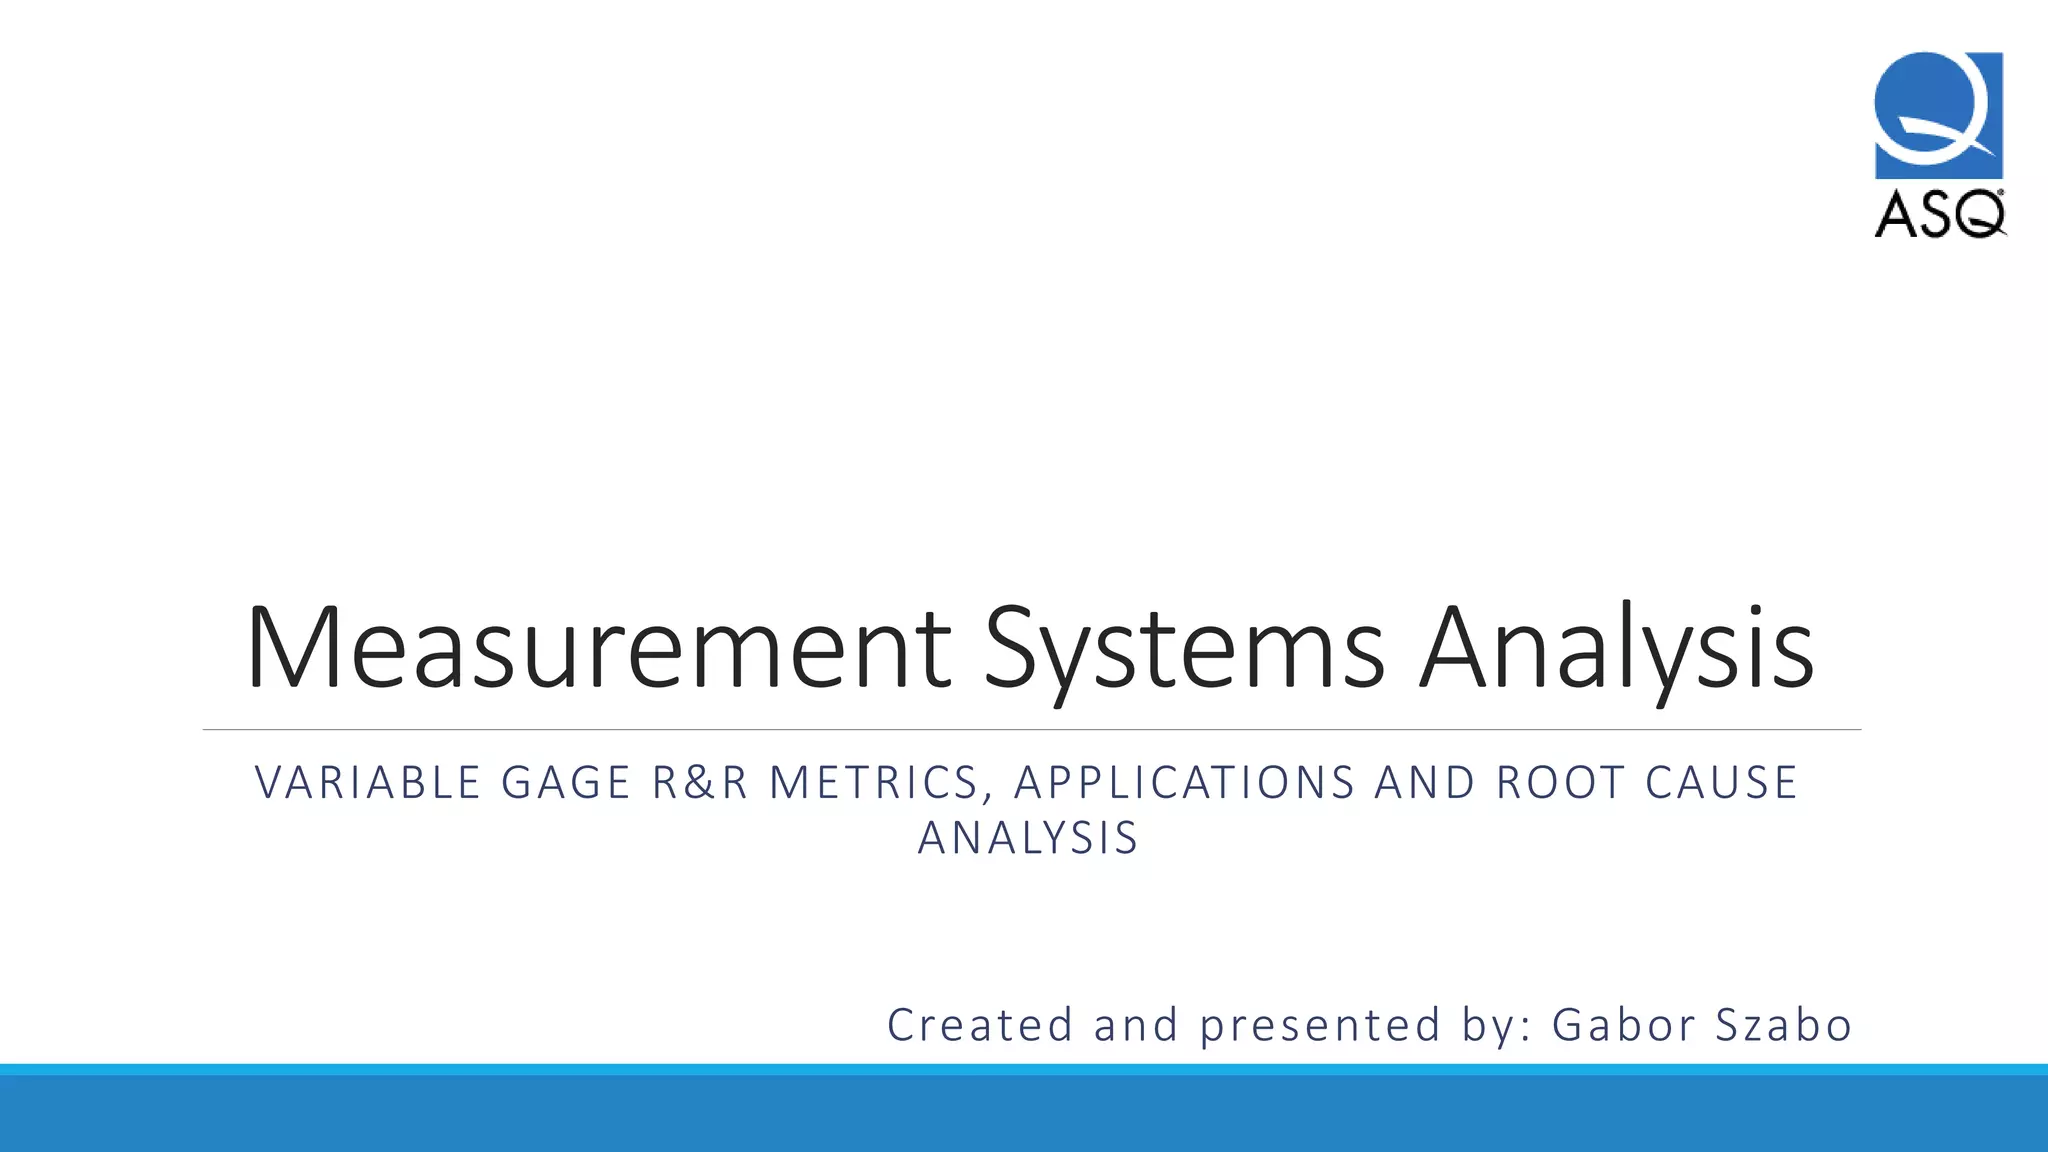
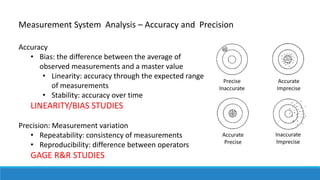
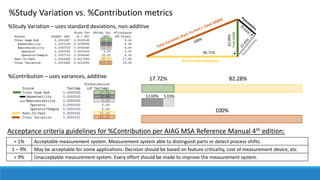
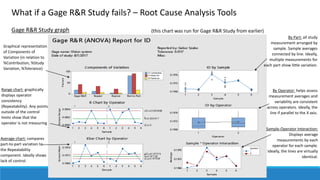
![%Study Variation metric
Measurement System Variation (Total GR&R)
Total Variation (Part-To-Part + Total GR&R)
Part-To-Part Variation
Sigma Multiplier
Reproducibility
Repeatability
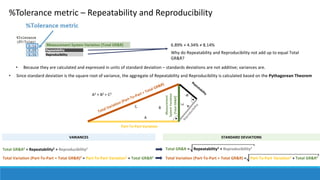
Repeatability [% Study Variation] = Reproducibility [% Study Variation] =
Reproducibility
%Study Variation metric
GR&R [% Study Variation] =
Measurement System Variation (Total GR&R)
Total Variation (Part-To-Part + Total GR&R)
=
Measurement System Variation (Total GR&R)StdDev xSigma Multiplier
Total Variation (Part-To-Part + Total GR&R) StdDev xSigma Multiplier
Total Variation (Part-To-Part + Total GR&R)
Repeatability
Total Variation (Part-To-Part + Total GR&R)
;](https://image.slidesharecdn.com/measurementsystemsanalysis-variablegagerrstudies-170817145512/85/Measurement-Systems-Analysis-Variable-Gage-R-R-Study-Metrics-Applications-and-Root-Cause-Analysis-13-320.jpg)
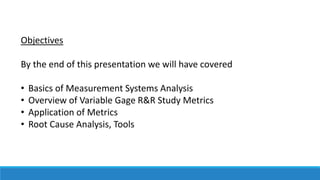
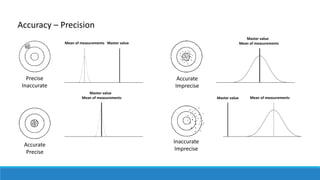
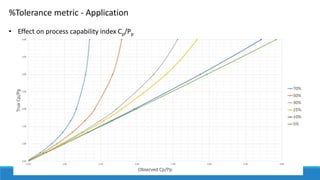
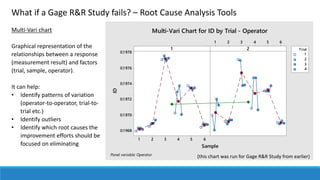
![%Study Variation metric – Application
• Application: activities where process changes, shifts or
drifts need to be identified or monitored.
Examples: process/continuous improvement activities, such
as SPC, Design of Experiments, etc.
Areas of Uncertainty
• Sample selection: Since the Total Variation component is part of the %Study Variation
formula, the %Study Variation metric is affected by sample selection.
GR&R [% Study Variation] =
Measurement System Variation (Total GR&R)
Total Variation (Part-To-Part + Total GR&R)
%Study Variation = 50%
• Acceptance criteria guidelines for %Study Variation per AIAG MSA Reference Manual 4th edition:
< 10% Acceptable measurement system. Measurement system able to distinguish parts or detect process shifts.
10 – 30% May be acceptable for some applications. Decision should be based on feature criticality, cost of measurement device, etc.
> 30% Unacceptable measurement system. Every effort should be made to improve the measurement system.
Type I or II errors](https://image.slidesharecdn.com/measurementsystemsanalysis-variablegagerrstudies-170817145512/85/Measurement-Systems-Analysis-Variable-Gage-R-R-Study-Metrics-Applications-and-Root-Cause-Analysis-14-320.jpg)
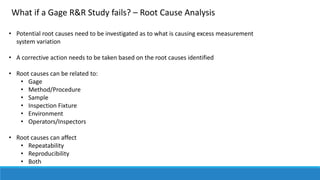
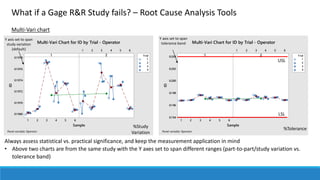

The presentation by Gabor Szabo focuses on measurement systems analysis, particularly variable gage R&R metrics, their applications, and root cause analysis for measurement errors. Key topics addressed include the importance of accurate data for quality assurance, factors contributing to measurement system variation, and guidelines for assessing measurement system reliability based on %tolerance and %study variation metrics. The presentation concludes with strategies for identifying root causes and improving measurement systems when studies do not meet acceptance criteria.