Download as PDF, PPTX
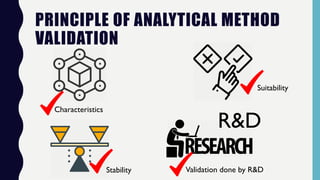
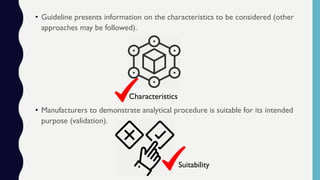
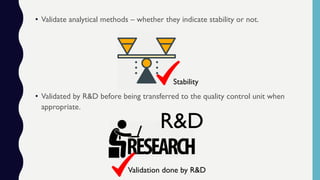
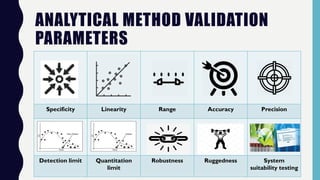
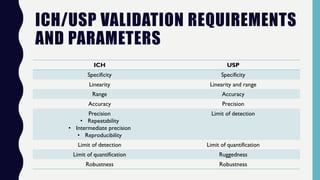
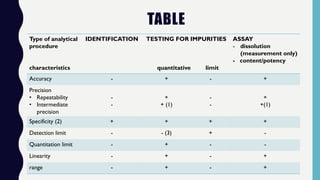


The document discusses the validation of analytical methods according to international guidelines and standards, outlining key principles such as specificity, accuracy, precision, and stability. It emphasizes the necessity for manufacturers to demonstrate that their analytical procedures are suitable for their intended purposes. Additionally, it provides a framework for evaluating the characteristics of different analytical procedures and highlights the importance of revalidation in response to specific changes in processes or products.


