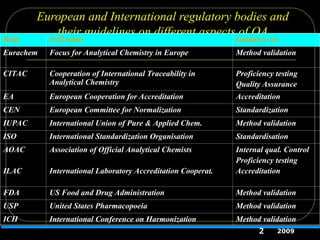
European and Internationalregulatory bodies and
their guidelines on different aspects of QA
Body Full name Guidance on
Eurachem Focus for Analytical Chemistry in Europe Method validation
CITAC Cooperation of International Traceability in
Analytical Chemistry
Proficiency testing
Quality Assurance
EA European Cooperation for Accreditation Accreditation
CEN European Committee for Normalization Standardization
IUPAC International Union of Pure & Applied Chem. Method validation
ISO International Standardization Organisation Standardisation
AOAC
ILAC
Association of Official Analytical Chemists
International Laboratory Accreditation Cooperat.
Internal qual. Control
Proficiency testing
Accreditation
FDA US Food and Drug Administration Method validation
USP United States Pharmacopoeia Method validation
ICH International Conference on Harmonization Method validation
2 2009
3.
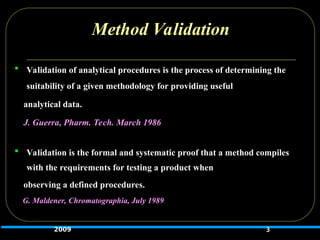
Method Validation
Validationof analytical procedures is the process of determining the
suitability of a given methodology for providing useful
analytical data.
J. Guerra, Pharm. Tech. March 1986
Validation is the formal and systematic proof that a method compiles
with the requirements for testing a product when
observing a defined procedures.
G. Maldener, Chromatographia, July 1989
3
2009
4.
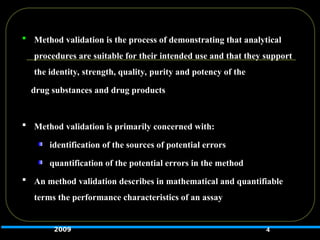
Method validationis the process of demonstrating that analytical
procedures are suitable for their intended use and that they support
the identity, strength, quality, purity and potency of the
drug substances and drug products
Method validation is primarily concerned with:
identification of the sources of potential errors
quantification of the potential errors in the method
An method validation describes in mathematical and quantifiable
terms the performance characteristics of an assay
4
2009
5.
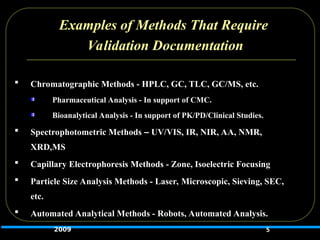
Examples of MethodsThat Require
Validation Documentation
Chromatographic Methods - HPLC, GC, TLC, GC/MS, etc.
Pharmaceutical Analysis - In support of CMC.
Bioanalytical Analysis - In support of PK/PD/Clinical Studies.
Spectrophotometric Methods – UV/VIS, IR, NIR, AA, NMR,
XRD,MS
Capillary Electrophoresis Methods - Zone, Isoelectric Focusing
Particle Size Analysis Methods - Laser, Microscopic, Sieving, SEC,
etc.
Automated Analytical Methods - Robots, Automated Analysis.
5
2009
6.
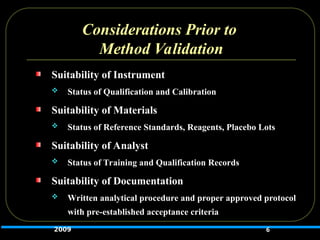
Considerations Prior to
MethodValidation
Suitability of Instrument
Status of Qualification and Calibration
Suitability of Materials
Status of Reference Standards, Reagents, Placebo Lots
Suitability of Analyst
Status of Training and Qualification Records
Suitability of Documentation
Written analytical procedure and proper approved protocol
with pre-established acceptance criteria
6
2009
7.
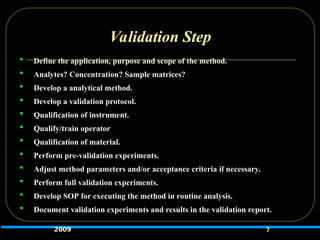
Validation Step
Definethe application, purpose and scope of the method.
Analytes? Concentration? Sample matrices?
Develop a analytical method.
Develop a validation protocol.
Qualification of instrument.
Qualify/train operator
Qualification of material.
Perform pre-validation experiments.
Adjust method parameters and/or acceptance criteria if necessary.
Perform full validation experiments.
Develop SOP for executing the method in routine analysis.
Document validation experiments and results in the validation report.
7
2009
8.
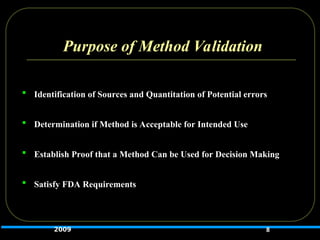
Purpose of MethodValidation
Identification of Sources and Quantitation of Potential errors
Determination if Method is Acceptable for Intended Use
Establish Proof that a Method Can be Used for Decision Making
Satisfy FDA Requirements
8
2009
9.
What is notAnalytical Method
Validation?
Calibration
The Process of Performing Tests on Individual System
Components to Ensure Proper function
For example) HPLC Detector calibration
Wavelength Accuracy/ Linear Range/ Noise Level/ Drift
9
2009
10.
System Suitability
Testto verify the proper functioning of the operating
system, i.e., the electronics, the equipment, the specimens
and the analytical operations.
Minimum Resolution of 3.0 between the analyte peak and
internal standard peaks
Relative Standard Deviation of replicate standard injections
of not more than 2.0%
10
2009
Verification vs. Validation
Compendial vs. Non-compendial Methods
Compendial methods-Verification
Non-compendial methods-Validation requirement
13
2009
14.
Compendial Analytical Procedures
The Analytical procedures in the USP 25/NF 20 are legally recognized under
section 501(b) of the Federal Food, Drug and Cosmetic Act as the regulatory
analytical procedures for the compendial items. The suitability of these
procedures must be verified under actual conditions of use. When using USP
25/NF 20 analytical procedures, the guidance recommends that information be
provided for the following
characteristics:
Specificity of the procedure
Stability of the sample solution
Intermediate precision
14
2009
15.
Published Validation Guidelines
1978 Current Good Manufacturing Practices (cGMPs)
1987 FDA Validation Guideline
1989 Supplement 9 to USP XXI
1994 CDER Reviewer Guidance:
Validation of Chromatographic Method
1995 ICH Validation Definitions:
Q2A, Text on Validation of Analytical procedures
1997 ICH Validation Methodology:
Q2B, Validation of Analytical Procedures: Methodology
1999 Supplement 10 to USP 23 <1225>: Validation of Compendial Methods
1999 CDER “Bioanalytical Method Validation for Human Studies”
2000 CDER Draft “Analytical Procedures and Method Validation”
15
2009
16.
Regulatory and Compliance
RequirementsReview
Validation of an analytical method is the
process by which it is established, by
laboratory studies, that the performance
characteristics of the method meet the
requirements for the intended analytical
applications
16
USP 23 General
Information <1225>
2009
17.
The accuracy,sensitivity, specificity, and
reproducibility of test methods employed by the firm
shall be established and documented. Such validation
and documentation may be accomplished in
accordance with 211.194(a)(2).
17
21 CFR PART 211 - CURRENT GOOD MANUFACTURING
PRACTICE FOR FINISHED PHARMACEUTICALS
Subpart I-Laboratory Controls
211.165 Testing and release for distribution (e)
2009
18.
The objectiveof validation of an analytical
procedure is to demonstrate that it is suitable
for its intended purpose
18
ICH Guideline for
Industry
Q2A, Text on
Validation of
Analytical
Procedures
March 1995
2009
19.
In practice,it is usually possible to design the experimental
work such that the appropriate validation characteristics
can be considered simultaneously to provide a sound,
overall knowledge of the capabilities of the analytical
procedure, for instance: Specificity, Linearity, Range,
Accuracy, and
Precision.
19
ICH Guideline for Industry
Q2B, Validation of
Analytical Procedures:
Methodology
2009
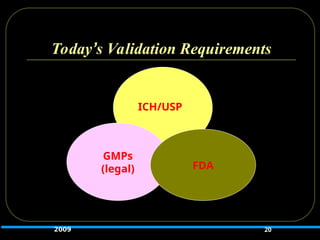
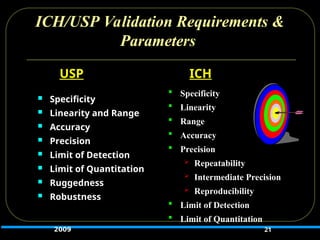
ICH/USP Validation Requirements&
Parameters
Specificity
Linearity
Range
Accuracy
Precision
Repeatability
Intermediate Precision
Reproducibility
Limit of Detection
Limit of Quantitation
21
ICH
Specificity
Specificity
Linearity and Range
Linearity and Range
Accuracy
Accuracy
Precision
Precision
Limit of Detection
Limit of Detection
Limit of Quantitation
Limit of Quantitation
Ruggedness
Ruggedness
Robustness
Robustness
USP
2009
22.
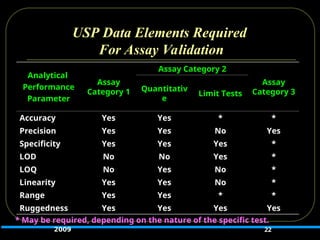
USP Data ElementsRequired
For Assay Validation
22
Analytical
Performance
Parameter
Assay
Category 1
Assay Category 2
Assay
Category 3
Quantitativ
e
Limit Tests
Accuracy Yes Yes * *
Precision Yes Yes No Yes
Specificity Yes Yes Yes *
LOD No No Yes *
LOQ No Yes No *
Linearity Yes Yes No *
Range Yes Yes * *
Ruggedness Yes Yes Yes Yes
* May be required, depending on the nature of the specific test.
2009
23.
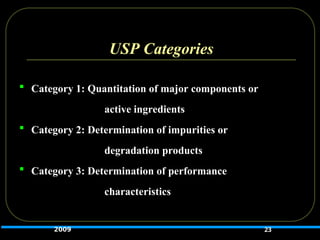
USP Categories
Category1: Quantitation of major components or
active ingredients
Category 2: Determination of impurities or
degradation products
Category 3: Determination of performance
characteristics
23
2009
24.
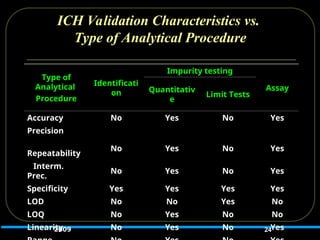
ICH Validation Characteristicsvs.
Type of Analytical Procedure
24
Type of
Analytical
Procedure
Identificati
on
Impurity testing
Assay
Quantitativ
e
Limit Tests
Accuracy No Yes No Yes
Precision
Repeatability
No Yes No Yes
Interm.
Prec.
No Yes No Yes
Specificity Yes Yes Yes Yes
LOD No No Yes No
LOQ No Yes No No
Linearity No Yes No Yes
2009
25.
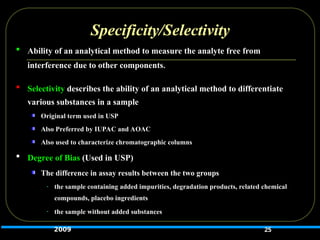
Specificity/Selectivity
Ability ofan analytical method to measure the analyte free from
interference due to other components.
Selectivity describes the ability of an analytical method to differentiate
various substances in a sample
Original term used in USP
Also Preferred by IUPAC and AOAC
Also used to characterize chromatographic columns
Degree of Bias (Used in USP)
The difference in assay results between the two groups
- the sample containing added impurities, degradation products, related chemical
compounds, placebo ingredients
- the sample without added substances
25
2009
26.
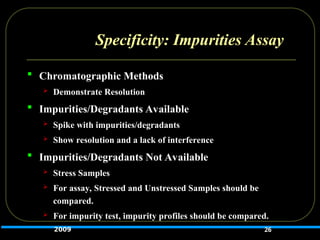
Specificity: Impurities Assay
Chromatographic Methods
Demonstrate Resolution
Impurities/Degradants Available
Spike with impurities/degradants
Show resolution and a lack of interference
Impurities/Degradants Not Available
Stress Samples
For assay, Stressed and Unstressed Samples should be
compared.
For impurity test, impurity profiles should be compared.
26
2009
27.
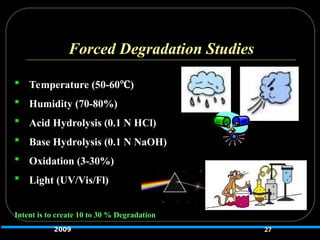
Forced Degradation Studies
Temperature (50-60 )
℃
Humidity (70-80%)
Acid Hydrolysis (0.1 N HCl)
Base Hydrolysis (0.1 N NaOH)
Oxidation (3-30%)
Light (UV/Vis/Fl)
Intent is to create 10 to 30 % Degradation
27
2009
28.
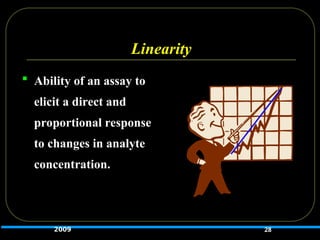
Linearity
Ability ofan assay to
elicit a direct and
proportional response
to changes in analyte
concentration.
28
2009
29.
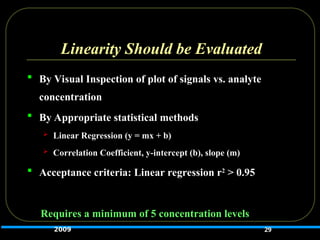
Linearity Should beEvaluated
By Visual Inspection of plot of signals vs. analyte
concentration
By Appropriate statistical methods
Linear Regression (y = mx + b)
Correlation Coefficient, y-intercept (b), slope (m)
Acceptance criteria: Linear regression r2
> 0.95
Requires a minimum of 5 concentration levels
29
2009
30.
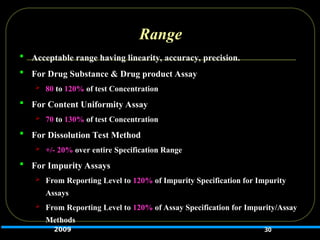
Range
Acceptable rangehaving linearity, accuracy, precision.
For Drug Substance & Drug product Assay
80 to 120% of test Concentration
For Content Uniformity Assay
70 to 130% of test Concentration
For Dissolution Test Method
+/- 20% over entire Specification Range
For Impurity Assays
From Reporting Level to 120% of Impurity Specification for Impurity
Assays
From Reporting Level to 120% of Assay Specification for Impurity/Assay
Methods
30
2009
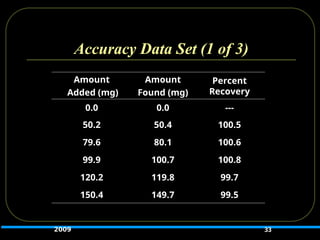
Accuracy
Should beestablished across specified range of
analytical procedure.
Should be assessed using a minimum of 3 concentration
levels, each in triplicate (total of 9 determinations)
Should be reported as:
Percent recovery of known amount added or
The difference between the mean assay result and the accepted
value
32
2009
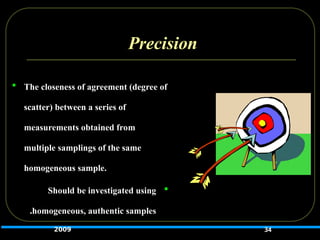
Precision
The closenessof agreement (degree of
scatter) between a series of
measurements obtained from
multiple samplings of the same
homogeneous sample.
Should be investigated using
homogeneous, authentic samples
.
34
2009
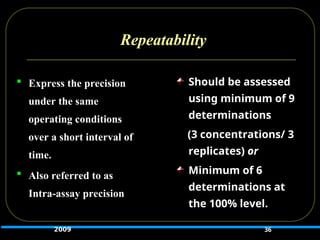
Repeatability
Express theprecision
under the same
operating conditions
over a short interval of
time.
Also referred to as
Intra-assay precision
36
Should be assessed
using minimum of 9
determinations
(3 concentrations/ 3
replicates) or
or
Minimum of 6
determinations at
the 100% level.
2009
37.
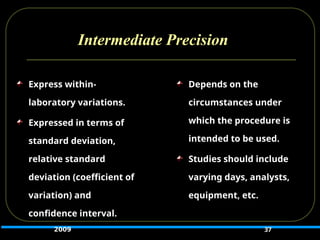
Intermediate Precision
37
Express within-
laboratoryvariations.
Expressed in terms of
standard deviation,
relative standard
deviation (coefficient of
variation) and
confidence interval.
Depends on the
circumstances under
which the procedure is
intended to be used.
Studies should include
varying days, analysts,
equipment, etc.
2009
38.
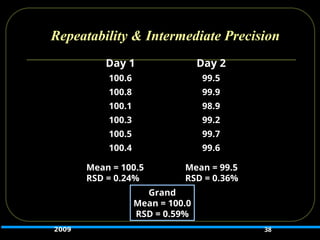
Repeatability & IntermediatePrecision
Day 1 Day 2
100.6 99.5
100.8 99.9
100.1 98.9
100.3 99.2
100.5 99.7
100.4 99.6
38
Grand
Mean = 100.0
RSD = 0.59%
Mean = 100.5
RSD = 0.24%
Mean = 99.5
RSD = 0.36%
2009
39.
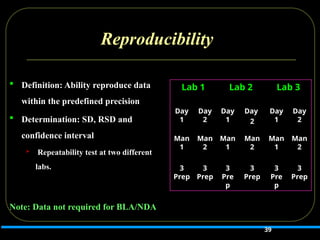
Reproducibility
Definition: Abilityreproduce data
within the predefined precision
Determination: SD, RSD and
confidence interval
Repeatability test at two different
labs.
Note: Data not required for BLA/NDA
Lab 1 Lab 2 Lab 3
Day
1
Day
2
Day
1
Day
2
Day
1
Day
2
Man
1
Man
2
Man
1
Man
2
Man
1
Man
2
3
Prep
3
Prep
3
Pre
p
3
Prep
3
Pre
p
3
Prep
39
40.
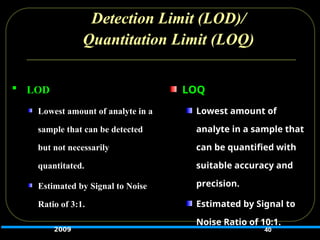
Detection Limit (LOD)/
QuantitationLimit (LOQ)
LOD
Lowest amount of analyte in a
sample that can be detected
but not necessarily
quantitated.
Estimated by Signal to Noise
Ratio of 3:1.
40
LOQ
Lowest amount of
analyte in a sample that
can be quantified with
suitable accuracy and
precision.
Estimated by Signal to
Noise Ratio of 10:1.
2009
41.
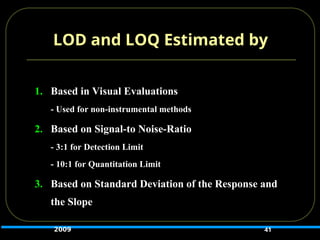
1. Based inVisual Evaluations
- Used for non-instrumental methods
2. Based on Signal-to Noise-Ratio
- 3:1 for Detection Limit
- 10:1 for Quantitation Limit
3. Based on Standard Deviation of the Response and
the Slope
41
LOD and LOQ Estimated by
2009
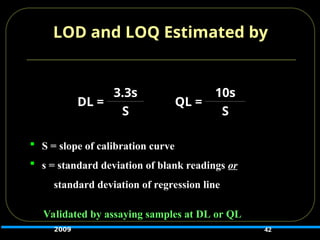
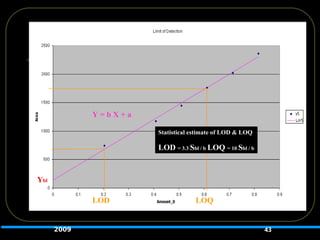
42.
S =slope of calibration curve
s = standard deviation of blank readings or
standard deviation of regression line
Validated by assaying samples at DL or QL
42
DL =
DL =
3.3s
3.3s
QL =
QL =
10s
10s
S
S S
S
LOD and LOQ Estimated by
2009
Definition: Capacityto remain unaffected by small but deliberate
variations in method parameters
Determination: Comparison results under differing conditions with
precision under normal conditions
Examples of typical variations in LC
Influence of variations of pH in a mobile phase
Influence of variations in mobile phase composition
Different columns (different lots and/or suppliers)
Temperature
Flow rate
44
Robustness
2009
45.
Ruggedness
Degree ofreproducibility of test results
under a variety of conditions
Different Laboratories
Different Analysts
Different Instruments
Different Reagents
Different Days
Etc.
Expressed as %RSD
45
2009
46.
ICH/USP System Suitability
ICH
Definition: evaluation of equipment, electronic,
analytical operations and samples as a whole
Determination: repeatability, tailing factor (T), capacity
factor (k’), resolution (R), and theoretical Plates (N)
46
2009
47.
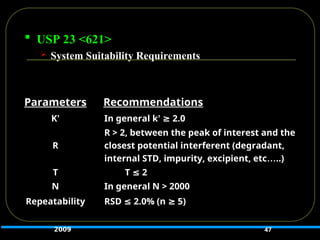
USP 23<621>
System Suitability Requirements
47
Parameters Recommendations
K’ In general k’ 2.0
≥
R
R > 2, between the peak of interest and the
closest potential interferent (degradant,
internal STD, impurity, excipient, etc…..)
T T 2
≤
N In general N > 2000
Repeatability RSD 2.0% (n 5)
≤ ≥
2009
48.
Re-validation
When
Methodparameters have been changed
The scope of the method has been changed
Synthetic methods have been changed
Impurity profile has been changed
What
Preferably everything. Exceptions should be
scientifically justified
48
2009
49.
How do weKnow the expectations of
the FDA
?
FDA Form 483
FDA Warning Letters
Personal Experiences
49
2009
50.
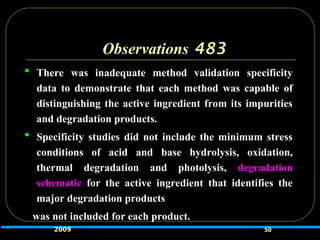
483
Observations
There wasinadequate method validation specificity
data to demonstrate that each method was capable of
distinguishing the active ingredient from its impurities
and degradation products.
Specificity studies did not include the minimum stress
conditions of acid and base hydrolysis, oxidation,
thermal degradation and photolysis, degradation
schematic for the active ingredient that identifies the
major degradation products
was not included for each product.
50
2009
51.
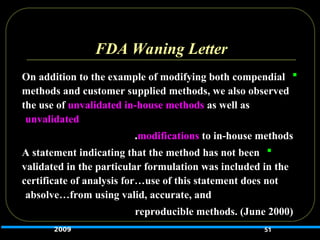
FDA Waning Letter
Onaddition to the example of modifying both compendial
methods and customer supplied methods, we also observed
the use of unvalidated in-house methods as well as
unvalidated
modifications to in-house methods
.
A statement indicating that the method has not been
validated in the particular formulation was included in the
certificate of analysis for…use of this statement does not
absolve…from using valid, accurate, and
reproducible methods. (June 2000)
51
2009
52.
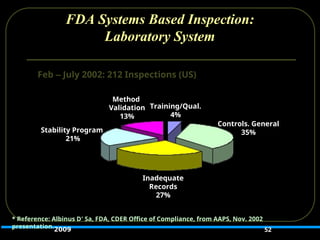
FDA Systems BasedInspection:
Laboratory System
52
Method
Validation
13%
Training/Qual.
4%
Stability Program
21%
Inadequate
Records
27%
Controls. General
35%
Feb – July 2002: 212 Inspections (US)
* Reference: Albinus D’ Sa, FDA, CDER Office of Compliance, from AAPS, Nov. 2002
presentation.2009
A Unique Approach
International Conference on Harmonisation
(ICH) was created in 1990
Agreement between the EU, Japan and the
USA to harmonize different regional
requirements for registration of pharmaceutical
drug products
Unique because joint effort by regulators and
associated pharmaceutical industry trade
associations
2009 54
55.
ICH Objectives
Identificationand elimination of the need to duplicate
studies to meet different regulatory requirements
More efficient use of resources in the R&D process,
as a consequence
Quicker access for patients to safe and effective new
medicines
2009 55