Downloaded 242 times
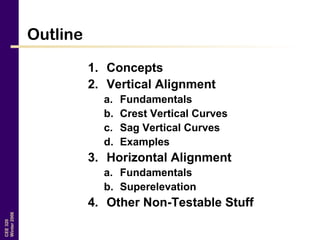
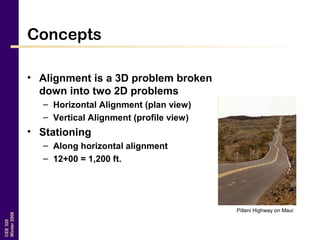
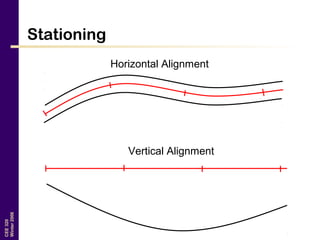
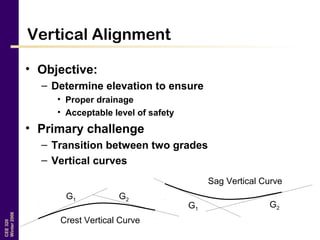
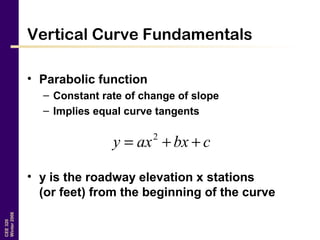
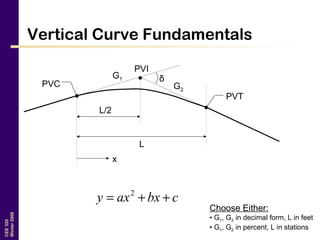
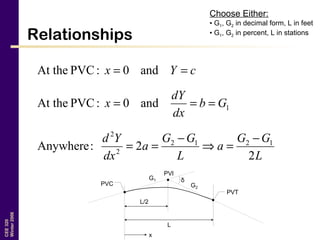
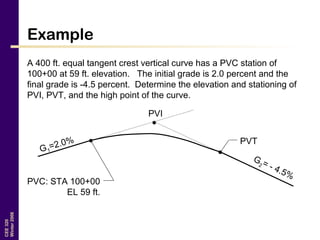
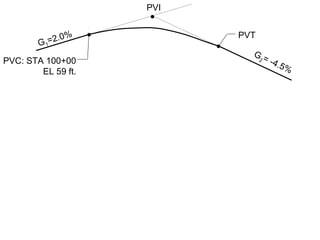
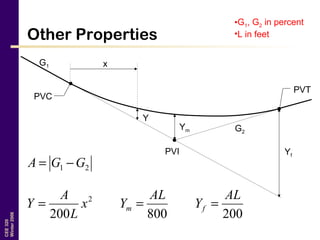
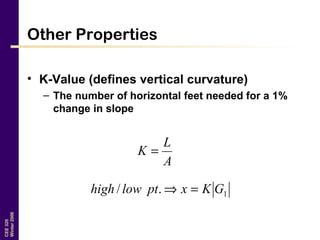
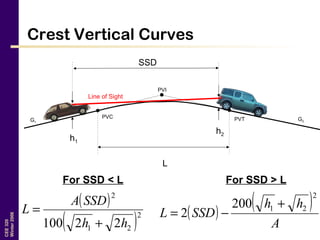
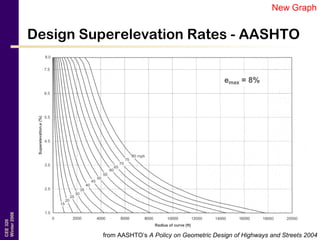
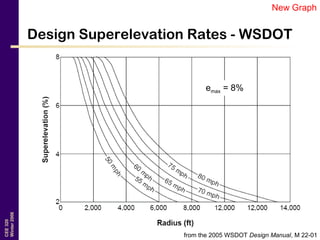
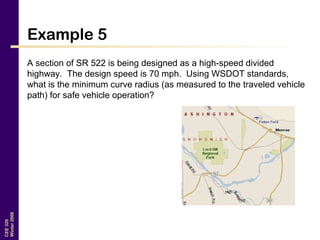
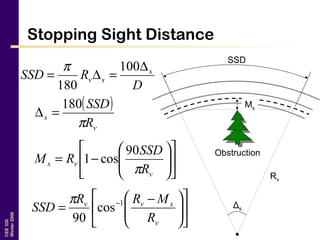

This document provides an outline and content for a course on geometric design (CEE320). It covers key topics like vertical and horizontal alignment, including fundamentals of vertical curves, crest and sag vertical curves, horizontal curve fundamentals, superelevation, and stopping sight distance. Examples are provided to demonstrate calculations for elements like vertical curve length. Design controls and standards from AASHTO and WSDOT are presented for elements such as superelevation rates and side friction factors. The course content is intended to teach students the critical concepts and calculations for geometric roadway design.


![11 Geometric Design of Railway Track [Vertical Alignment] (Railway Engineerin...](https://cdn.slidesharecdn.com/ss_thumbnails/geometricdesignofrailwaytrack-ii-200415172410-thumbnail.jpg?width=640&height=640&fit=bounds)
![10 Geometric Design of Railway Track [Horizontal Alignment] (Railway Engineer...](https://cdn.slidesharecdn.com/ss_thumbnails/geometricdesignofrailwaytrack-i-200415171932-thumbnail.jpg?width=640&height=640&fit=bounds)


