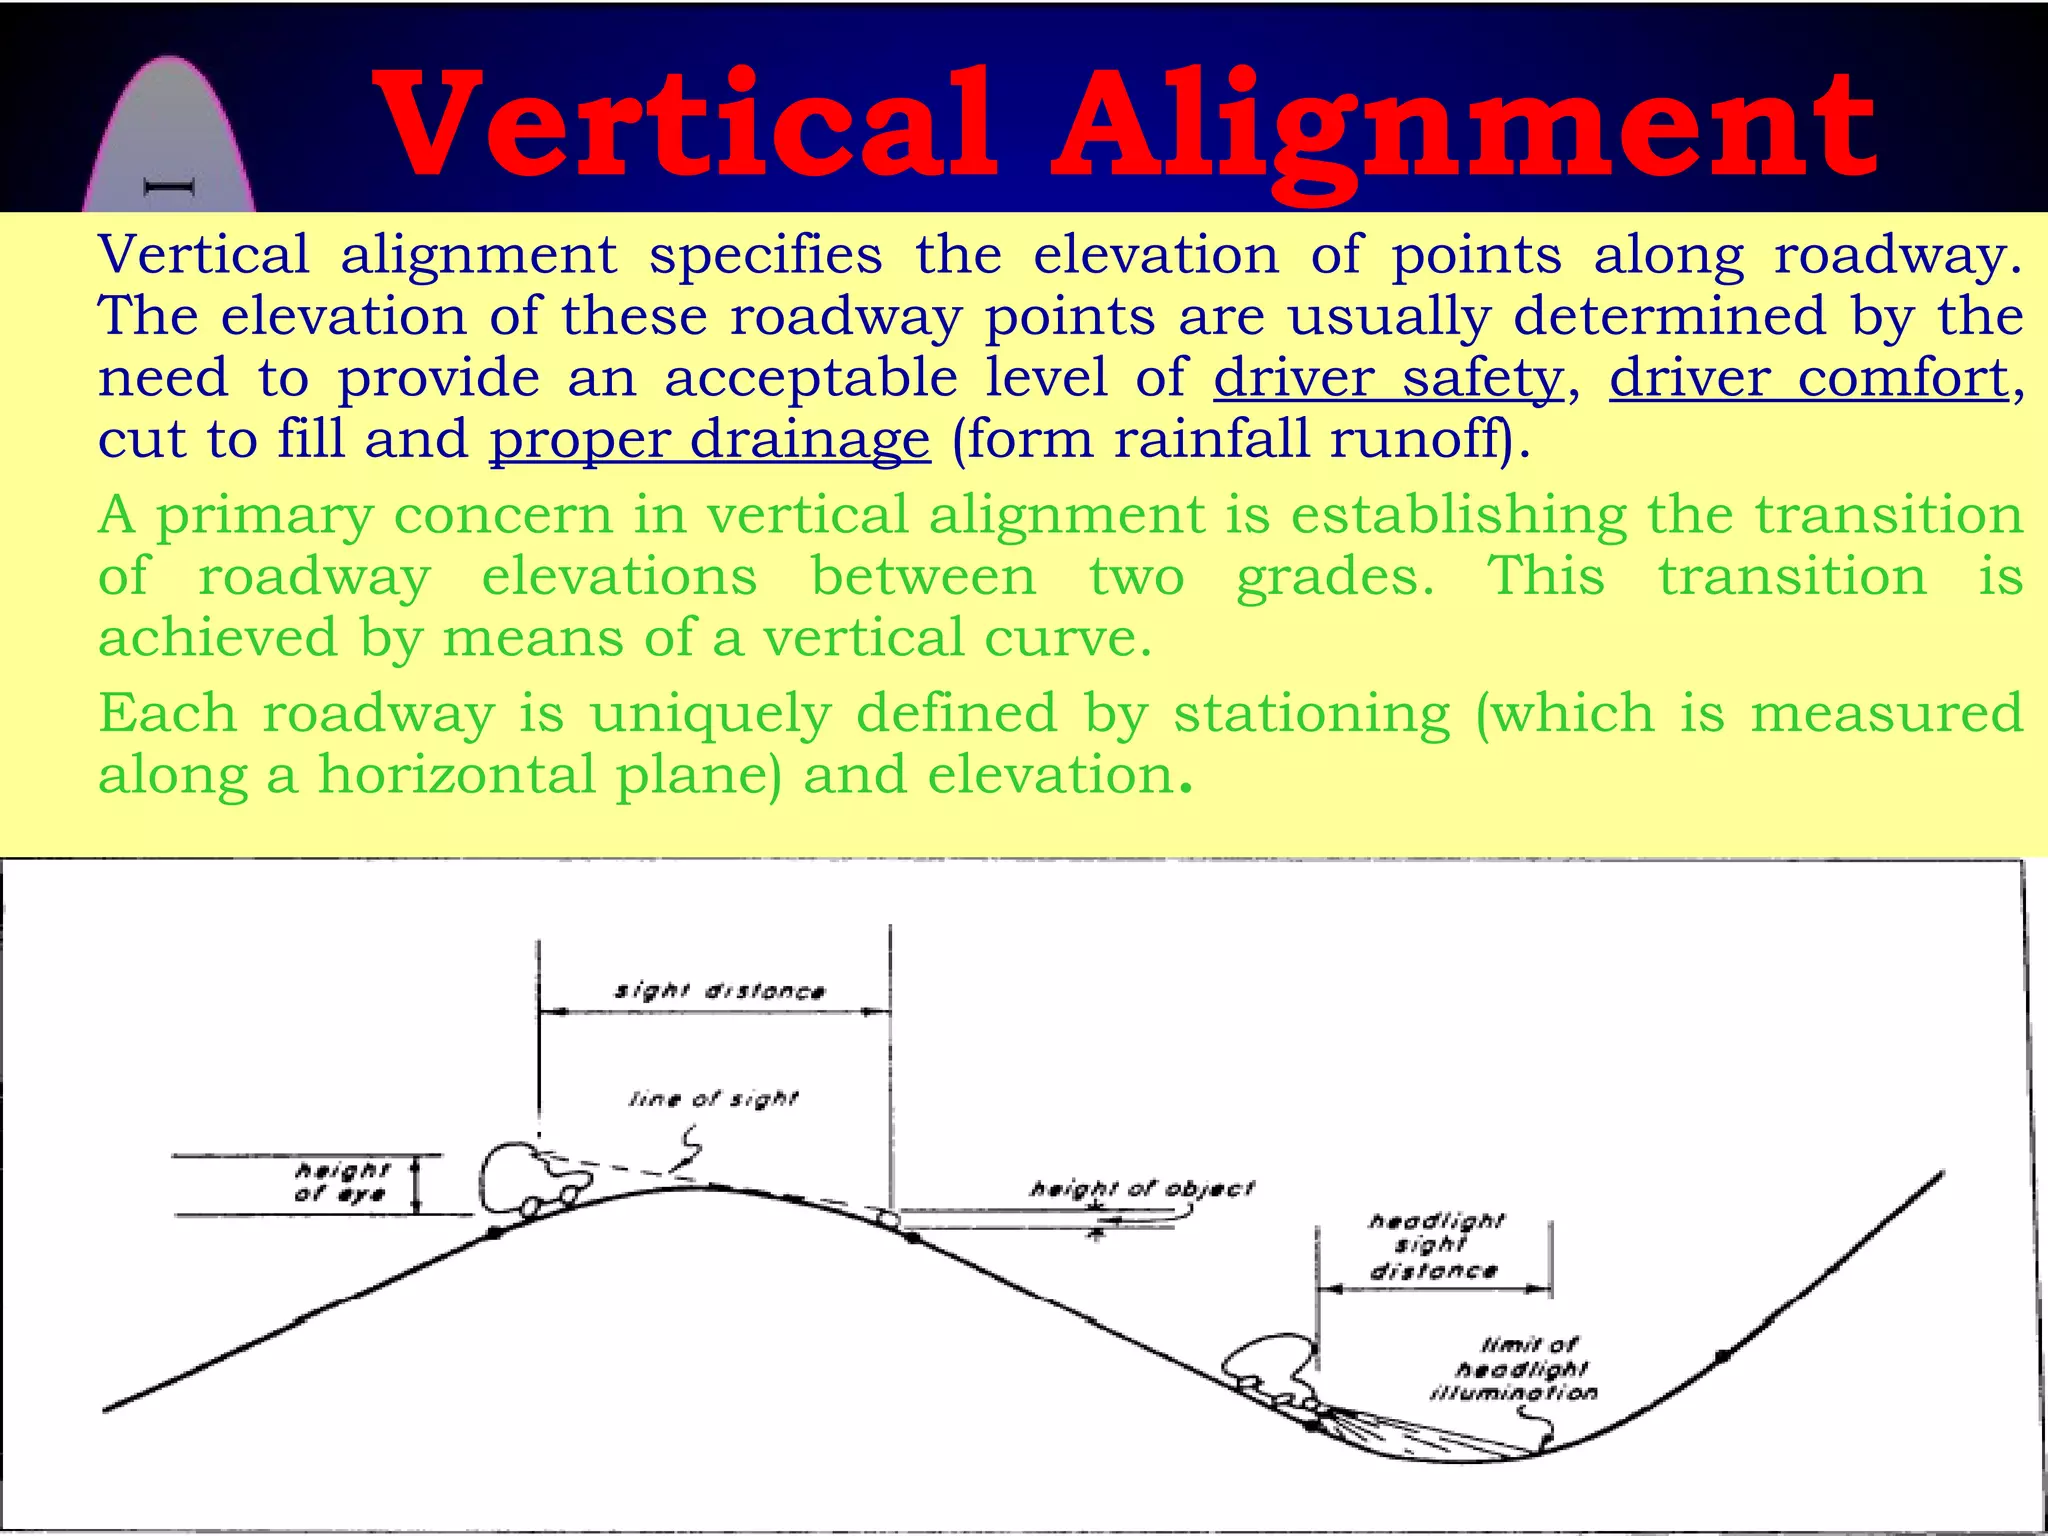
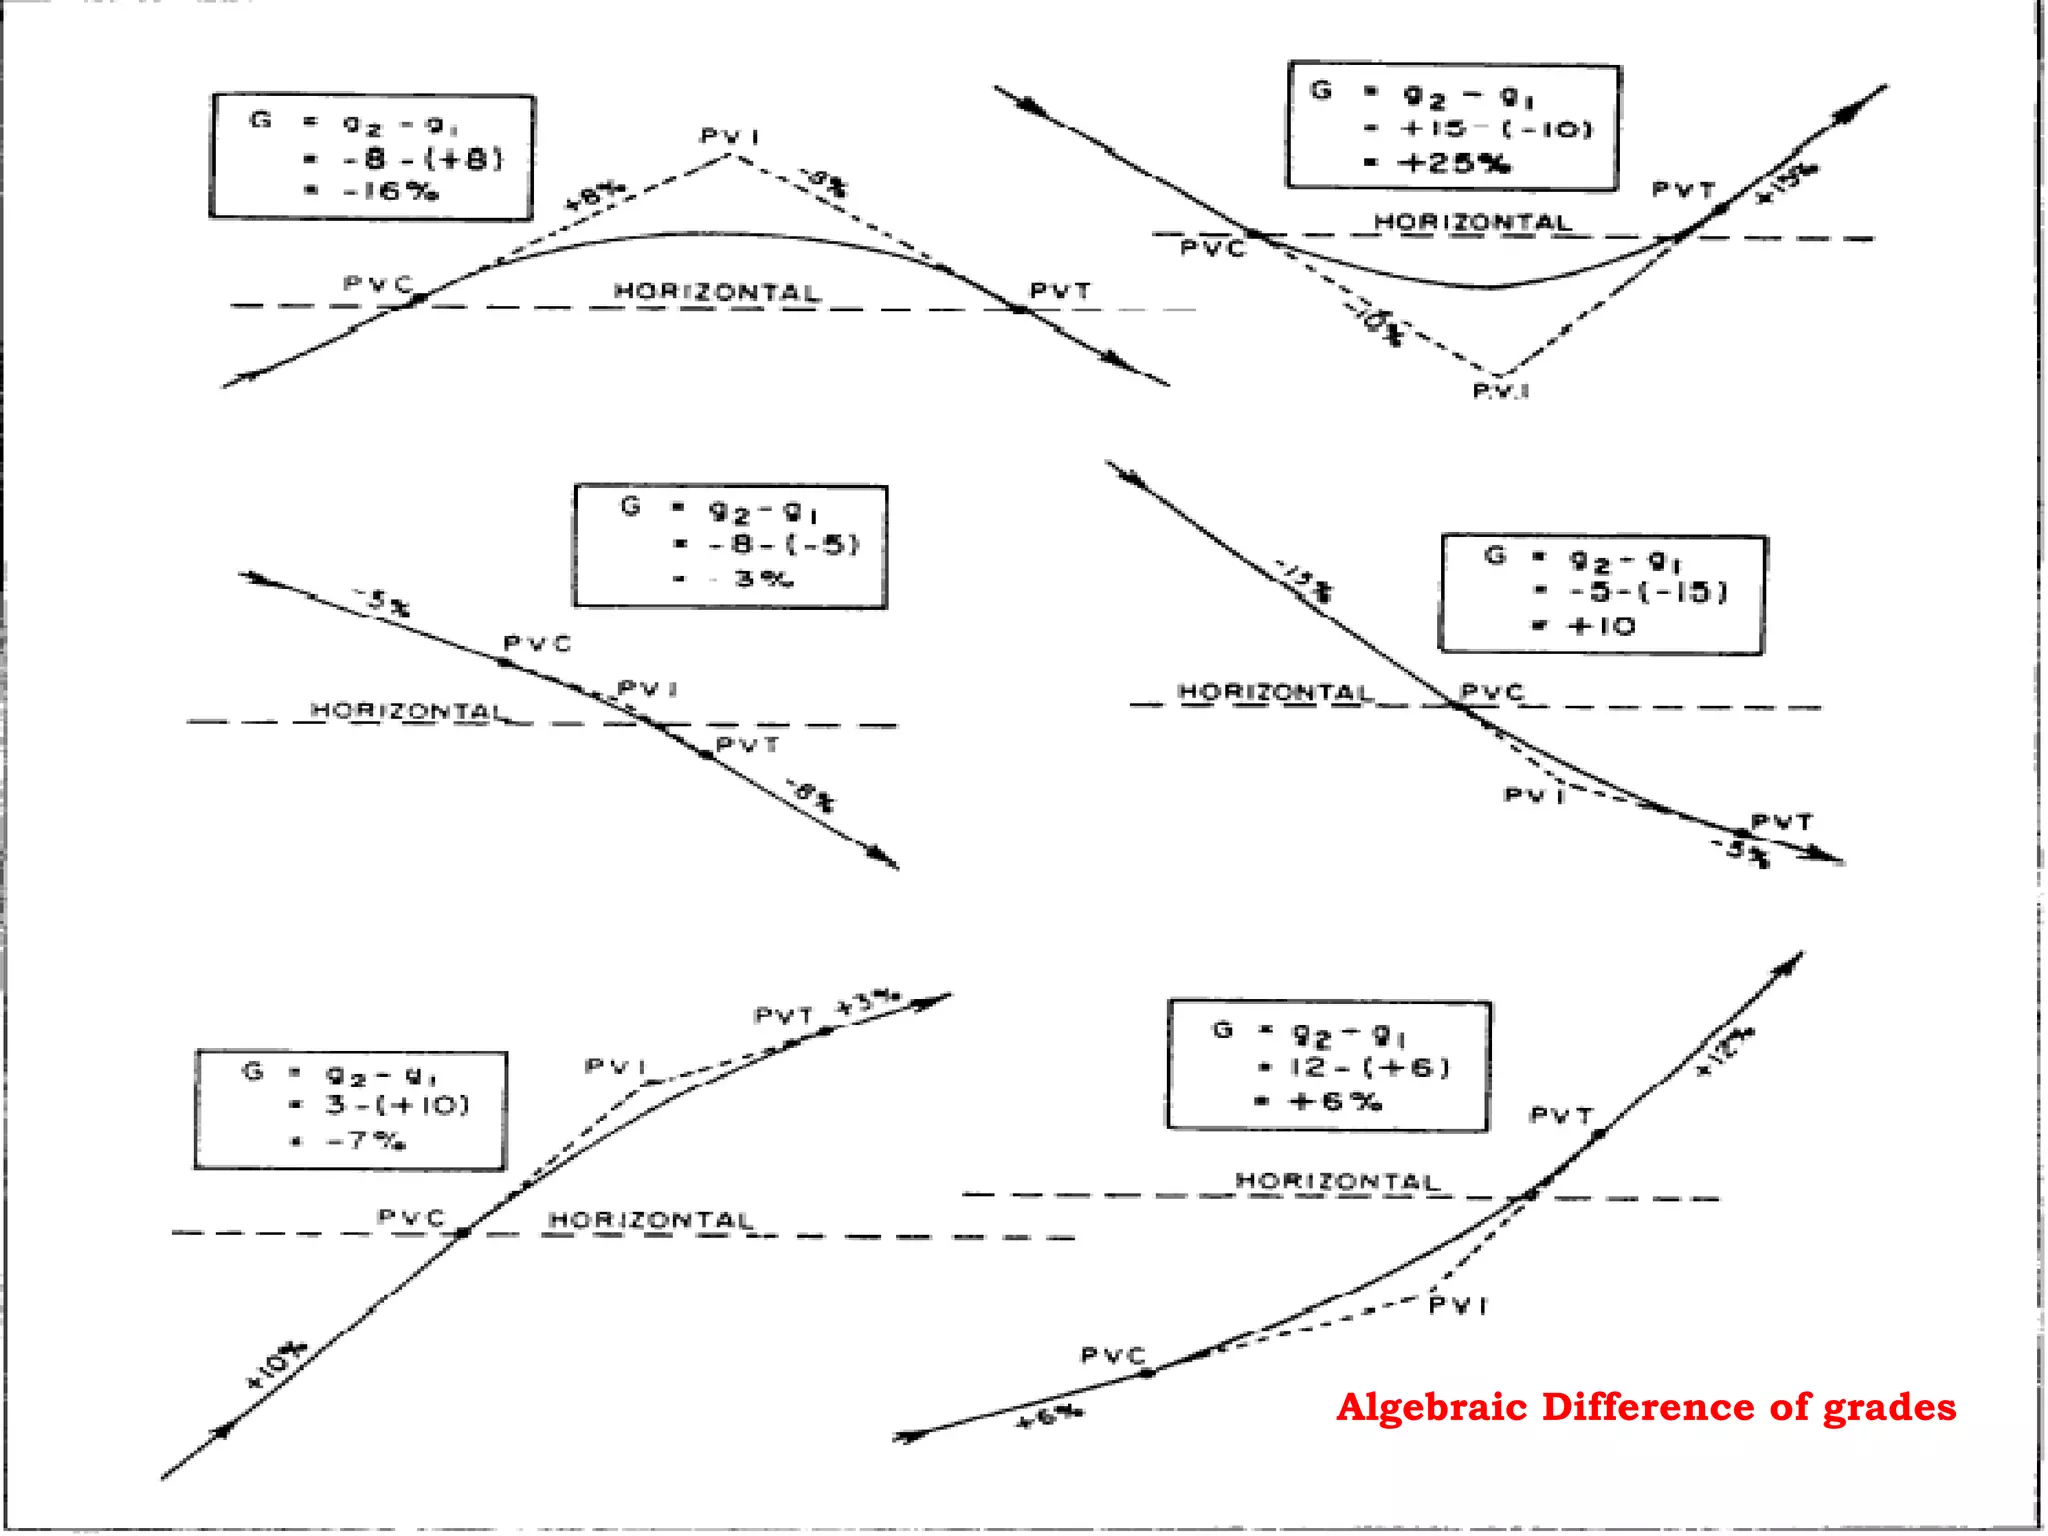
This document discusses various aspects of vertical alignment in transportation engineering. It describes how vertical alignment specifies the elevation of points along a roadway based on safety, comfort, drainage needs. Vertical curves are used to transition between different roadway grades and can be crest or sag curves. The coordination of vertical and horizontal alignment is also discussed to ensure driver safety and aesthetics. Maximum and minimum grades, as well as critical lengths of grades, are addressed based on truck performance.


![Sag Vertical Curve: Example
A sag vertical curve is to be designed to join a –3% to
a +3% grade. Design speed is 40 mph. What is L?
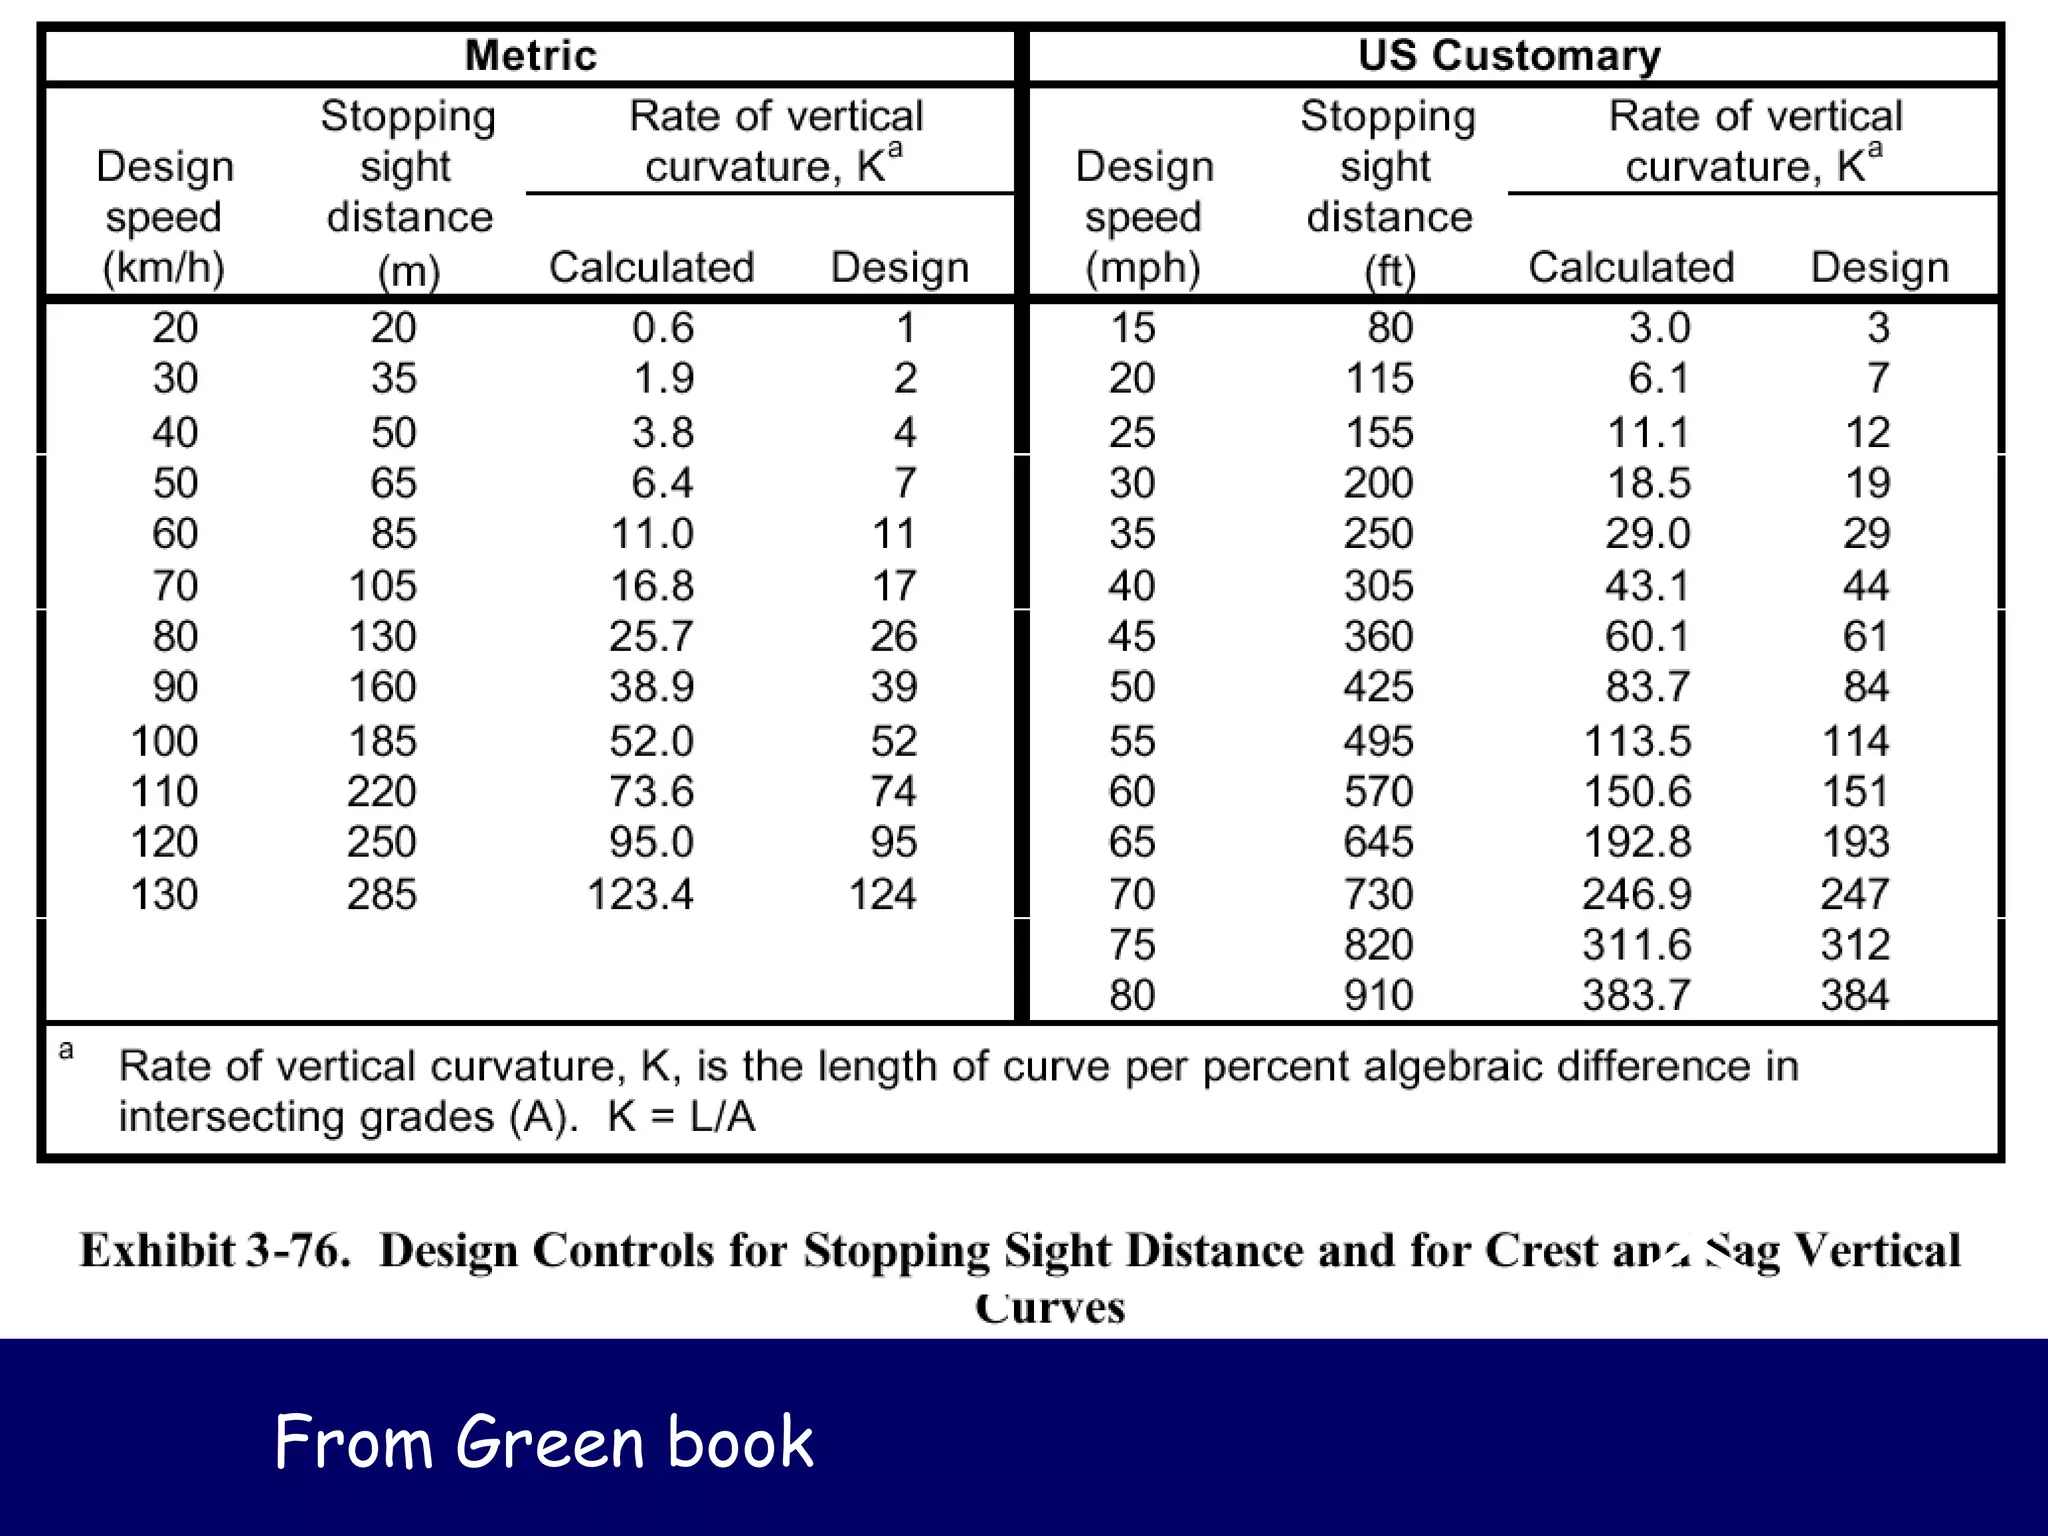
Skipping steps: SSD = 313.67 feet S > L
Determine whether S<L or S>L
L = 2(313.67 ft) – (400 + 2.5 x 313.67) = 377.70 ft
[3 – (-3)]
313.67 < 377.70, so condition does not apply
Truck](https://image.slidesharecdn.com/verticalalignment-161224110510/75/Vertical-alignment-53-2048.jpg)

![Sag Vertical Curve: Example
A sag vertical curve is to be designed to join a –3% to a +3%
grade. Design speed is 40 mph. What is L?
Skipping steps: SSD = 313.67 feet
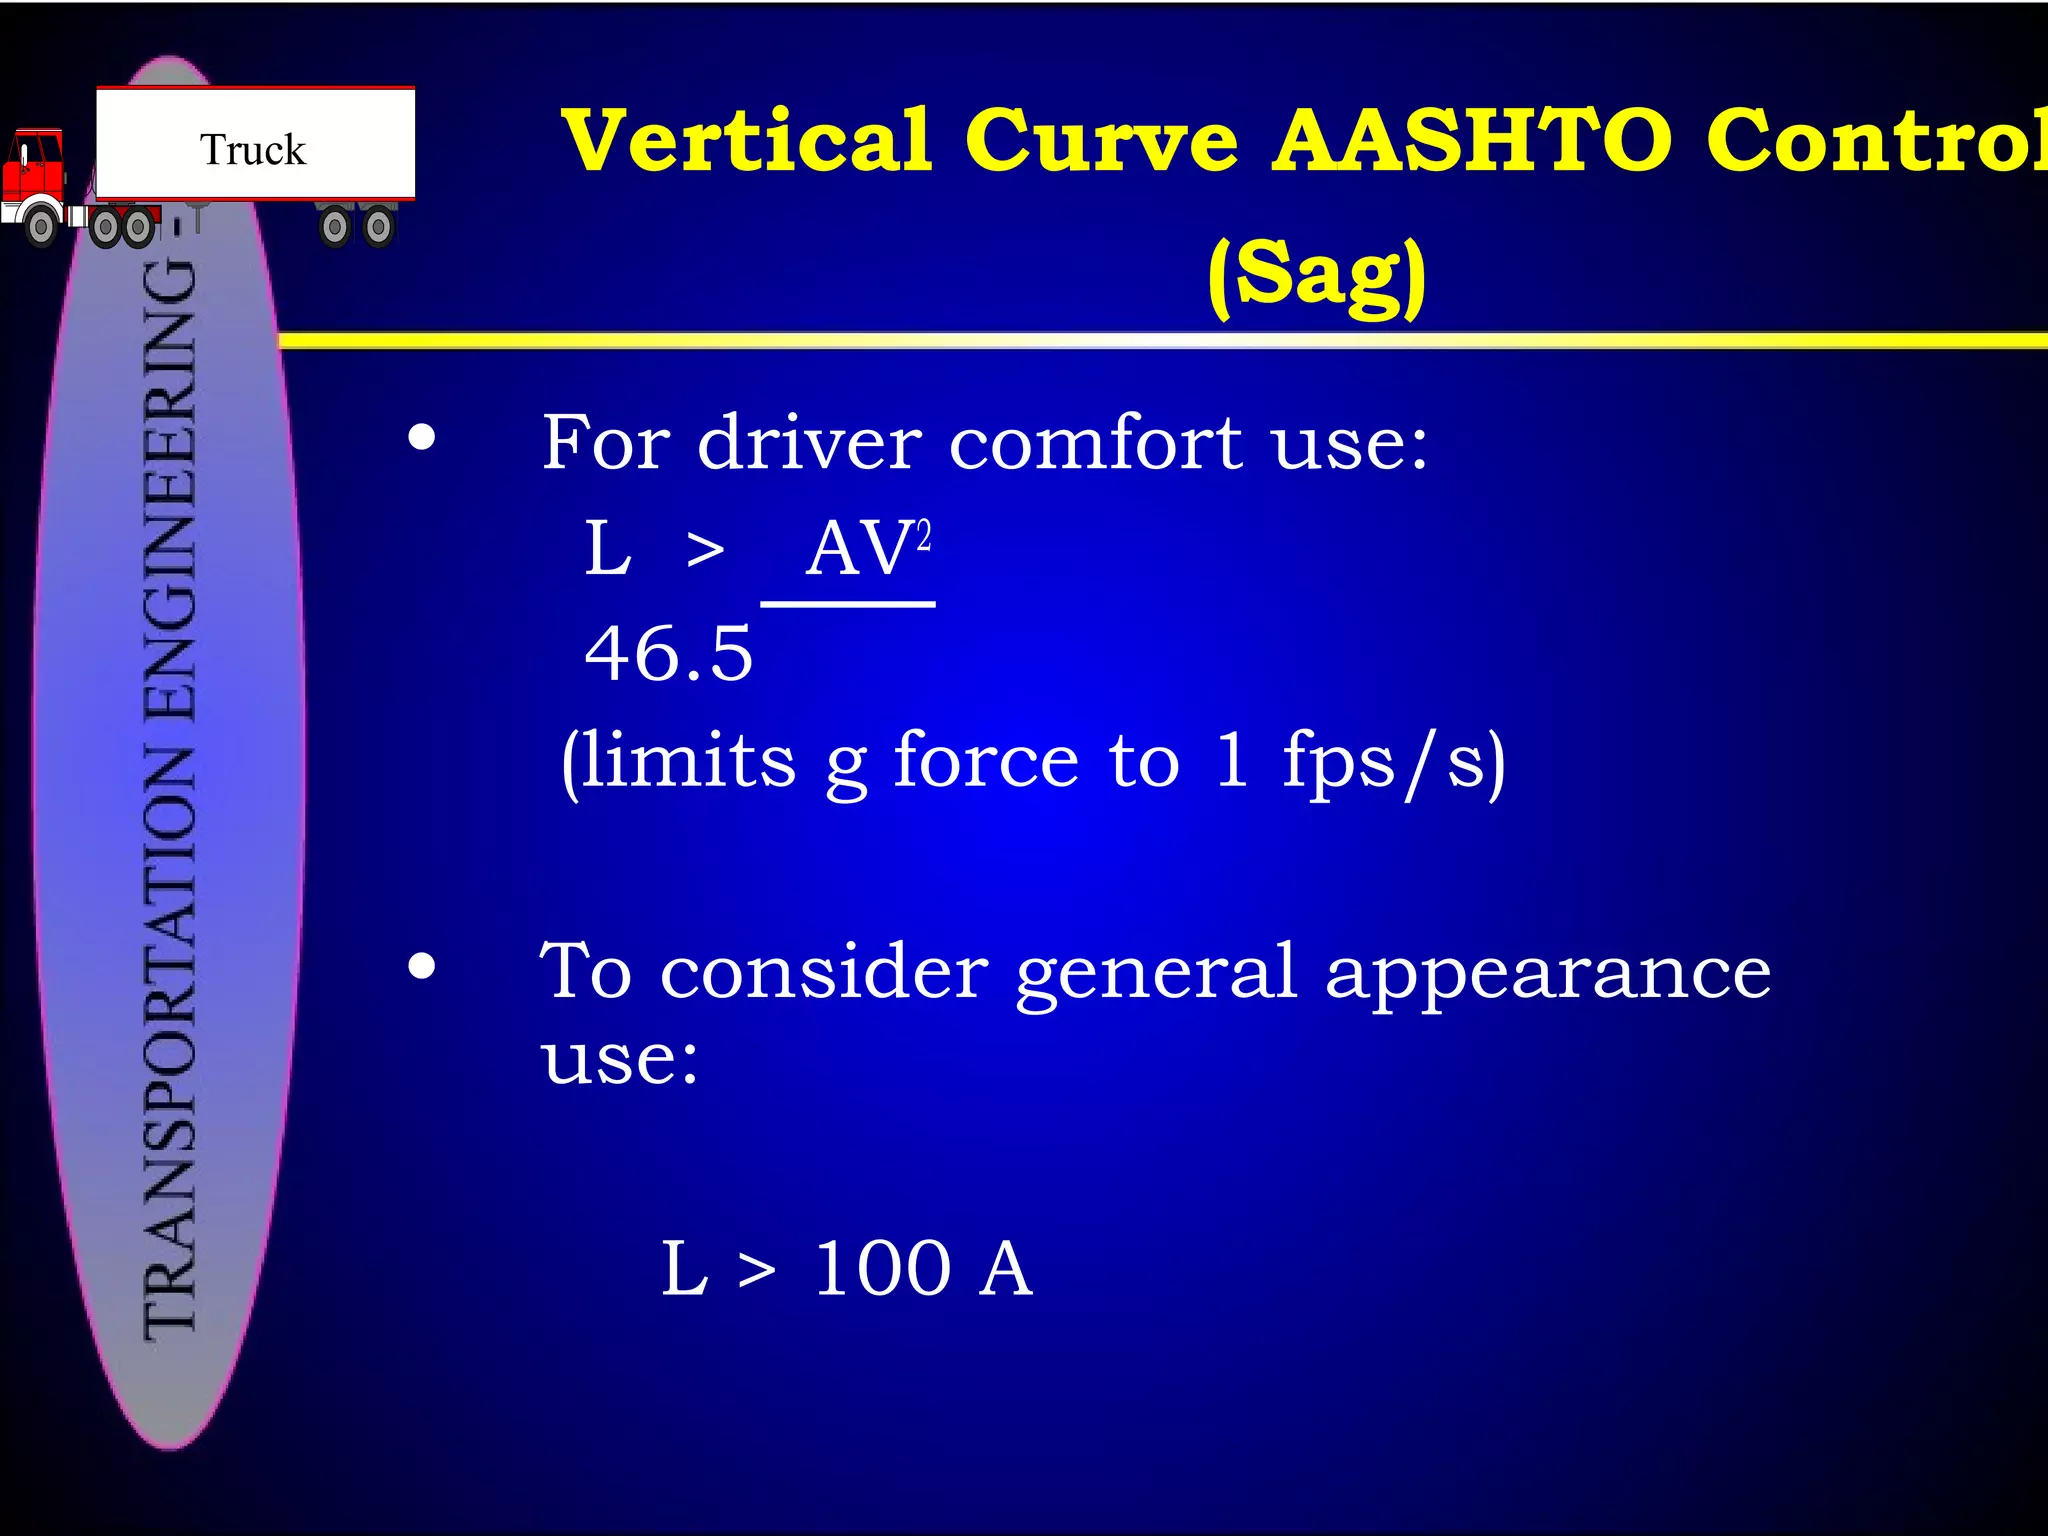
Testing for comfort:
L = AV2
= (6 x [40 mph]2
) = 206.5 feet
46.5 46.5
Testing for appearance:
L = 100A = (100 x 6) = 600 feet
Truck](https://image.slidesharecdn.com/verticalalignment-161224110510/75/Vertical-alignment-55-2048.jpg)


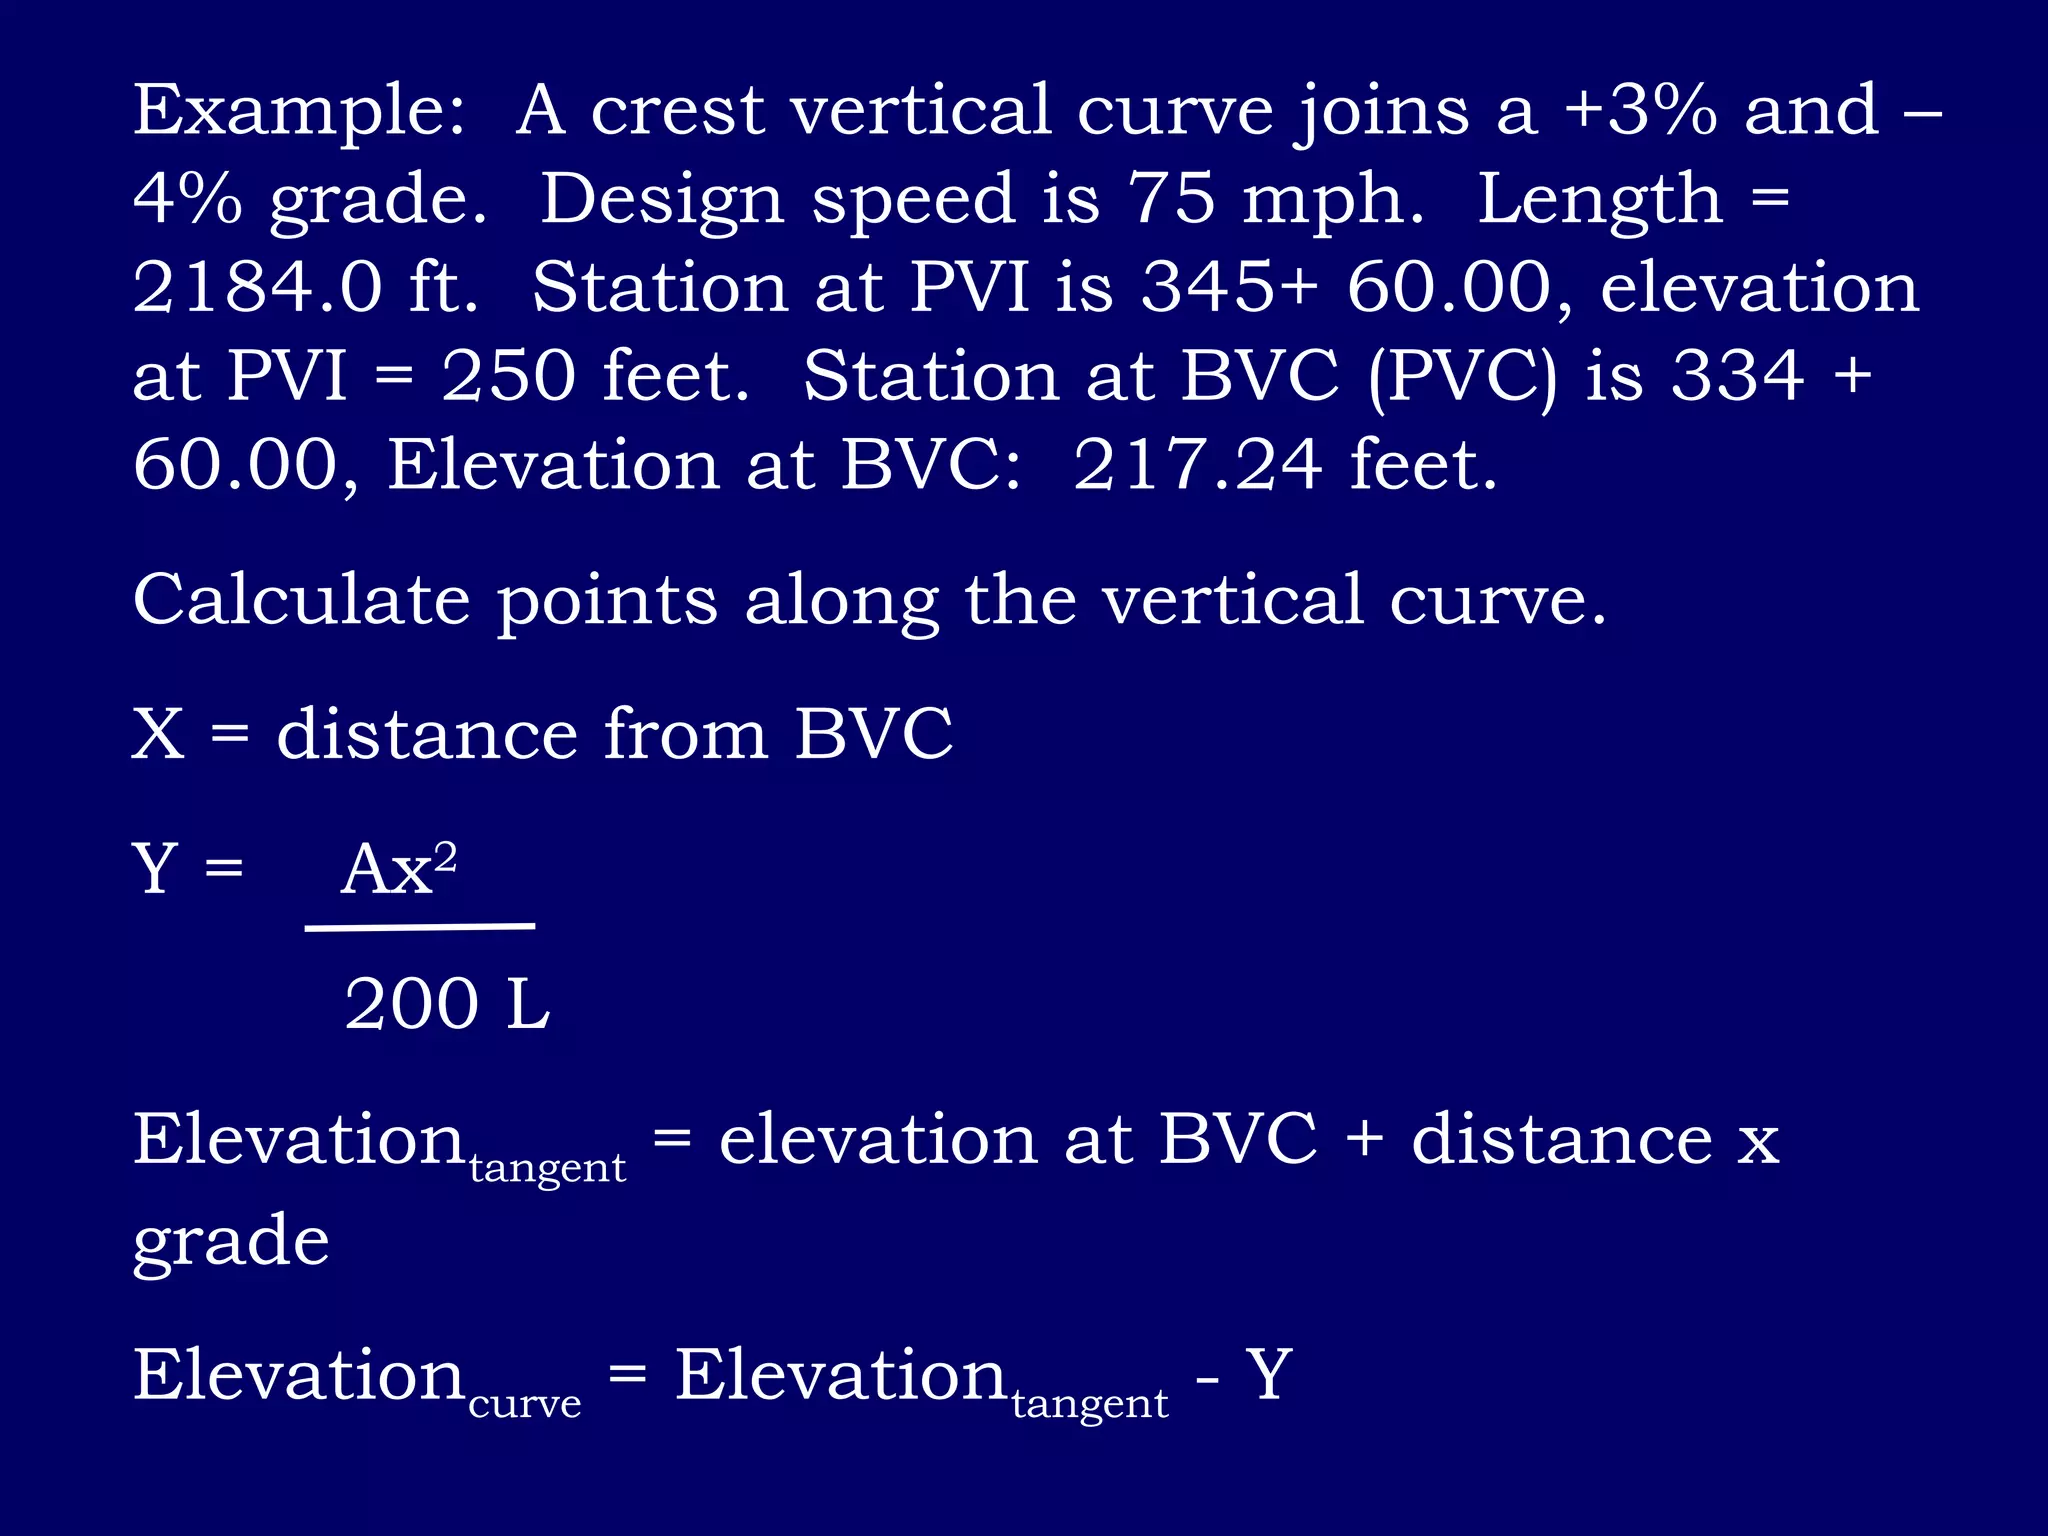
![Example: A crest vertical curve joins a +3% and –4% grade.
Design speed is 75 mph. Length = 2184.0 ft. Station at
PVI is 345+ 60.00, elevation at PVI = 250 feet. Find
elevations and station for PVC (BVC) and PVT (EVC).
L/2 = 1092.0 ft
Station at PVC = [345 + 60.00] - [10 + 92.00] = 334 + 68.00
Vertical Diff PVI to PVC: -0.03 x (2184/2) = -32.76 feet
ElevationPVC = 250 – 32.76 = 217.24 feet
Station at PVT = [345 + 60.00] + [10 + 92.00] = 357 + 52.00
Vertical Diff PVI to PVT = 0.04 x (2184/2) = 43.68 feet
Elevation PVT = 250 – 43.68 = 206.32 feet](https://image.slidesharecdn.com/verticalalignment-161224110510/75/Vertical-alignment-59-2048.jpg)