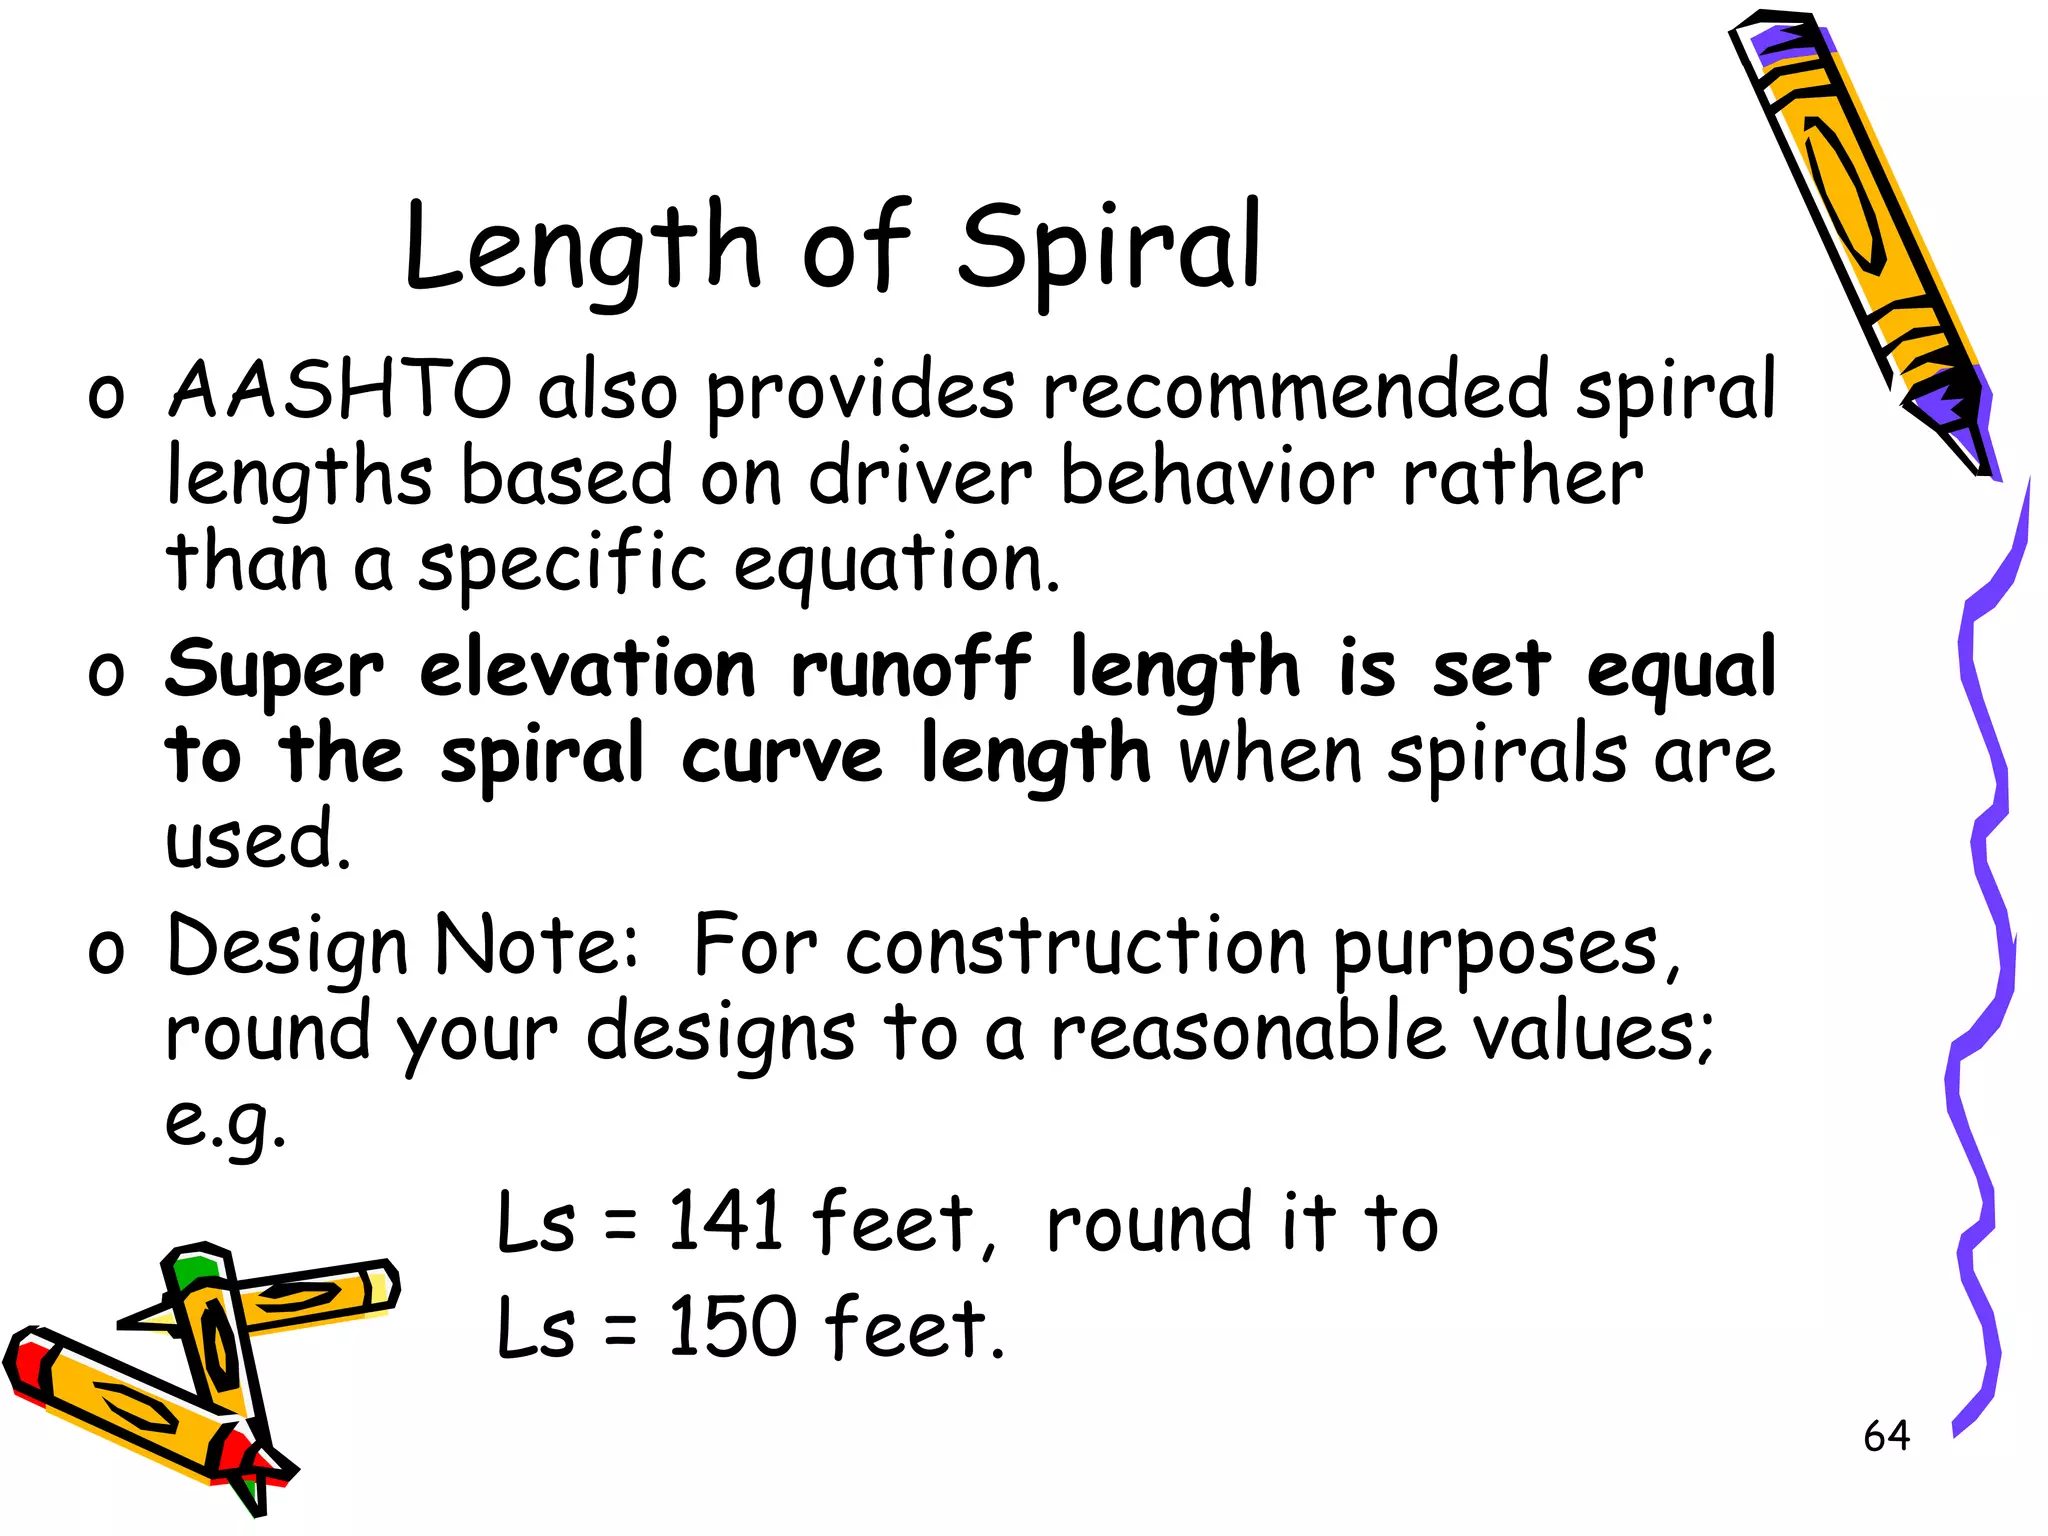
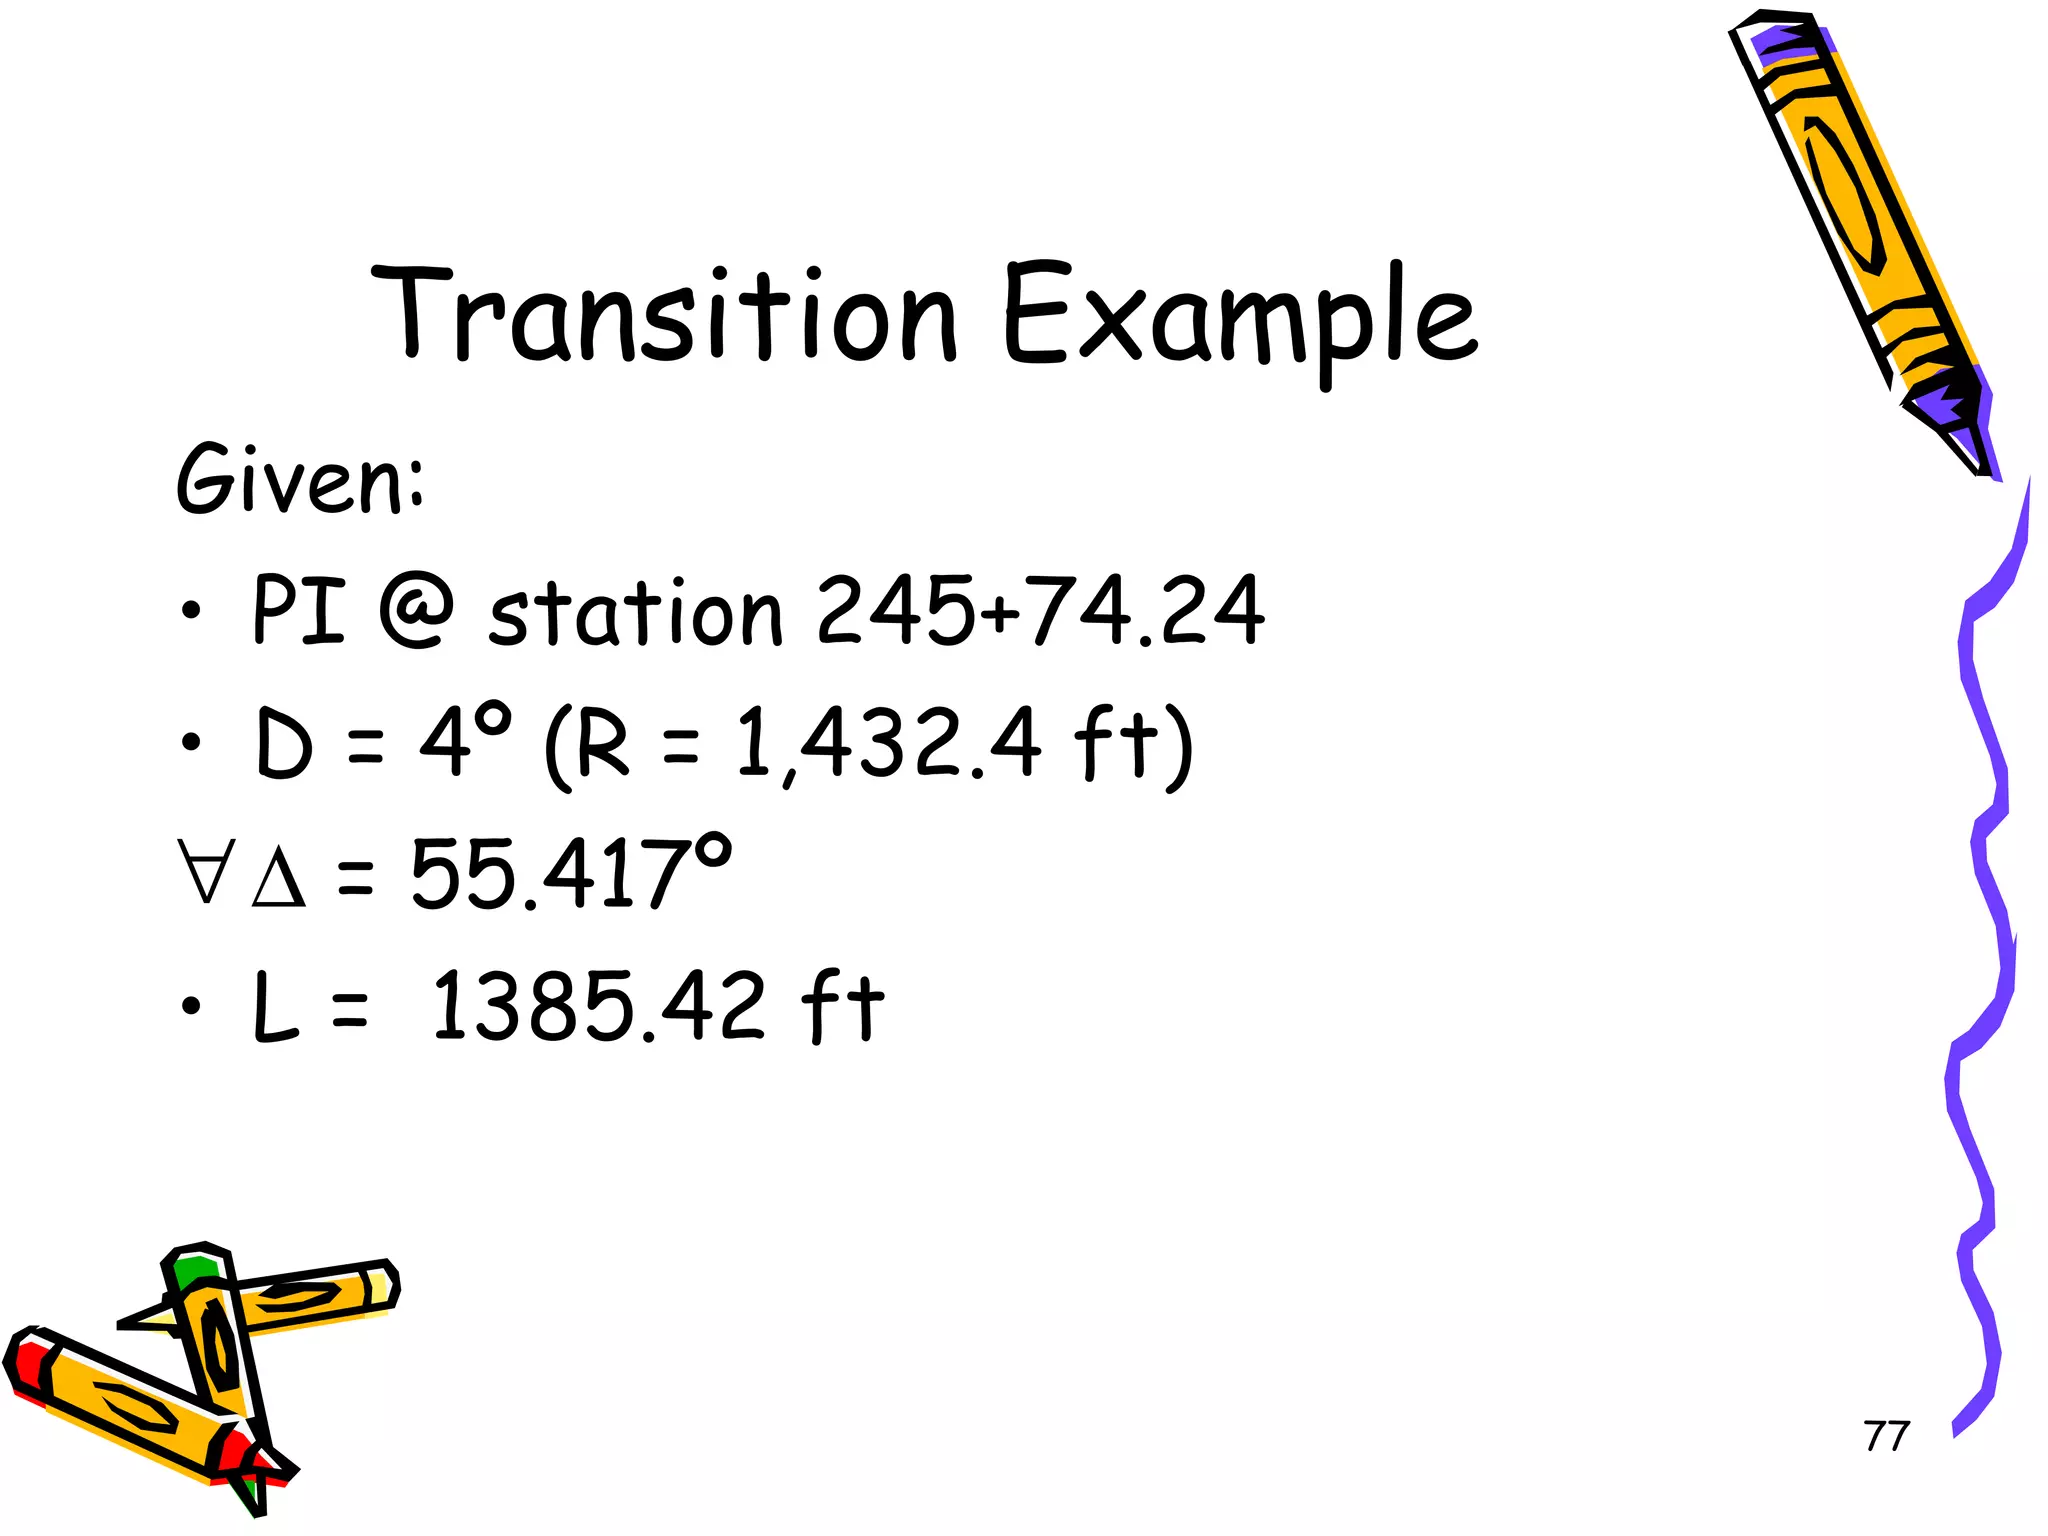
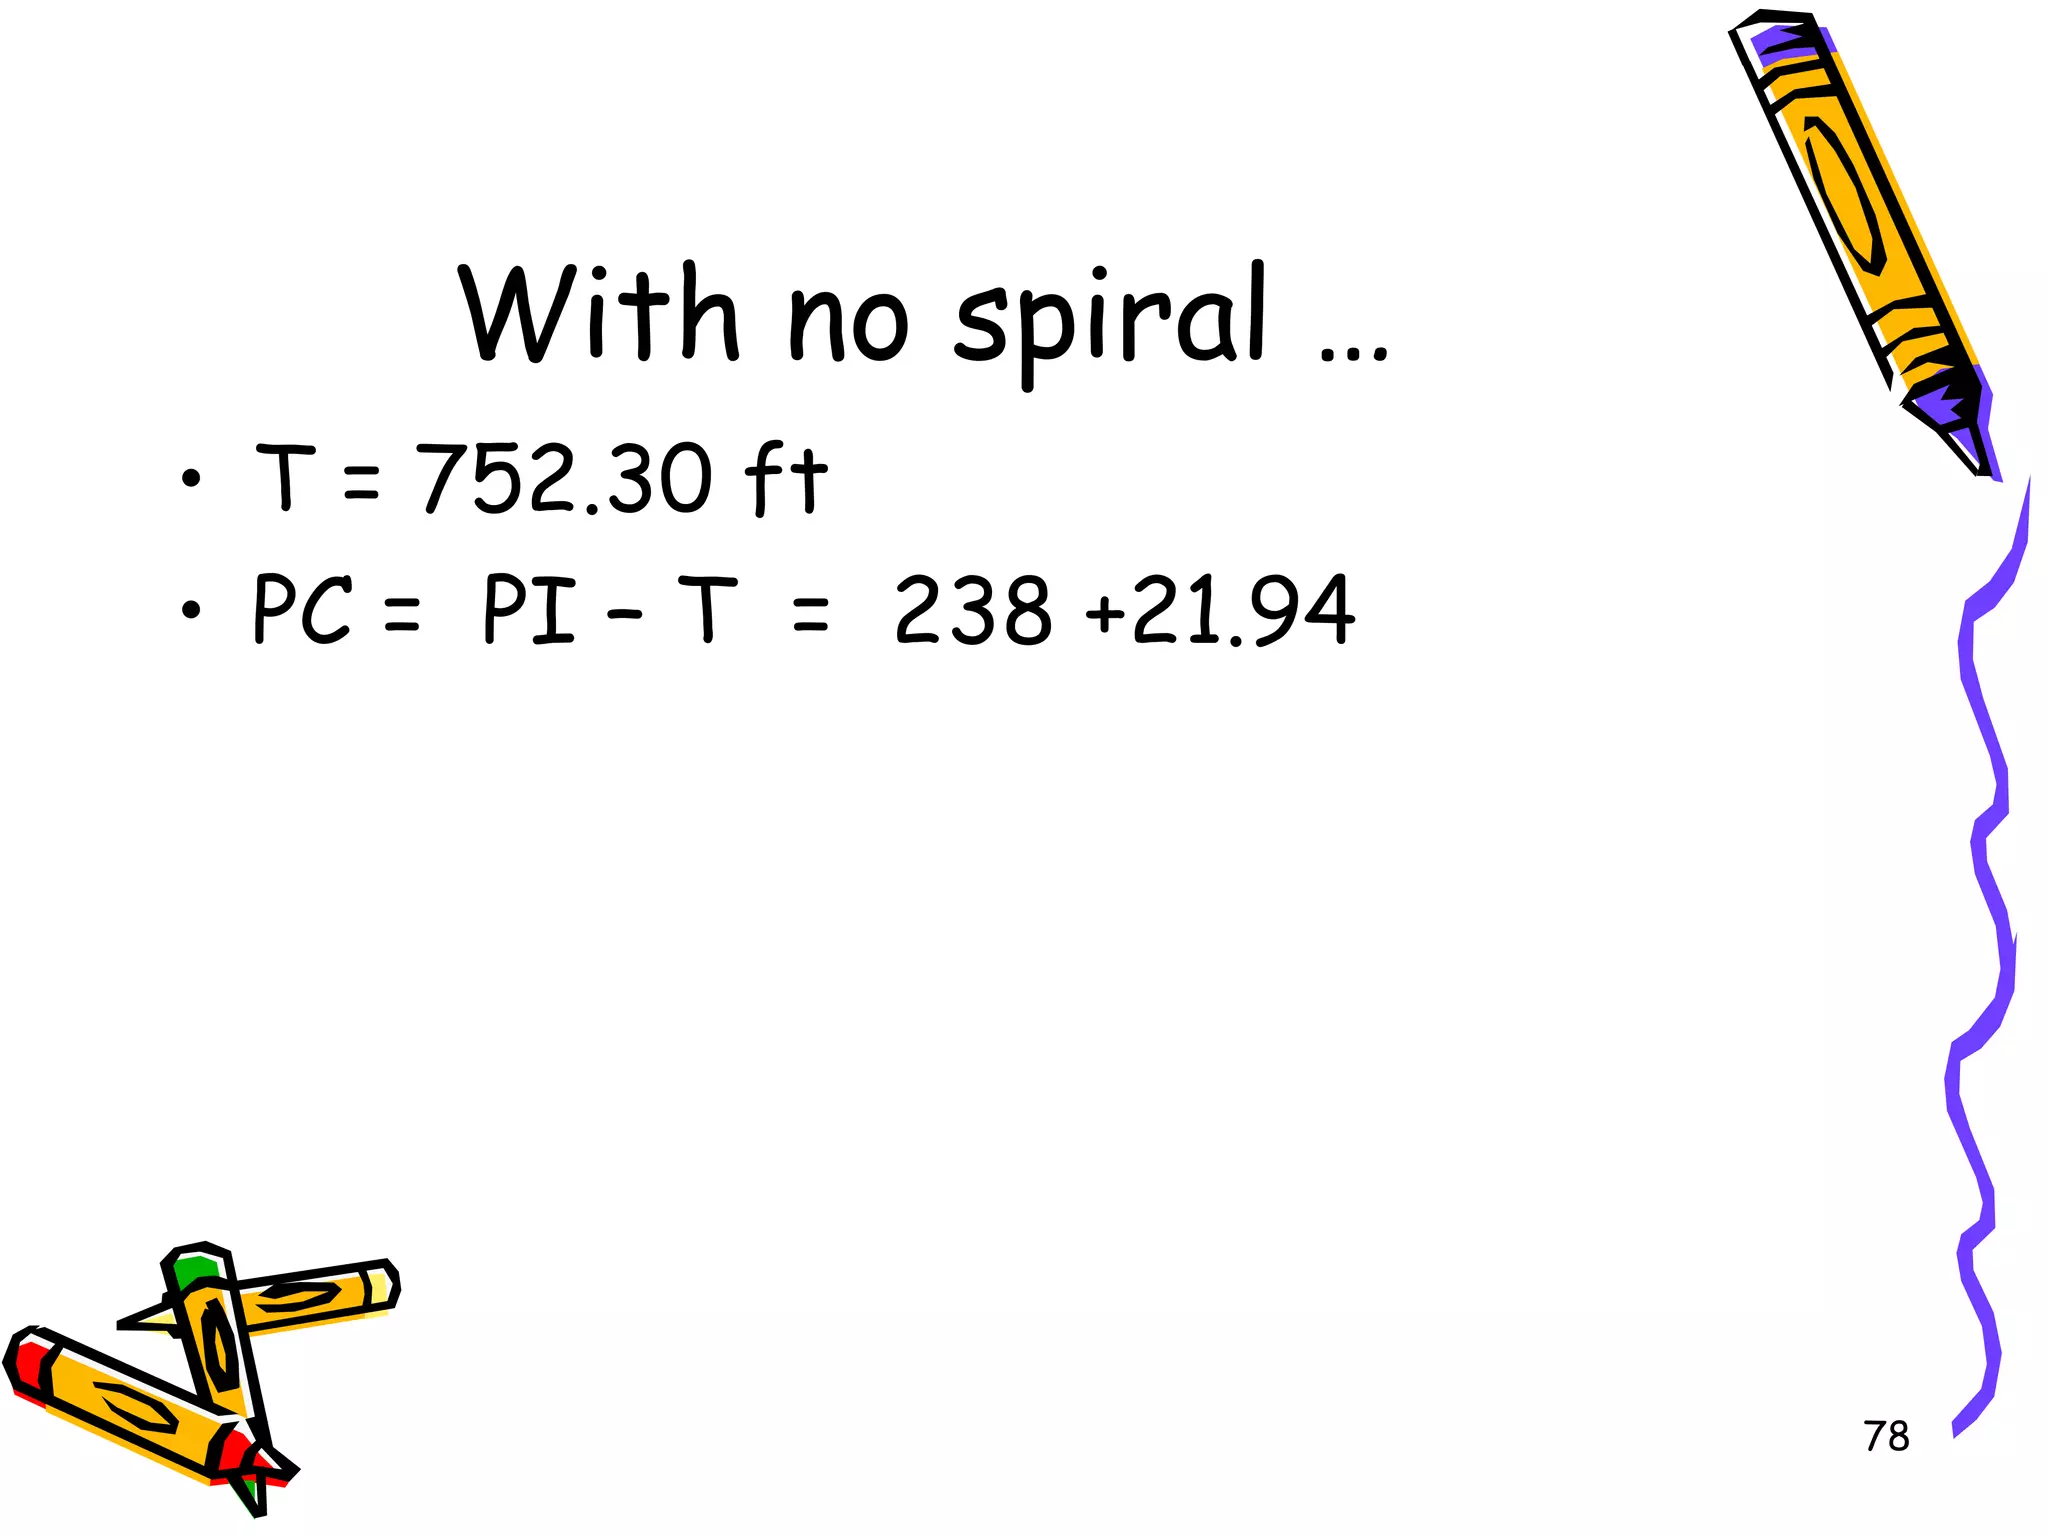
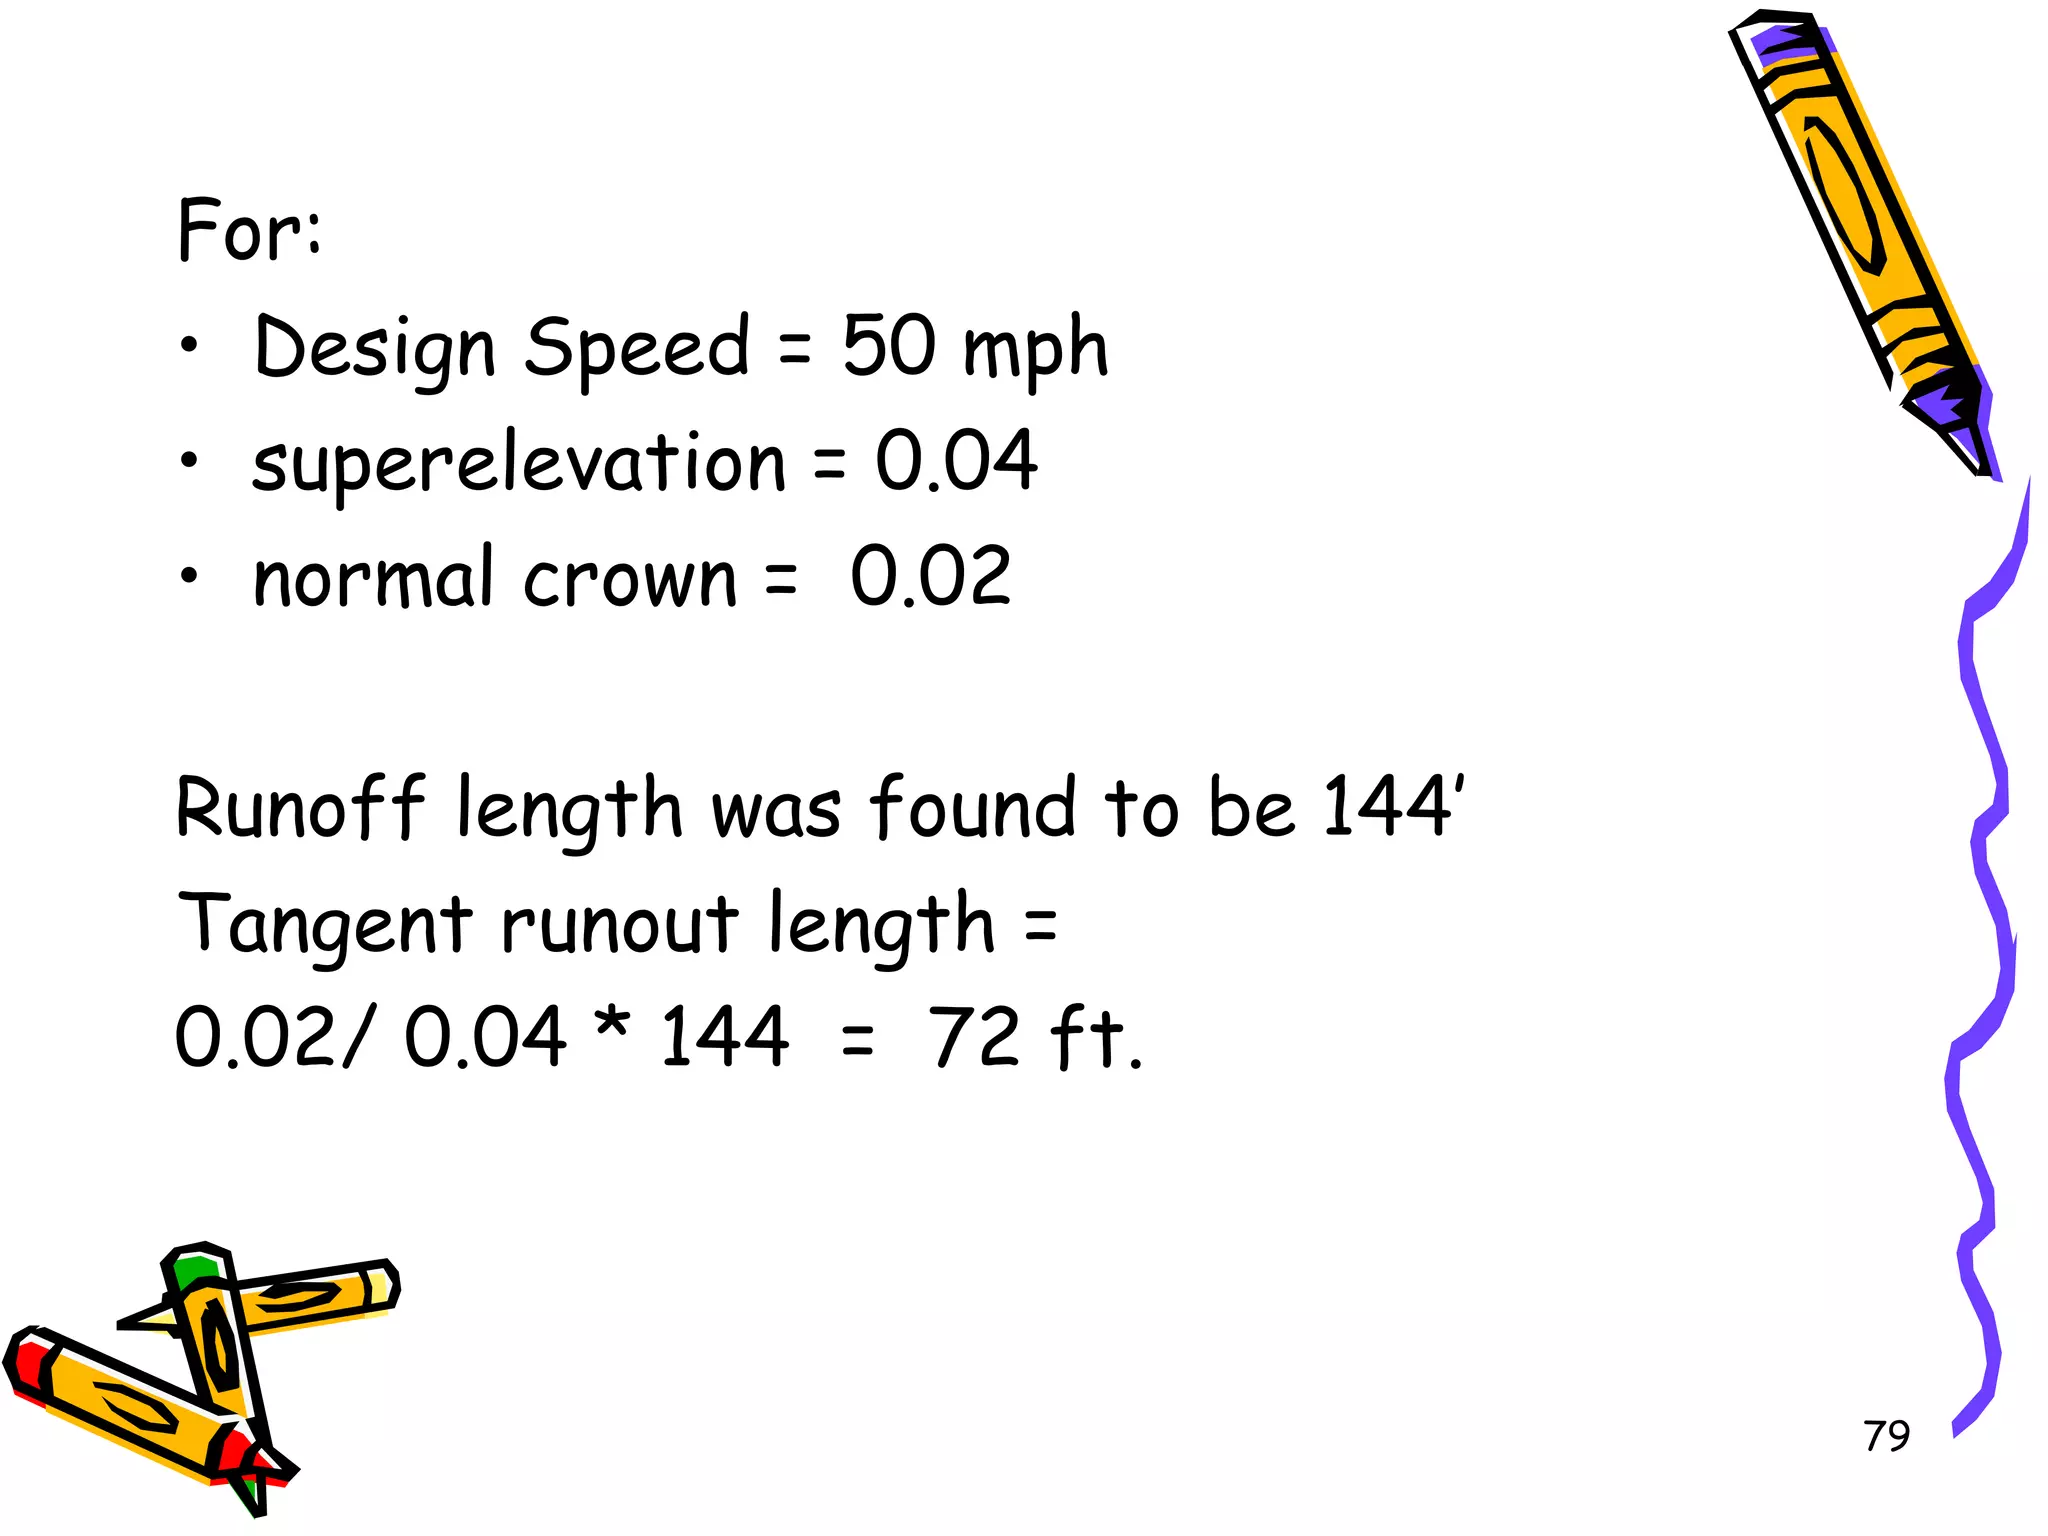
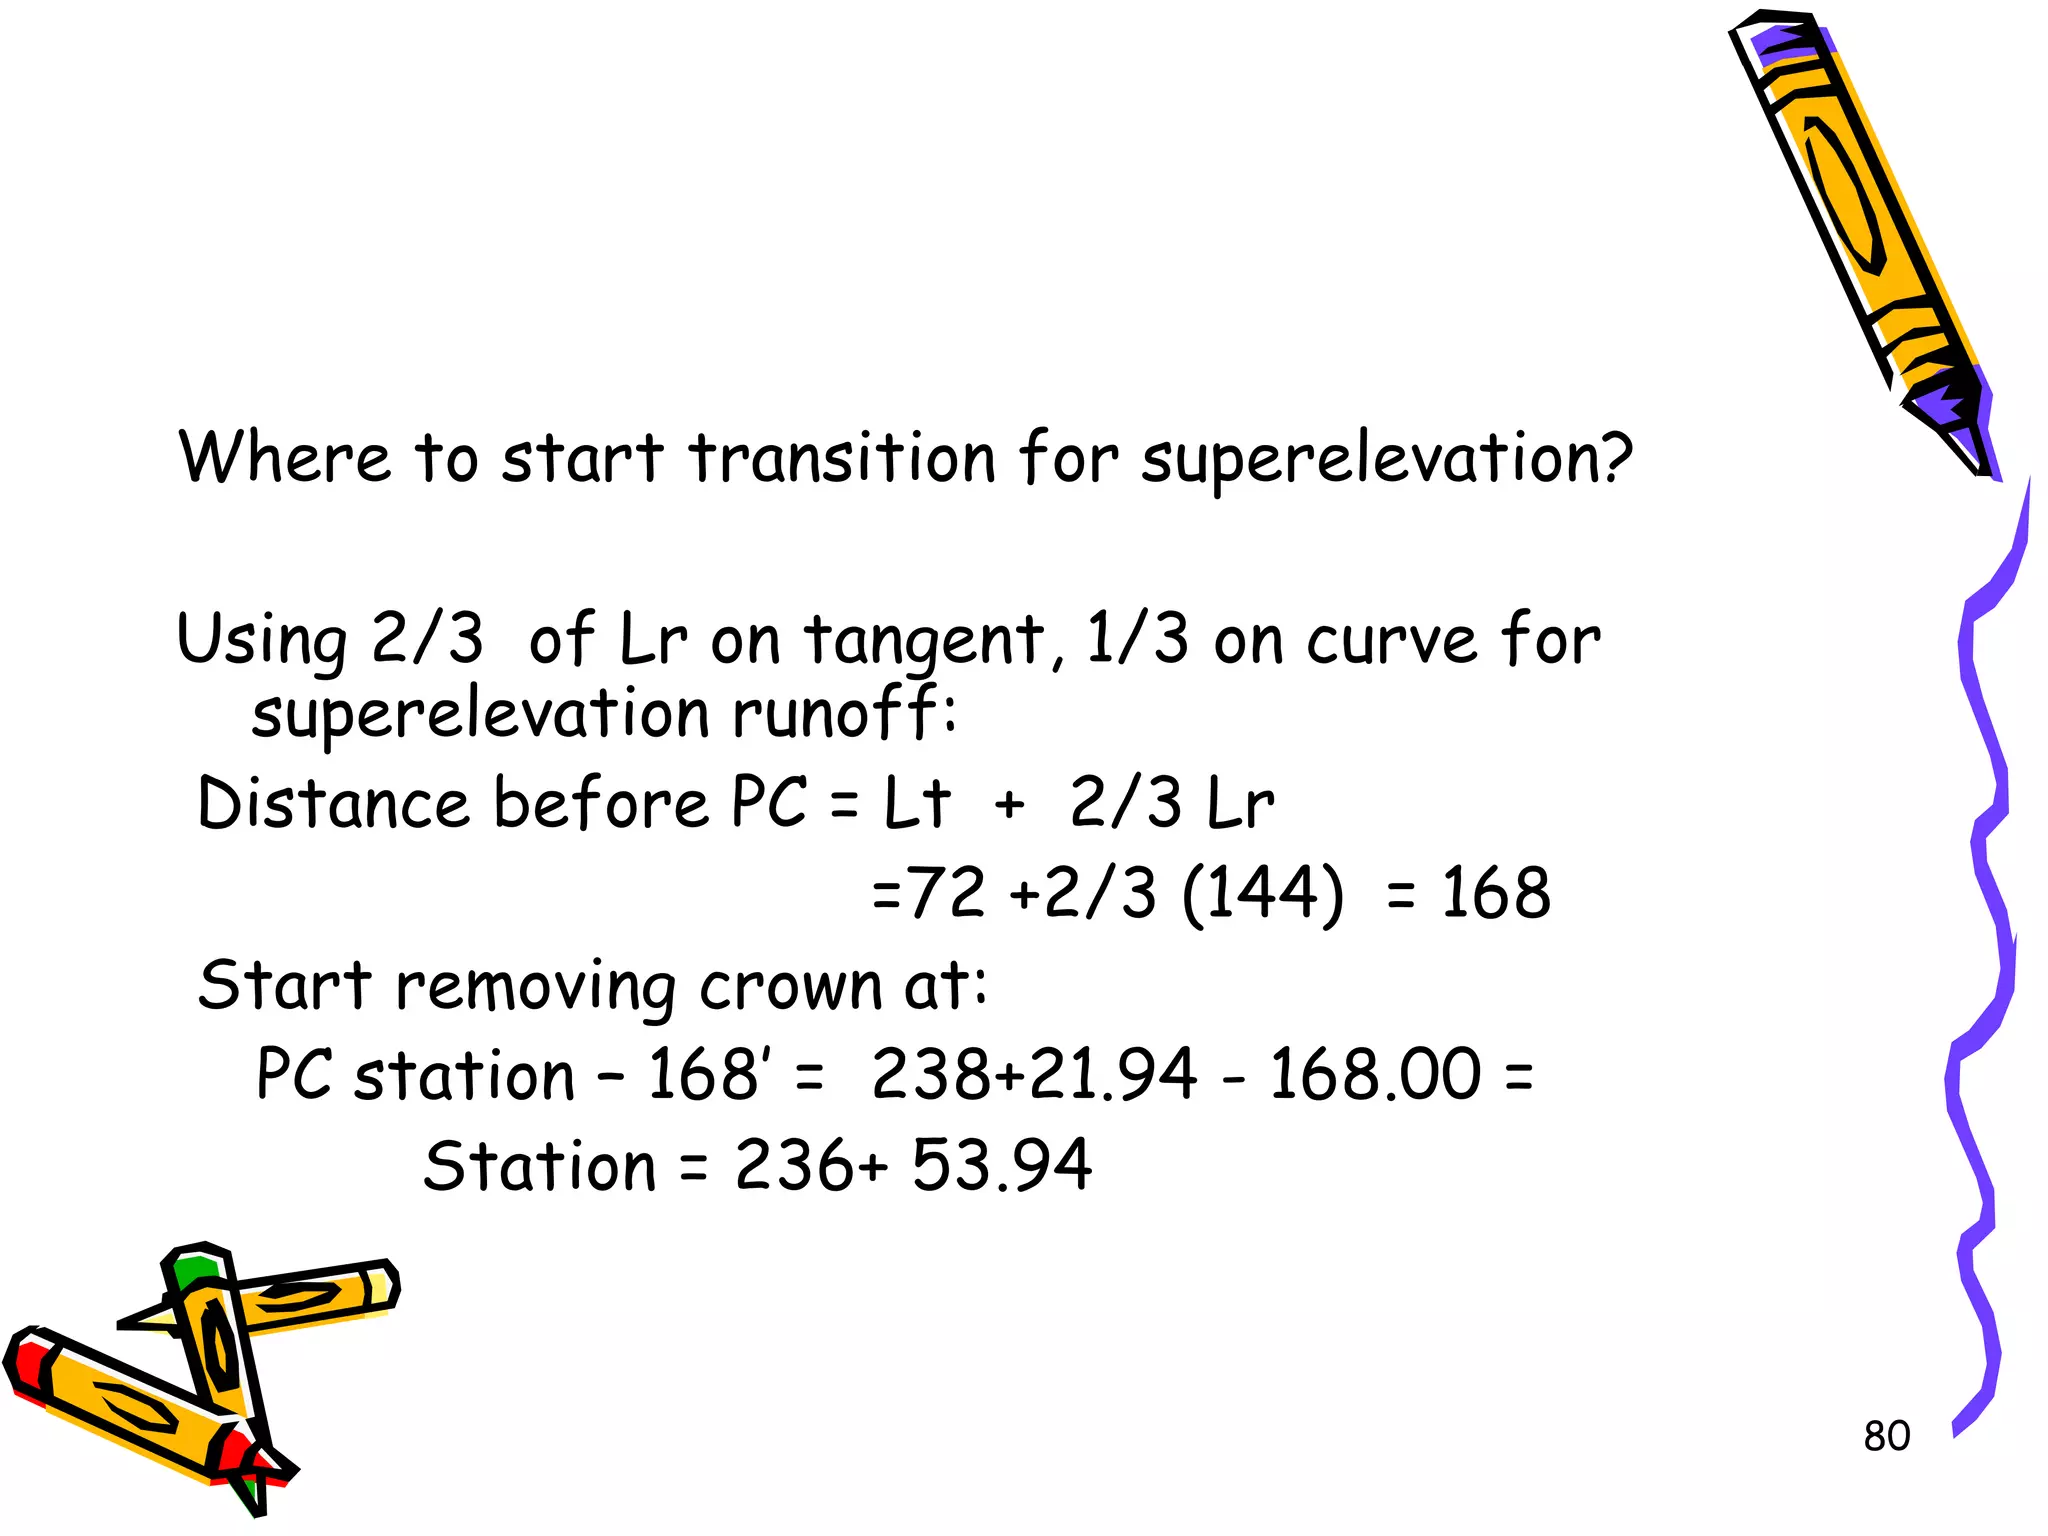
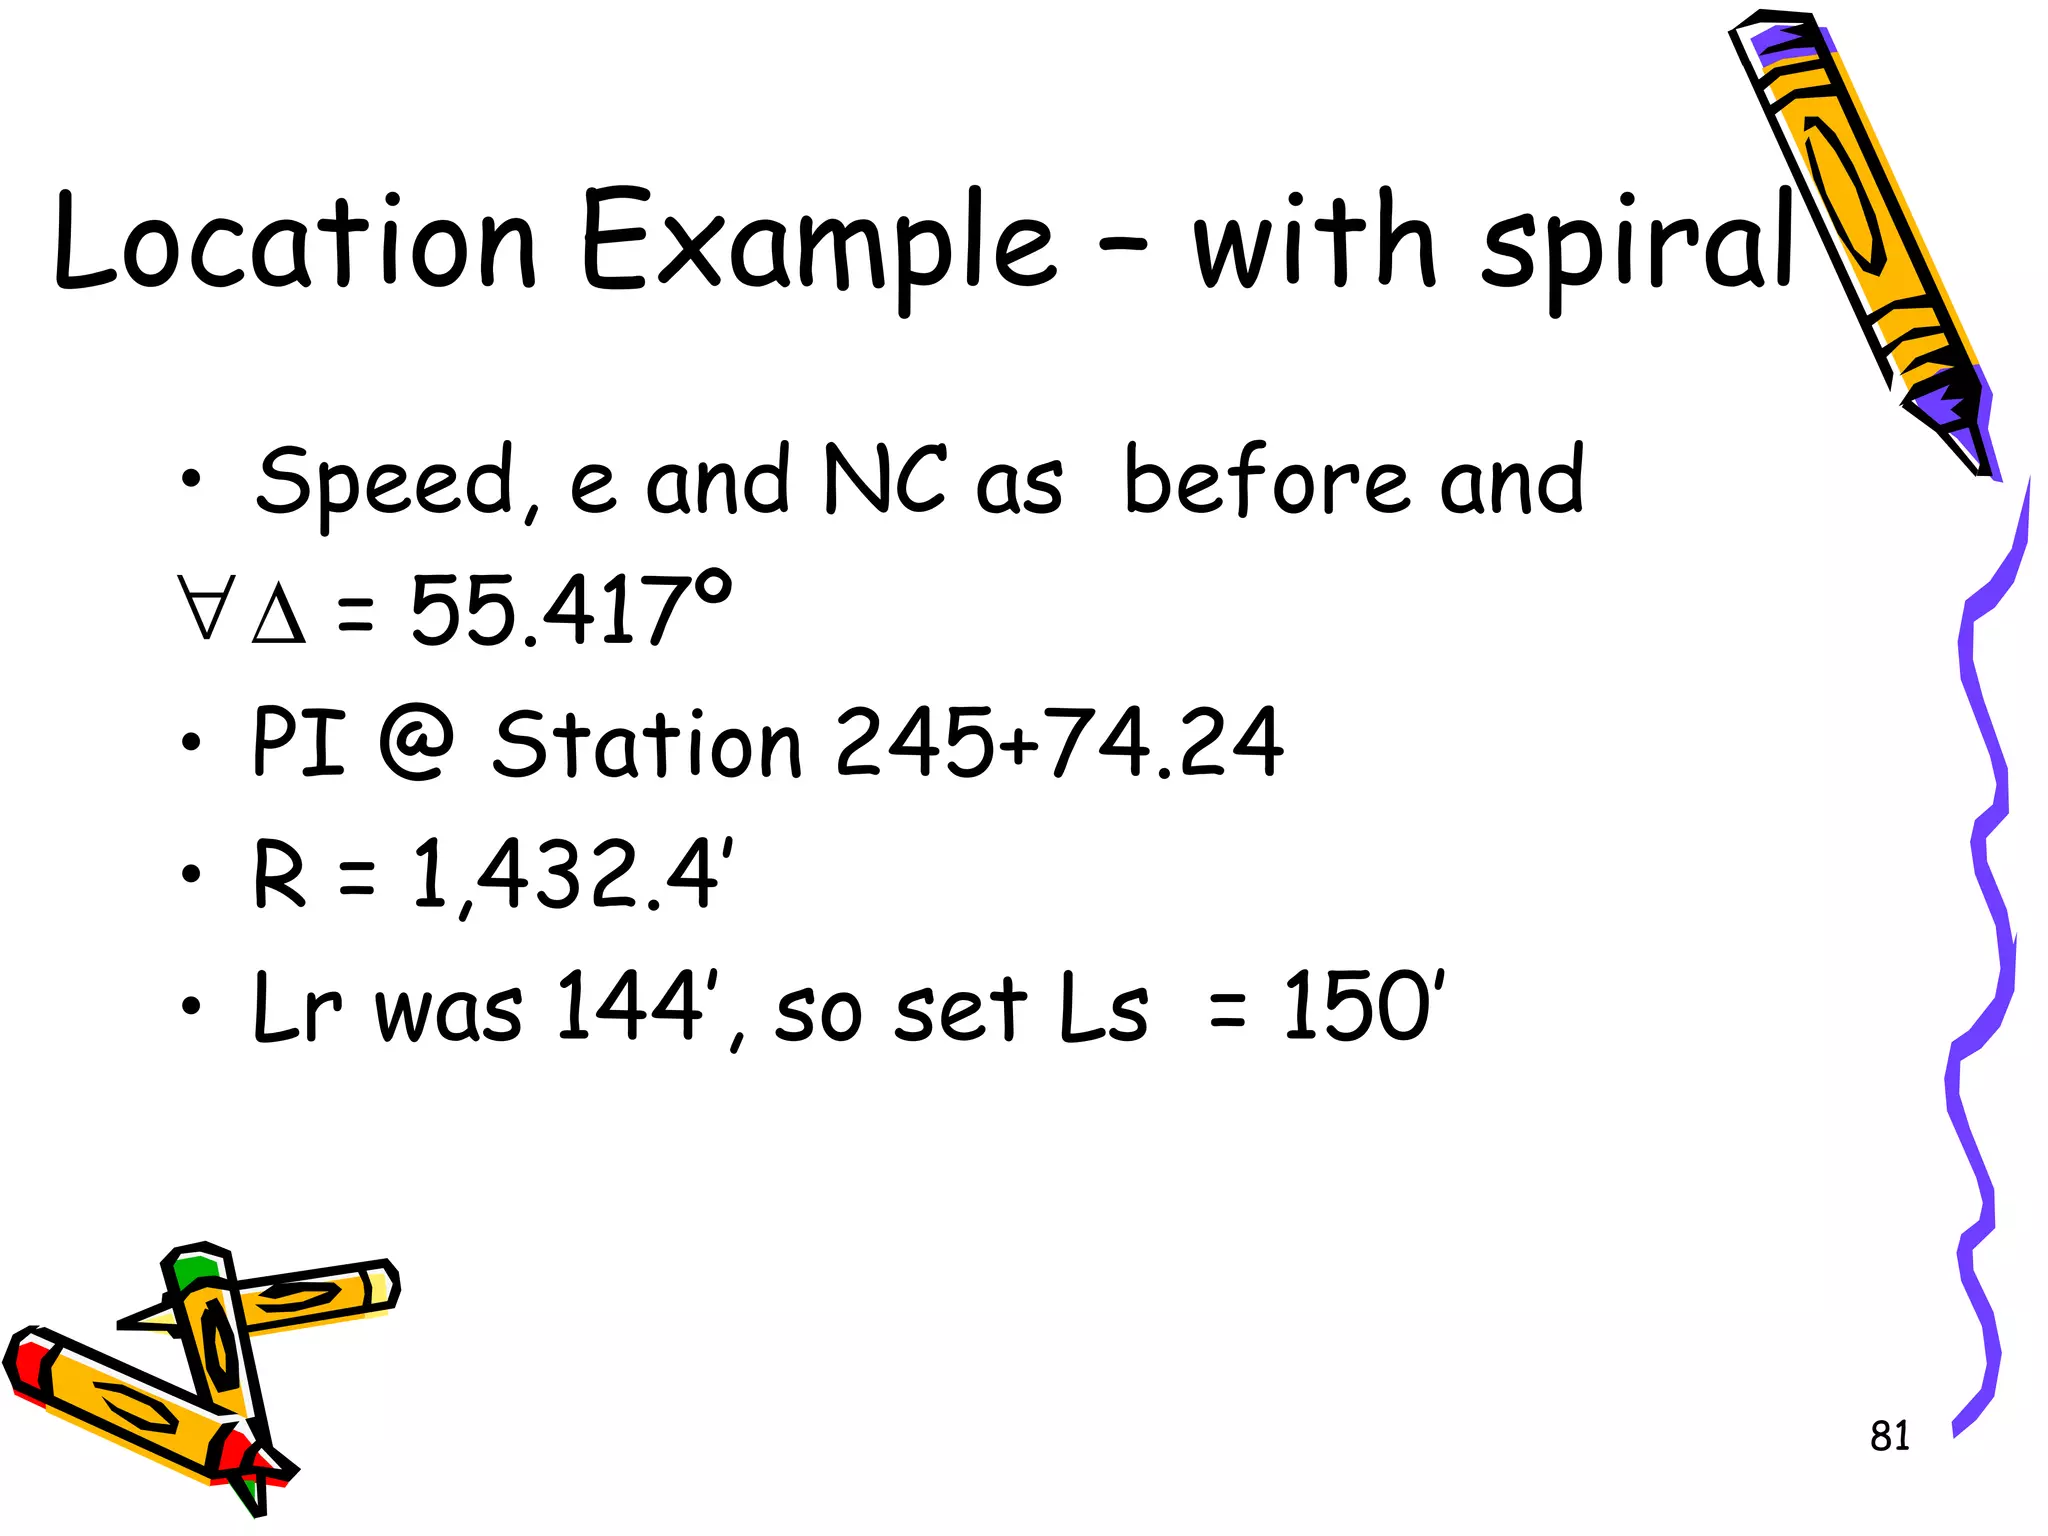
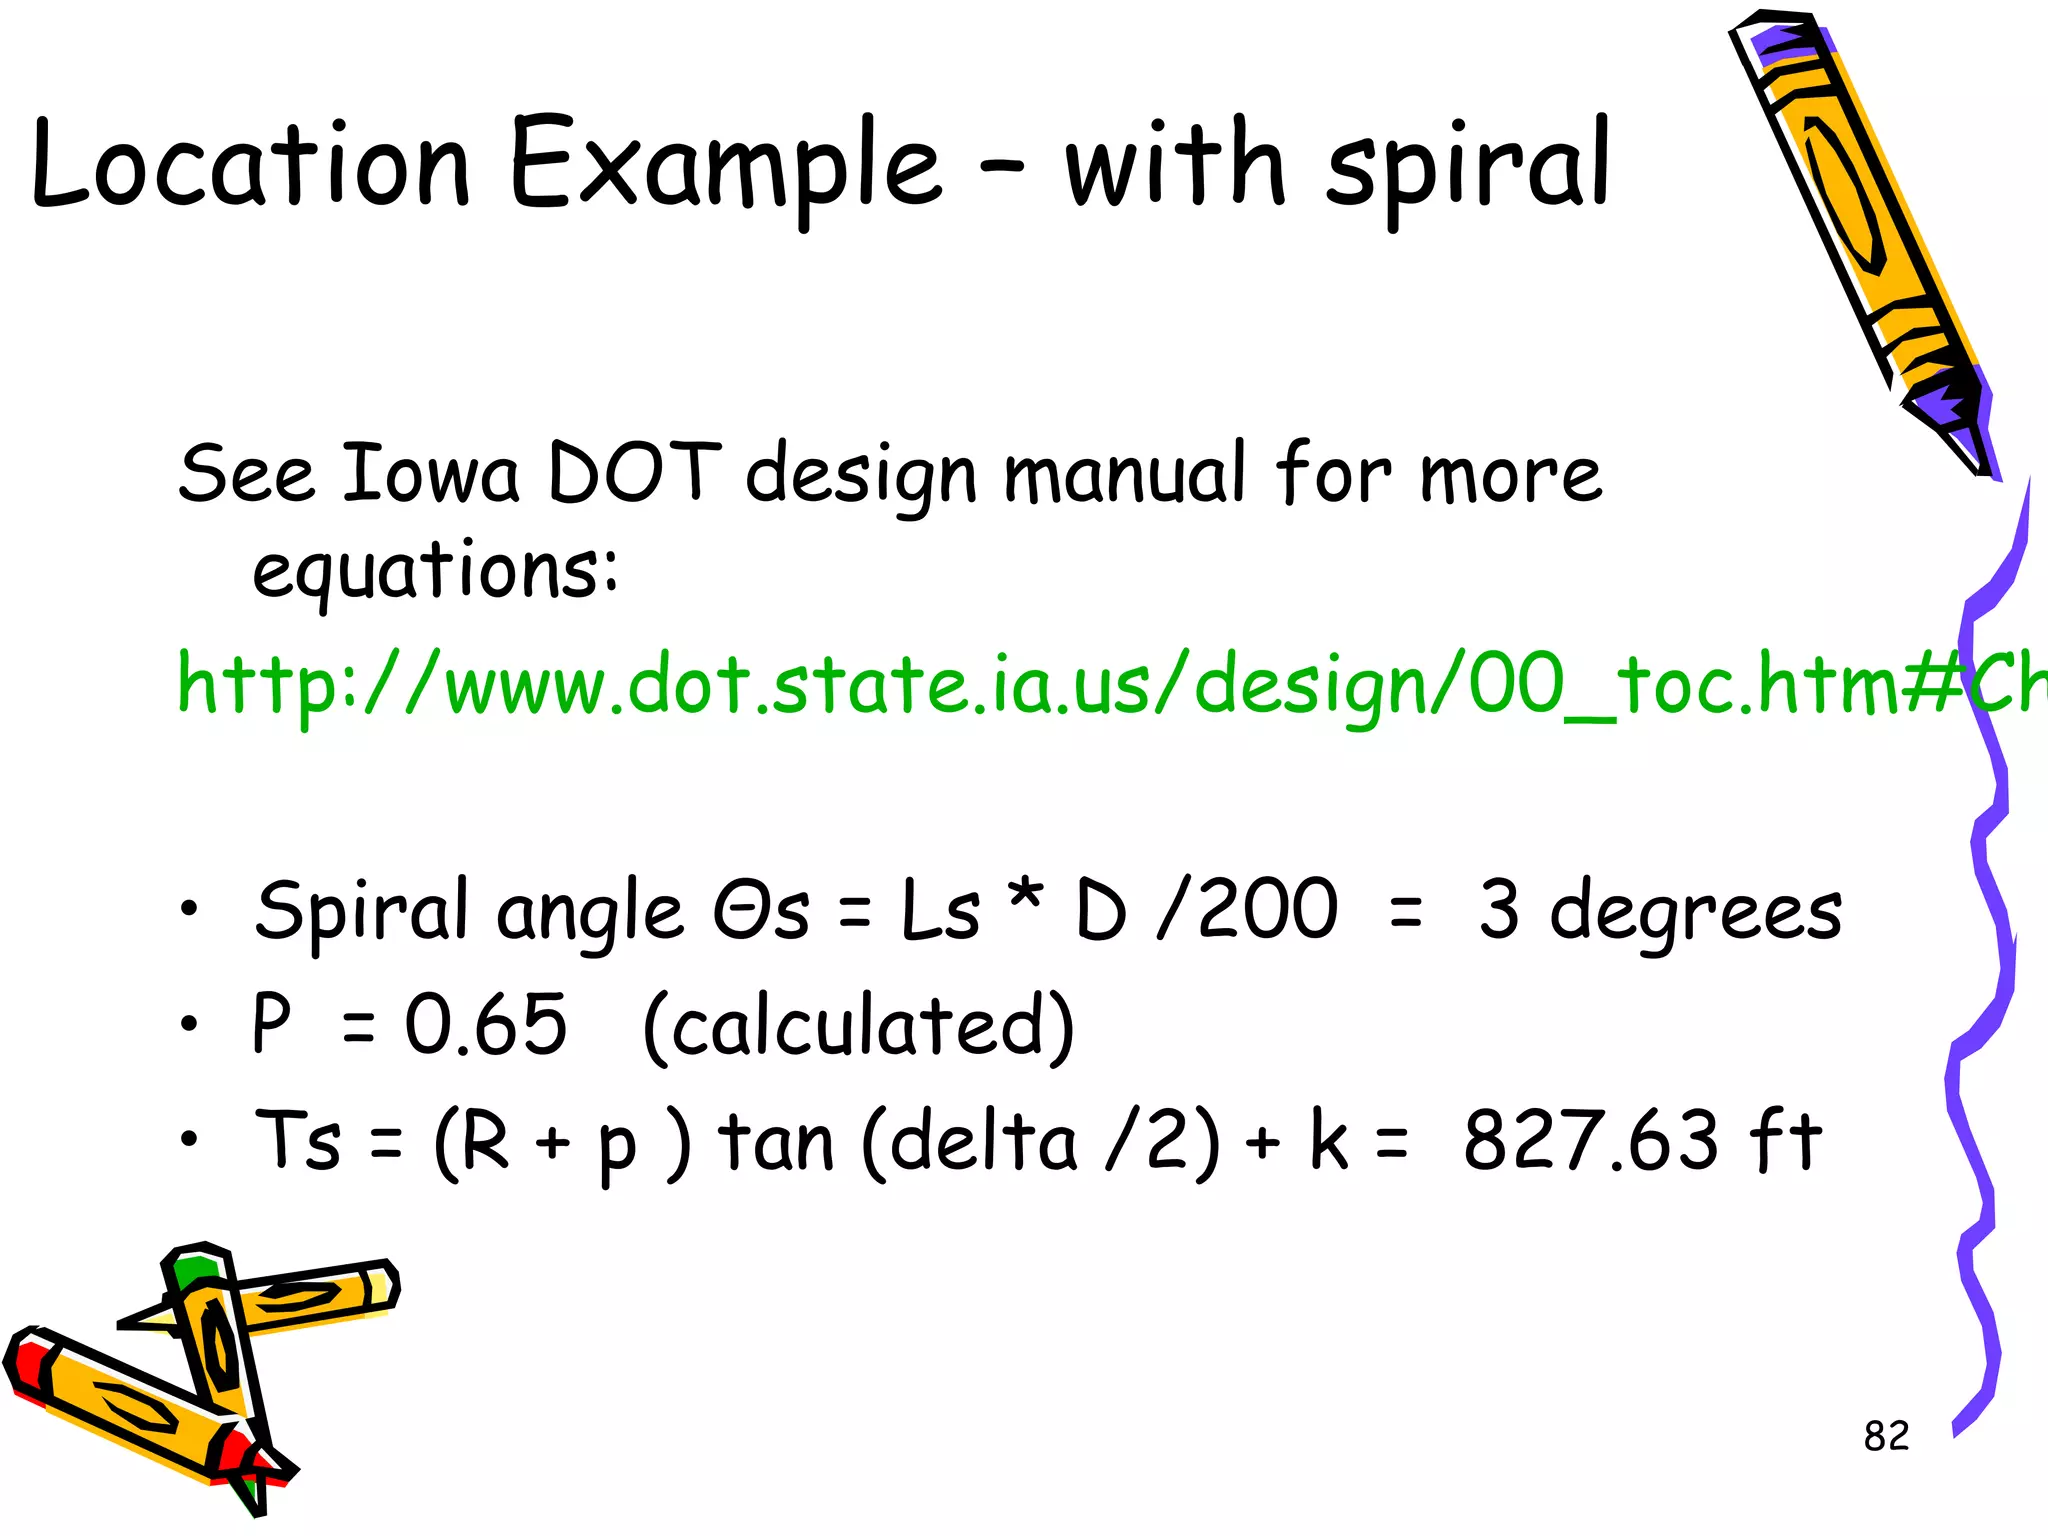
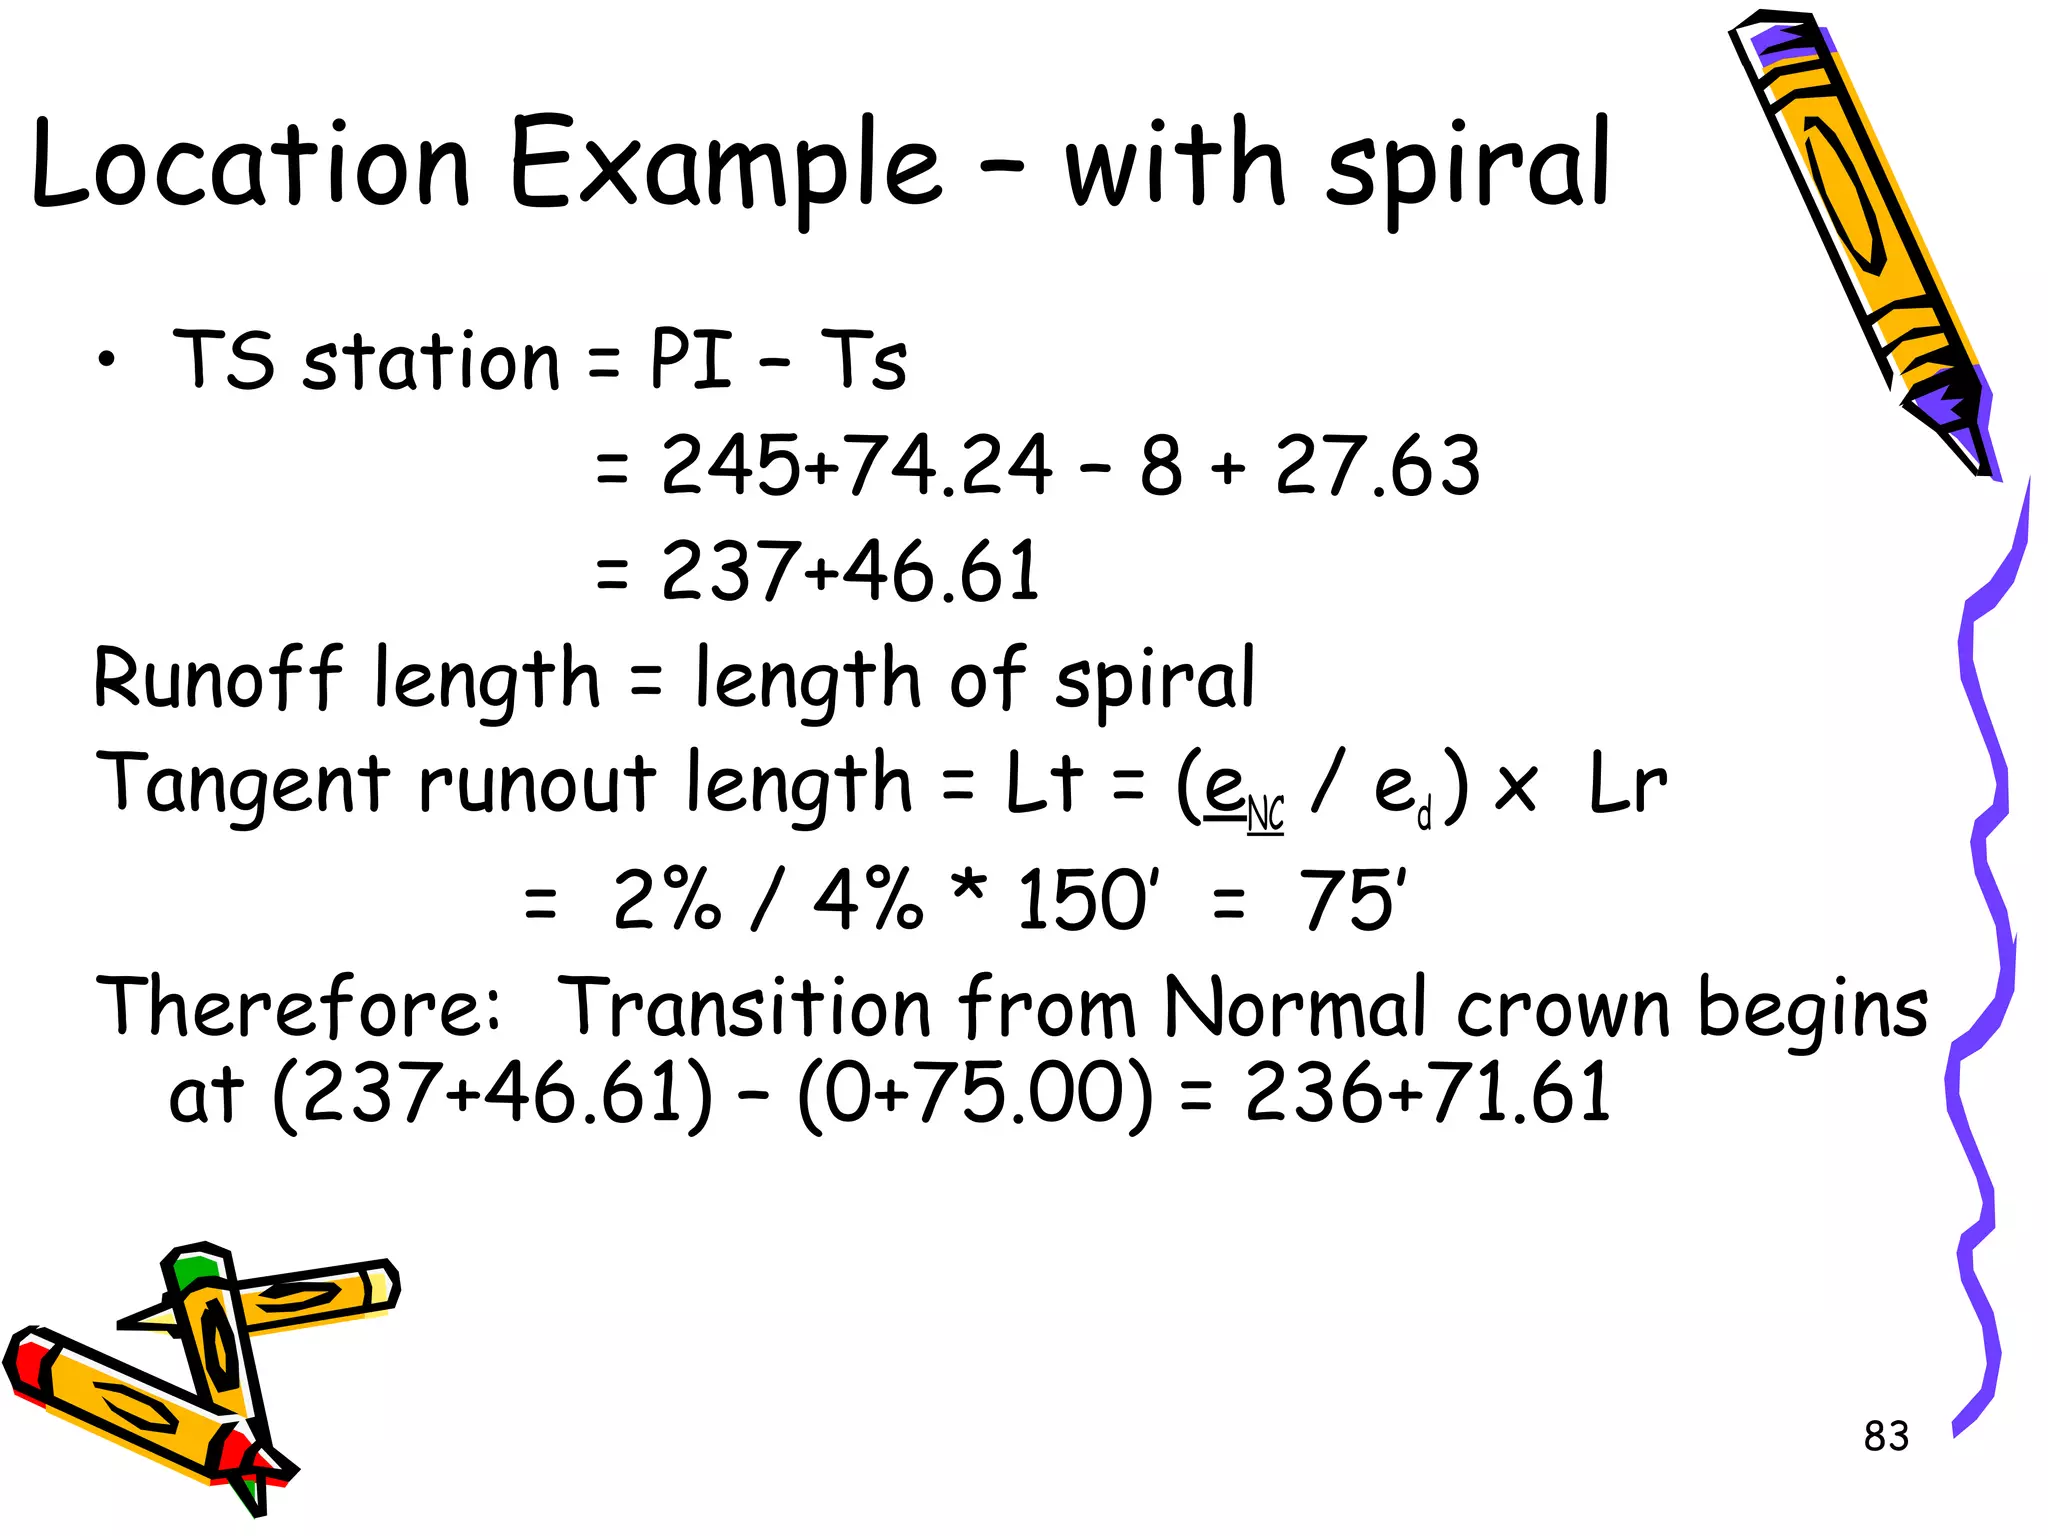
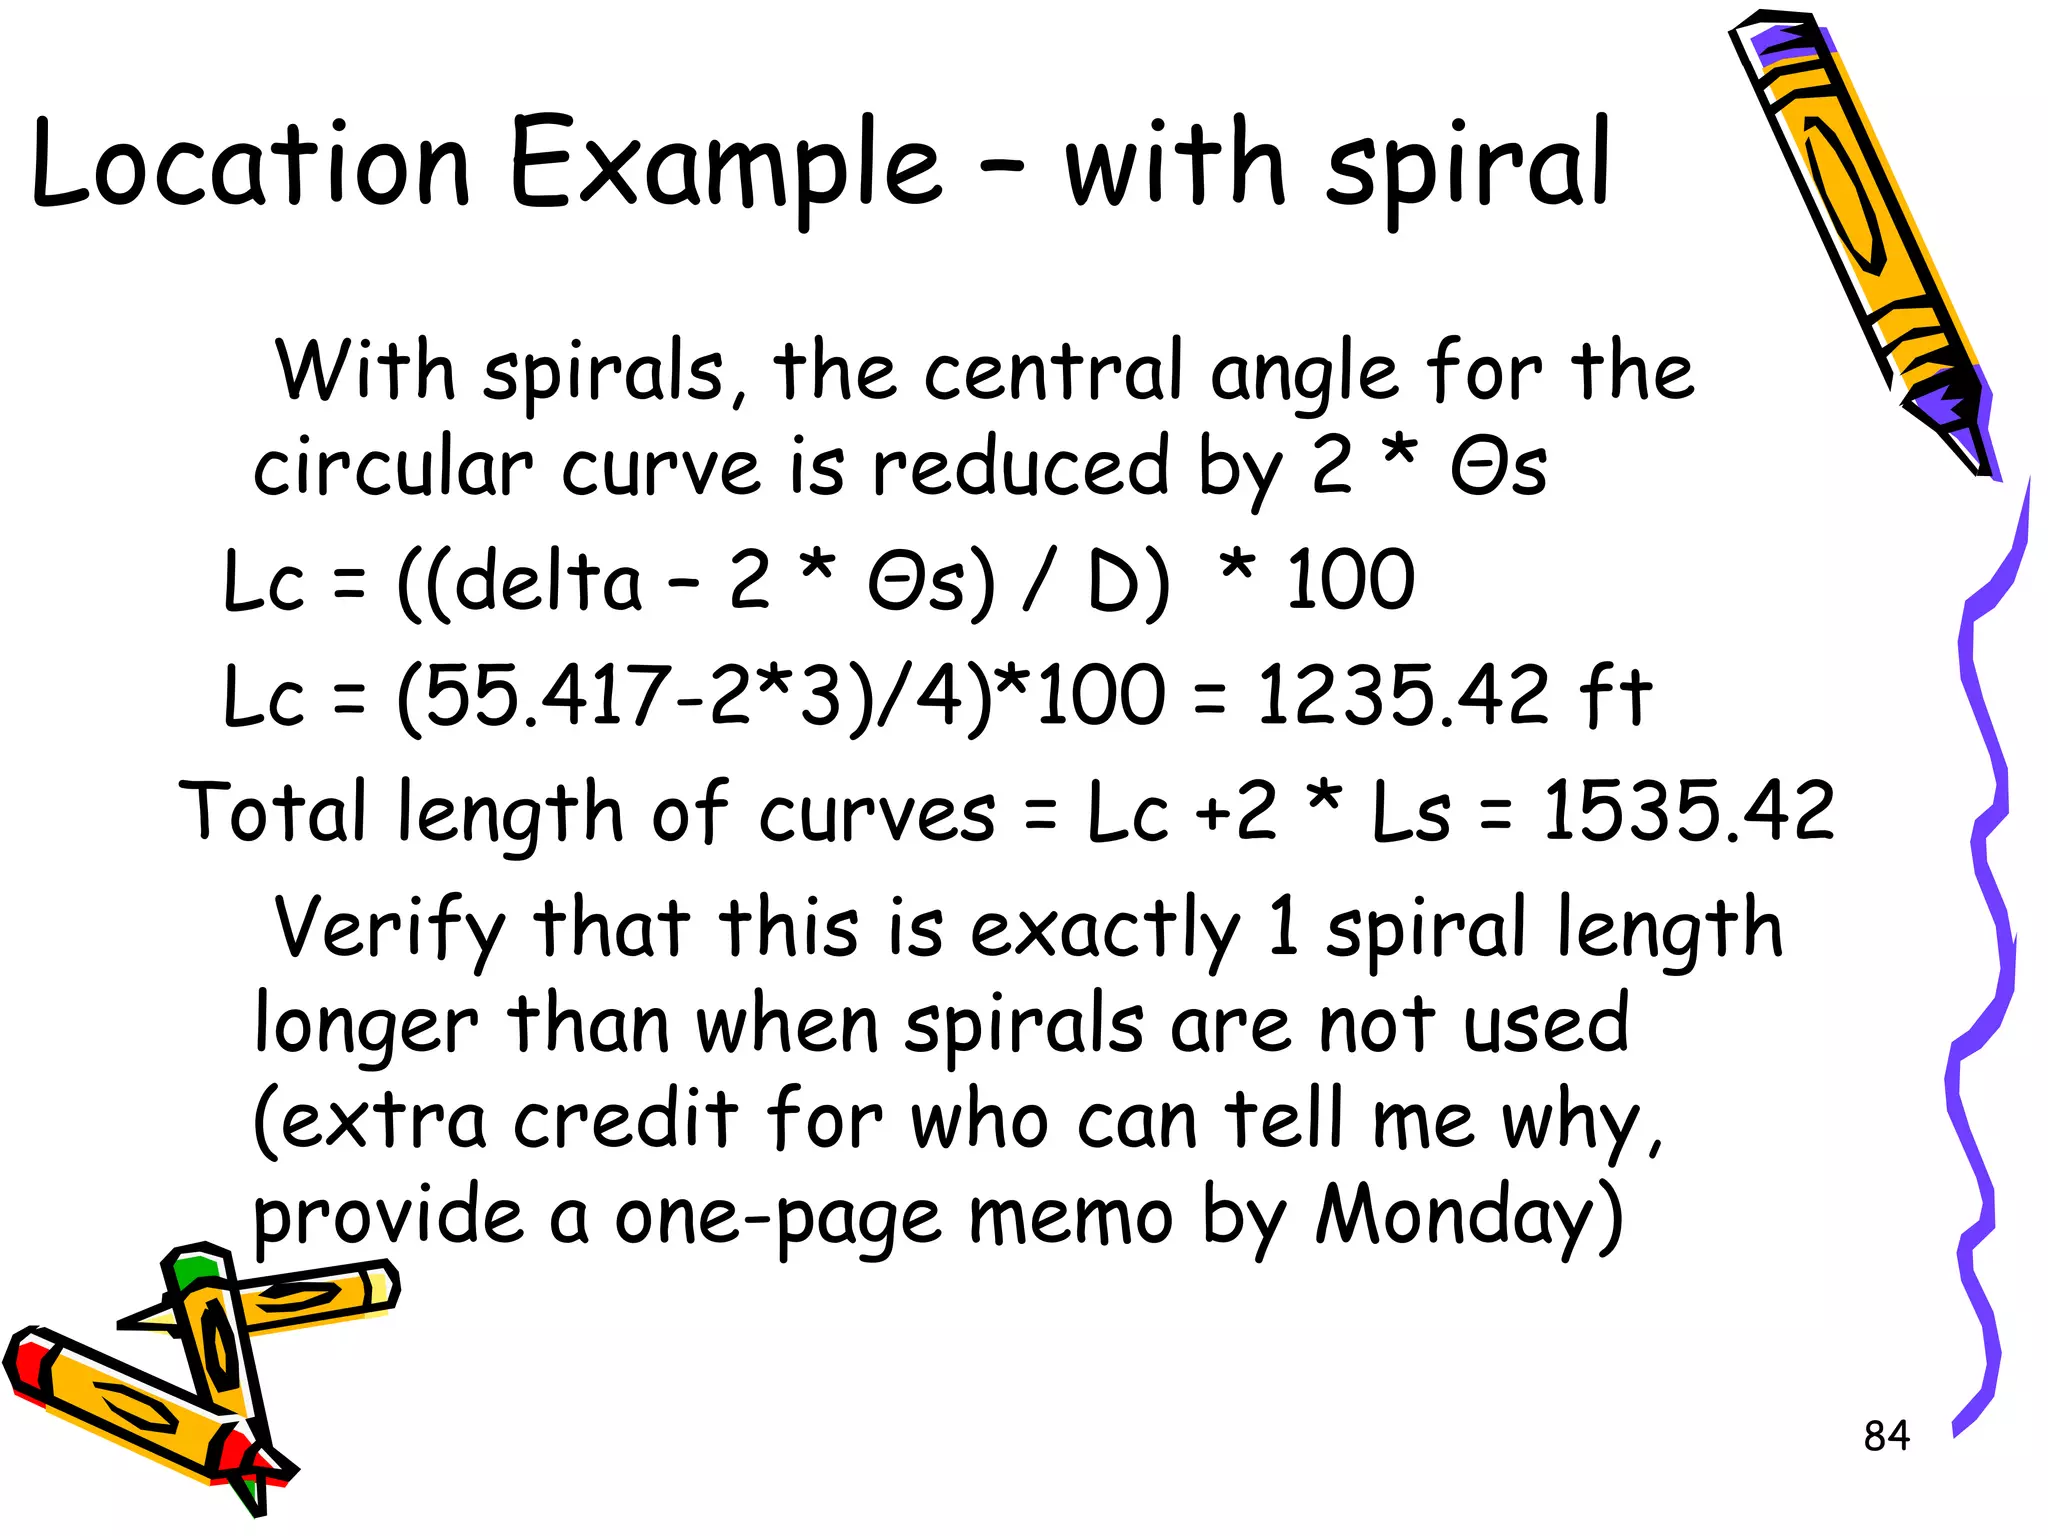
Downloaded 338 times
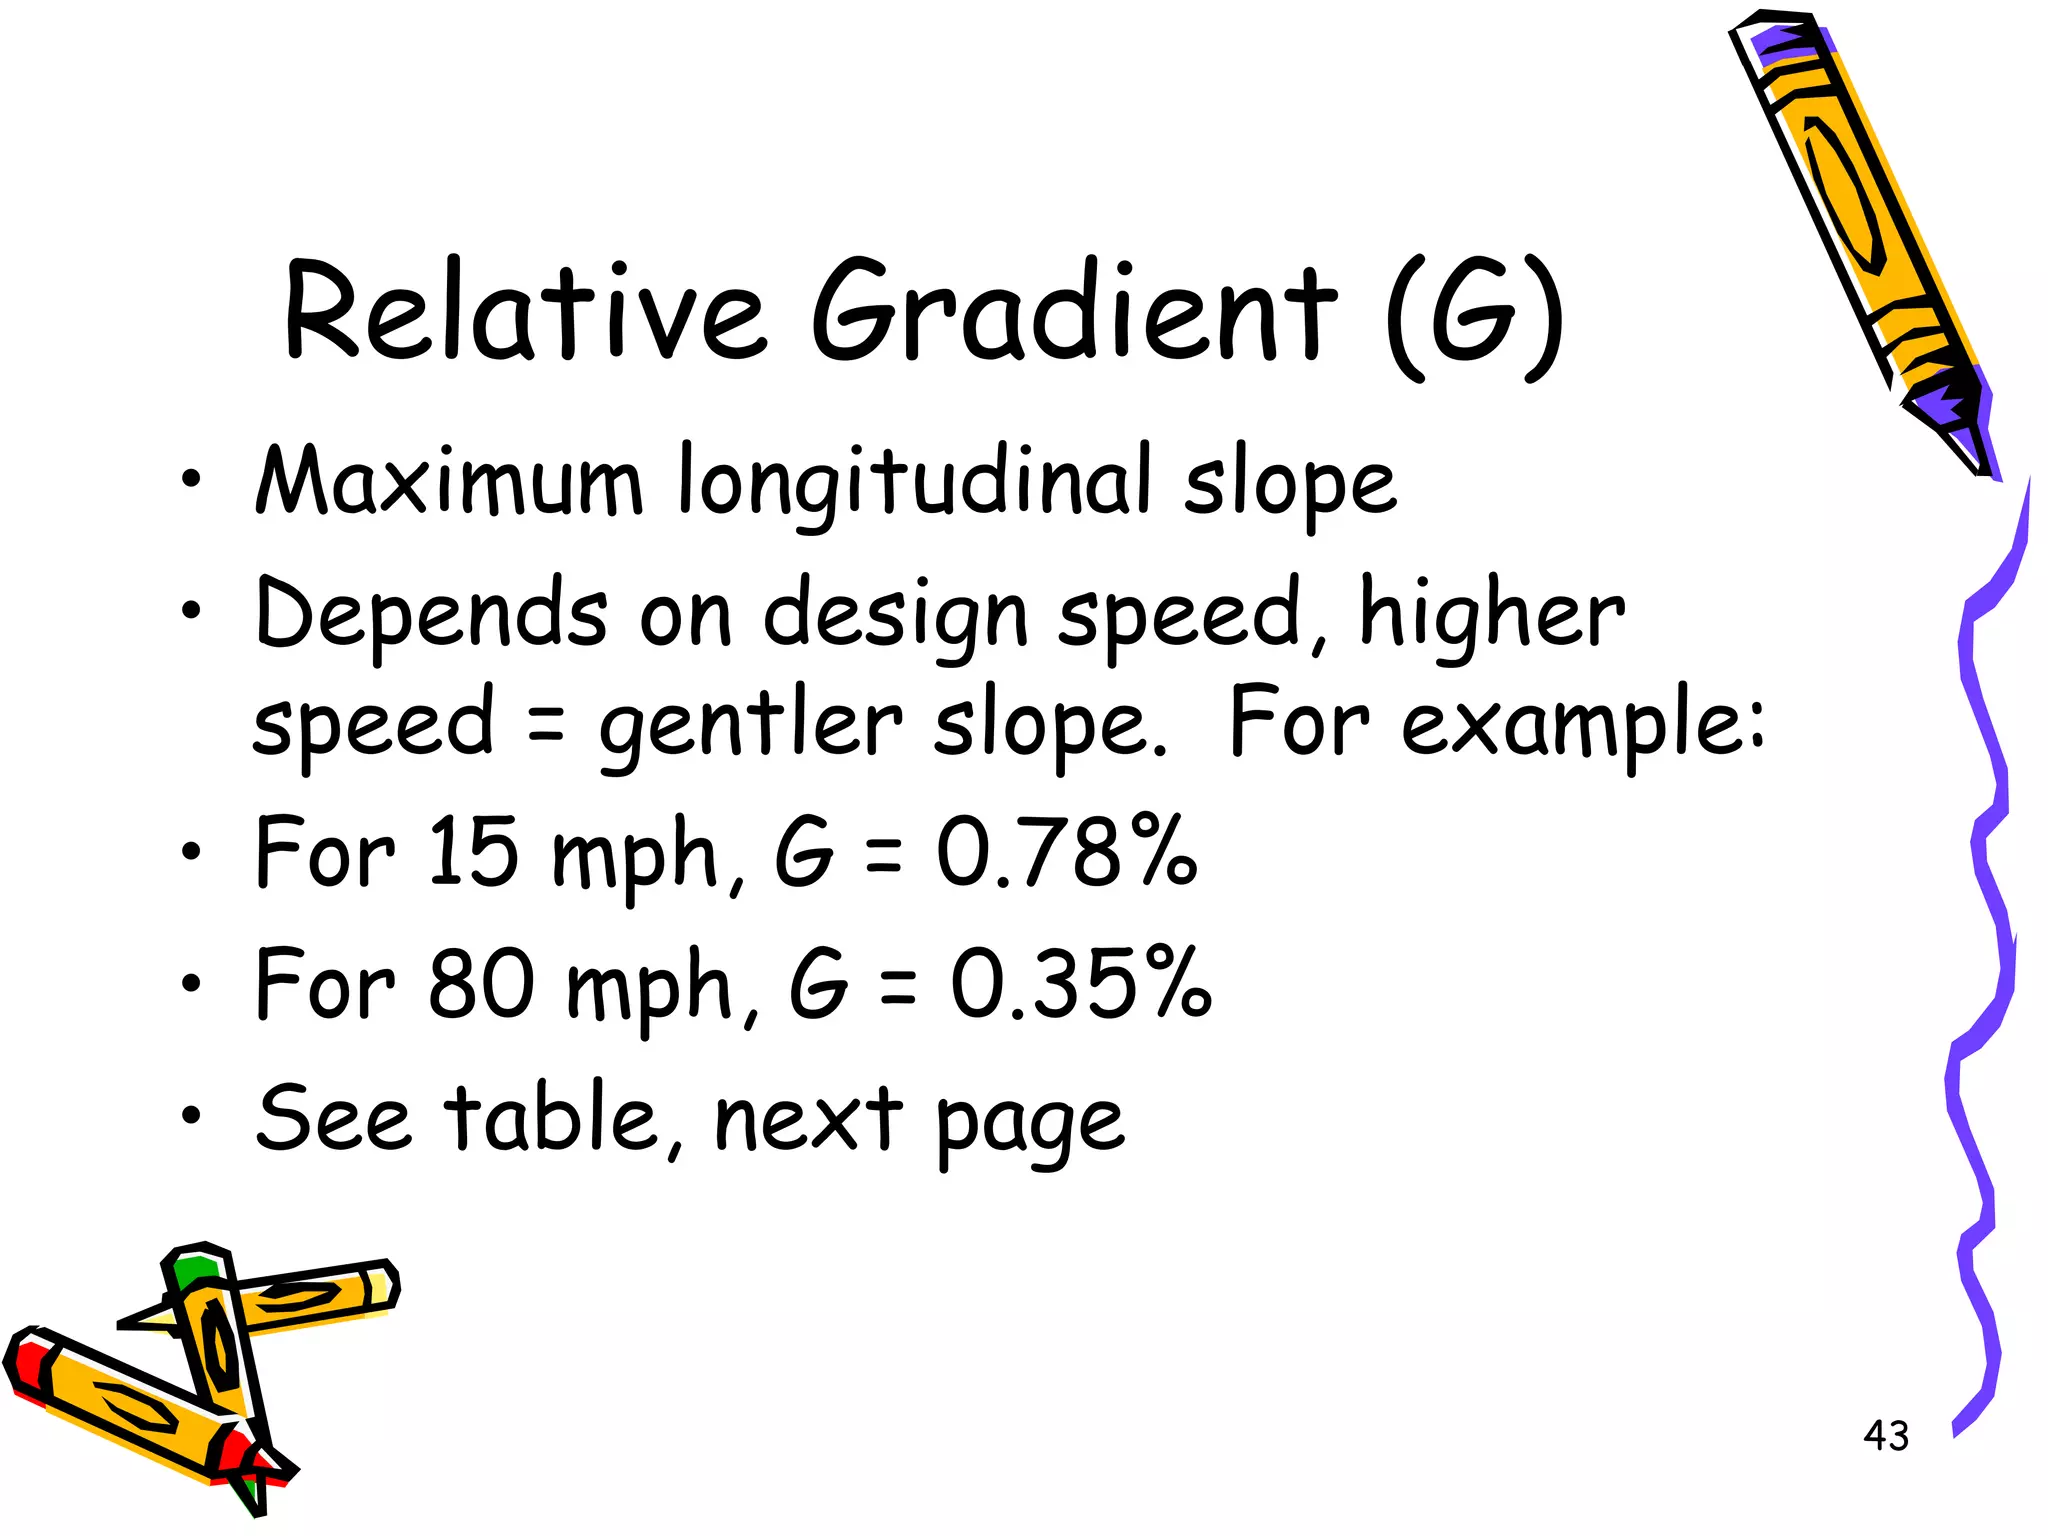
![5
Middle ordinate
• Location of object along chord length that
blocks line of sight around the curve
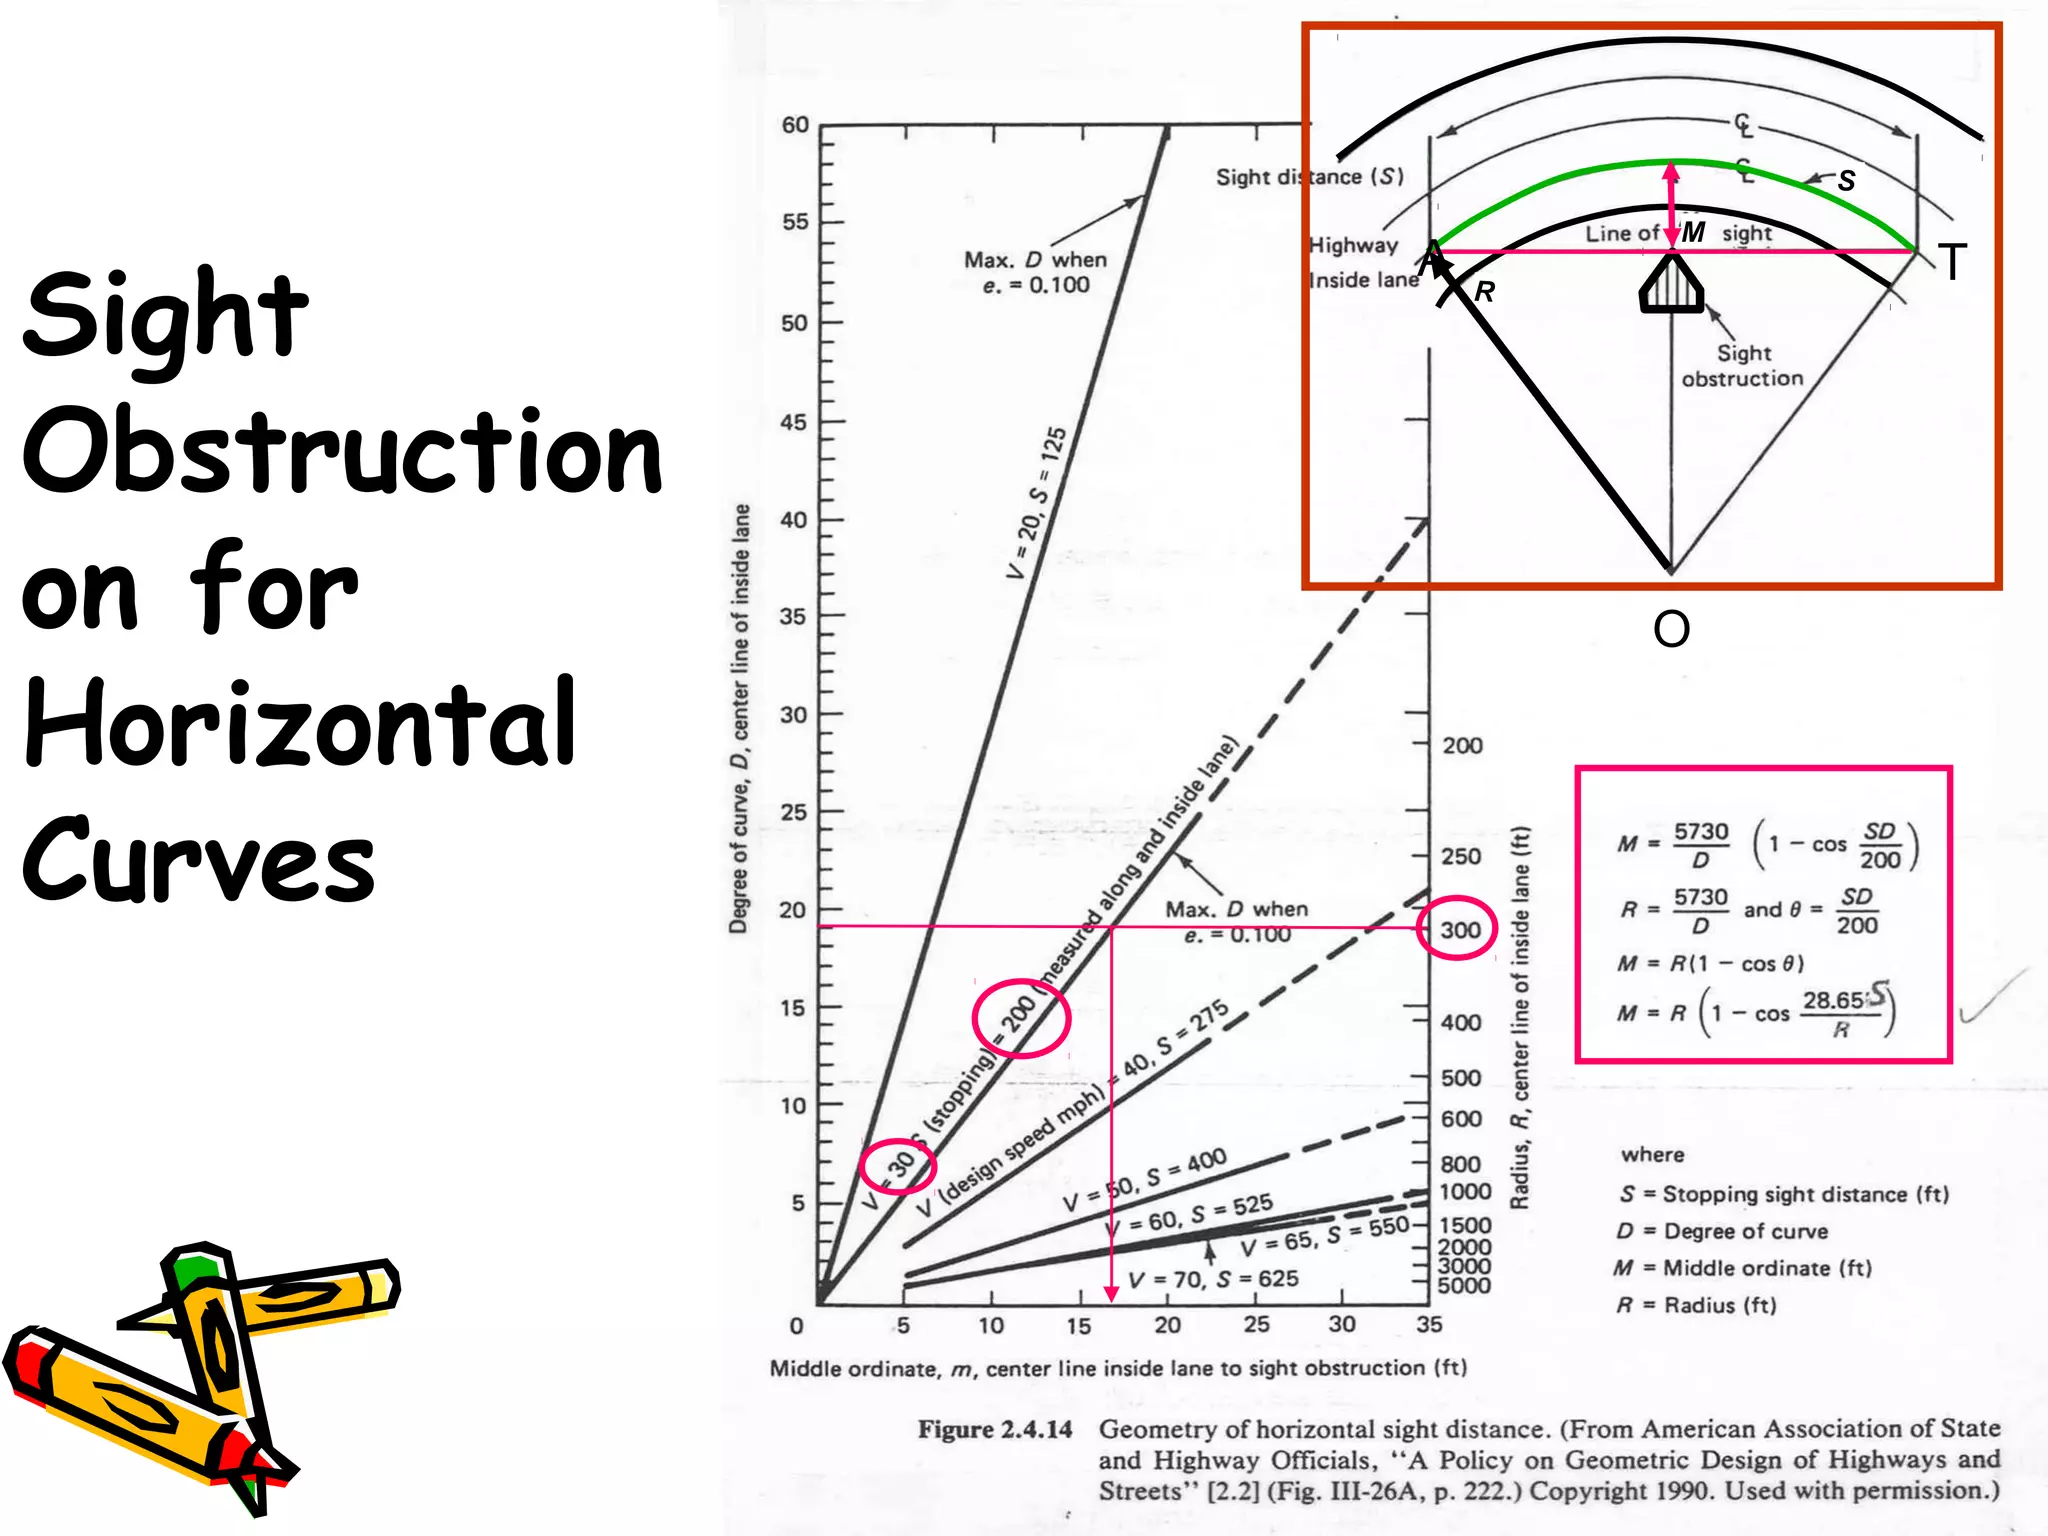
• m = R(1 – cos [28.65 S])
R
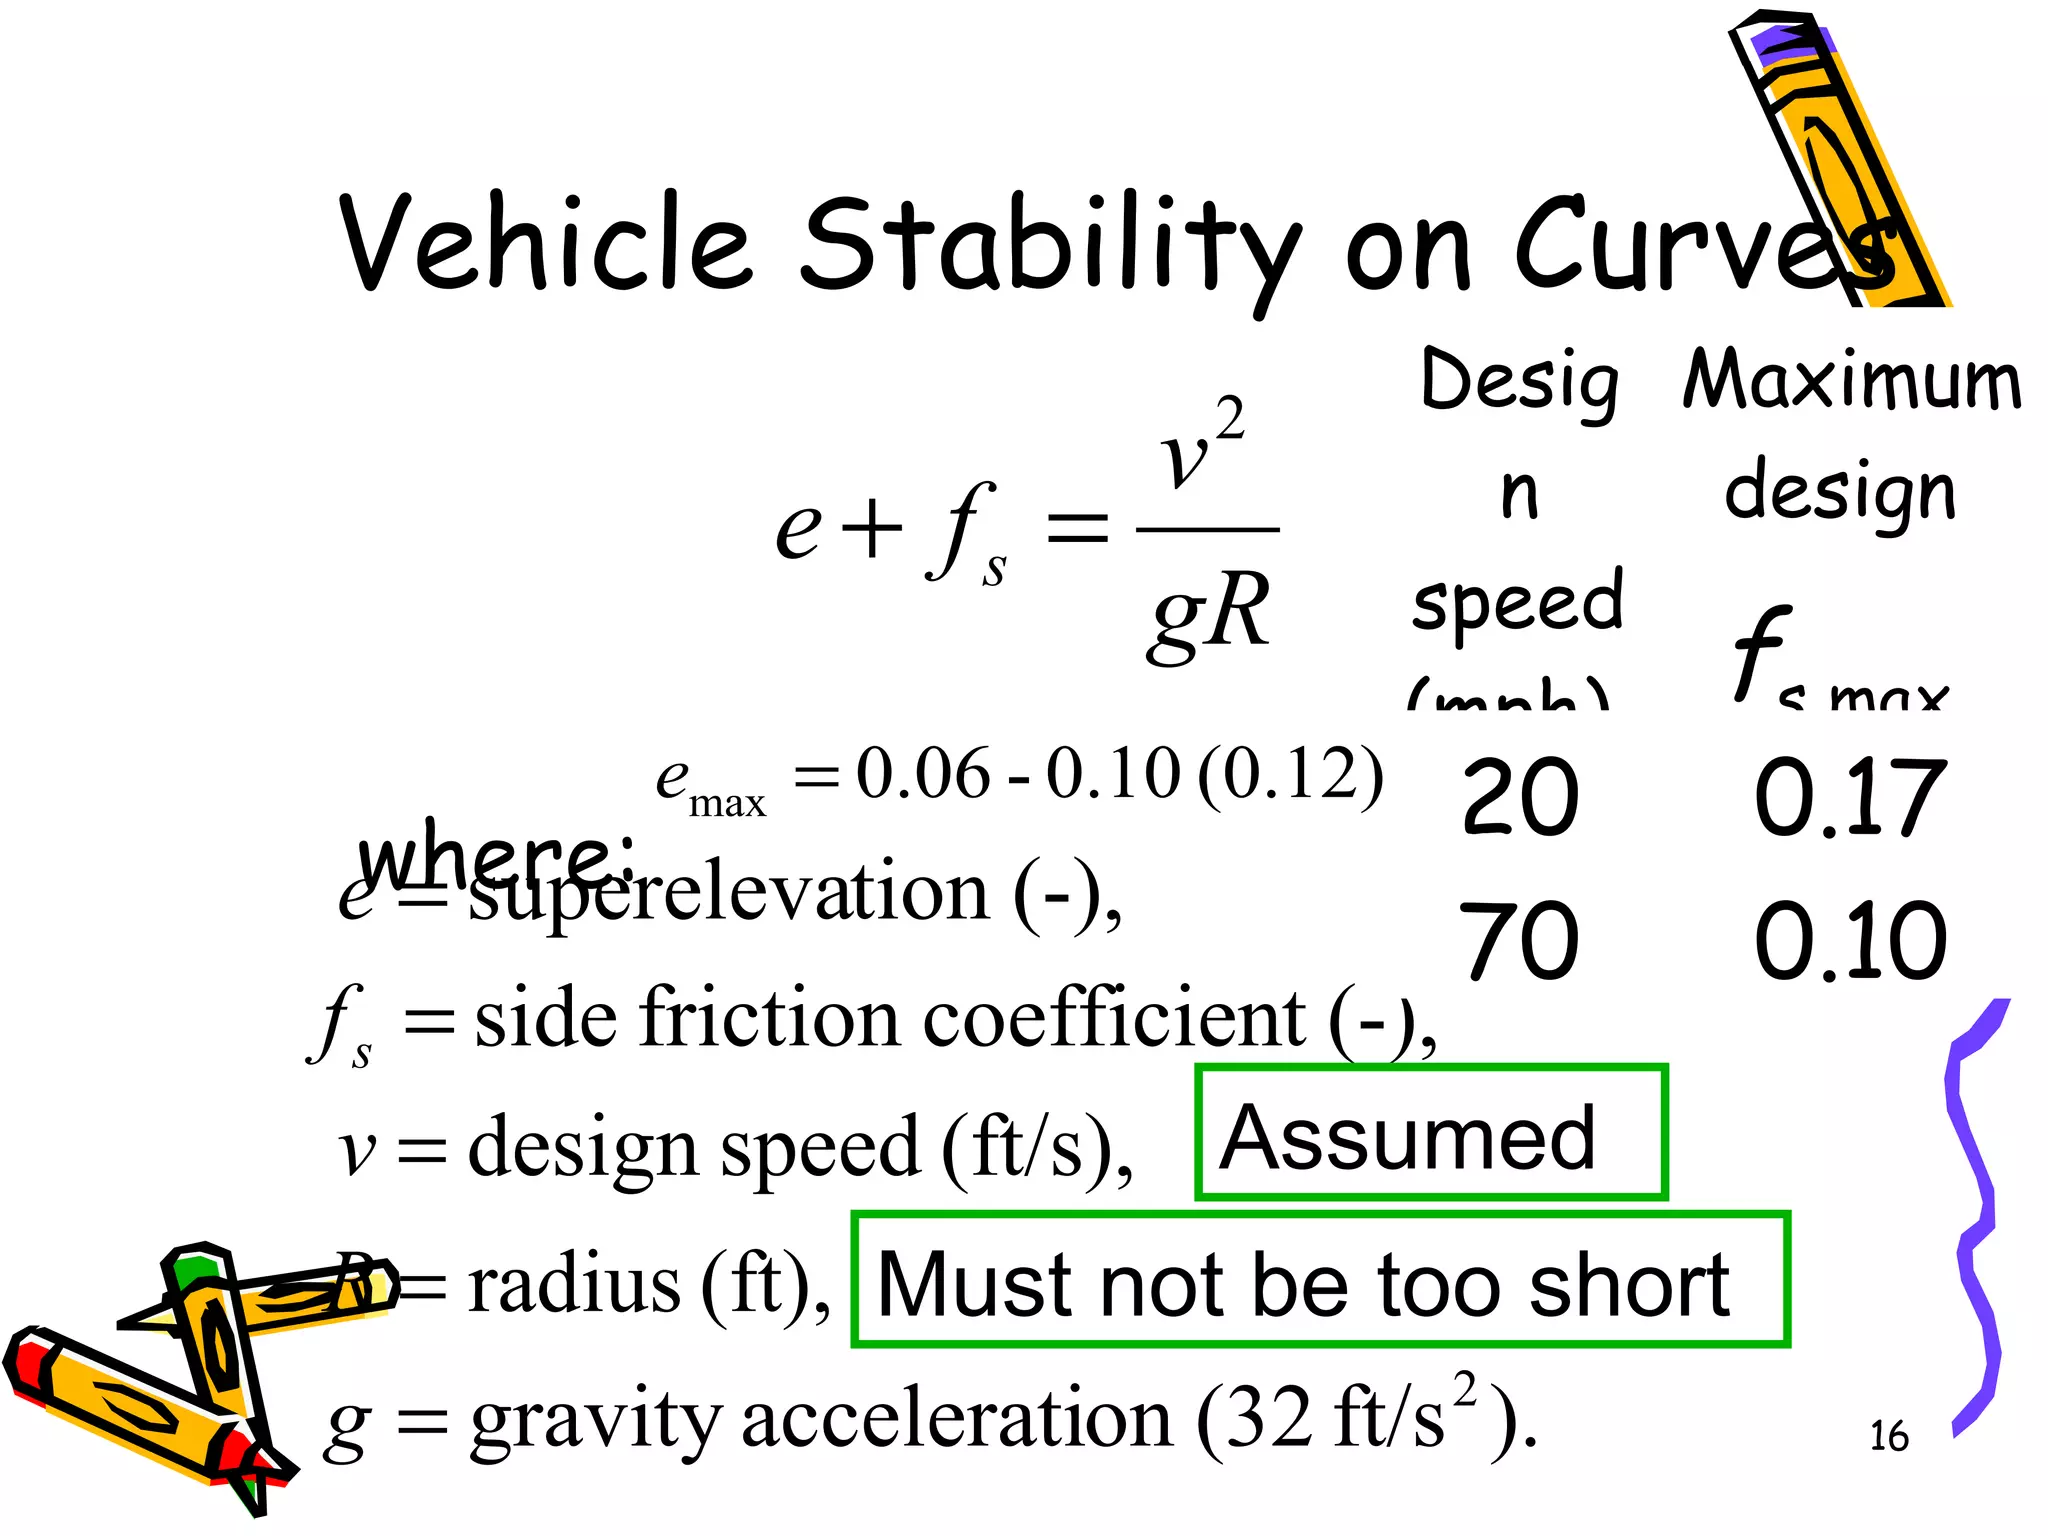
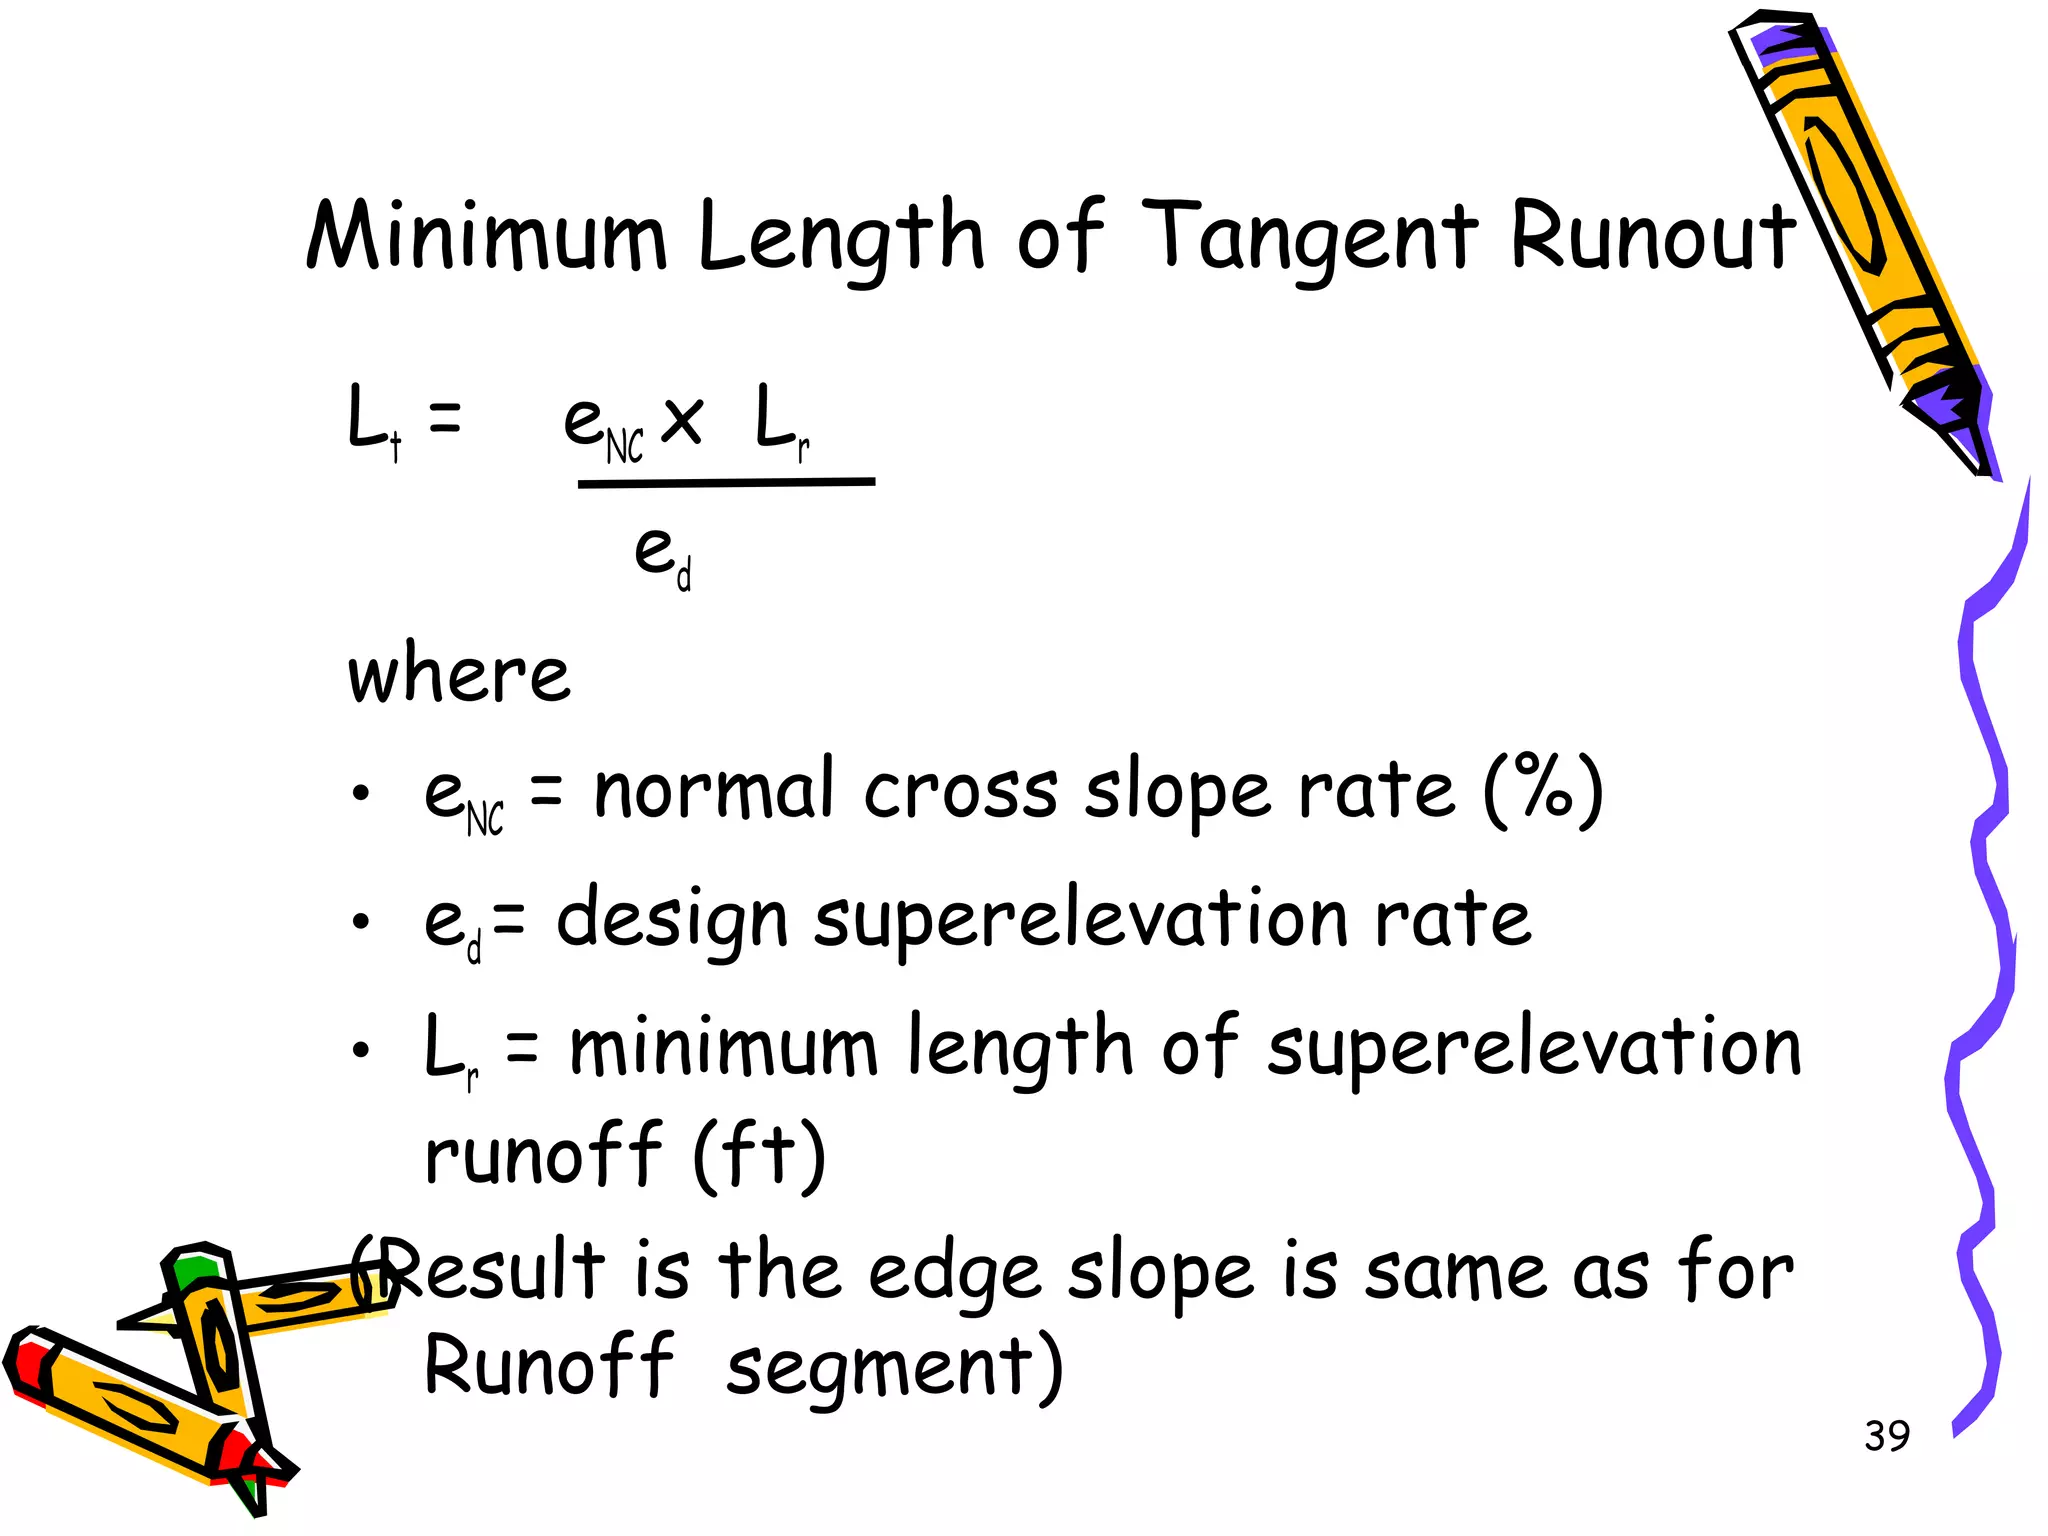
Where:
m = line of sight
S = stopping sight distance
R = radius](https://image.slidesharecdn.com/08superelevation-160419090855/75/Sight-Distance-for-horizontal-curves-5-2048.jpg)
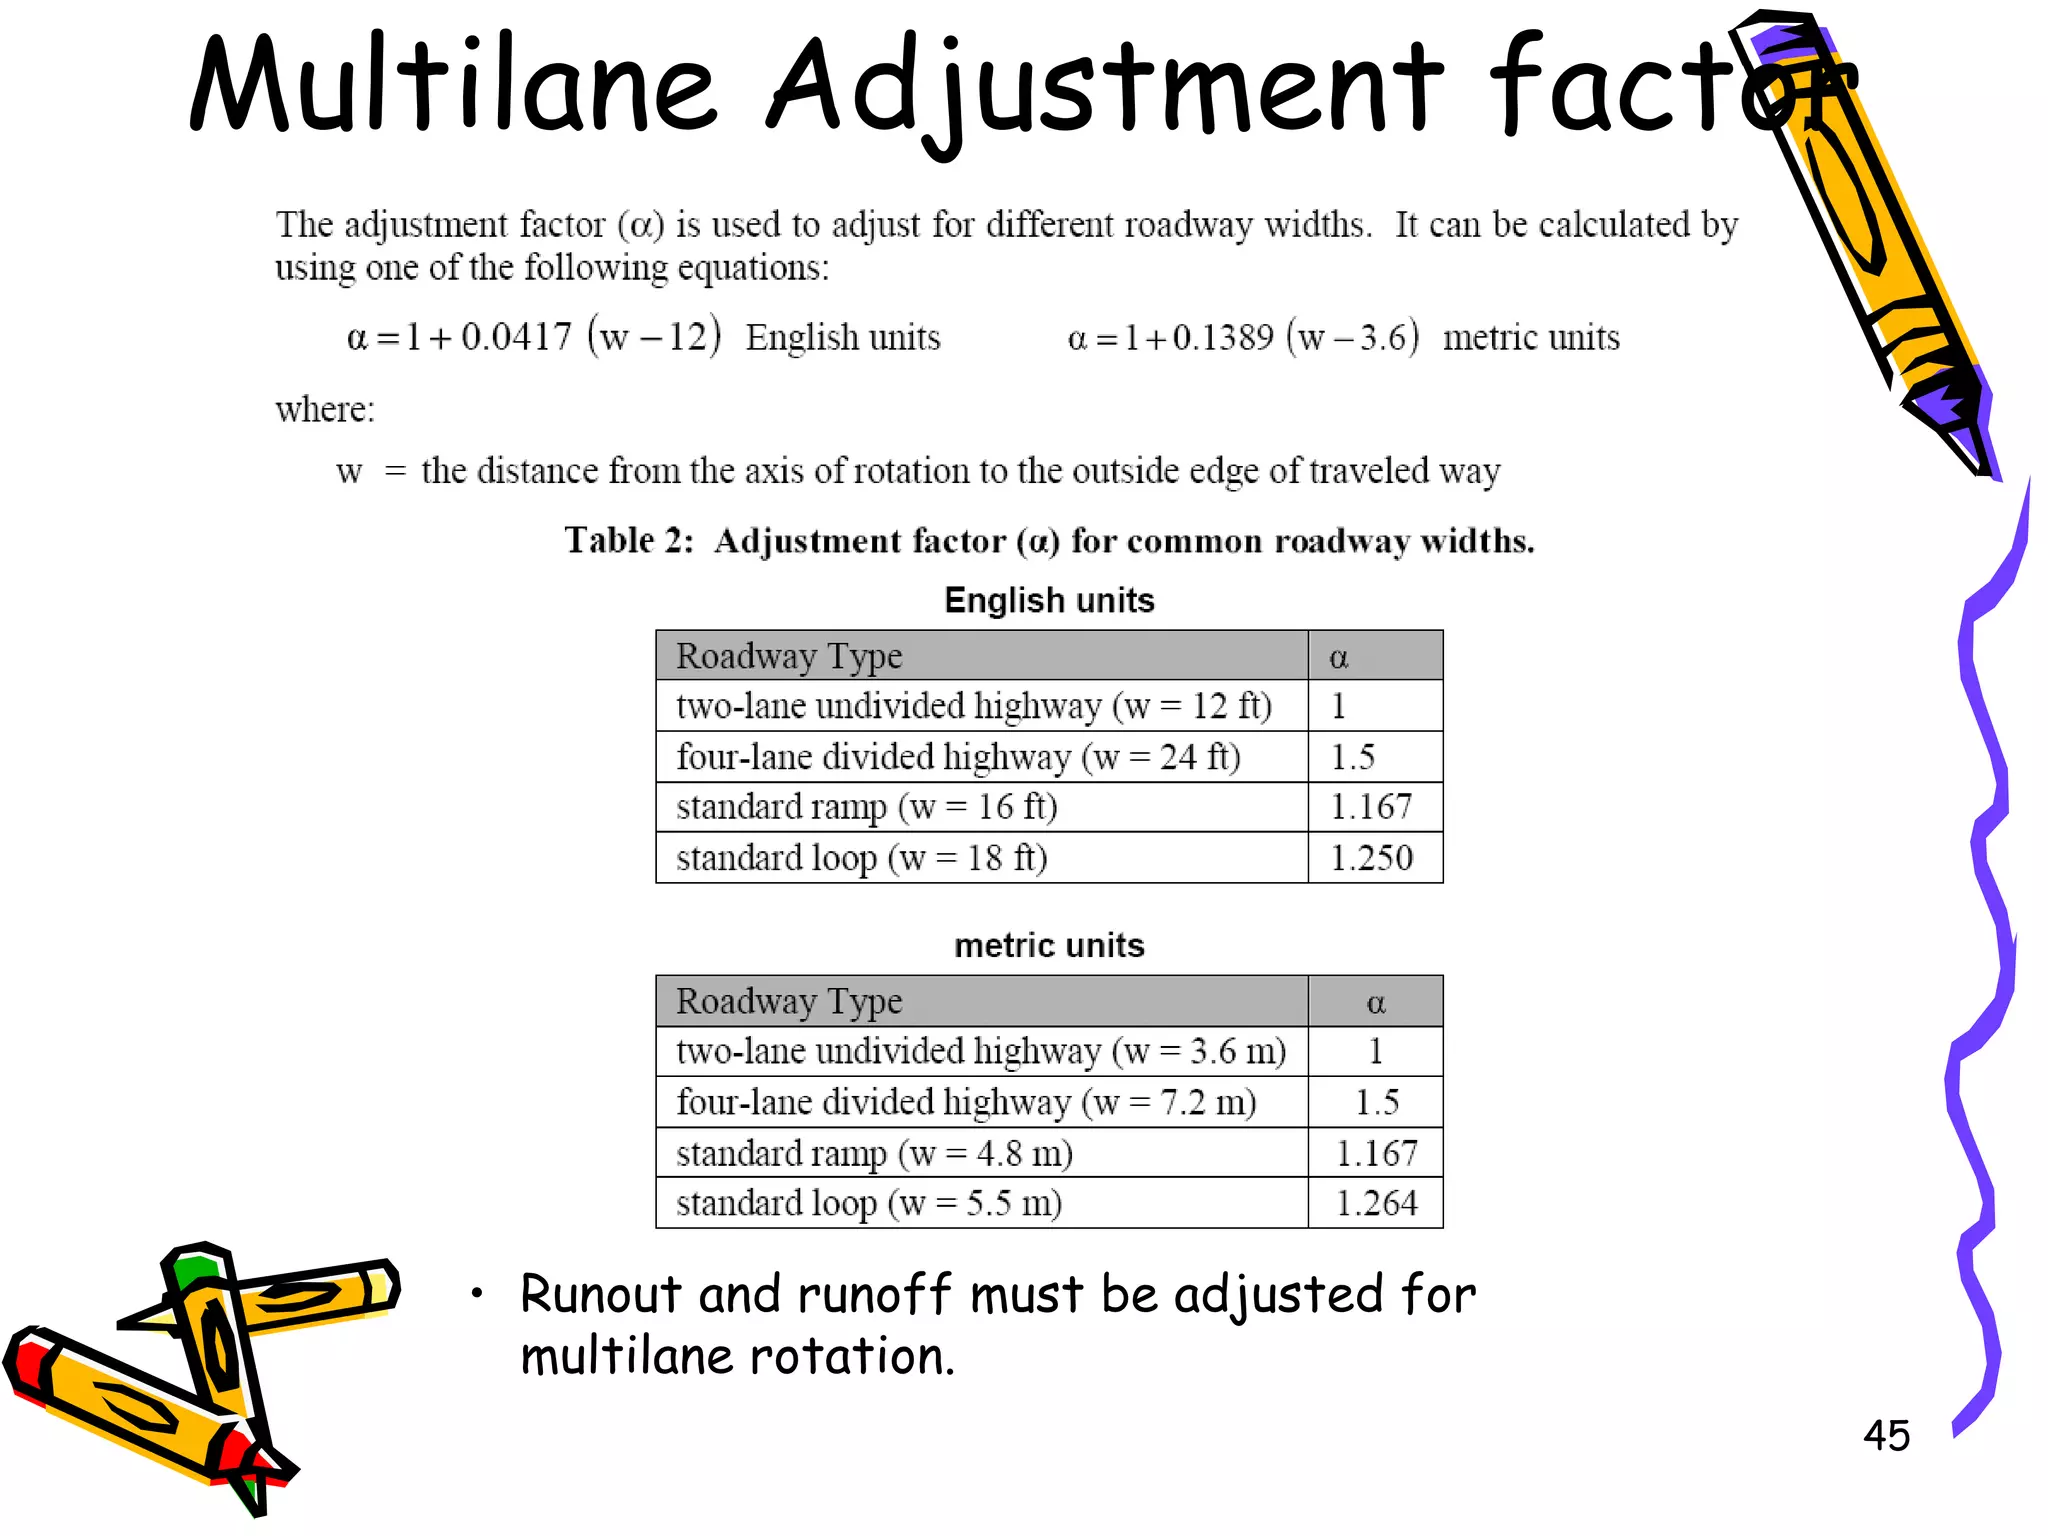
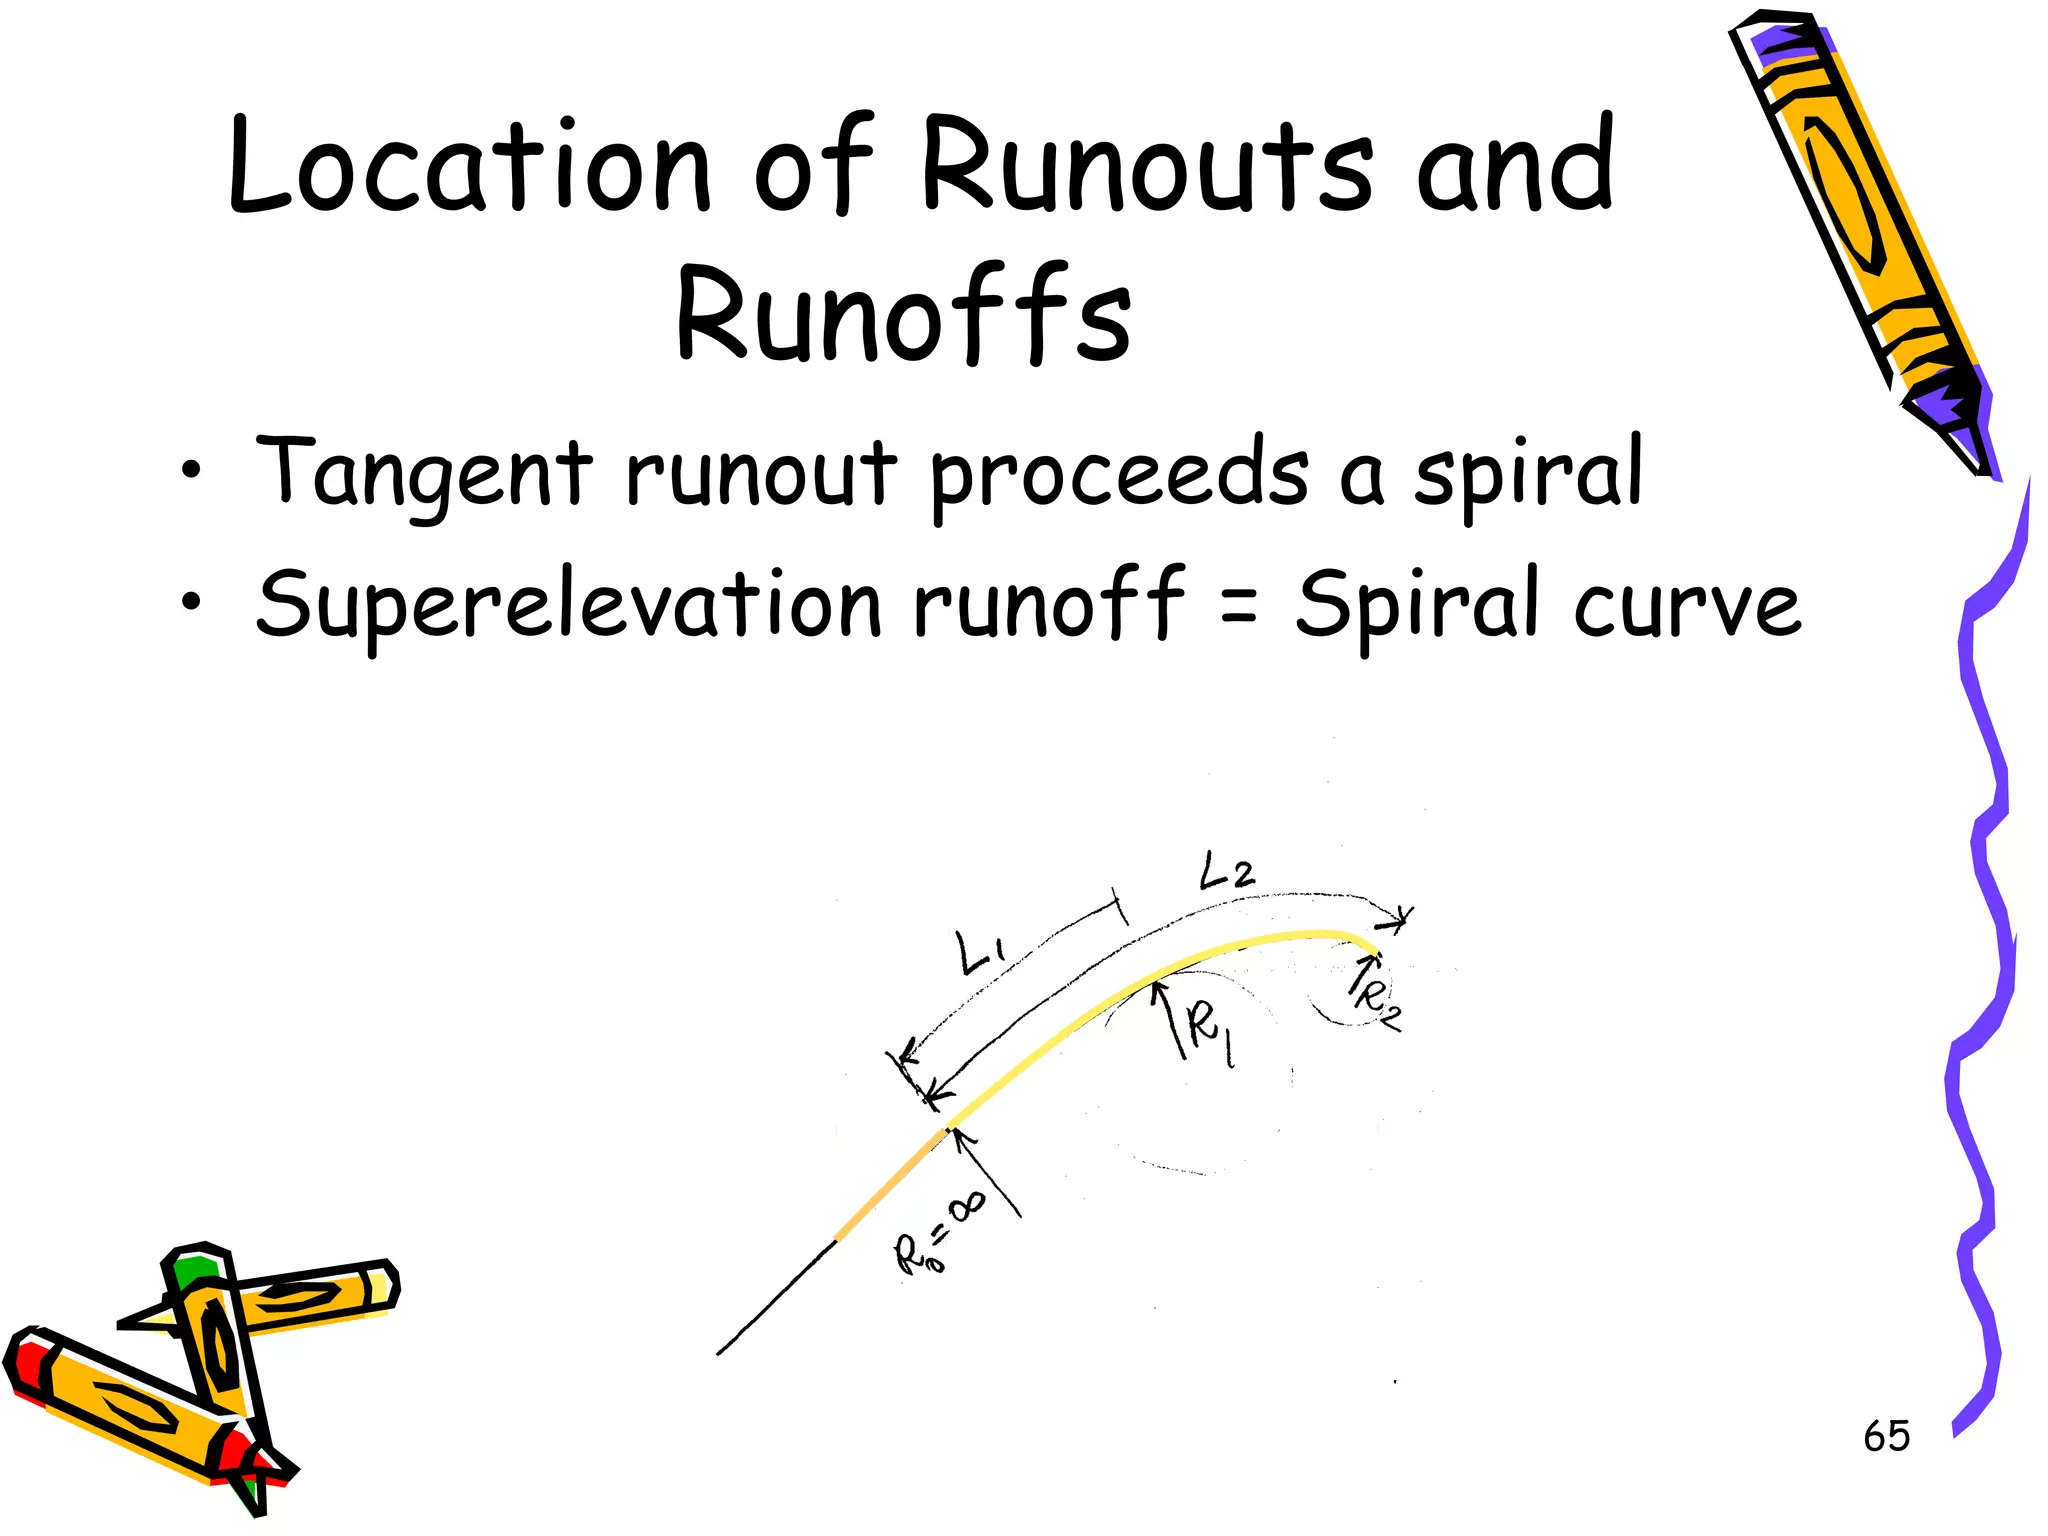
![6
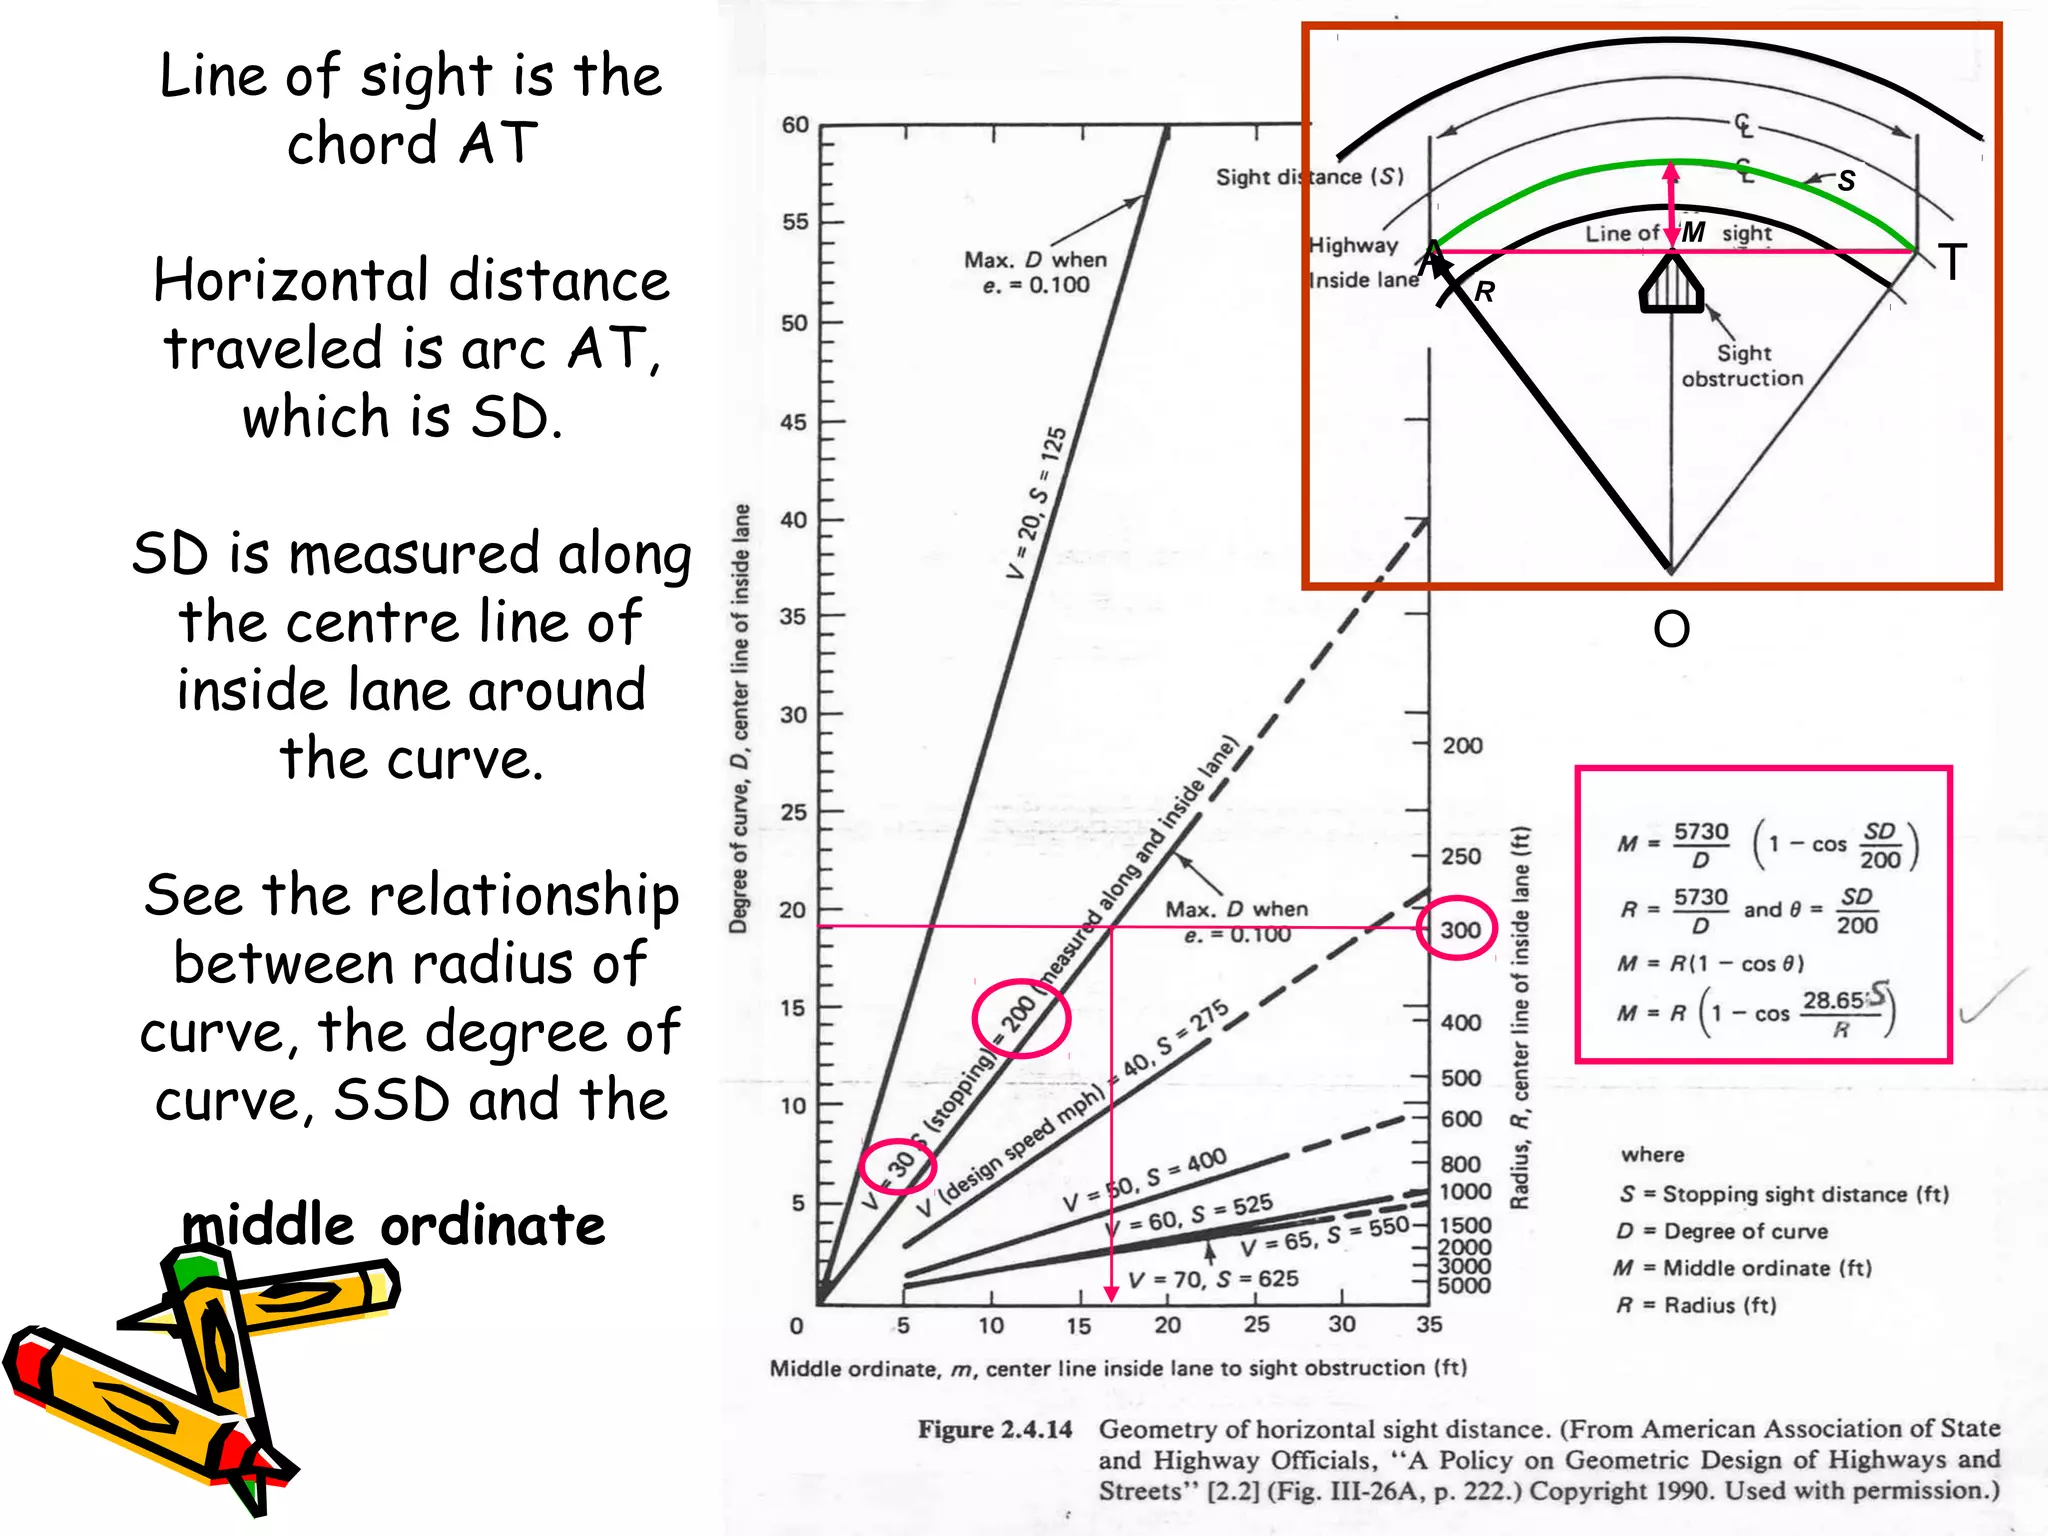
Middle ordinate
• Angle subtended at centre of circle by
arc AT is 2θ in degree then
• S / πR = 2θ / 180
• S = 2R θπ / 180
• θ = S 180 / 2R π = 28.65 (S) / R
• R-M/R = cos θ
• M = [1 – cos 28.65 (S) / R ]
θR
M
A T
B
T
O
θ](https://image.slidesharecdn.com/08superelevation-160419090855/75/Sight-Distance-for-horizontal-curves-6-2048.jpg)
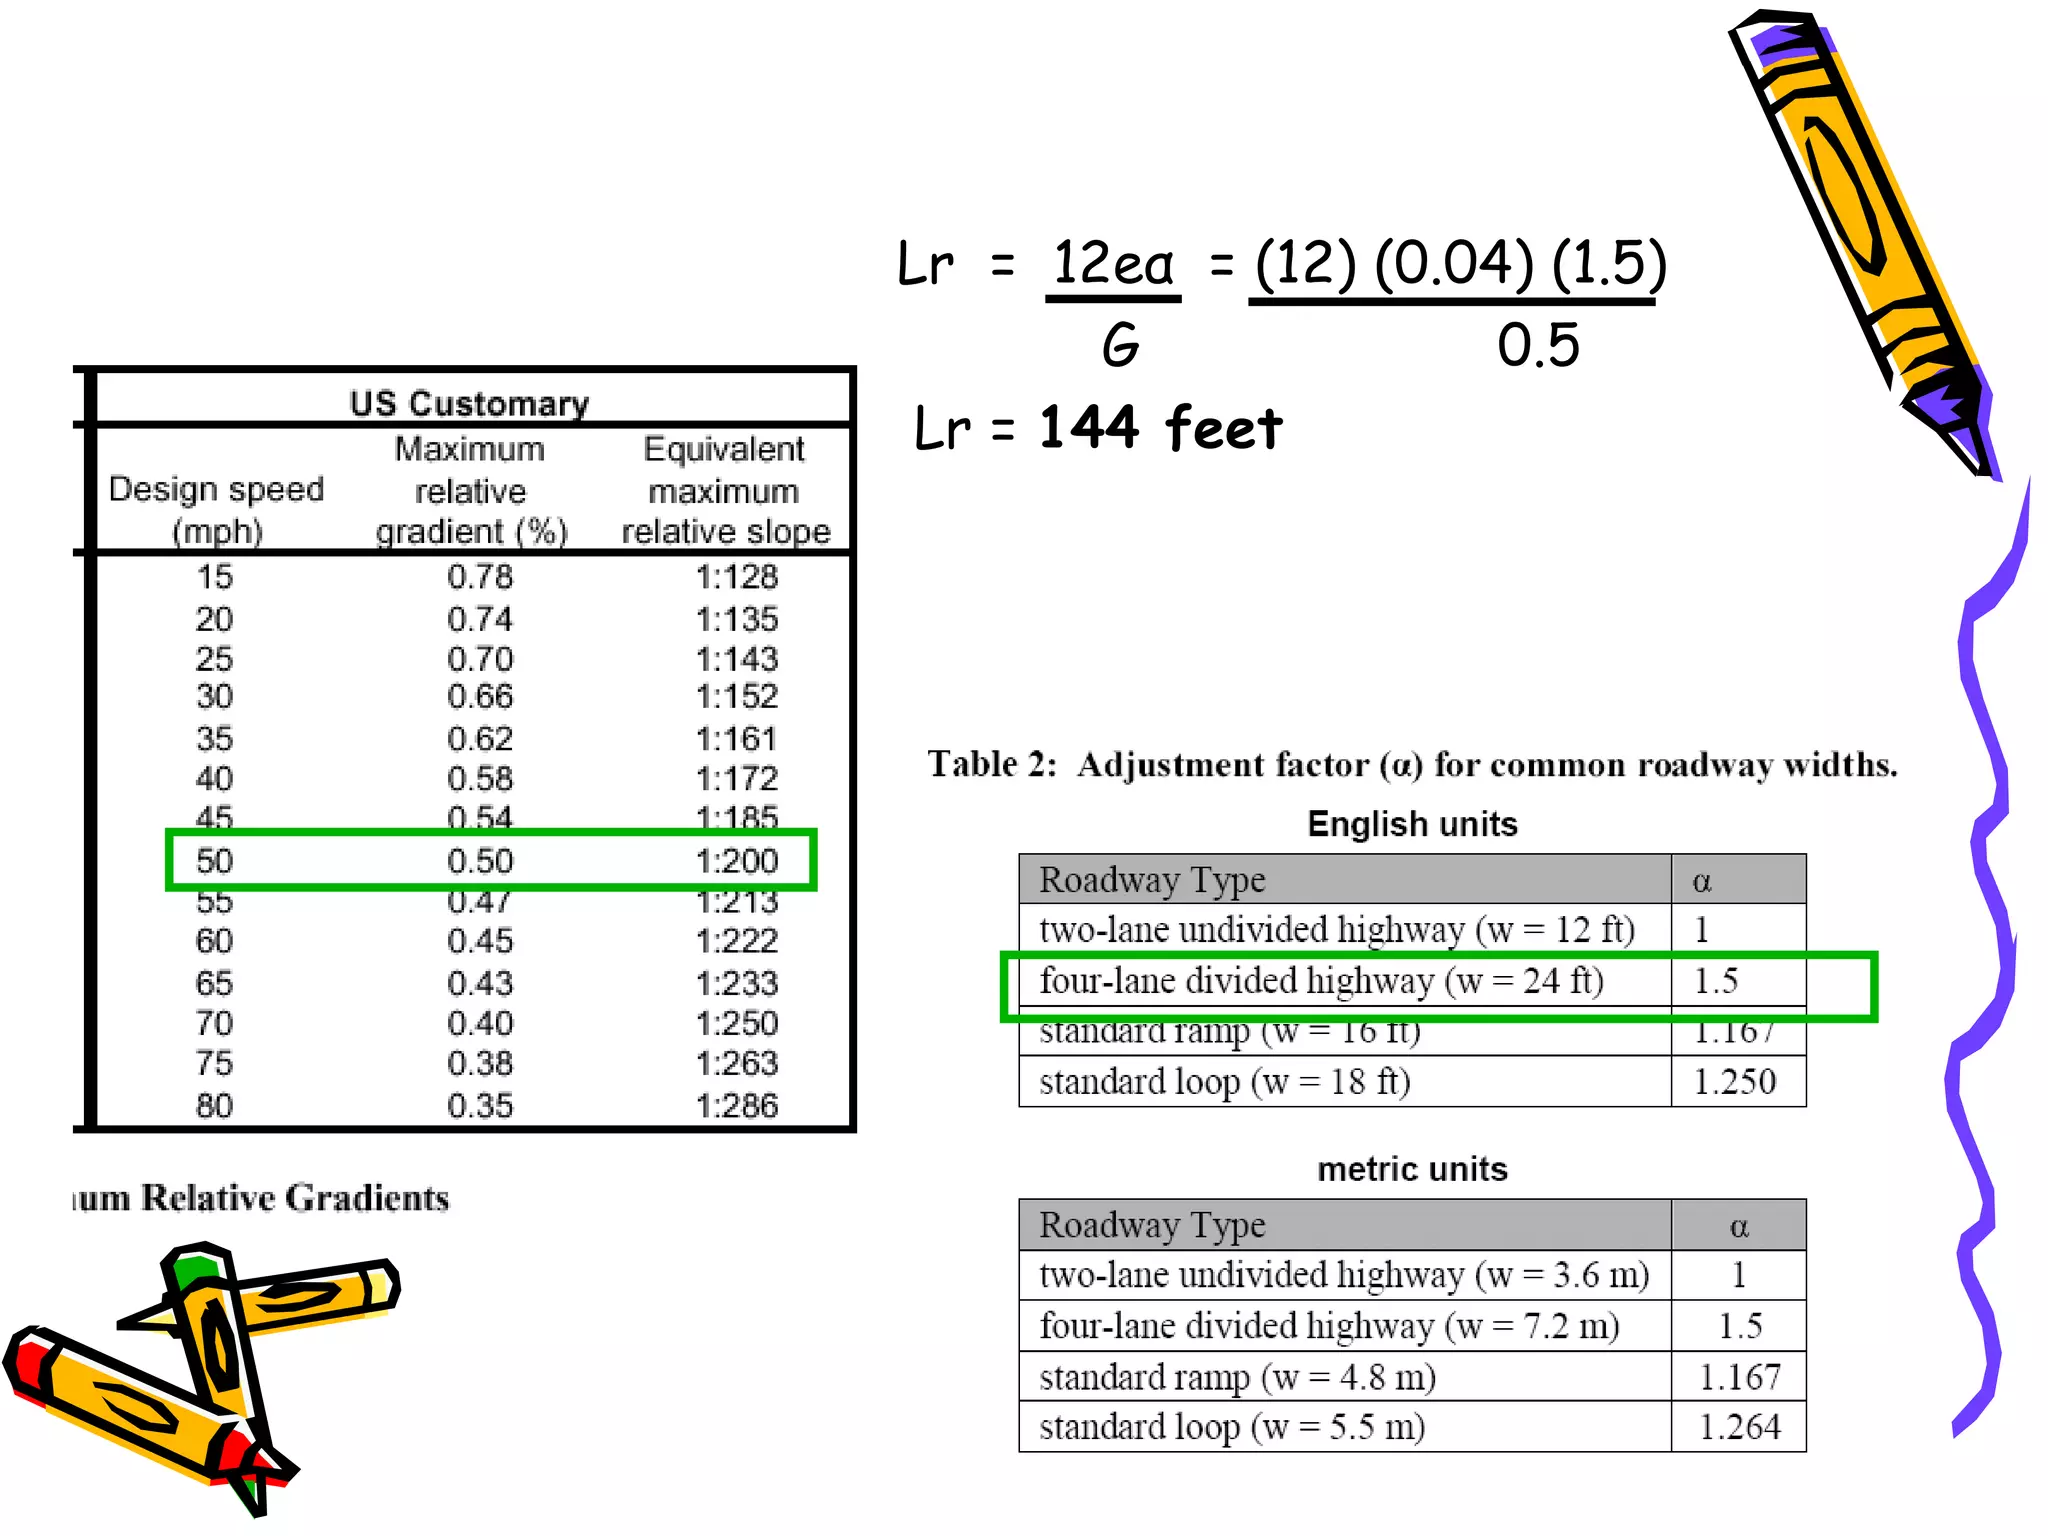
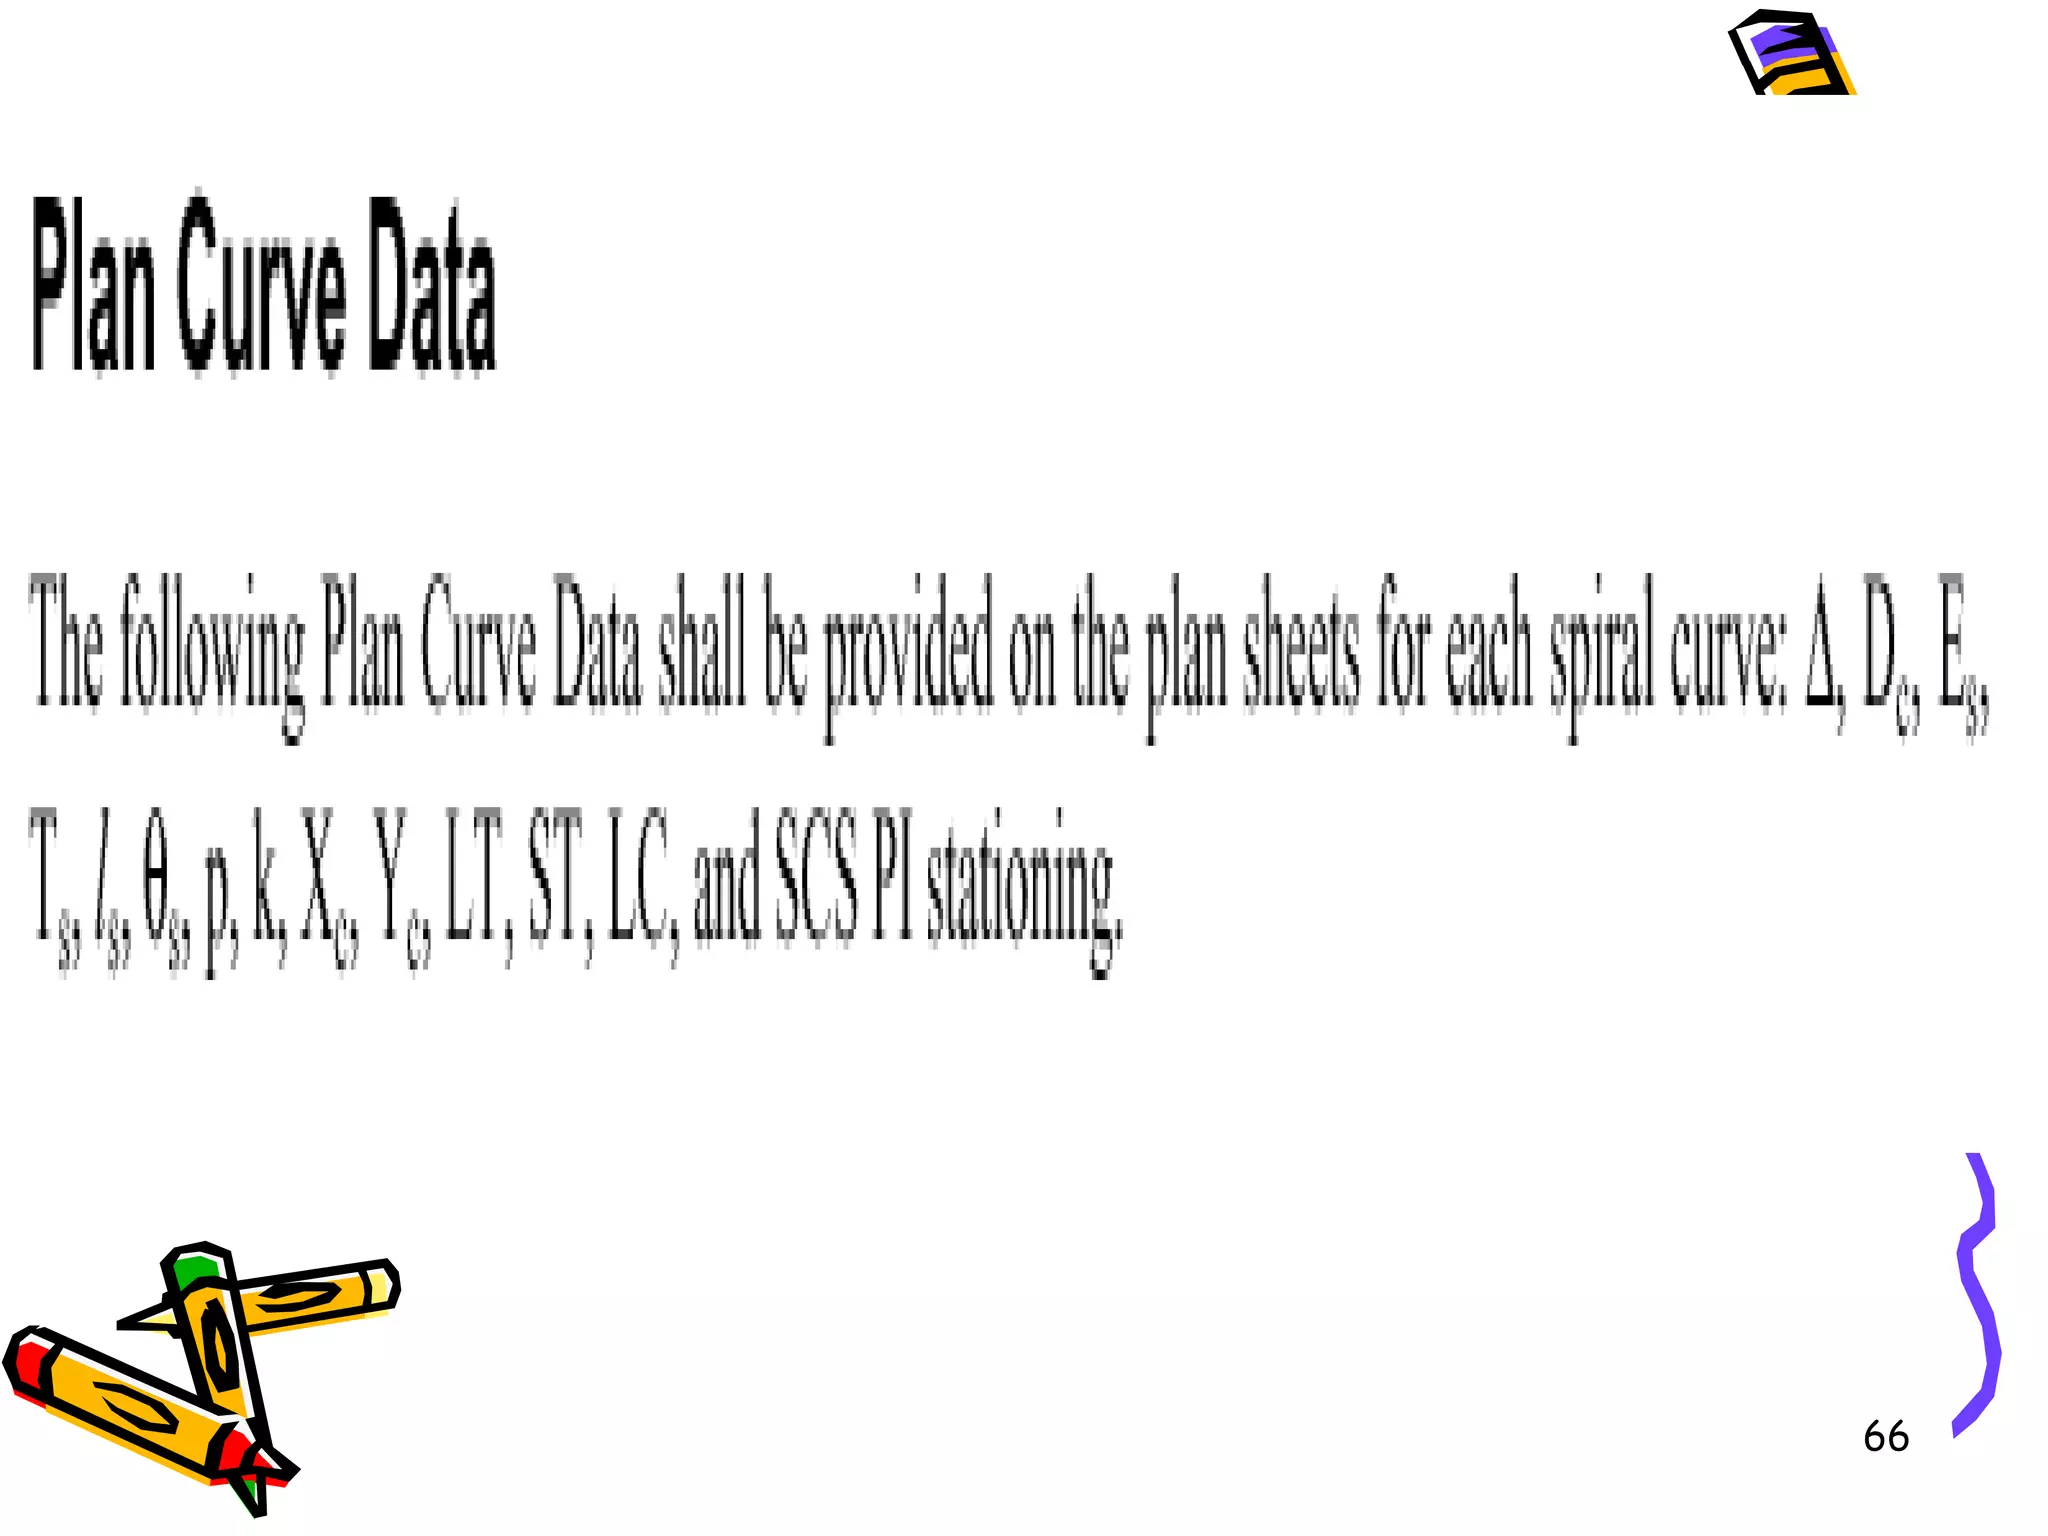
![9
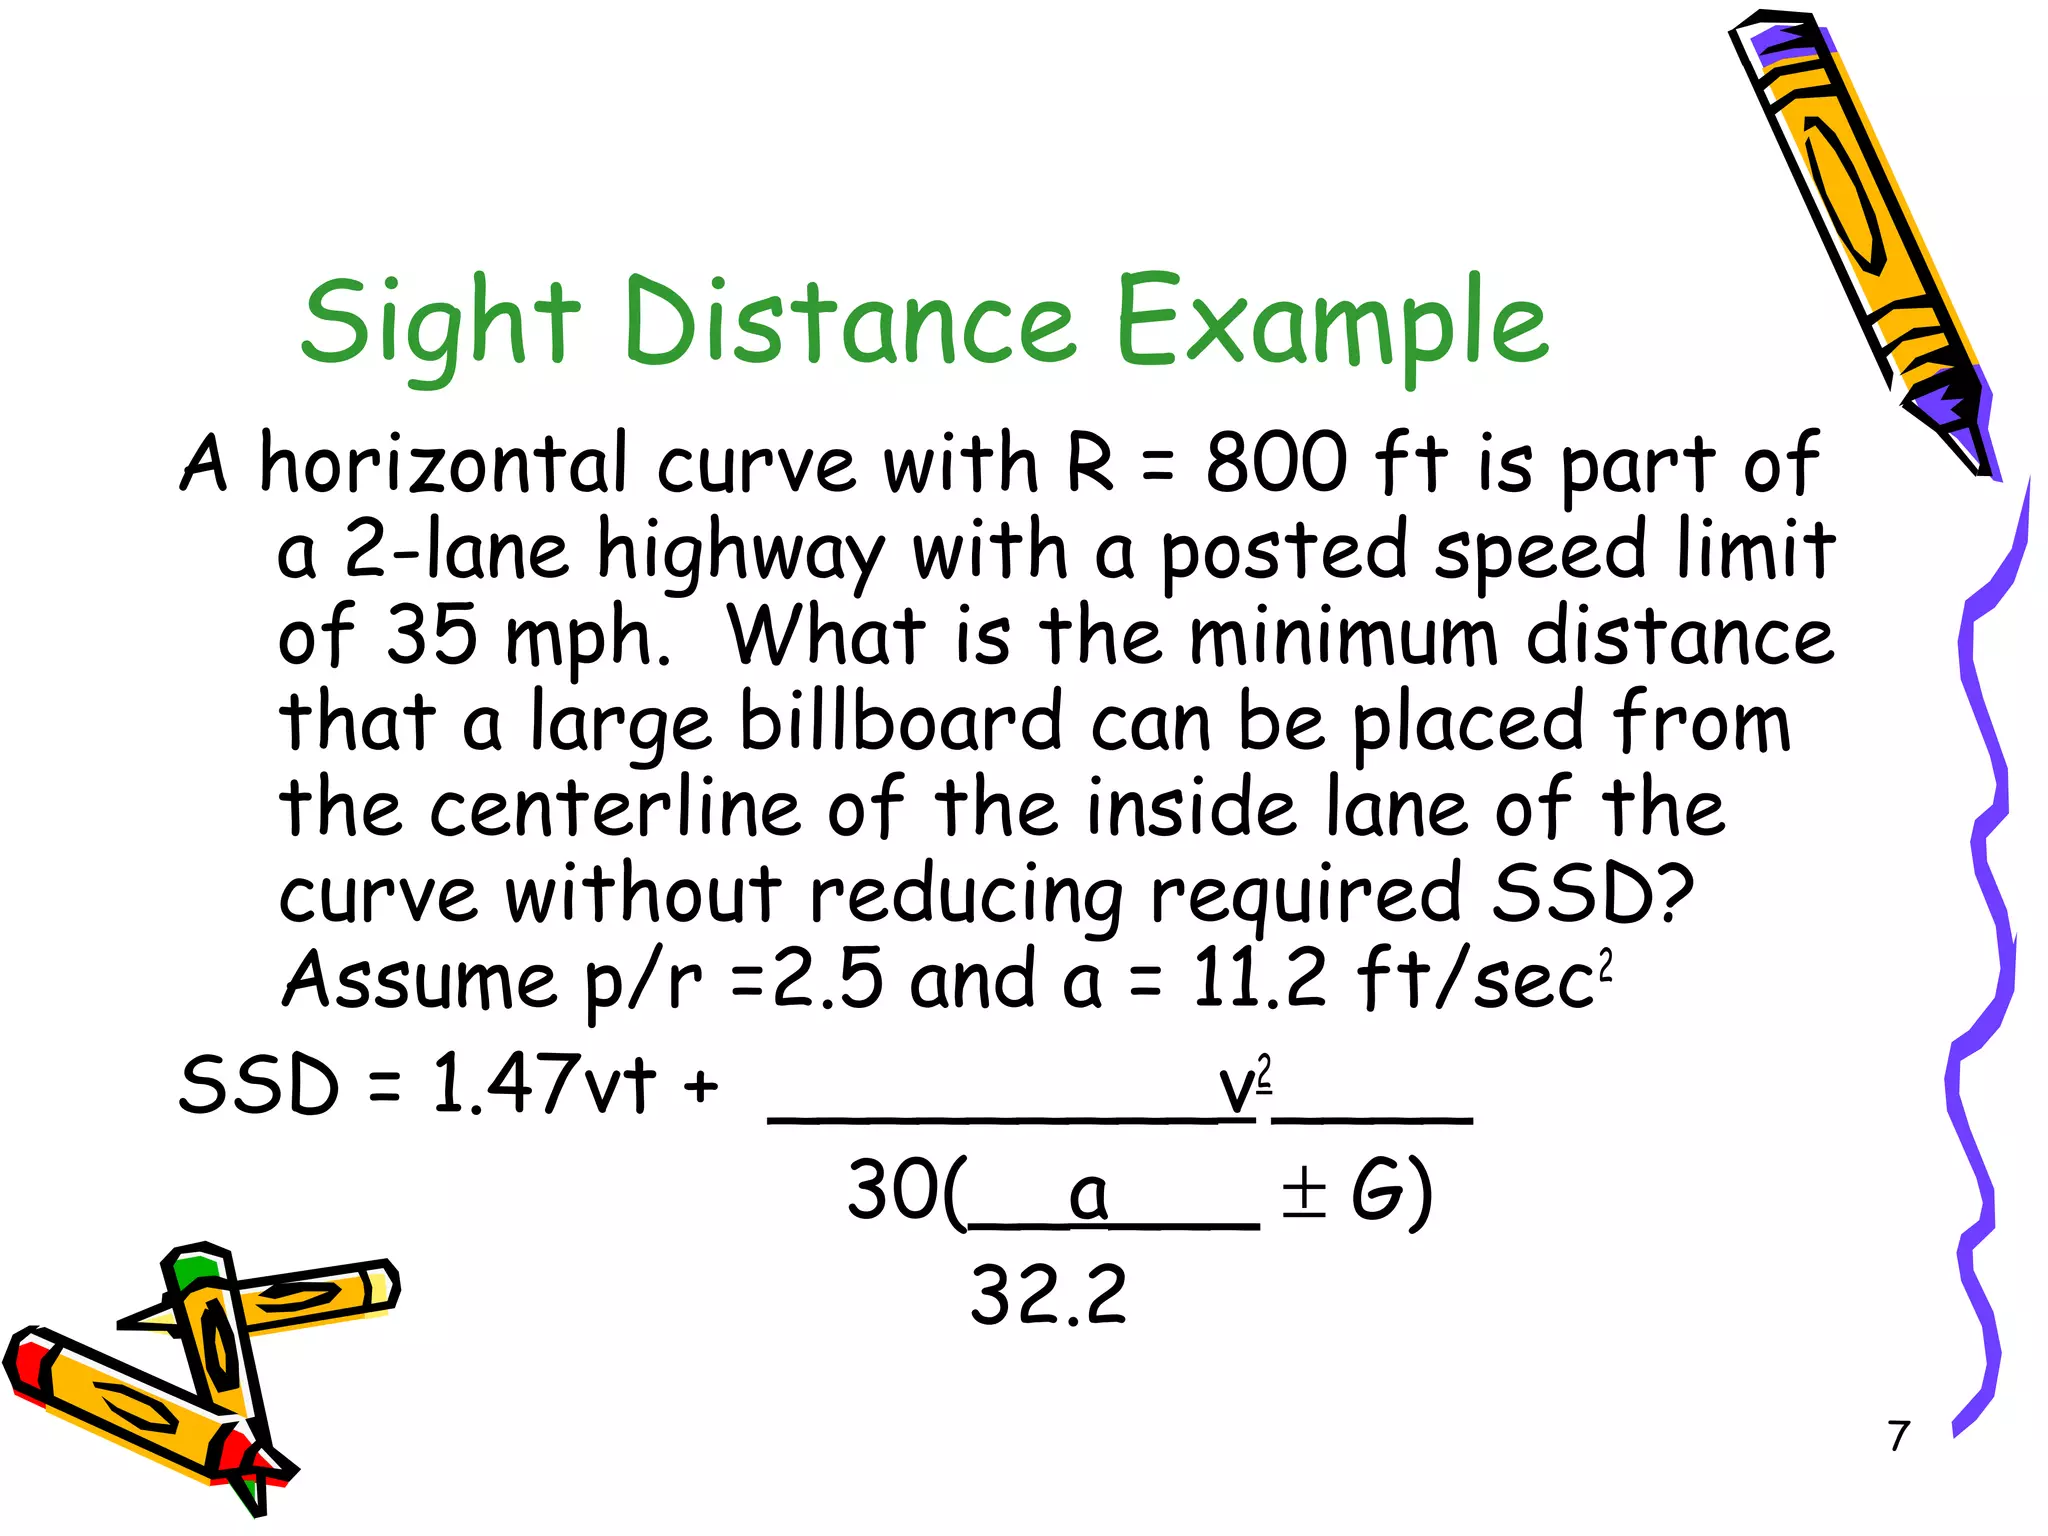
Sight Distance Example
m = R(1 – cos [28.65 S])
R
m = 800 (1 – cos [28.65 {246}])= 9.43’
800
(in radians not degrees)](https://image.slidesharecdn.com/08superelevation-160419090855/75/Sight-Distance-for-horizontal-curves-9-2048.jpg)
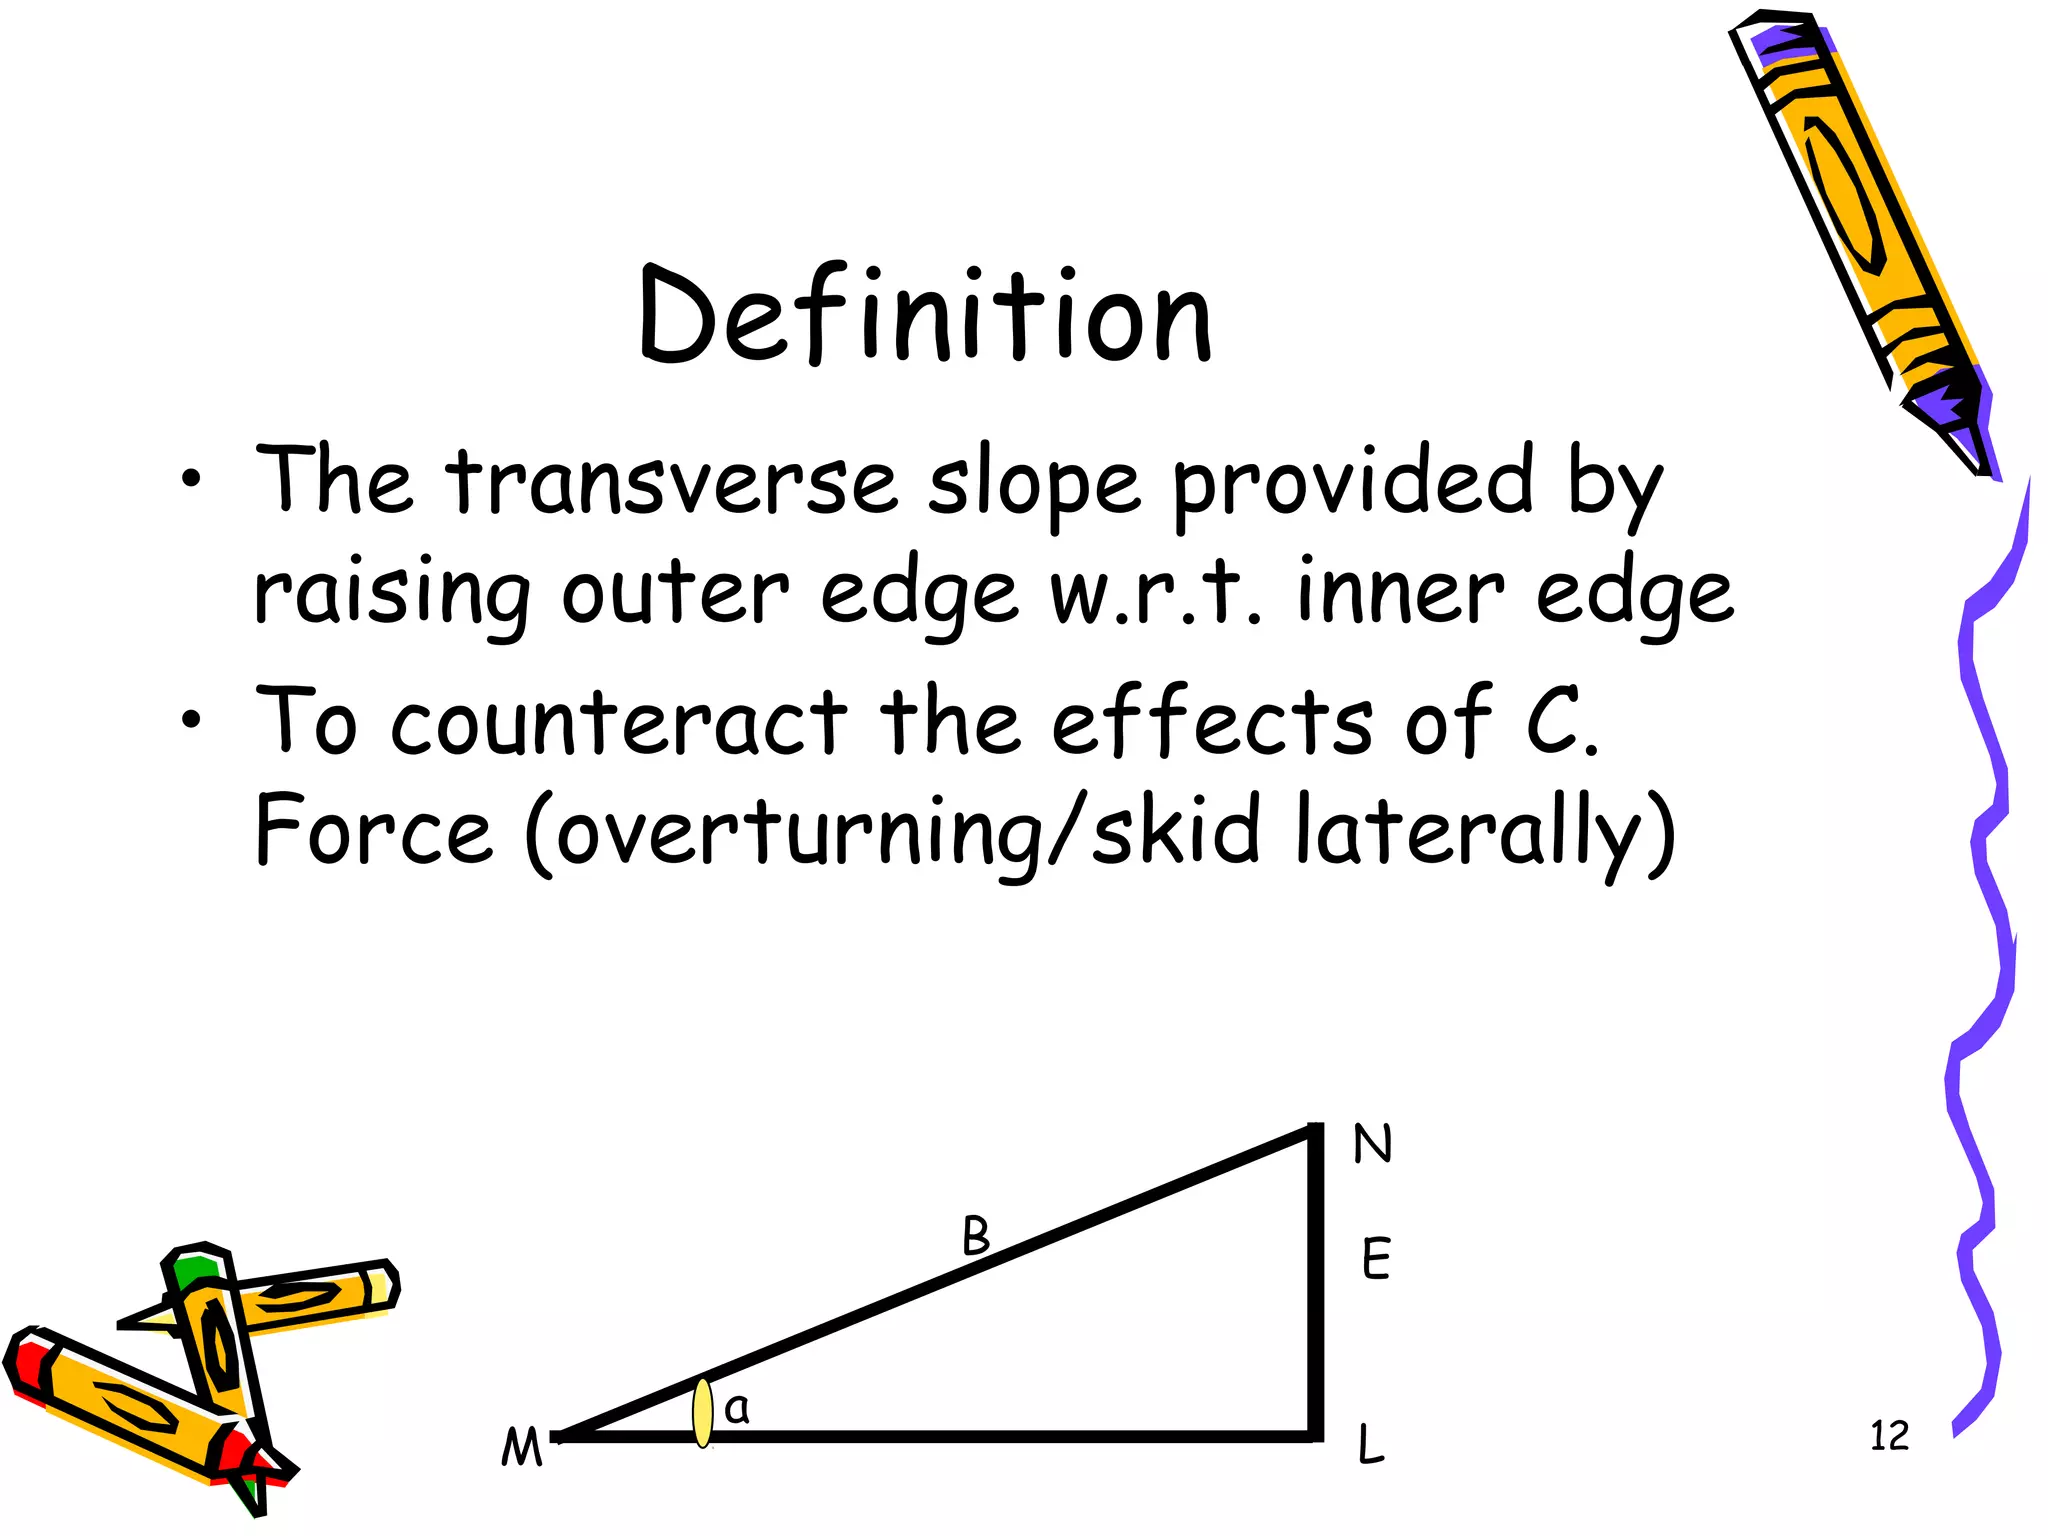
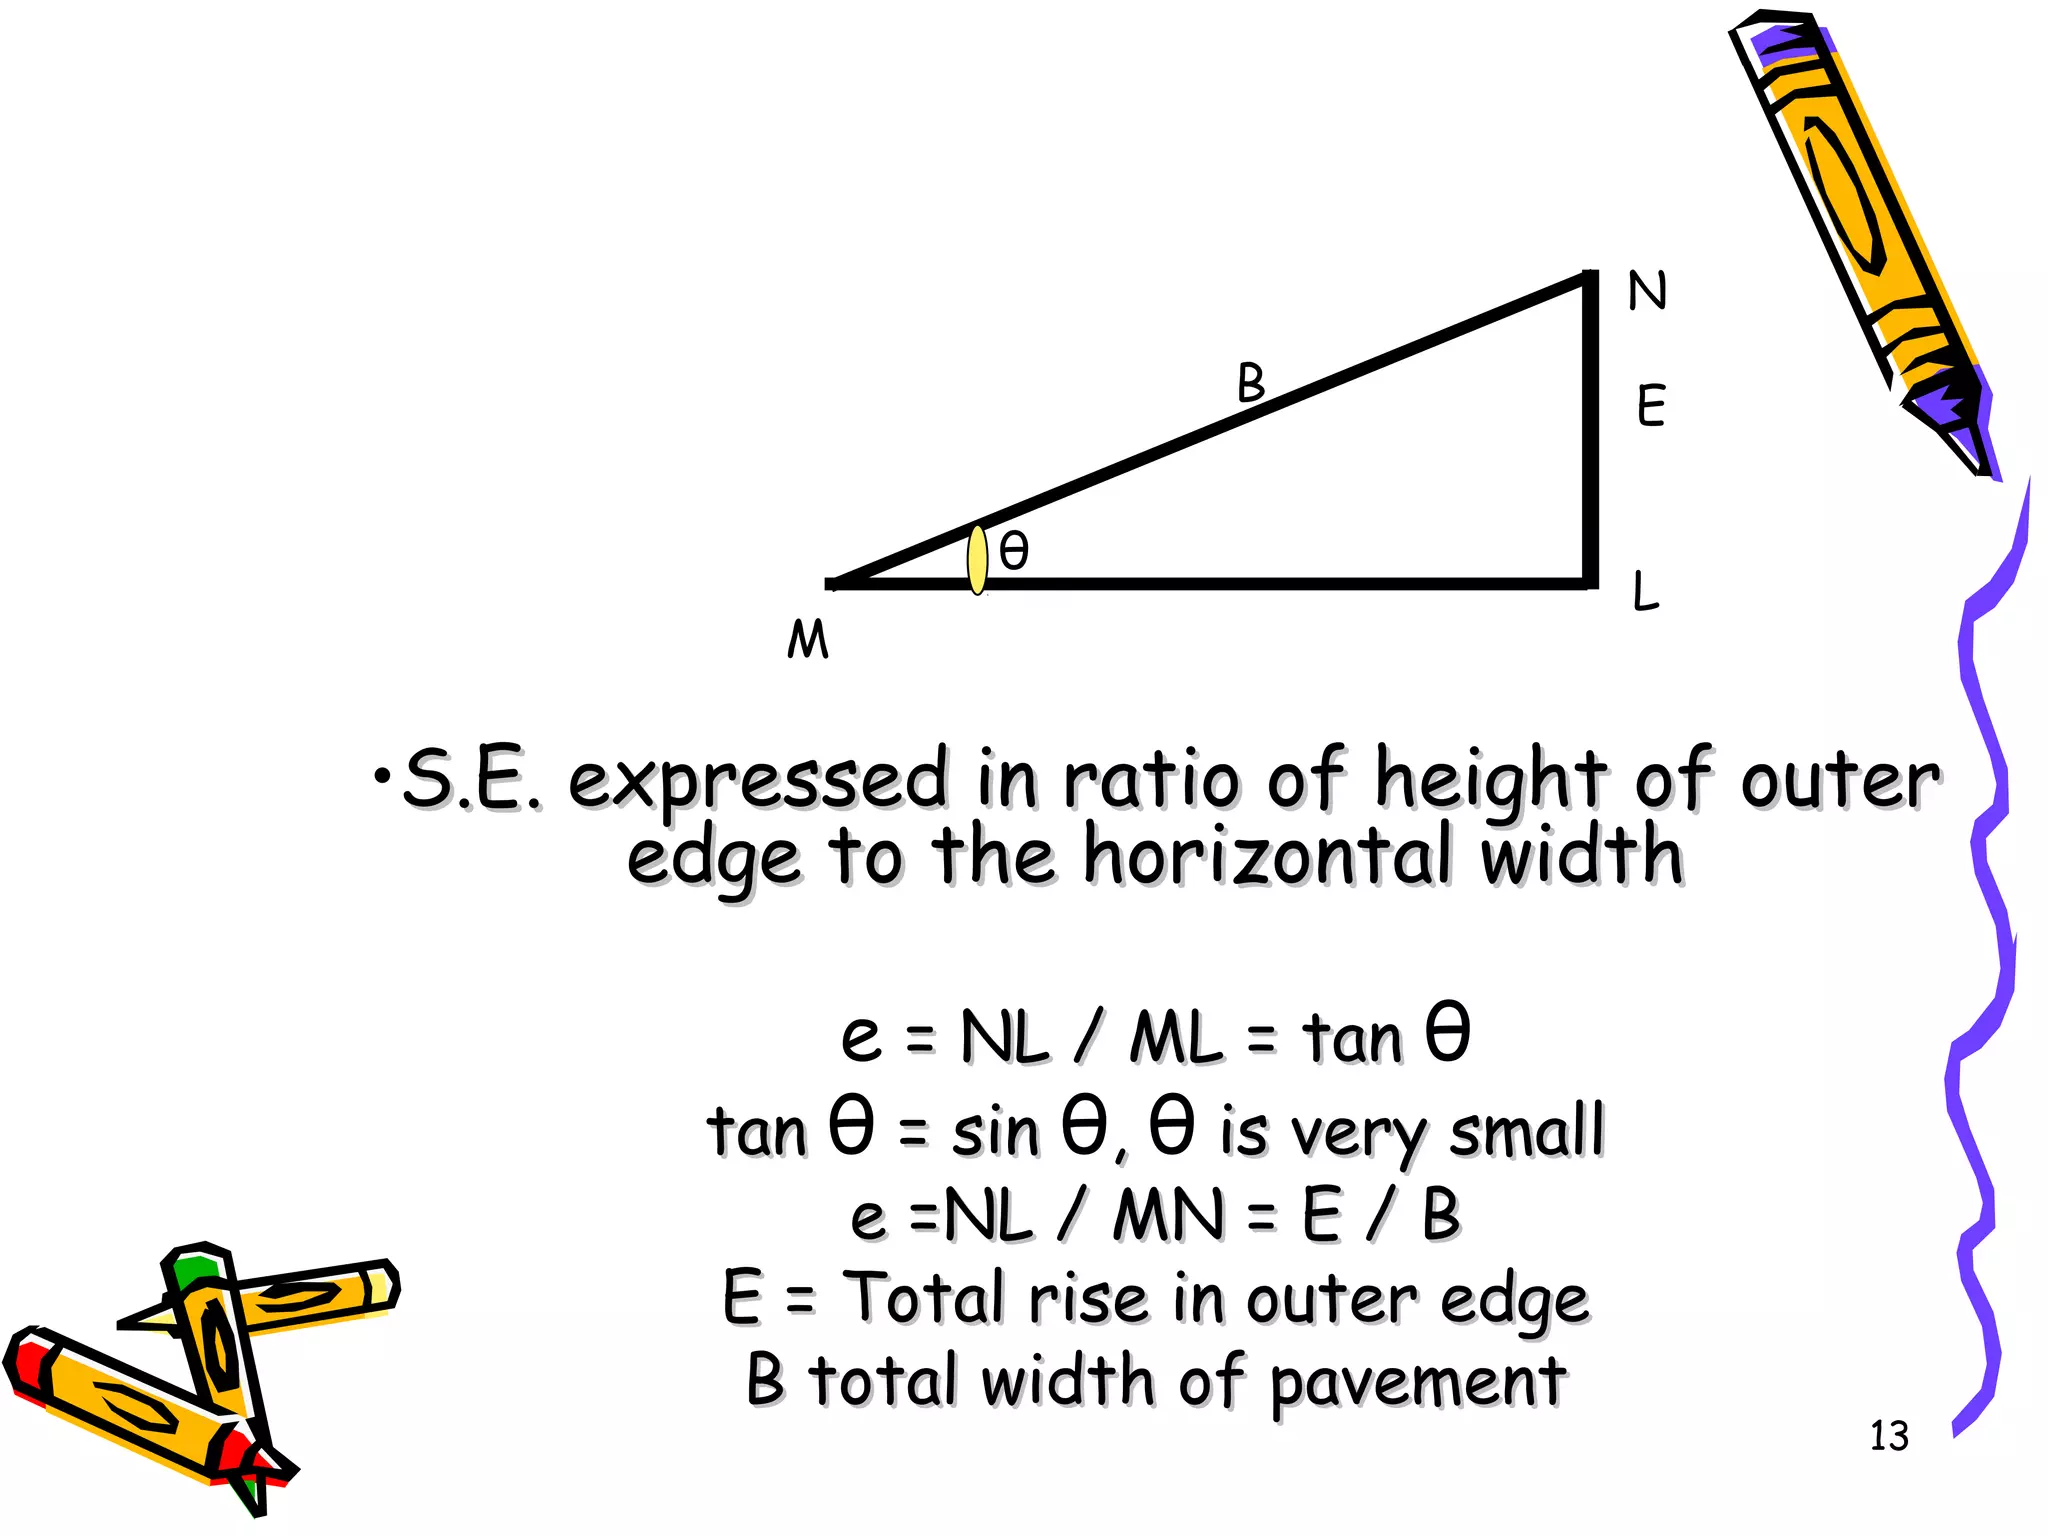
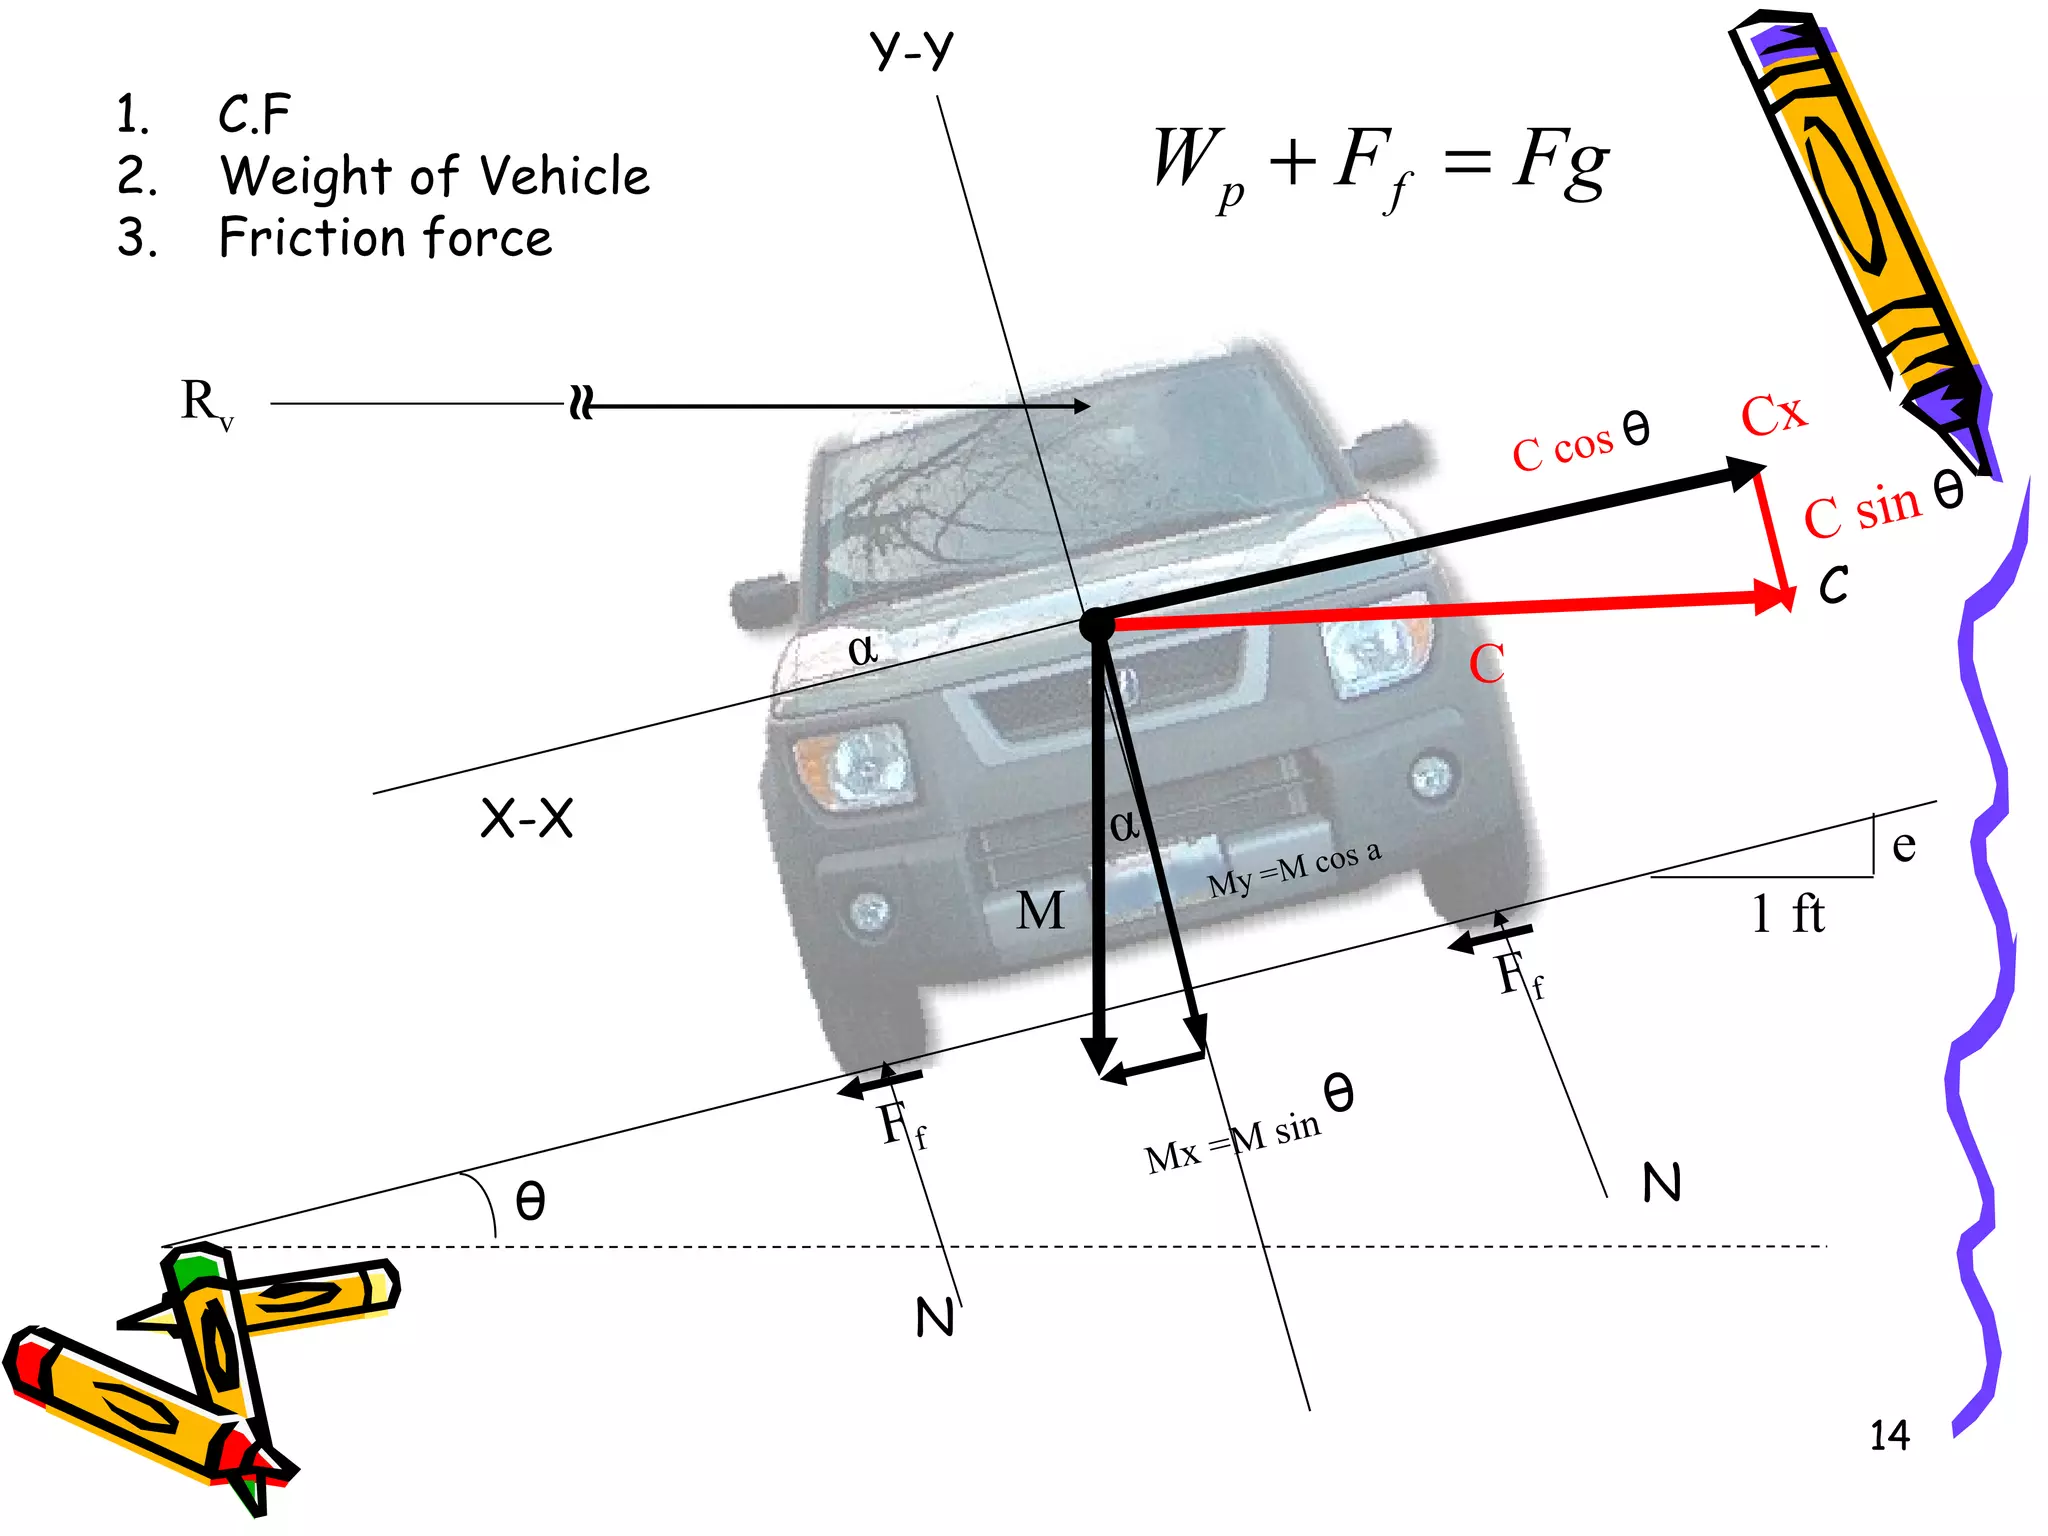
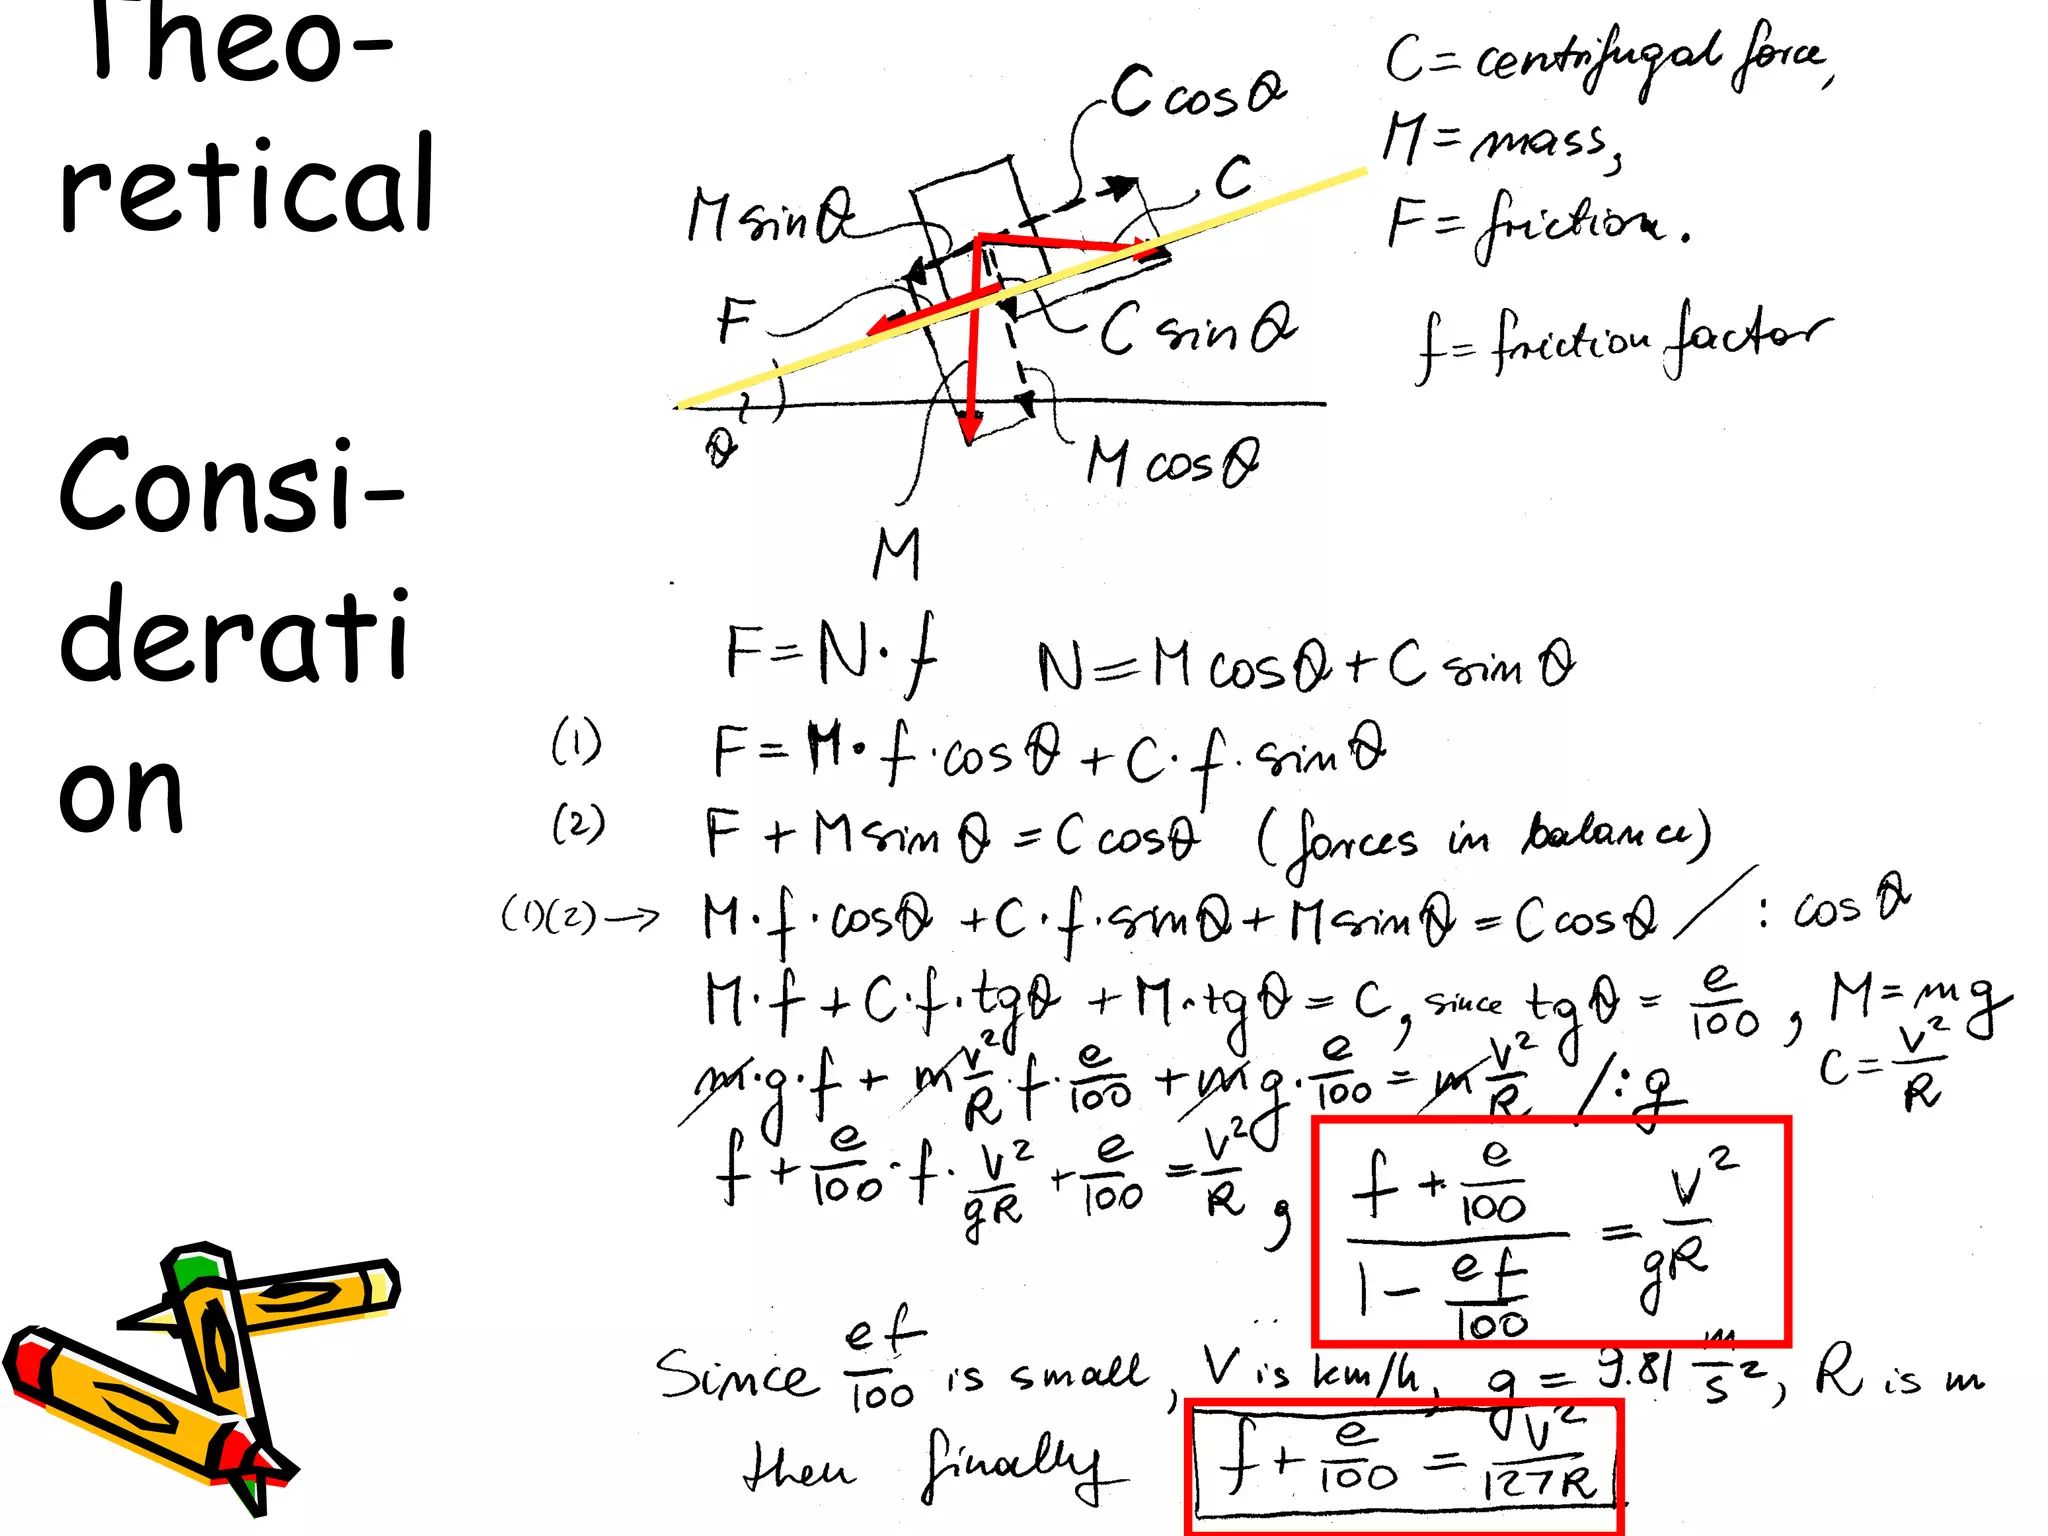

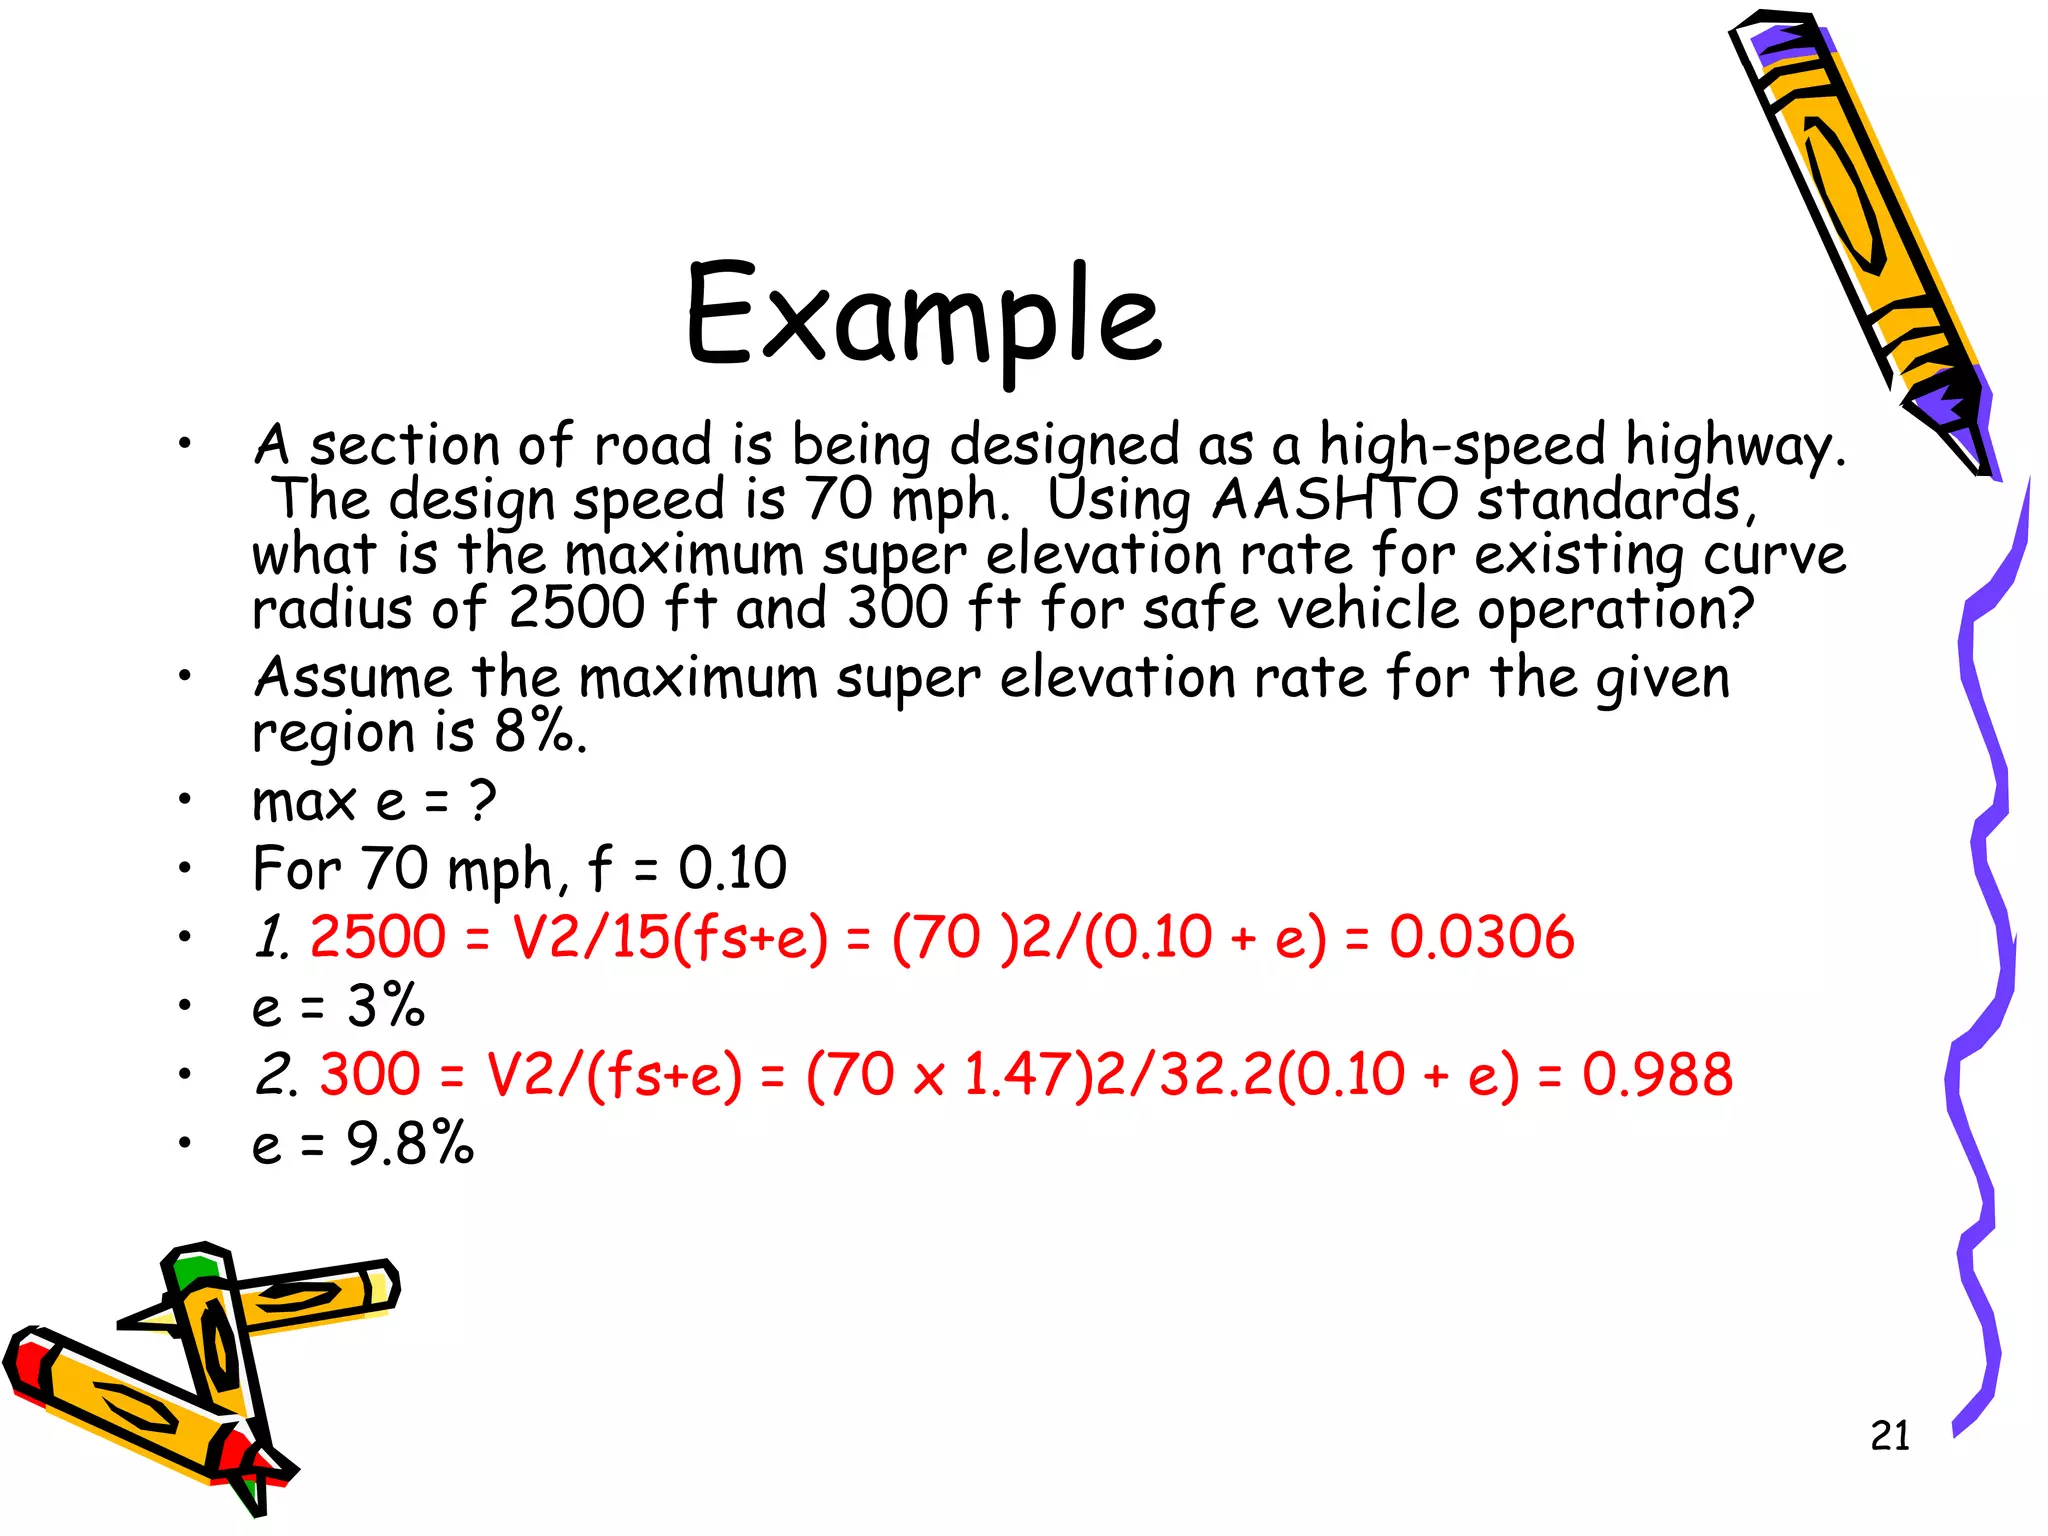
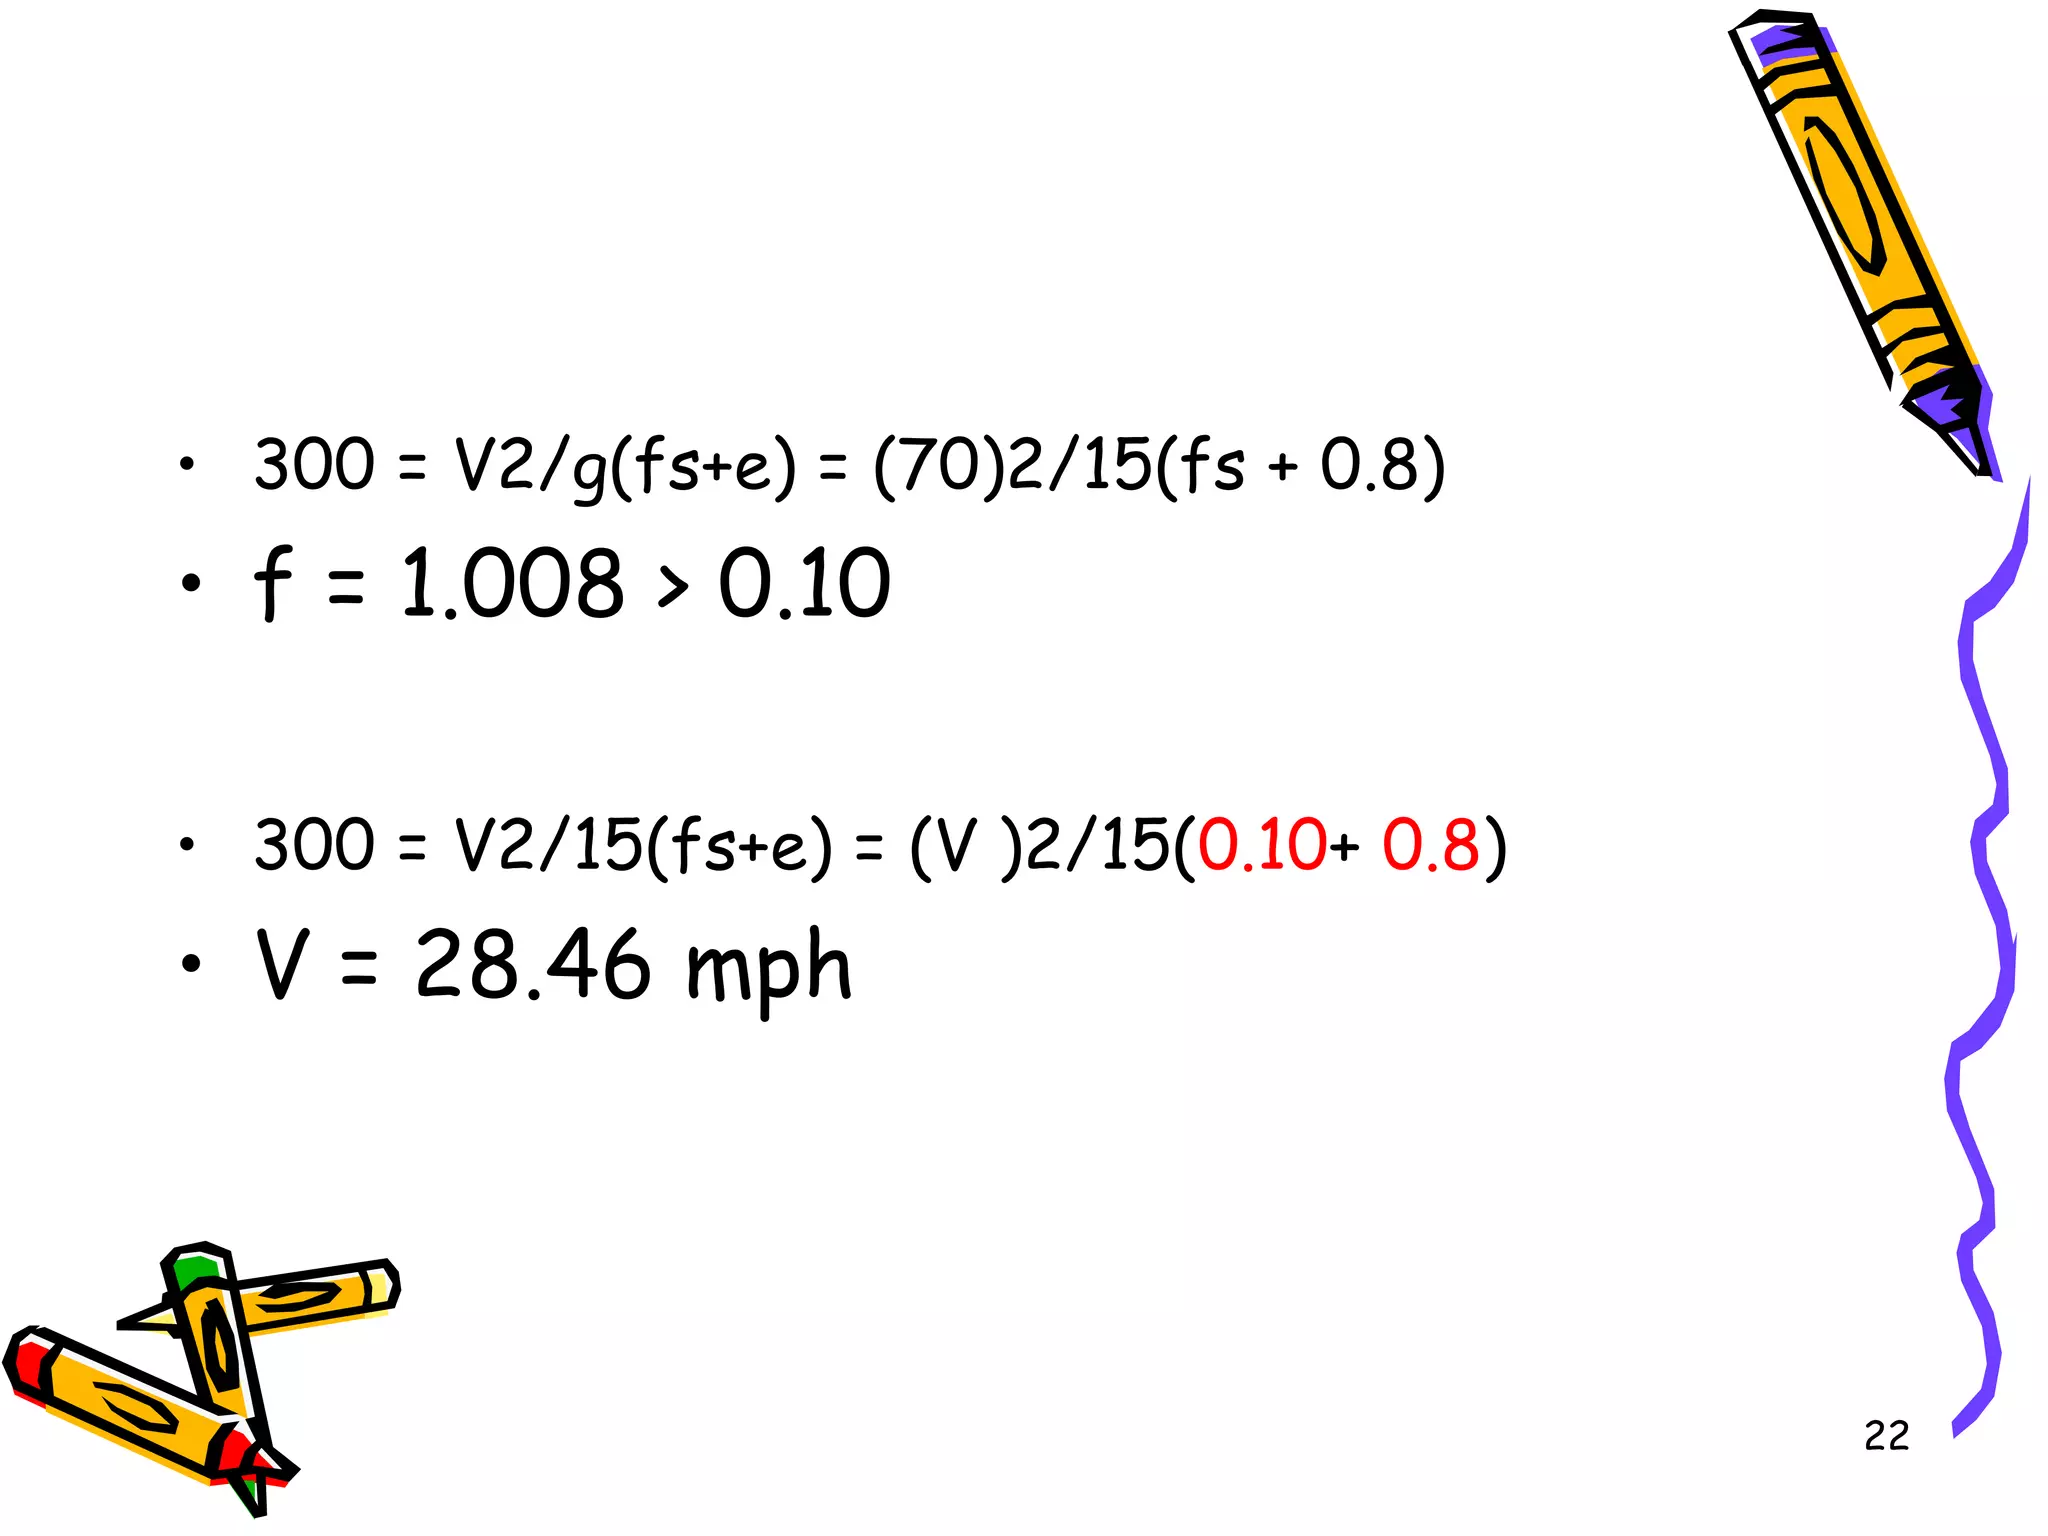

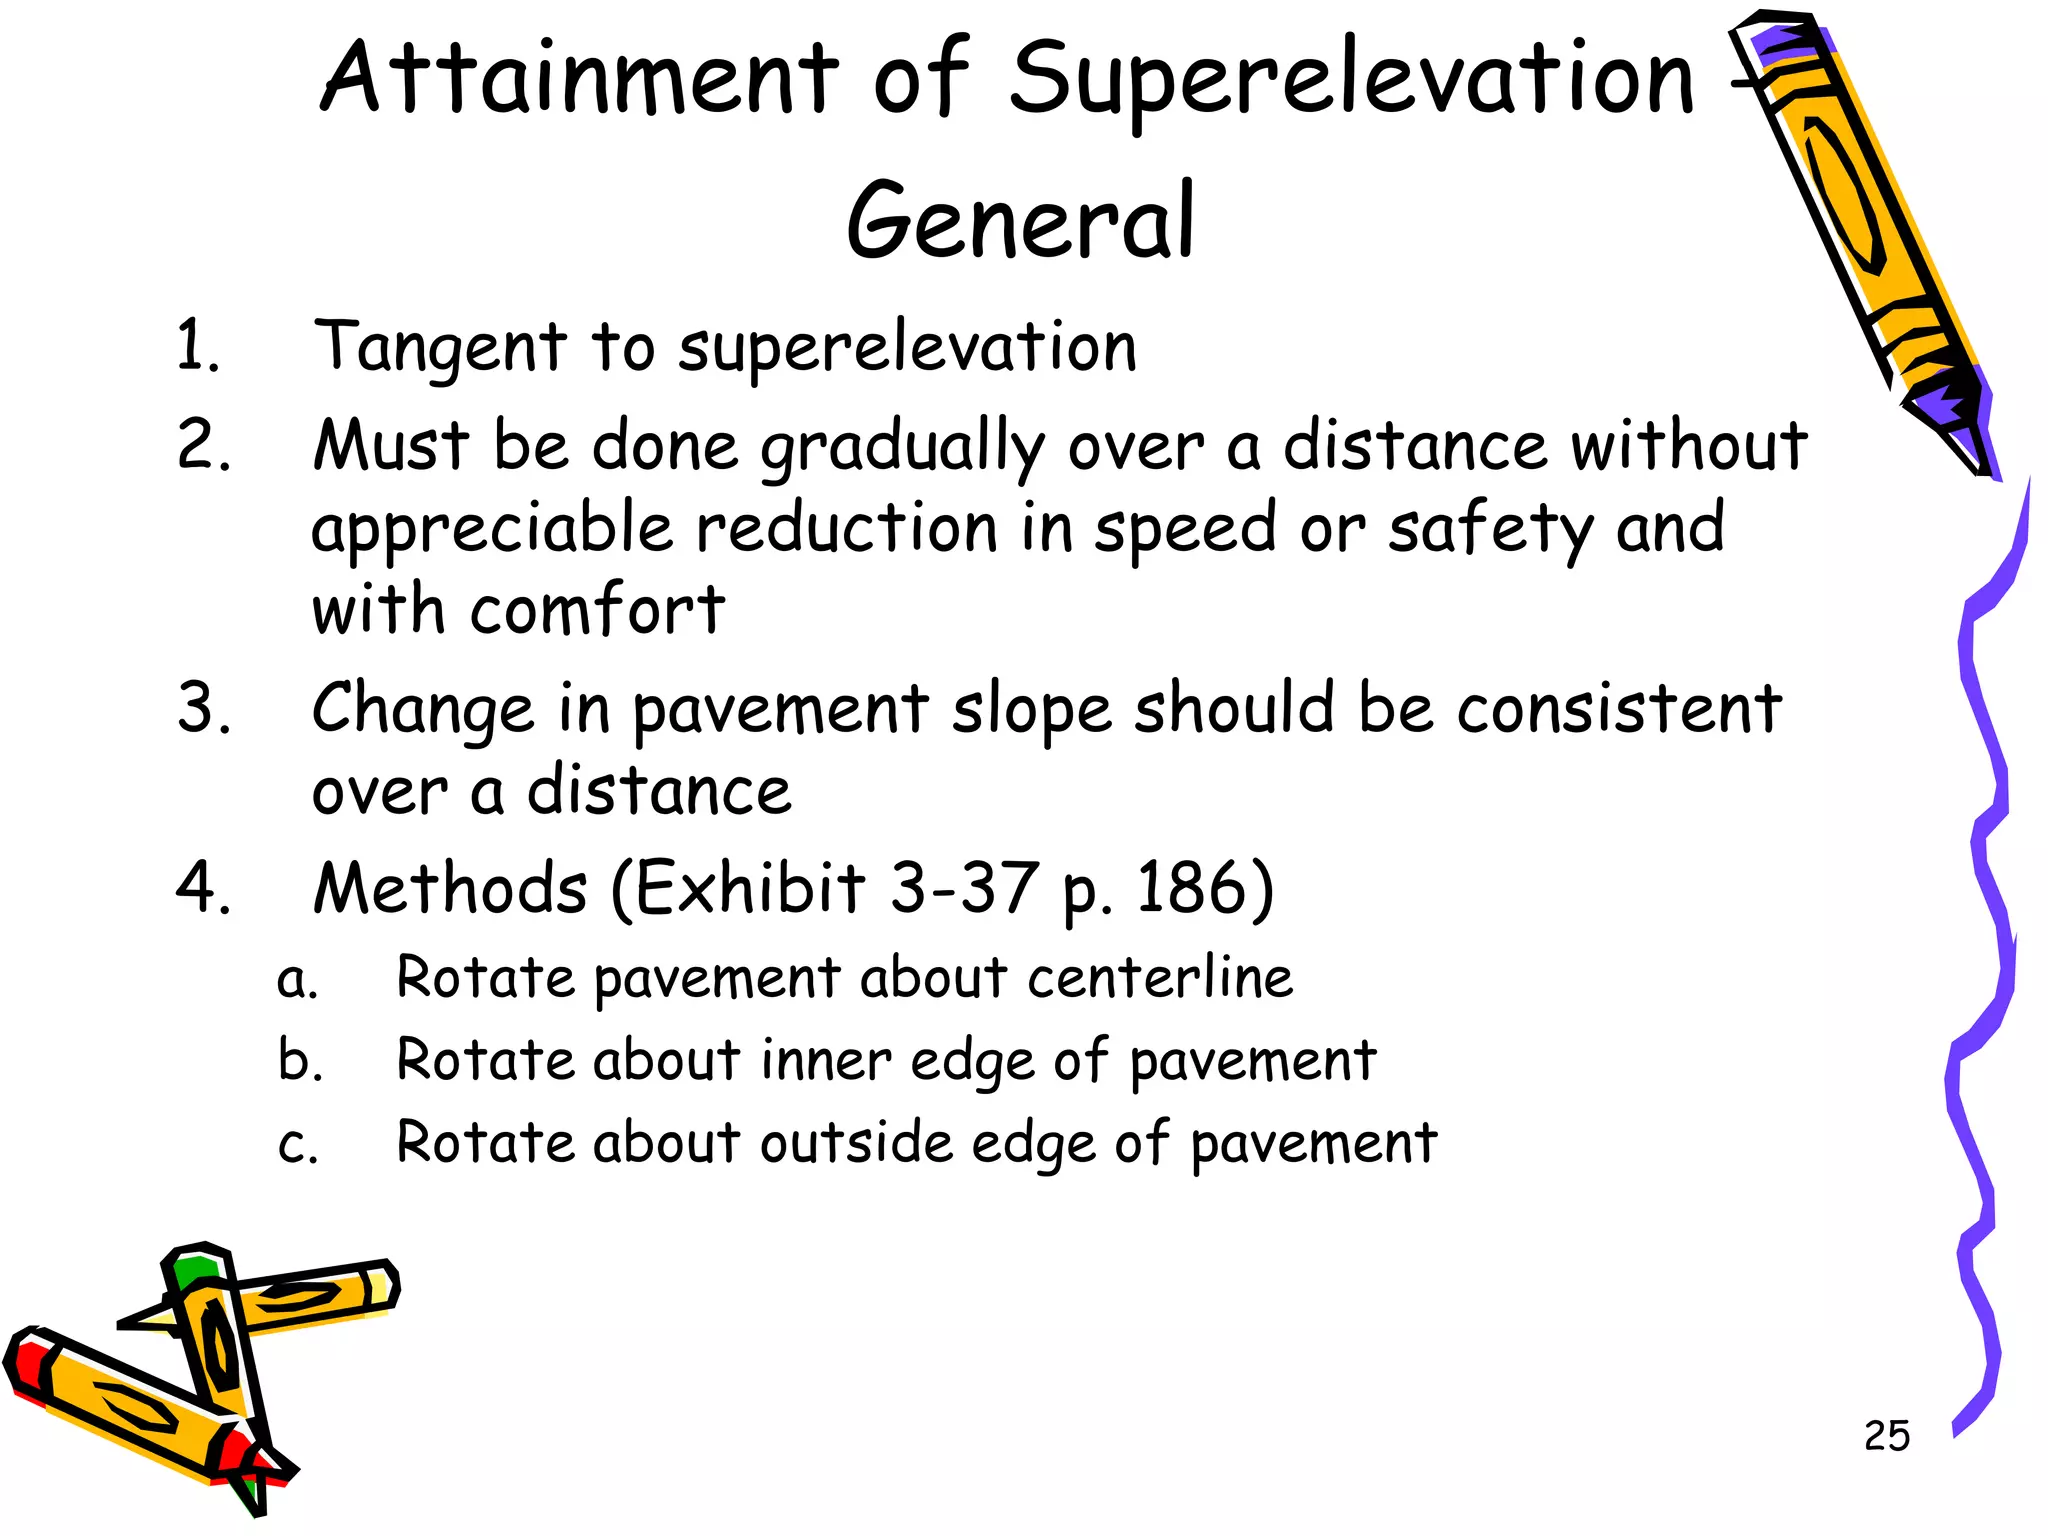
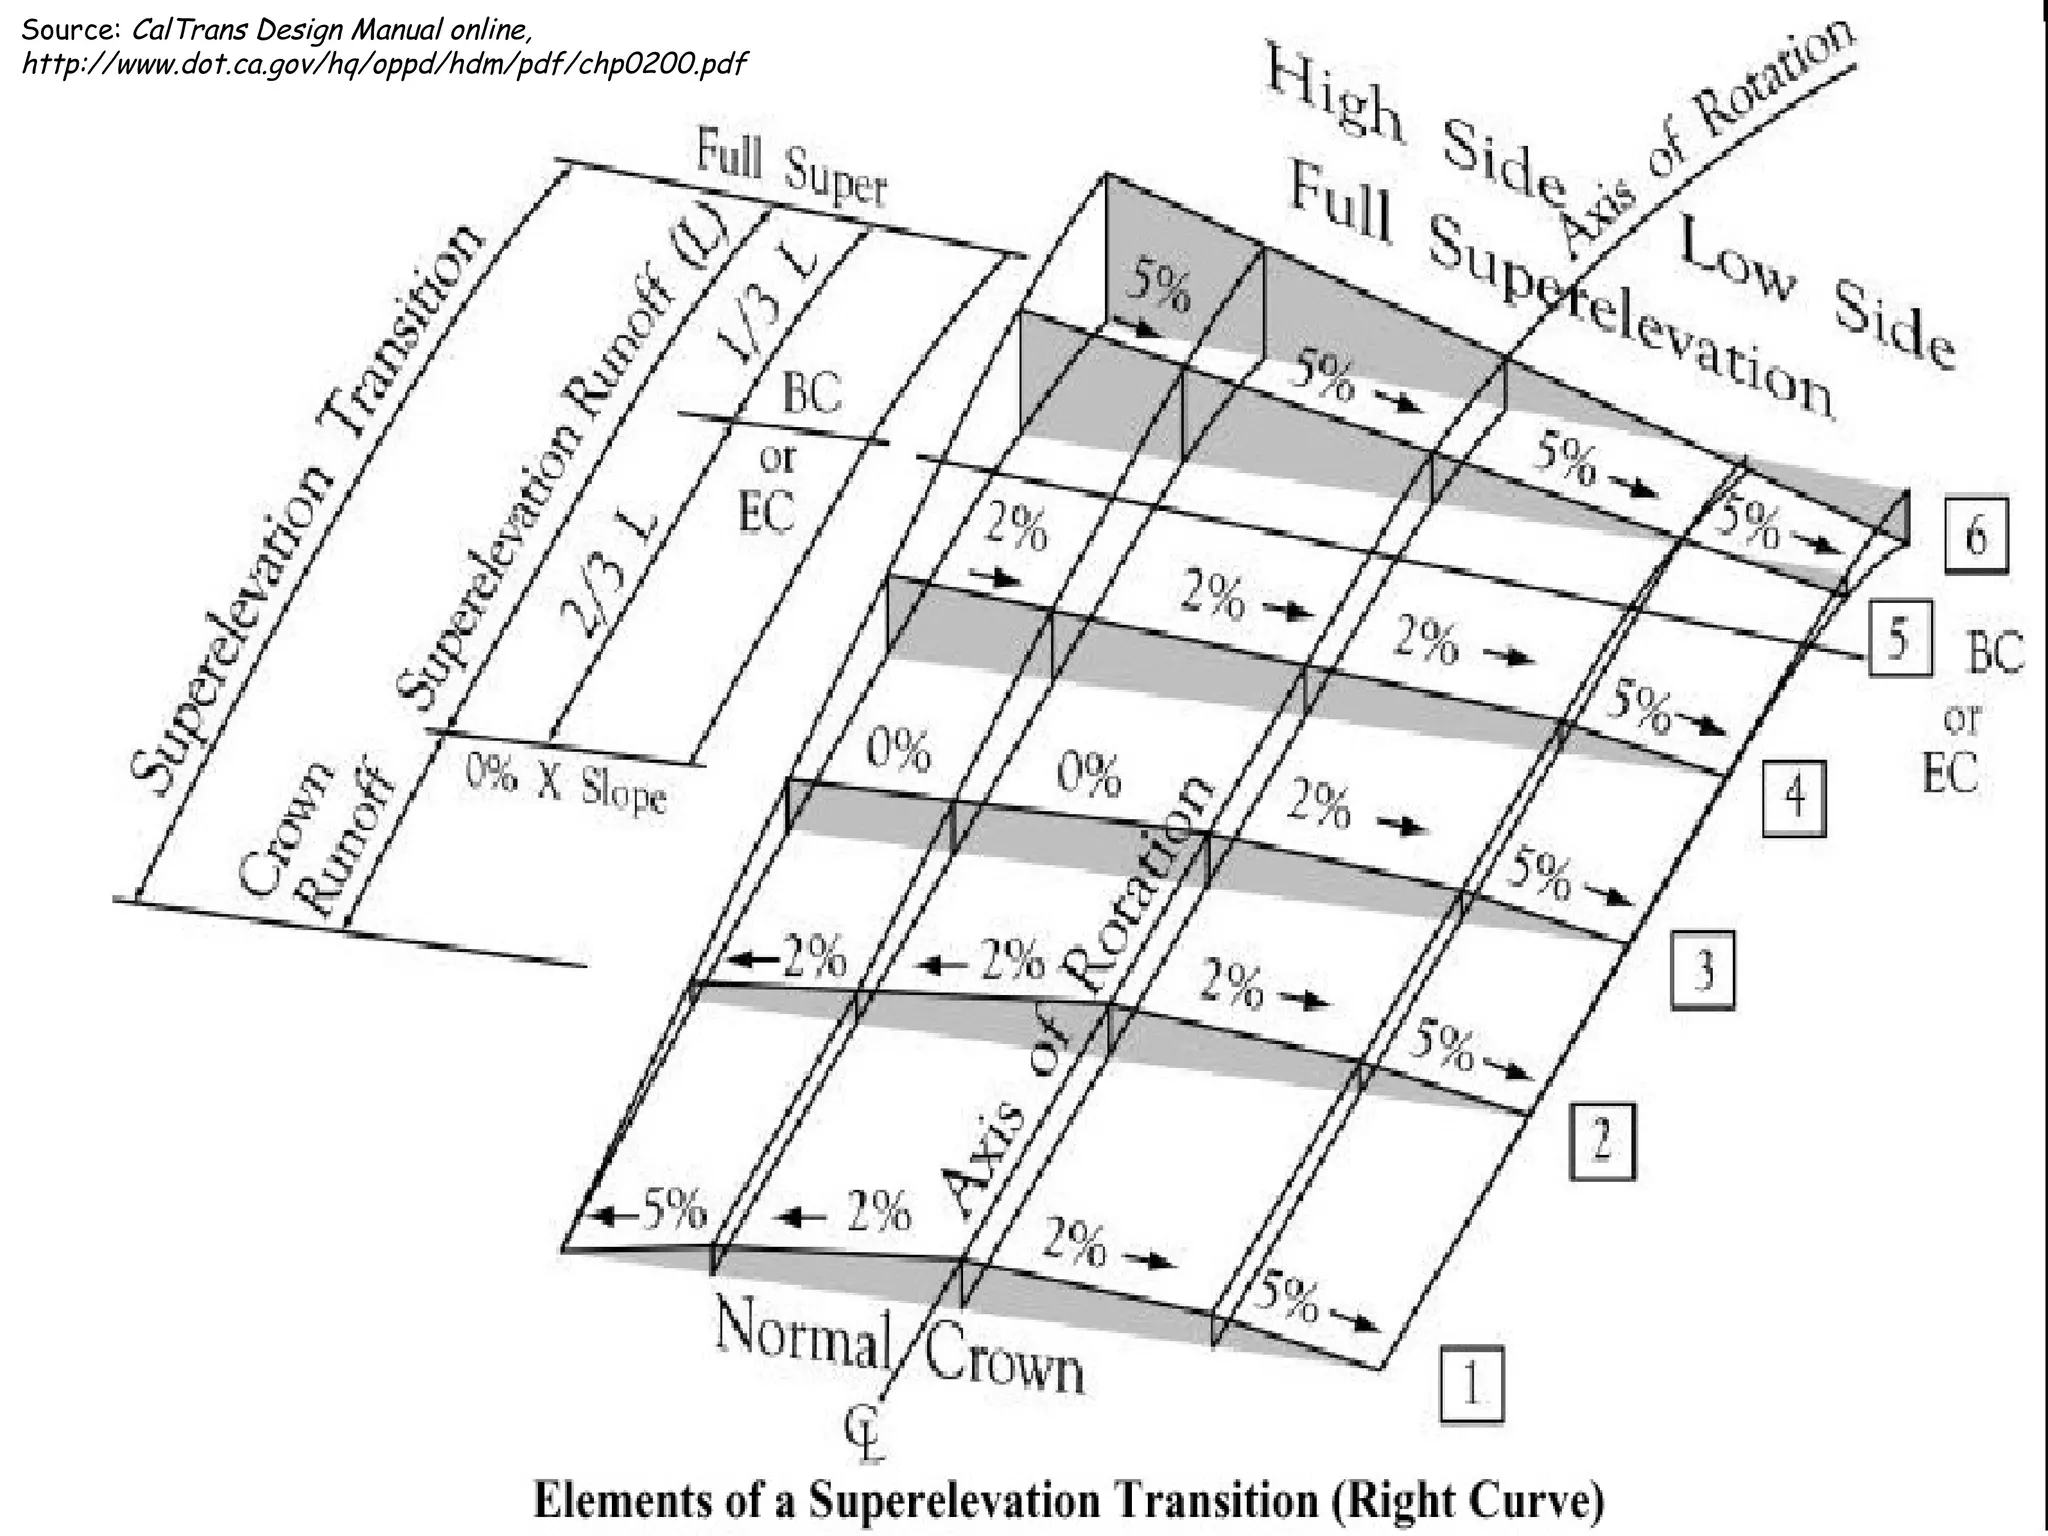


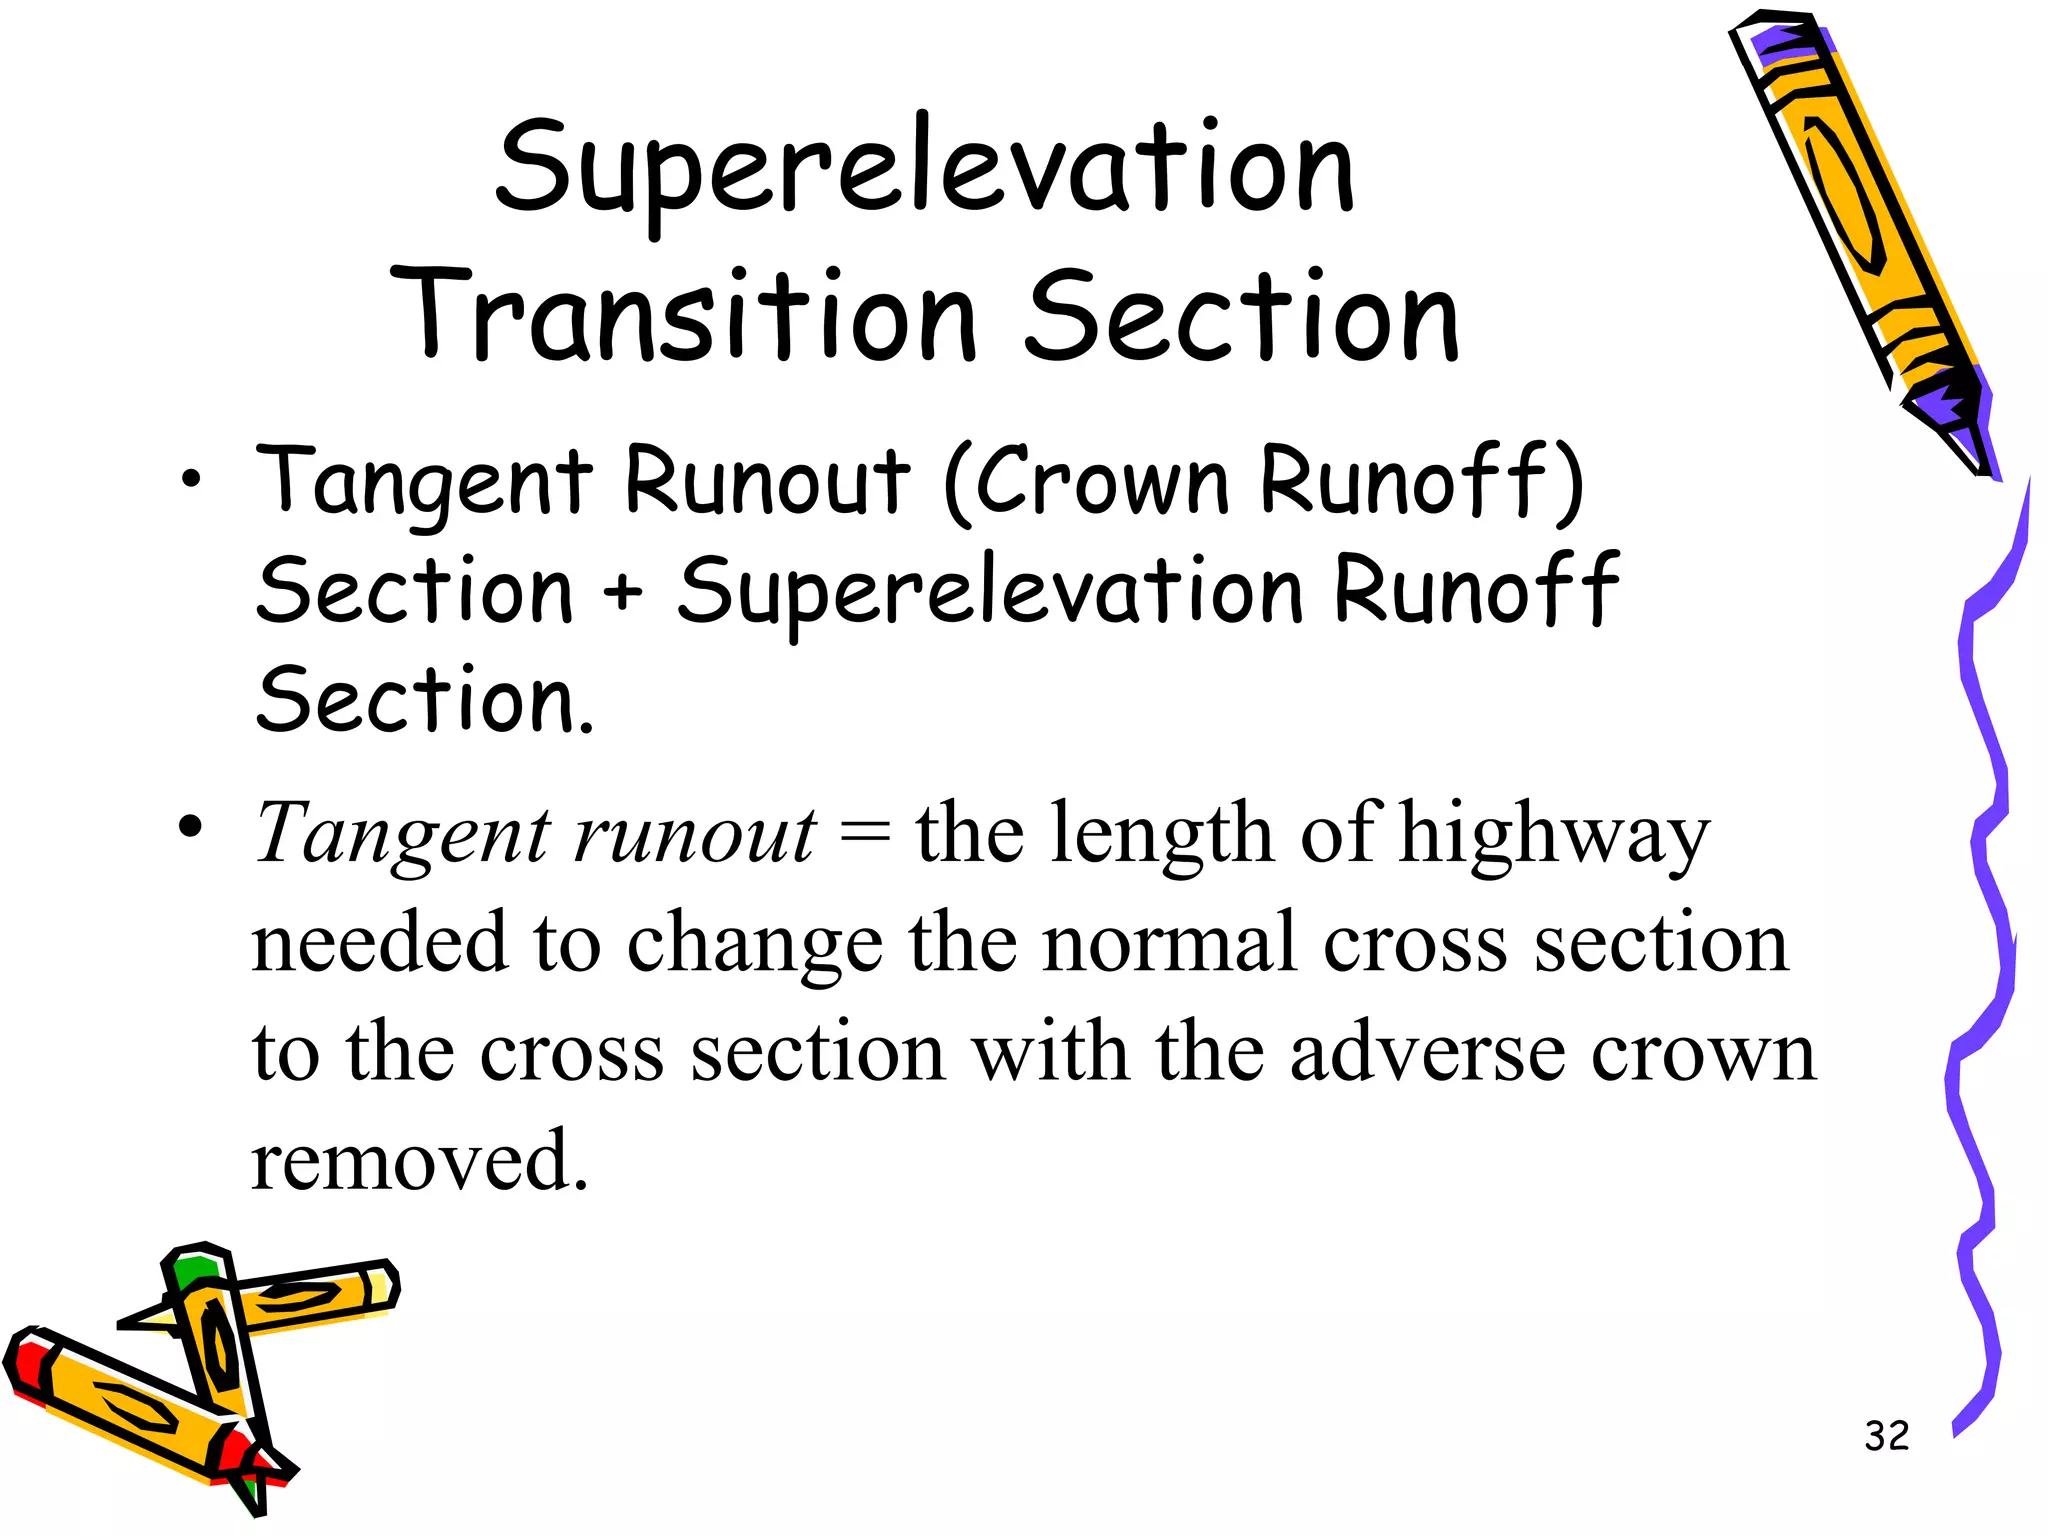
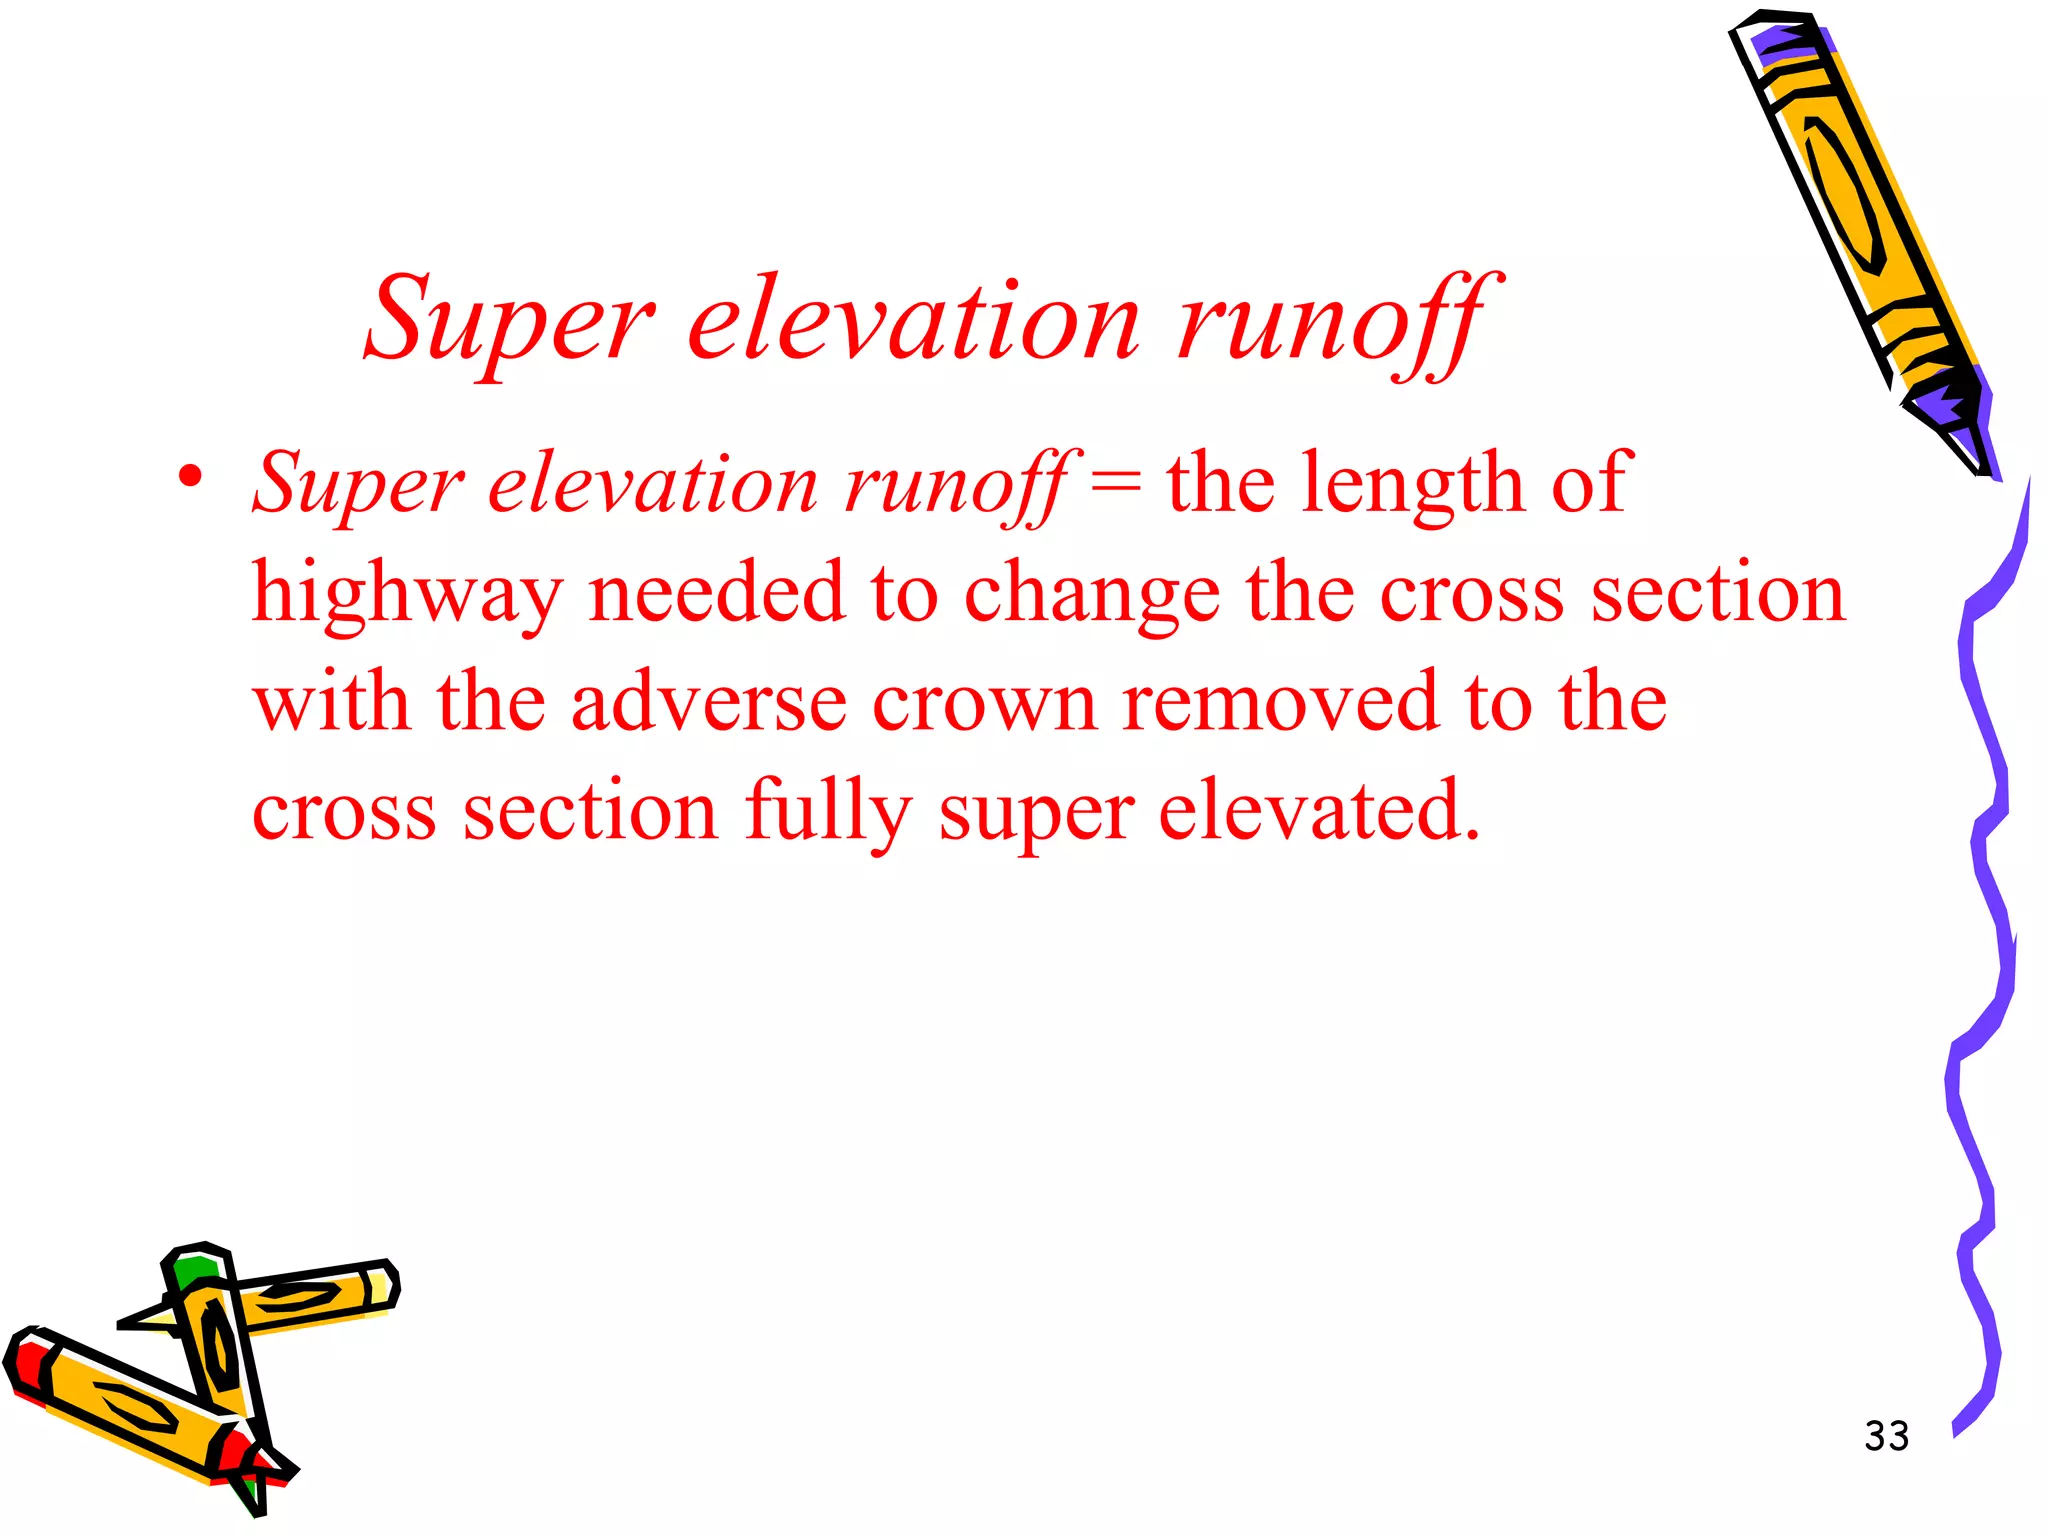
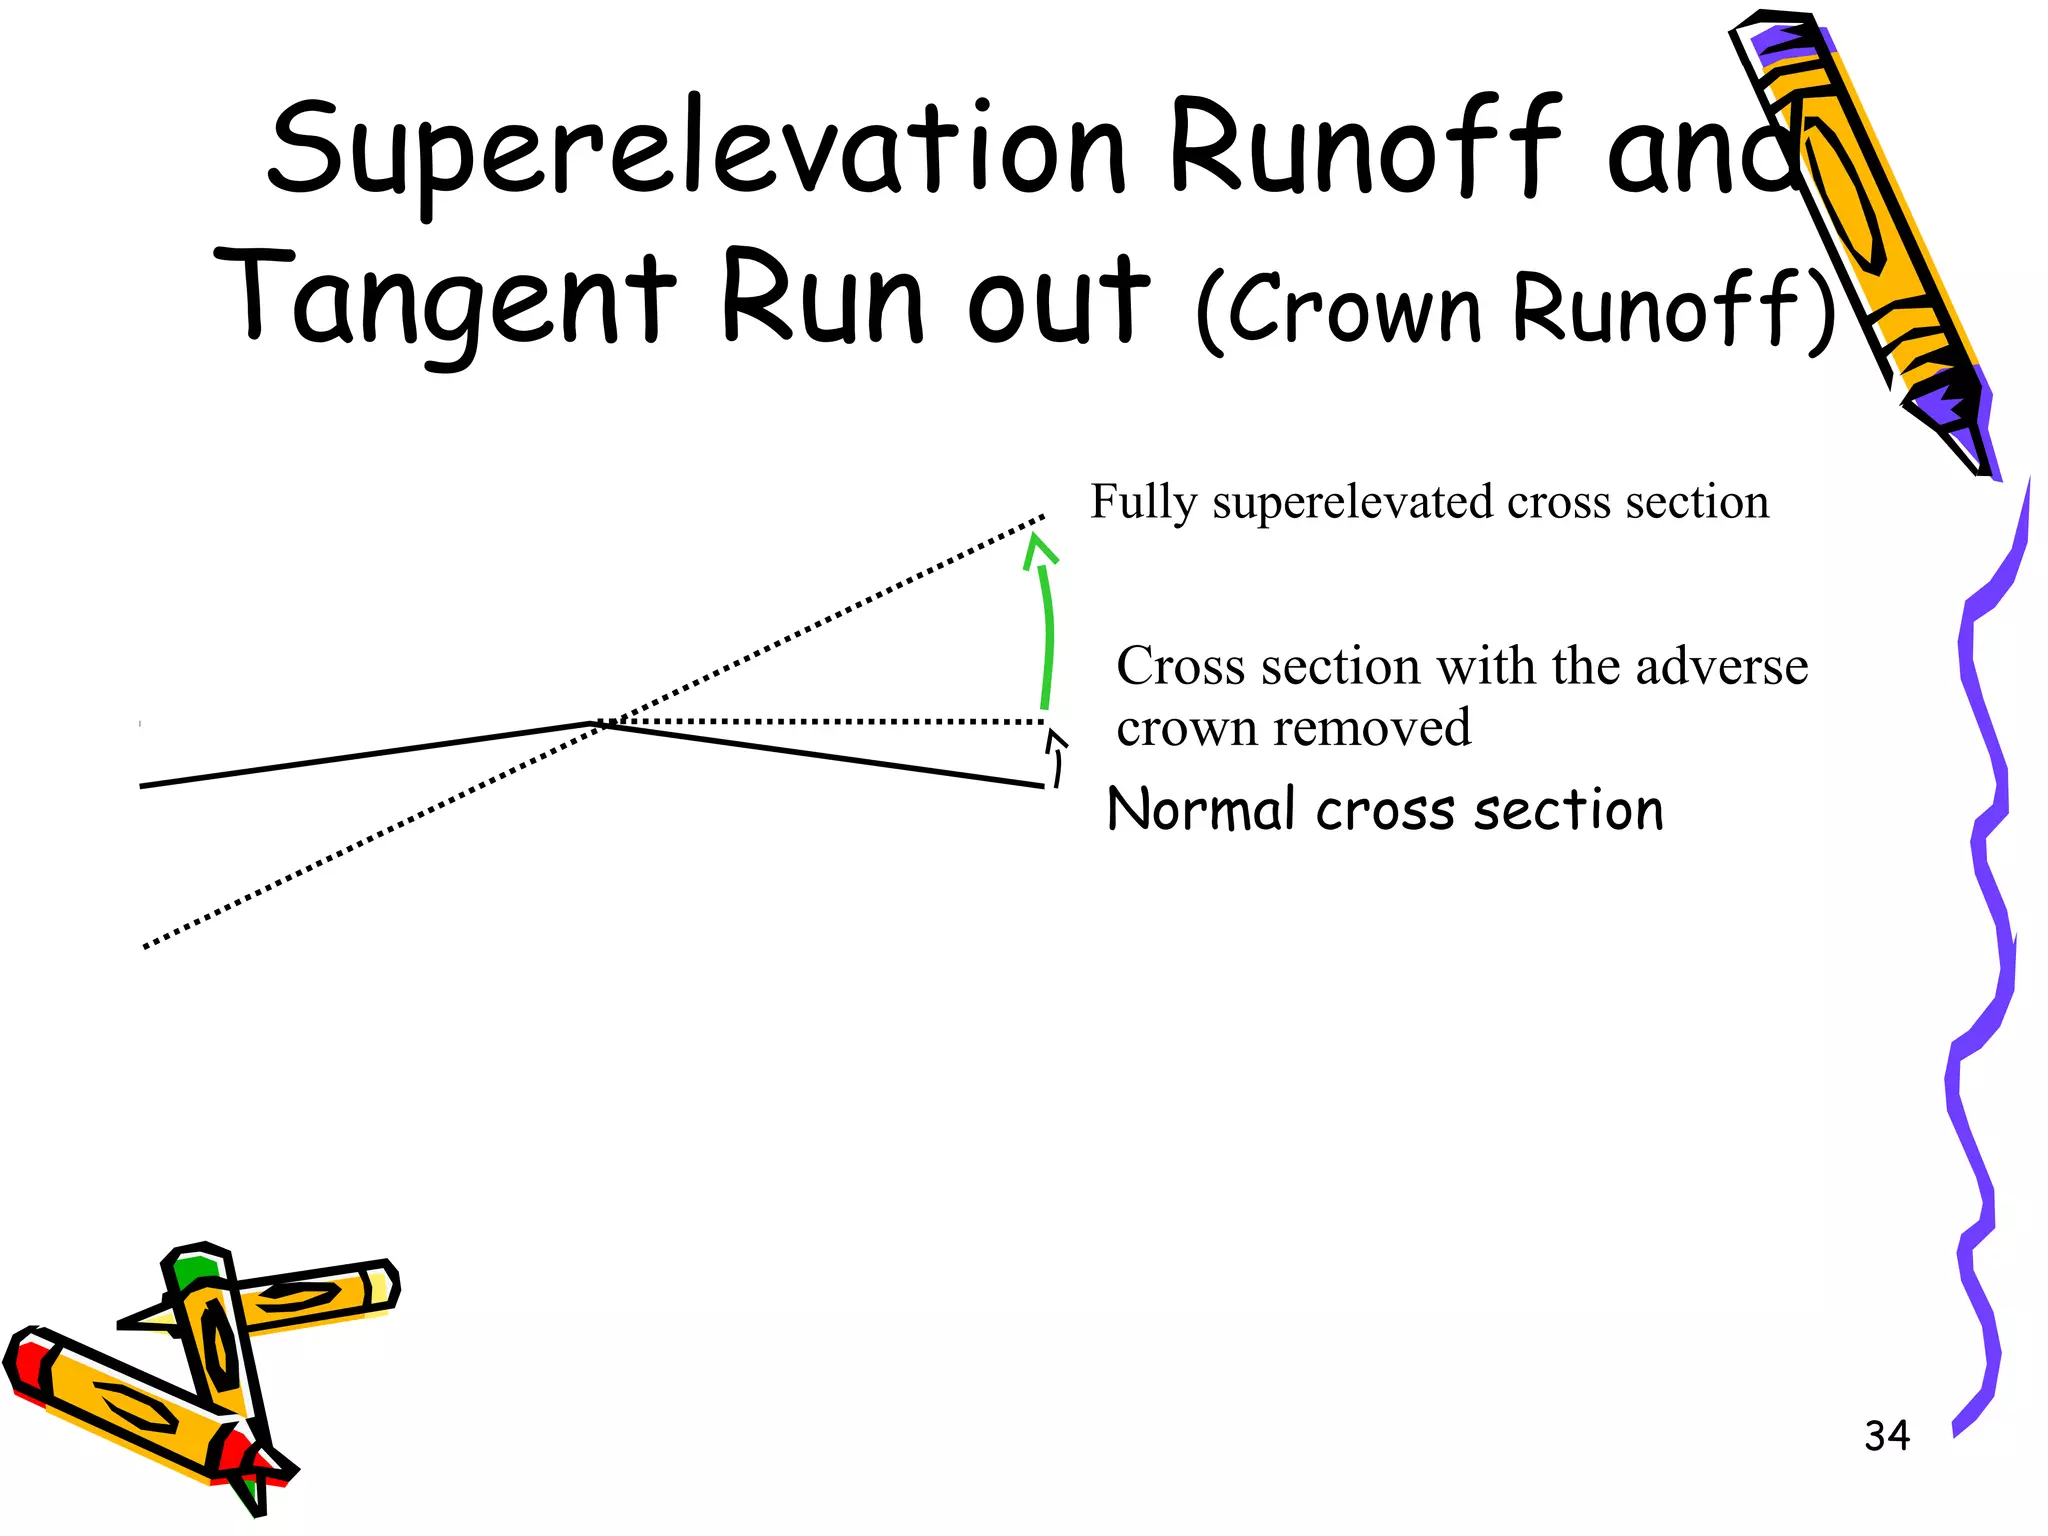


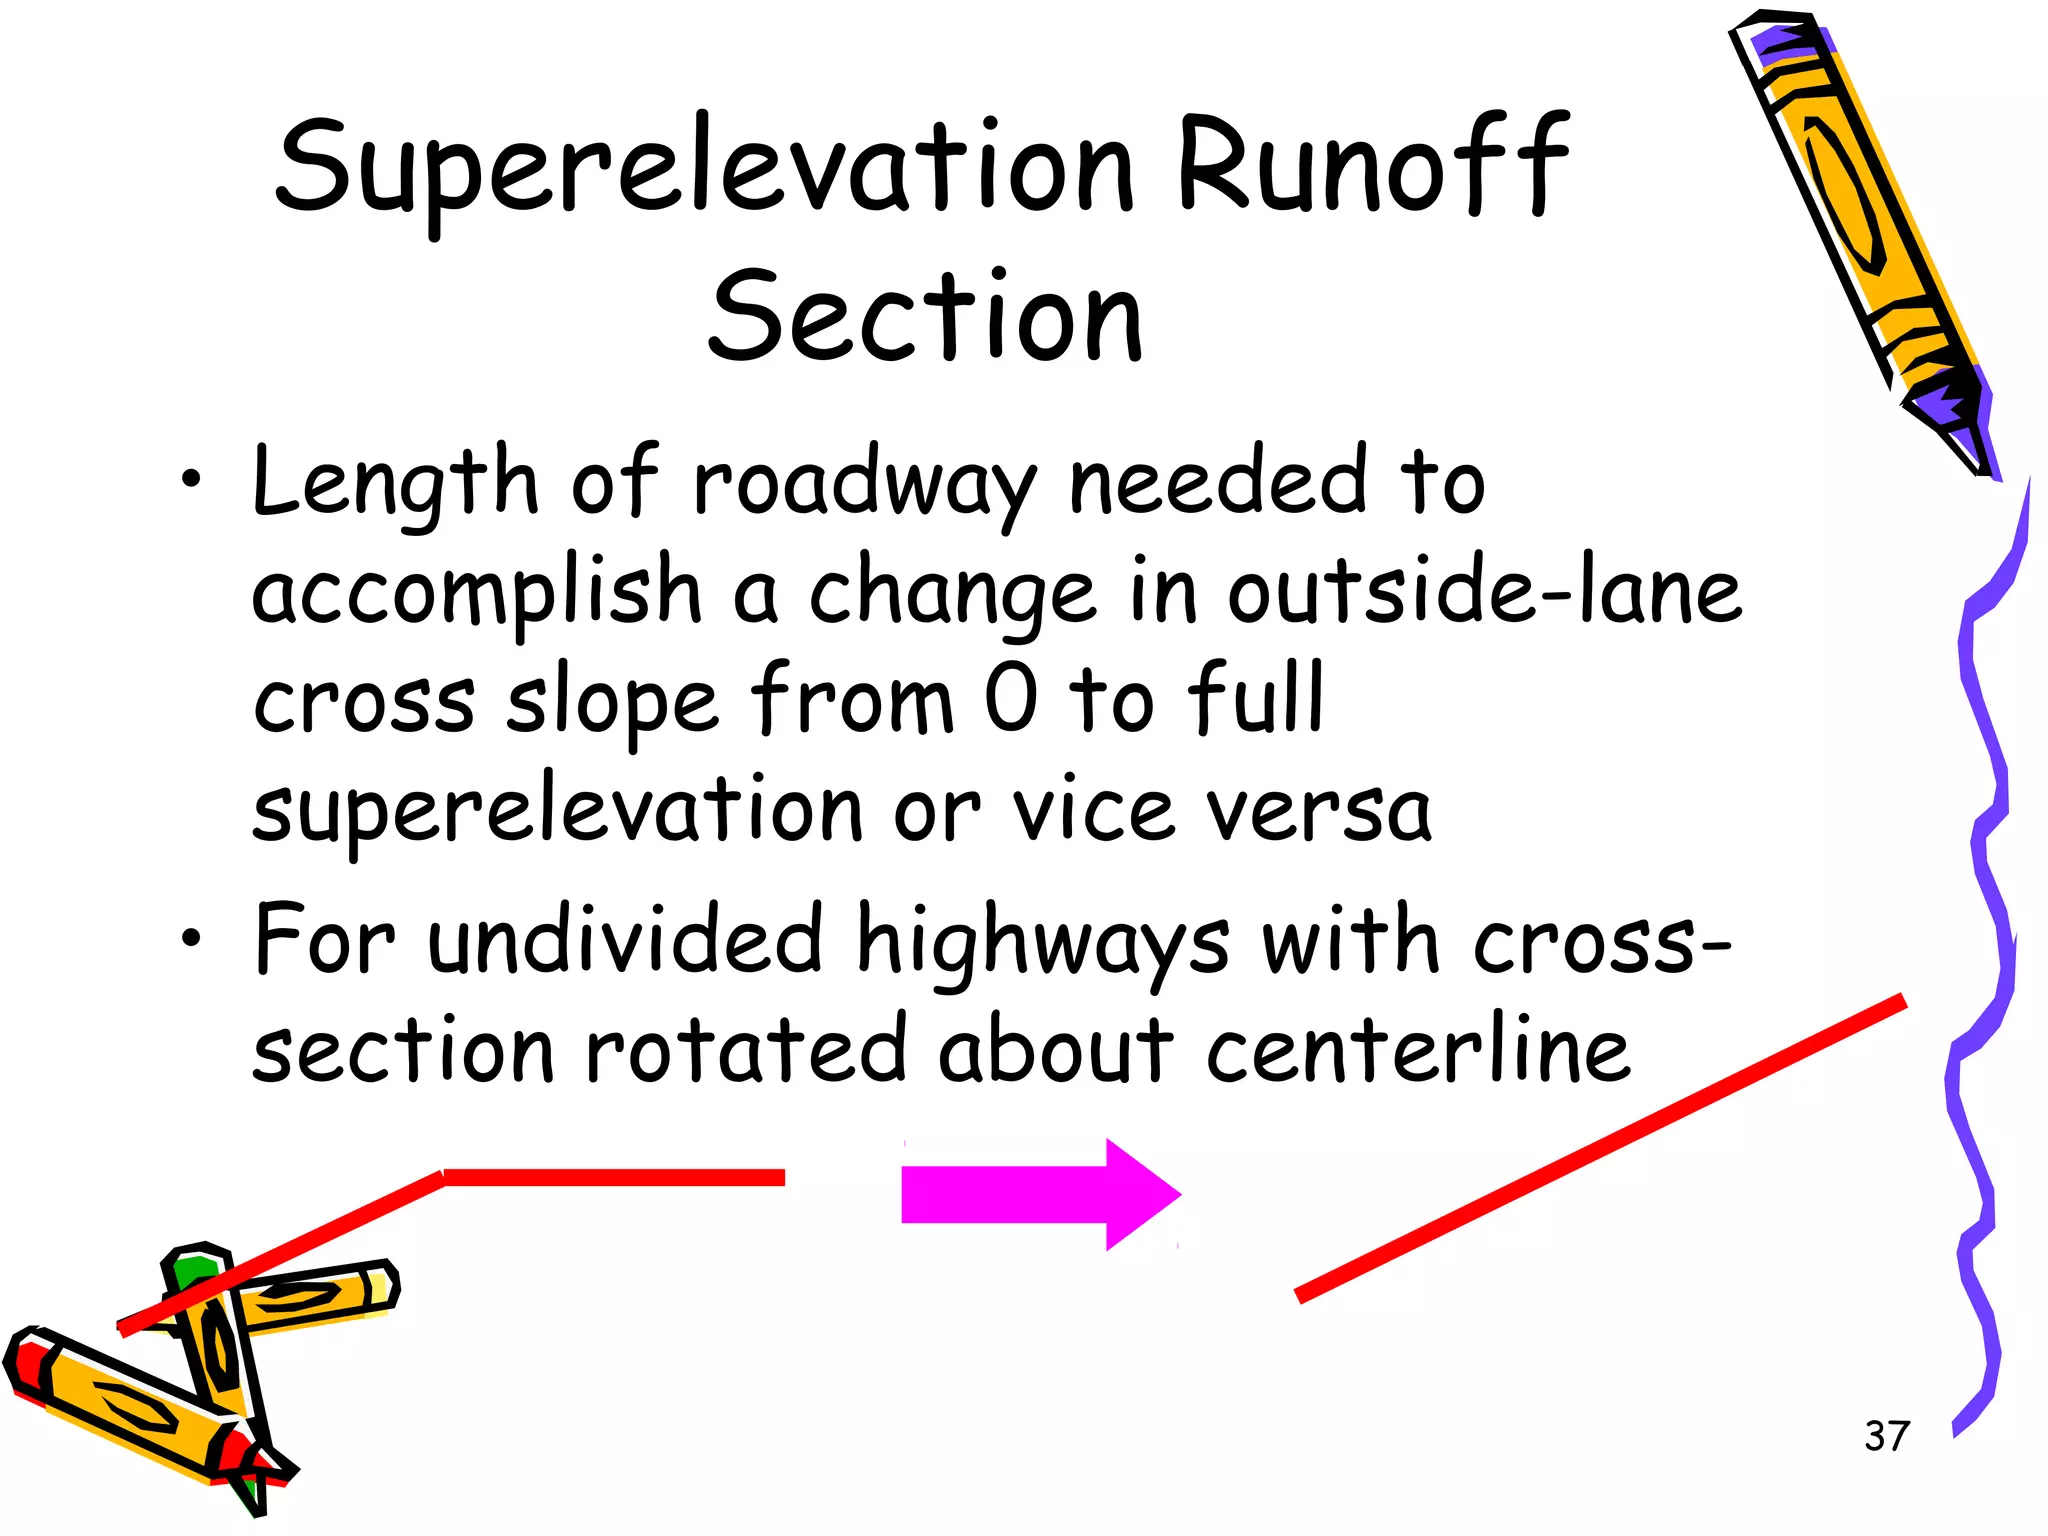

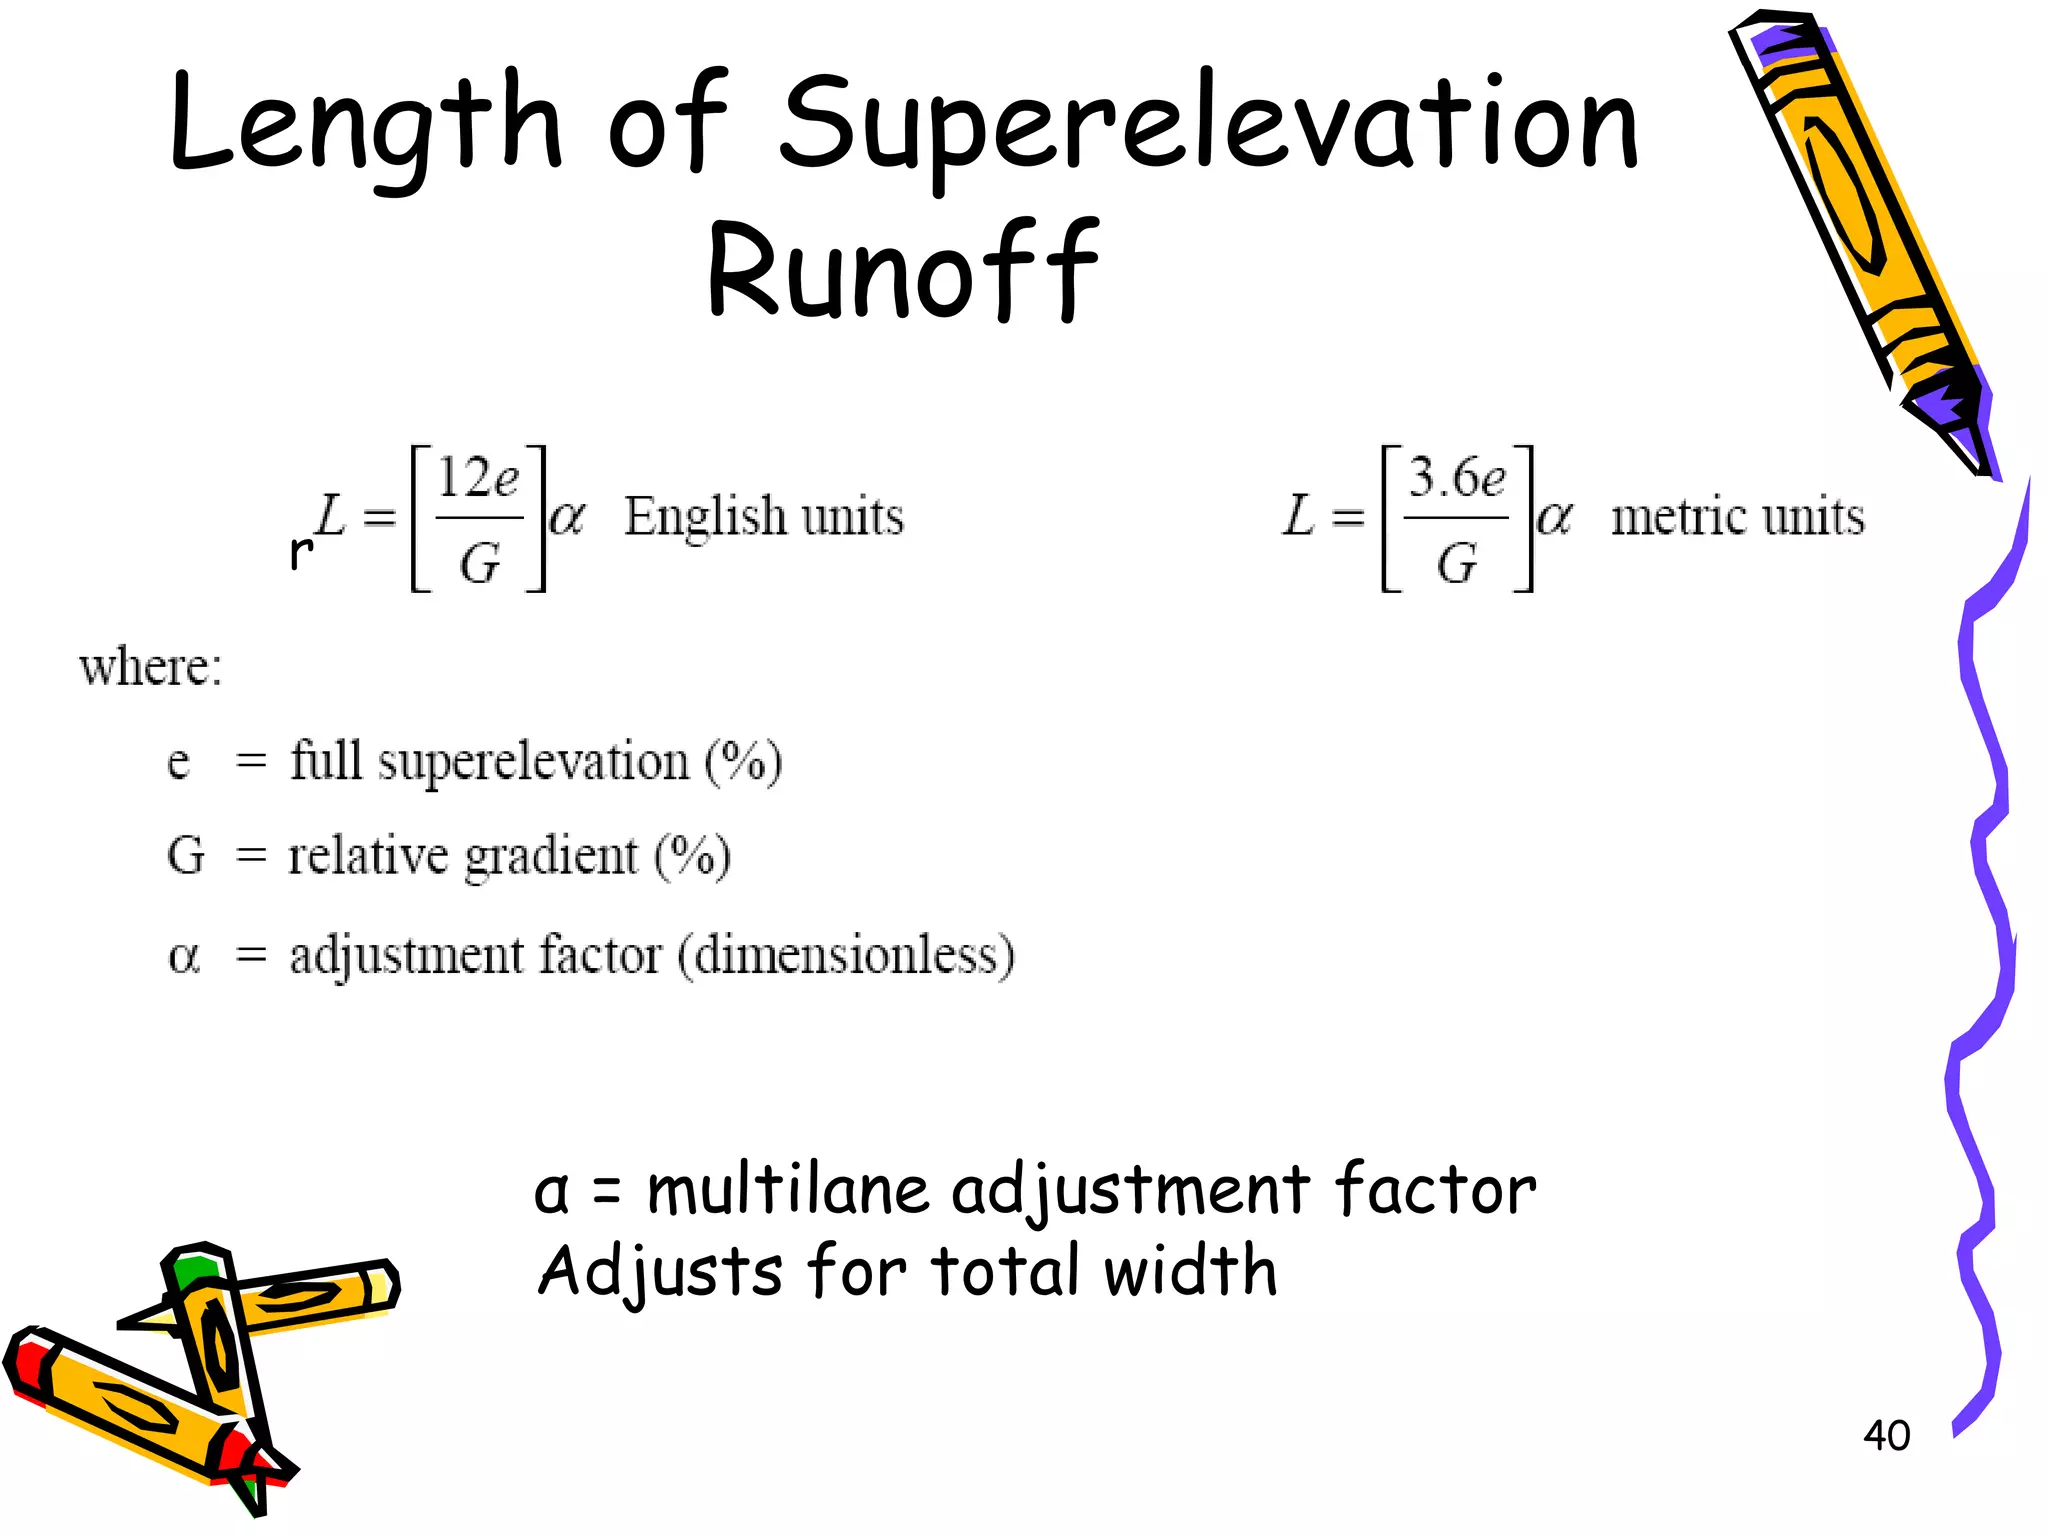
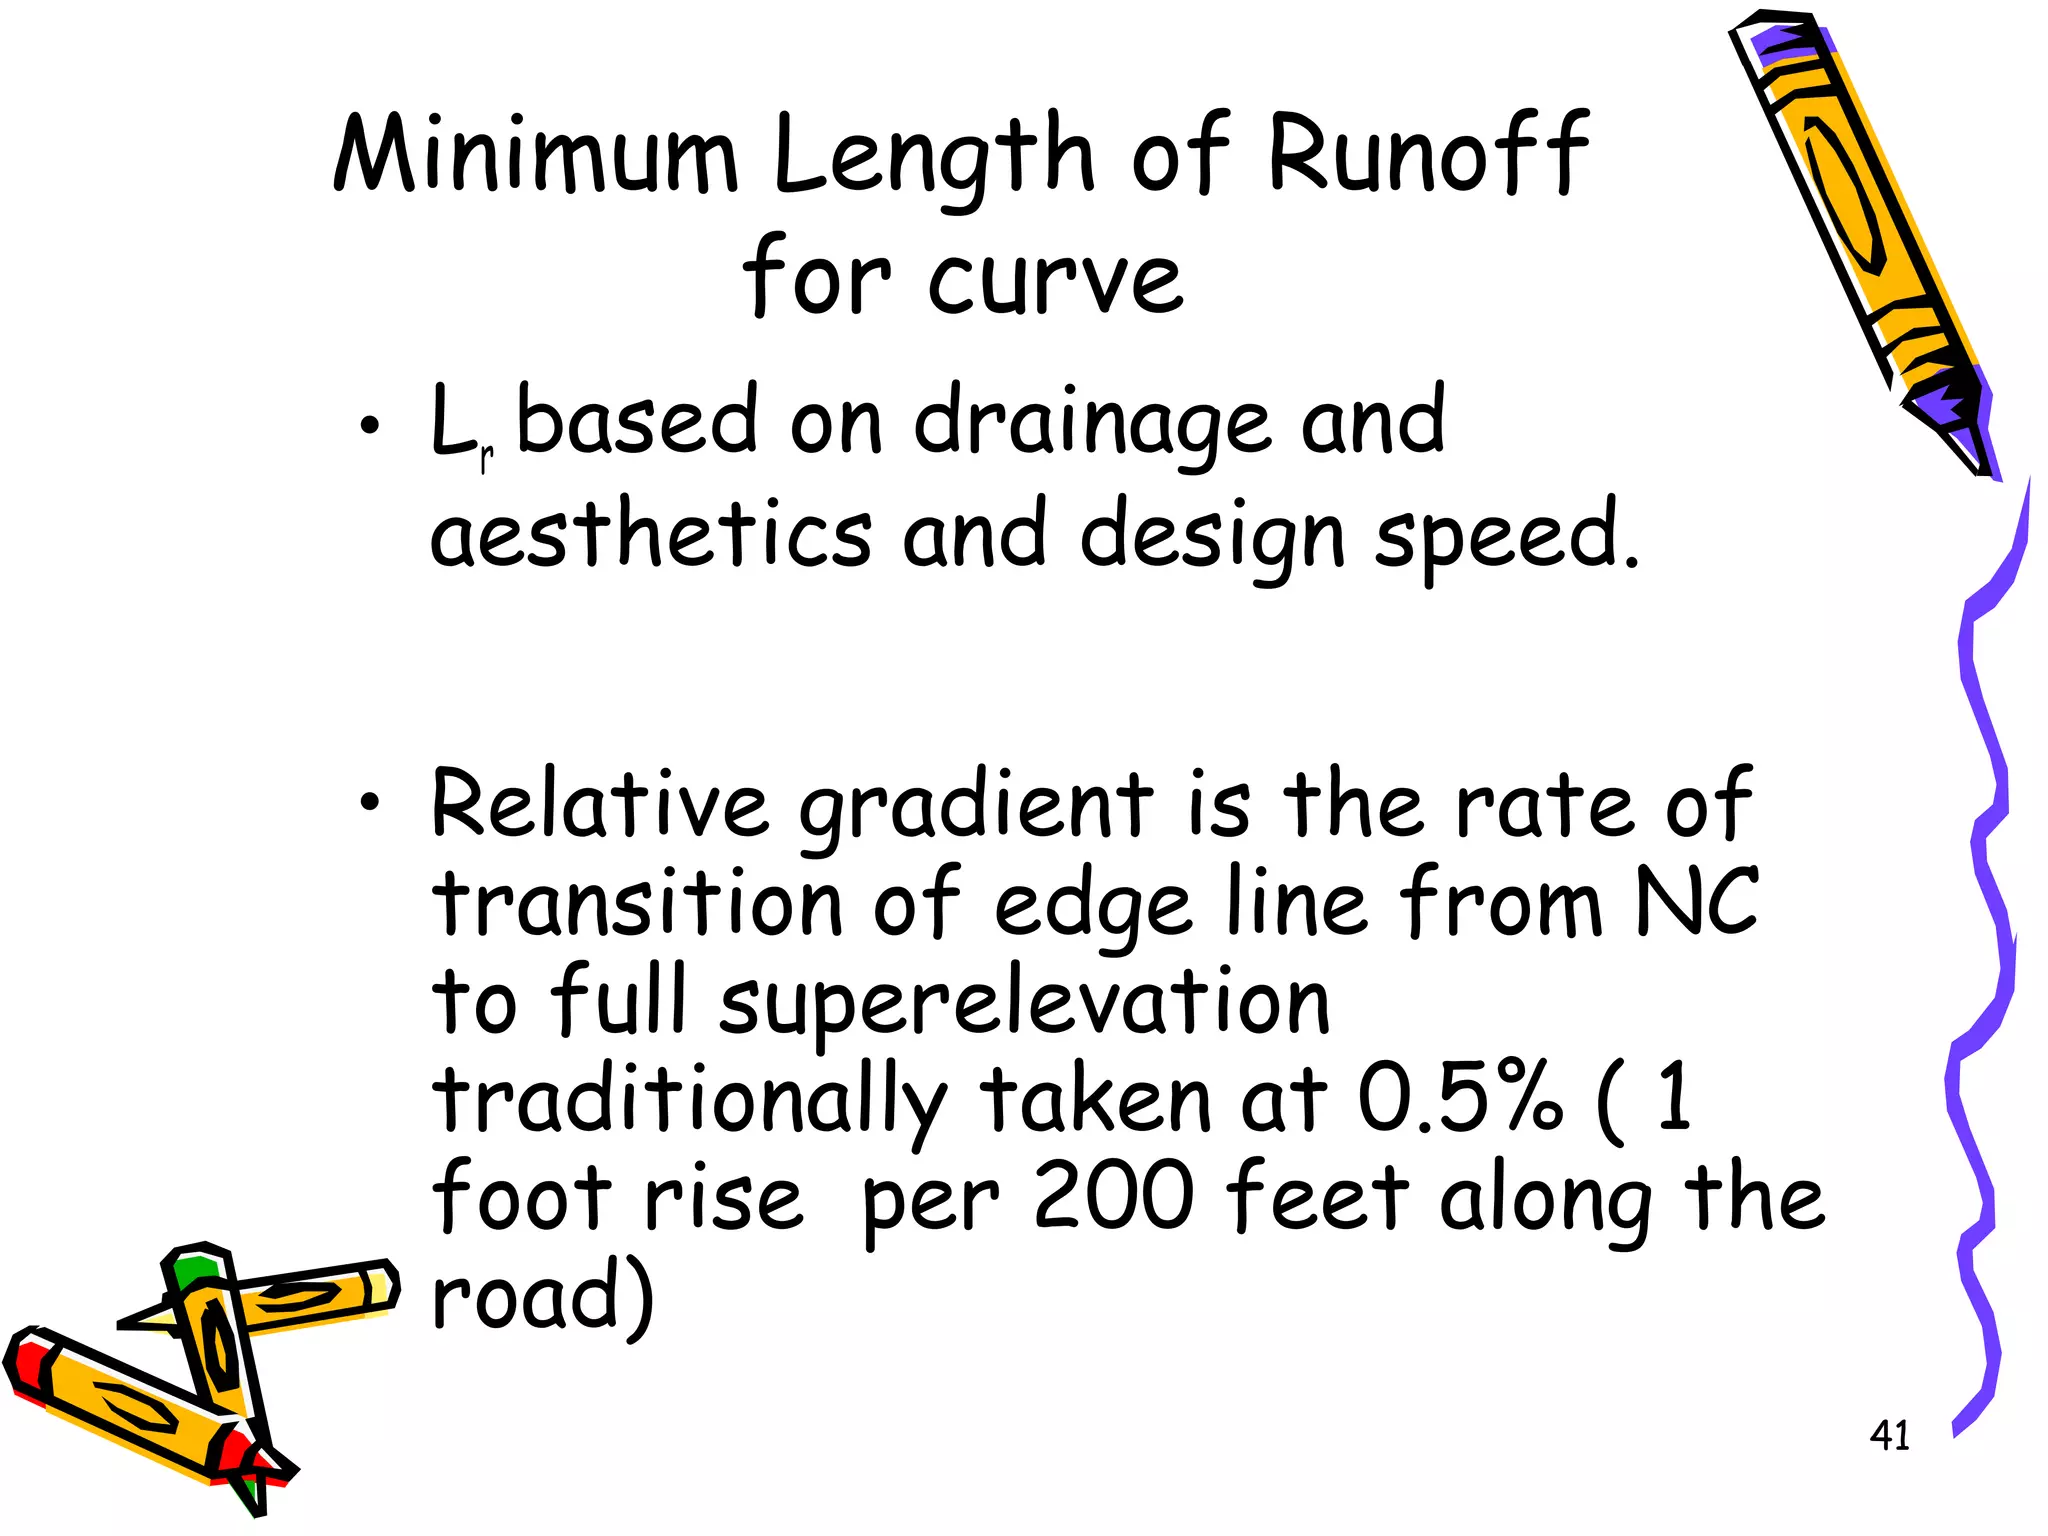
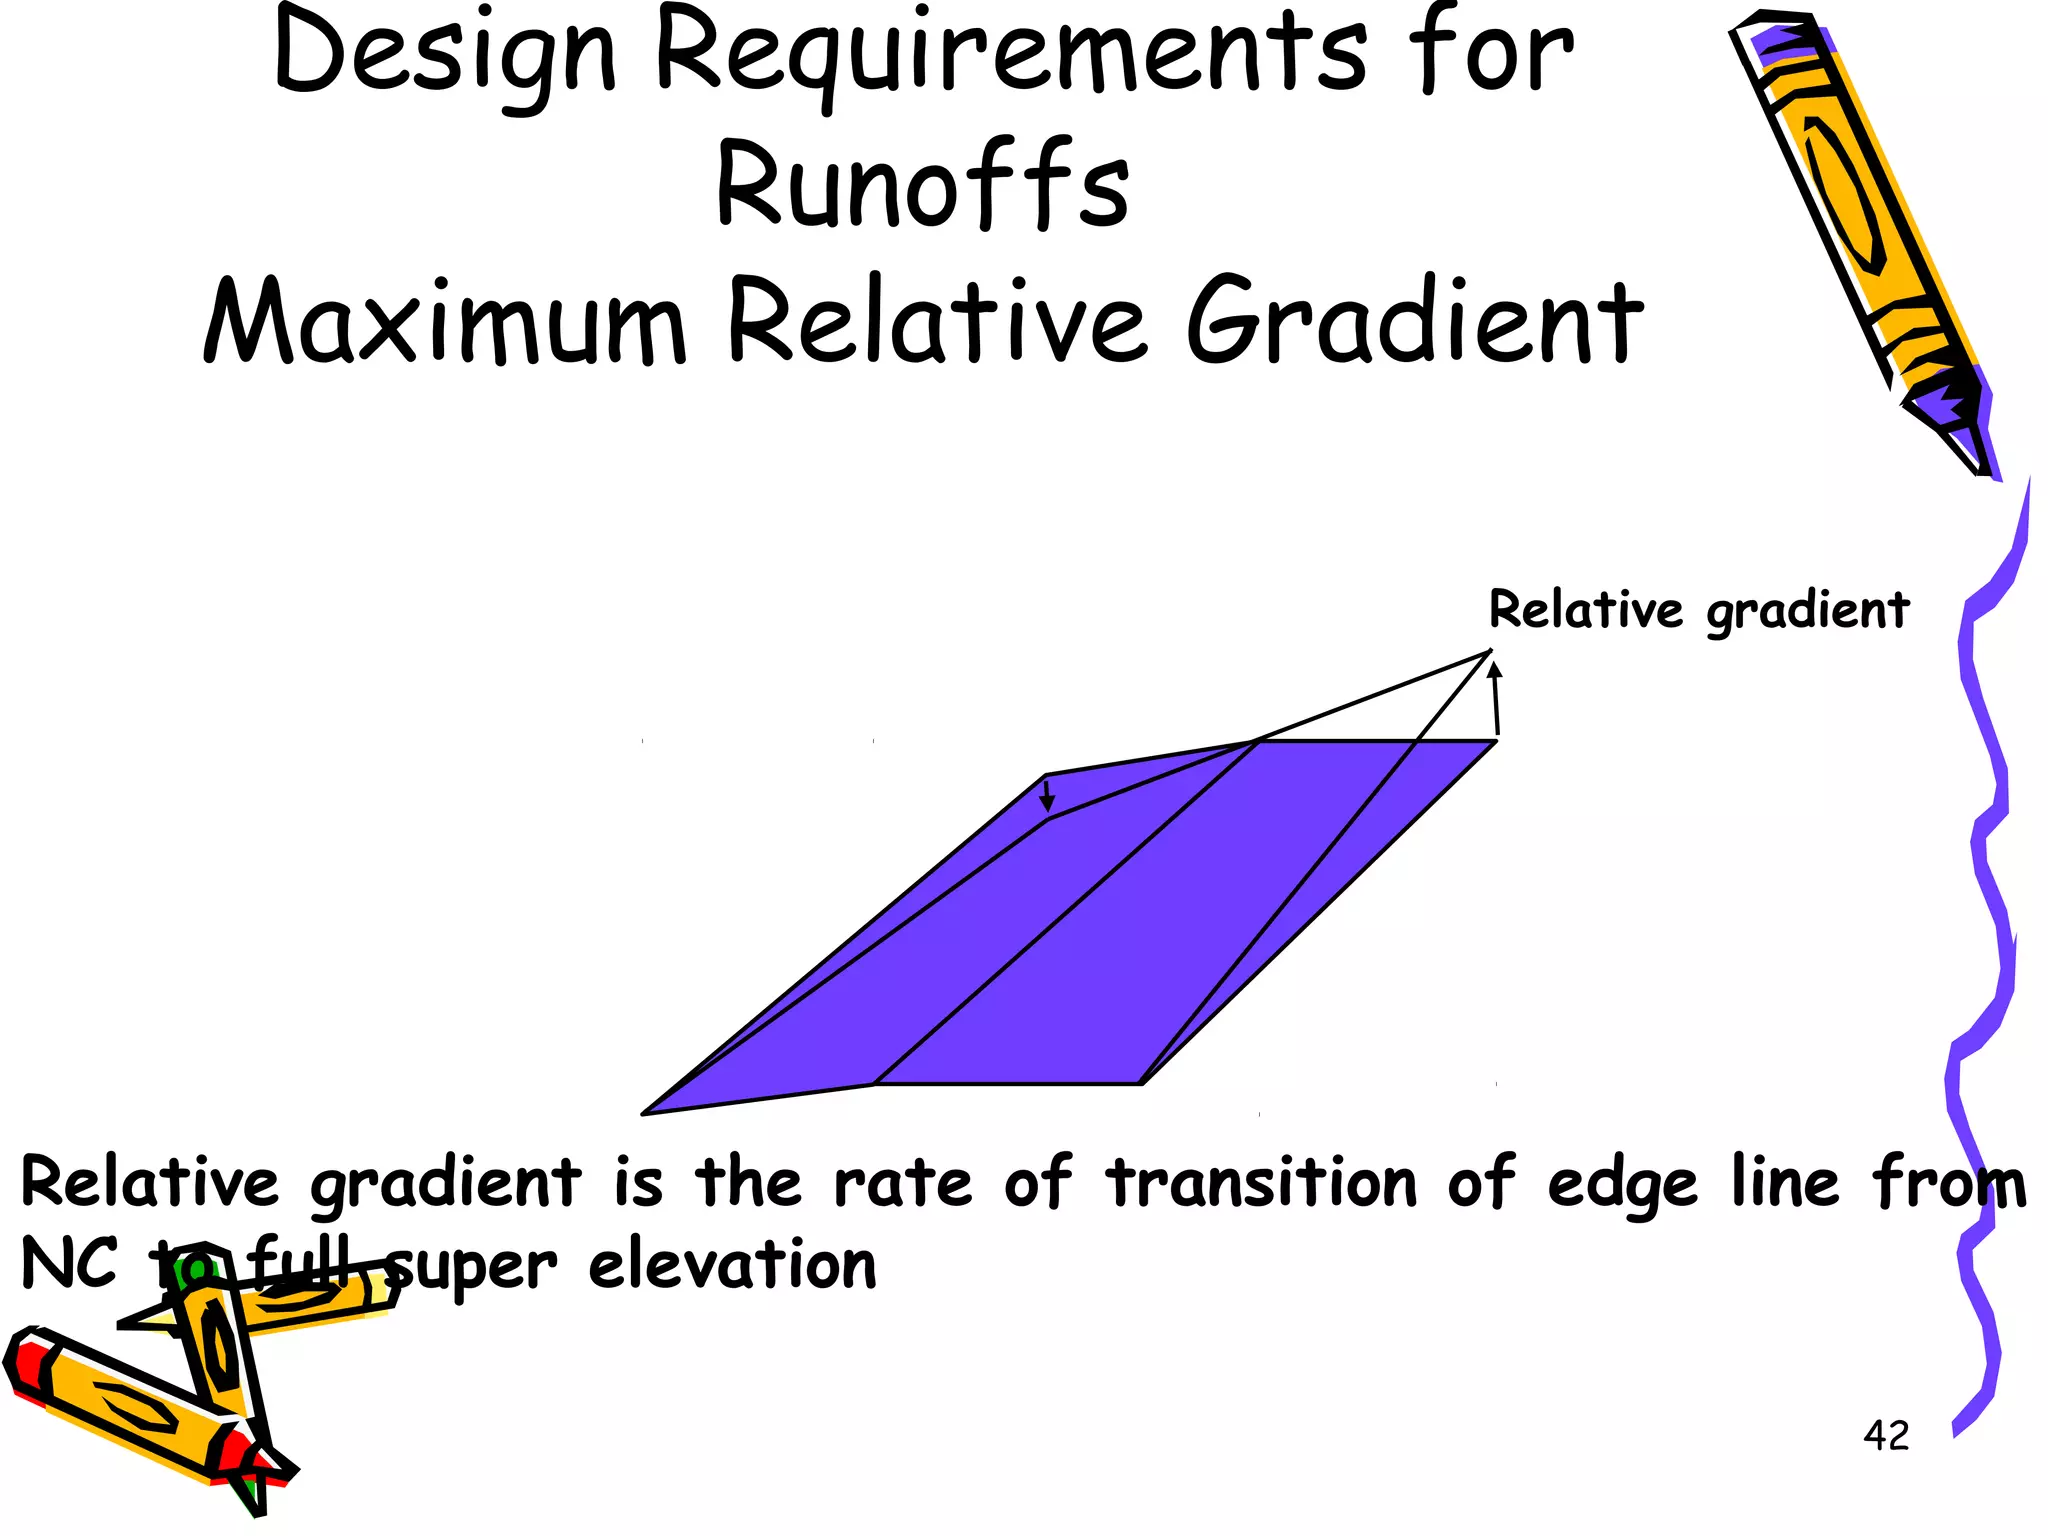


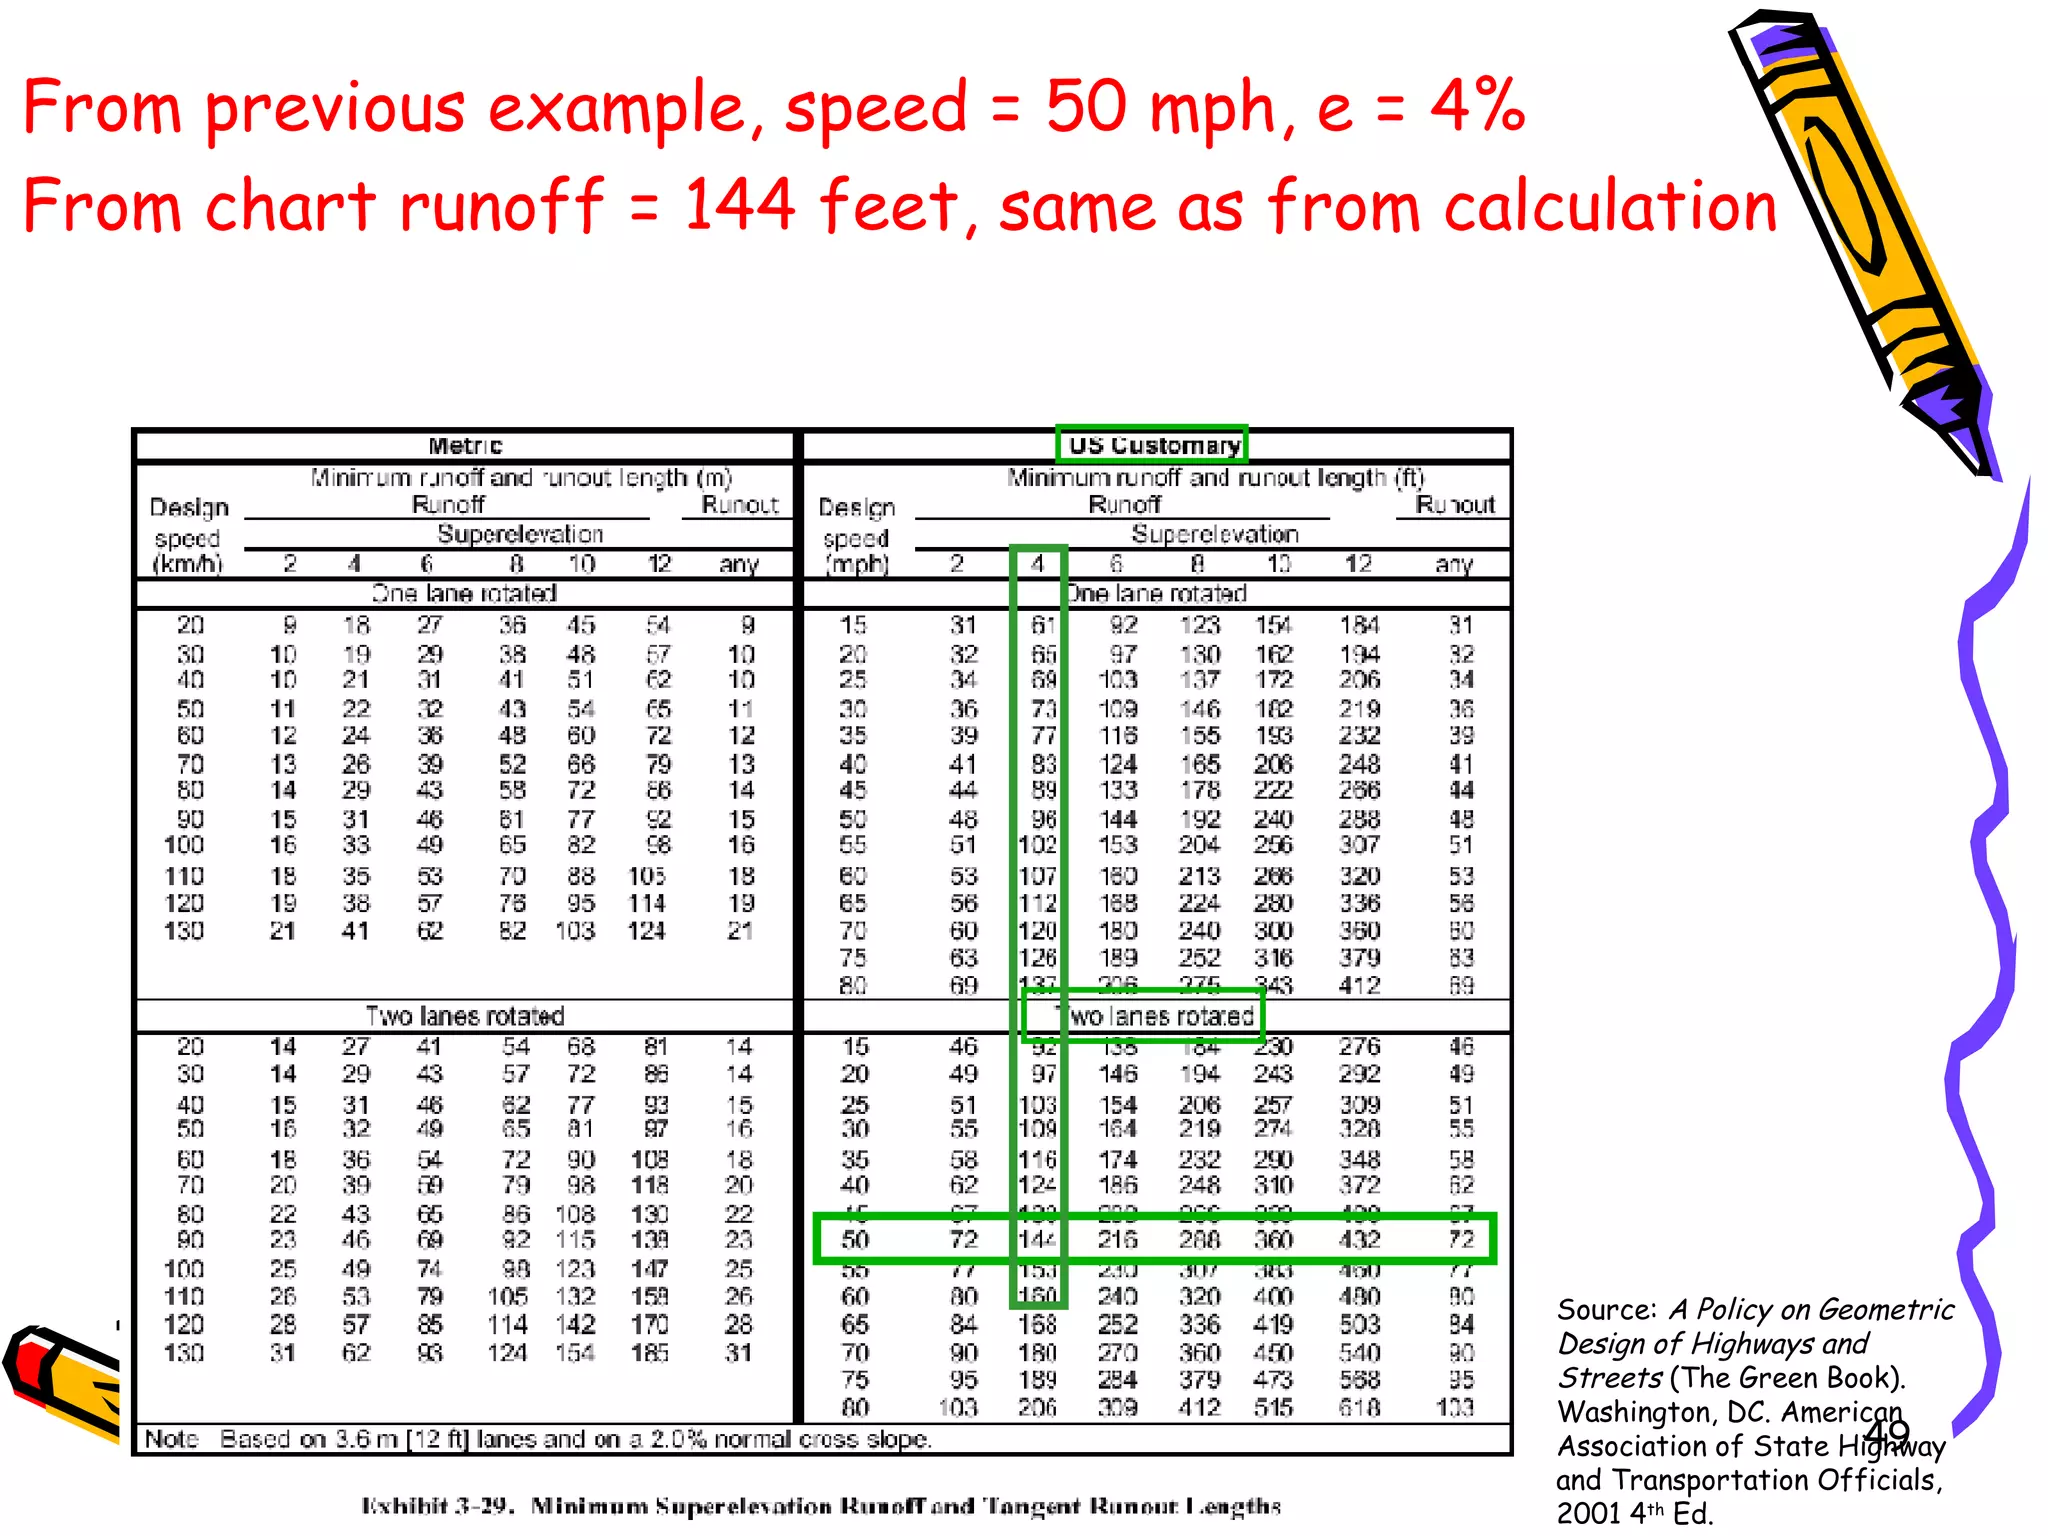

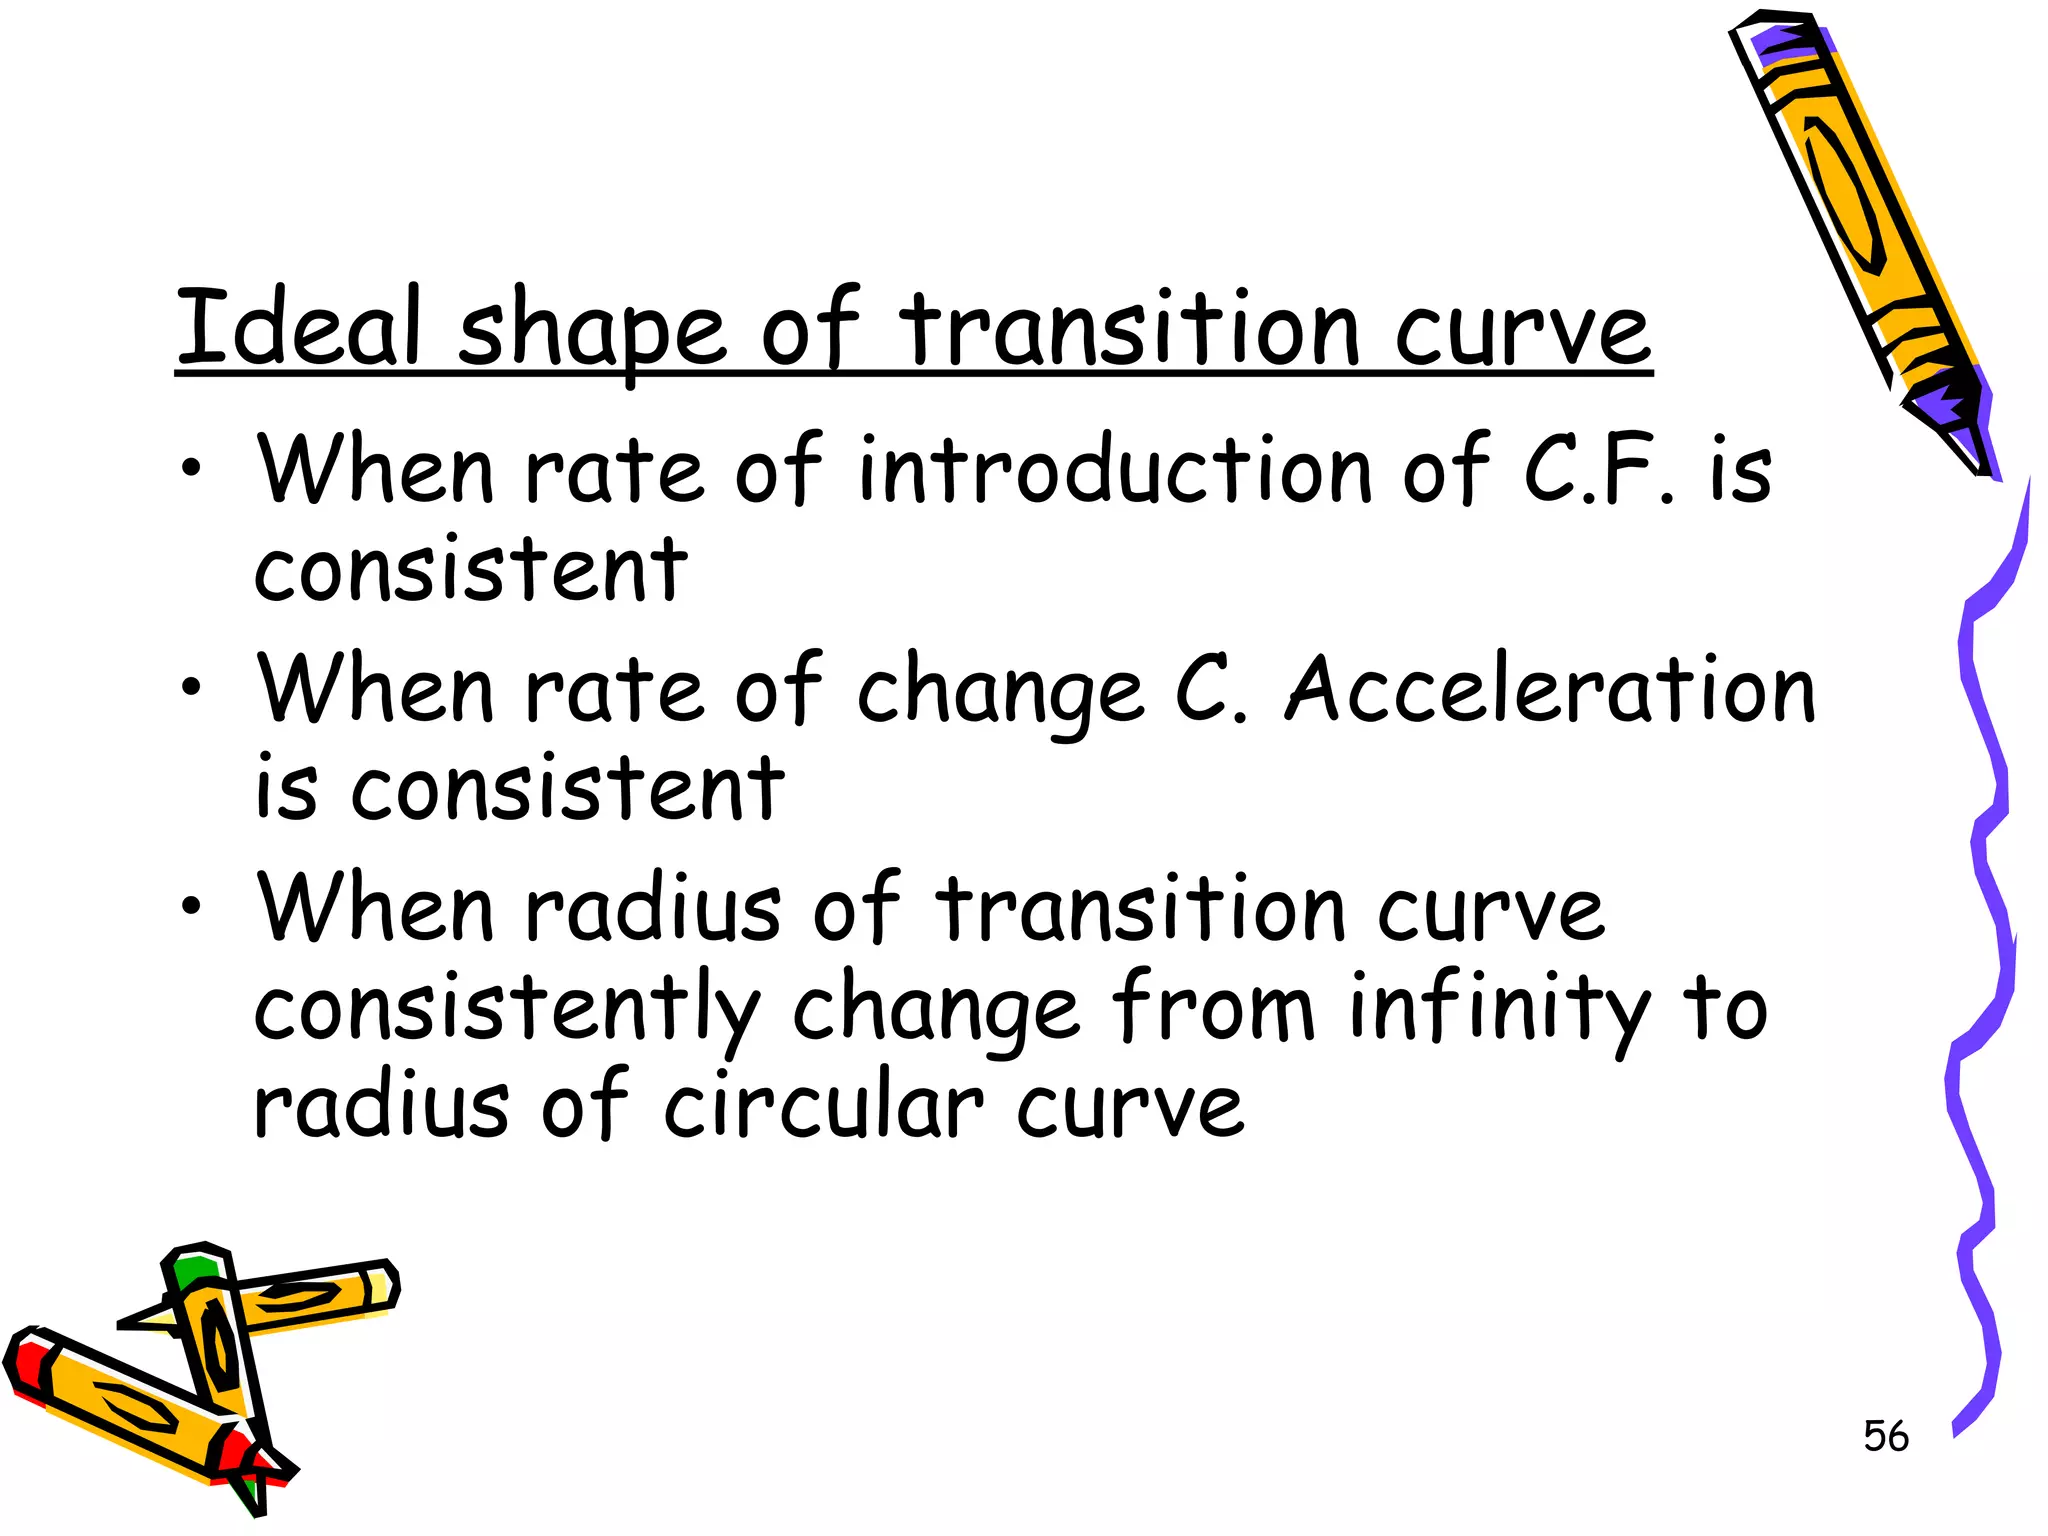
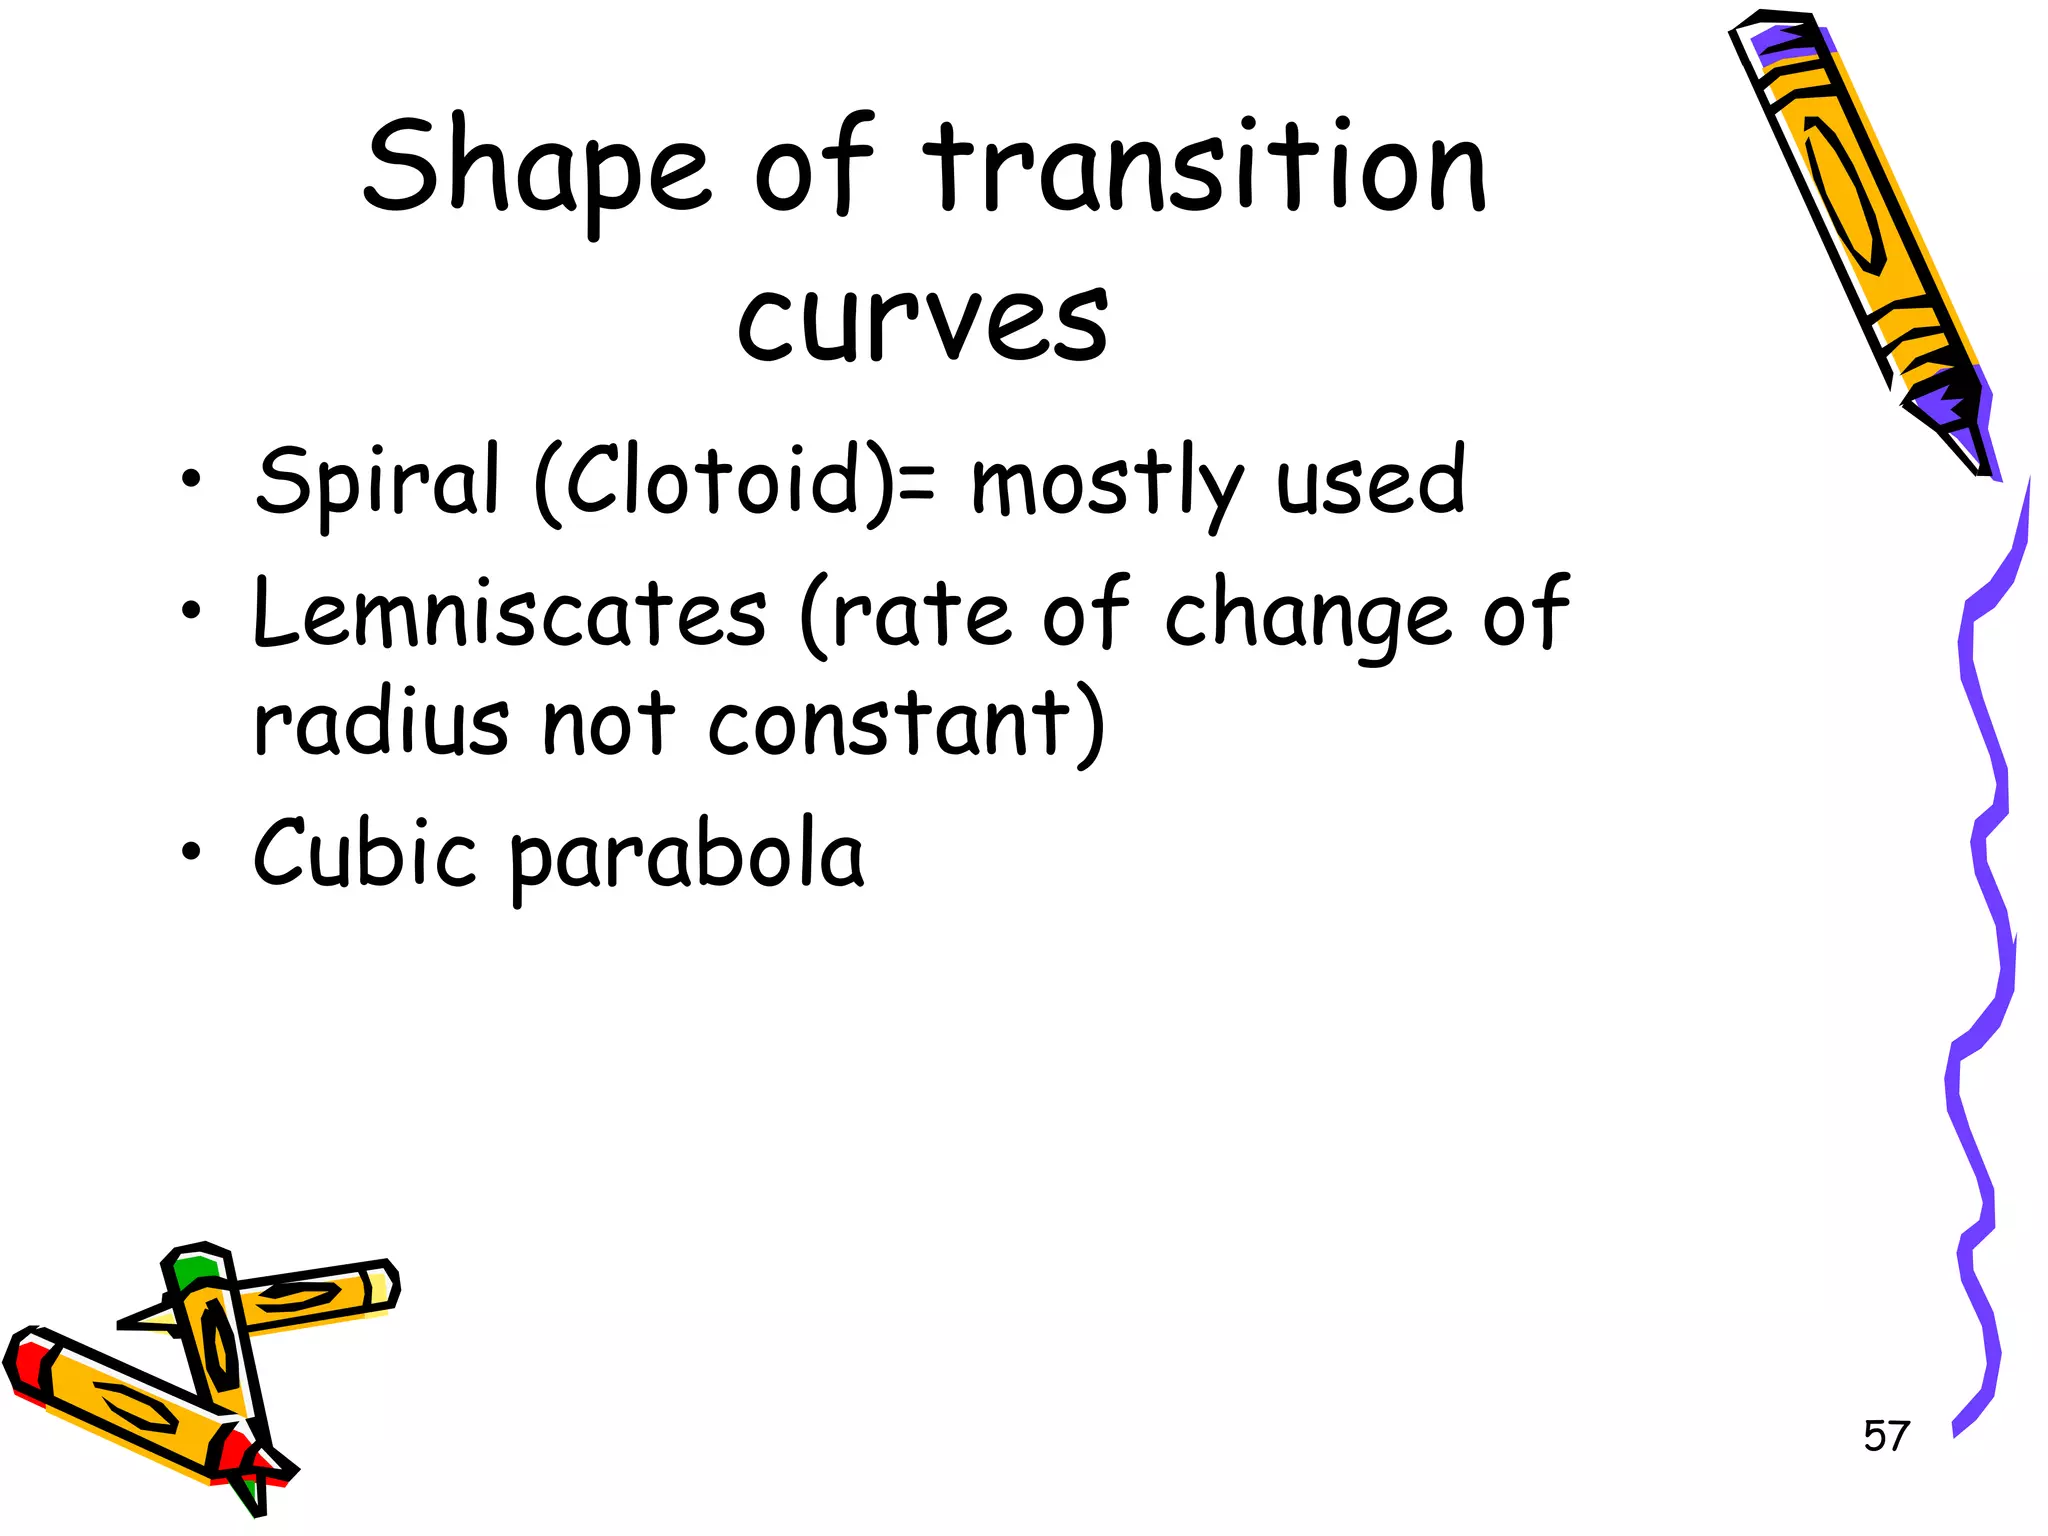
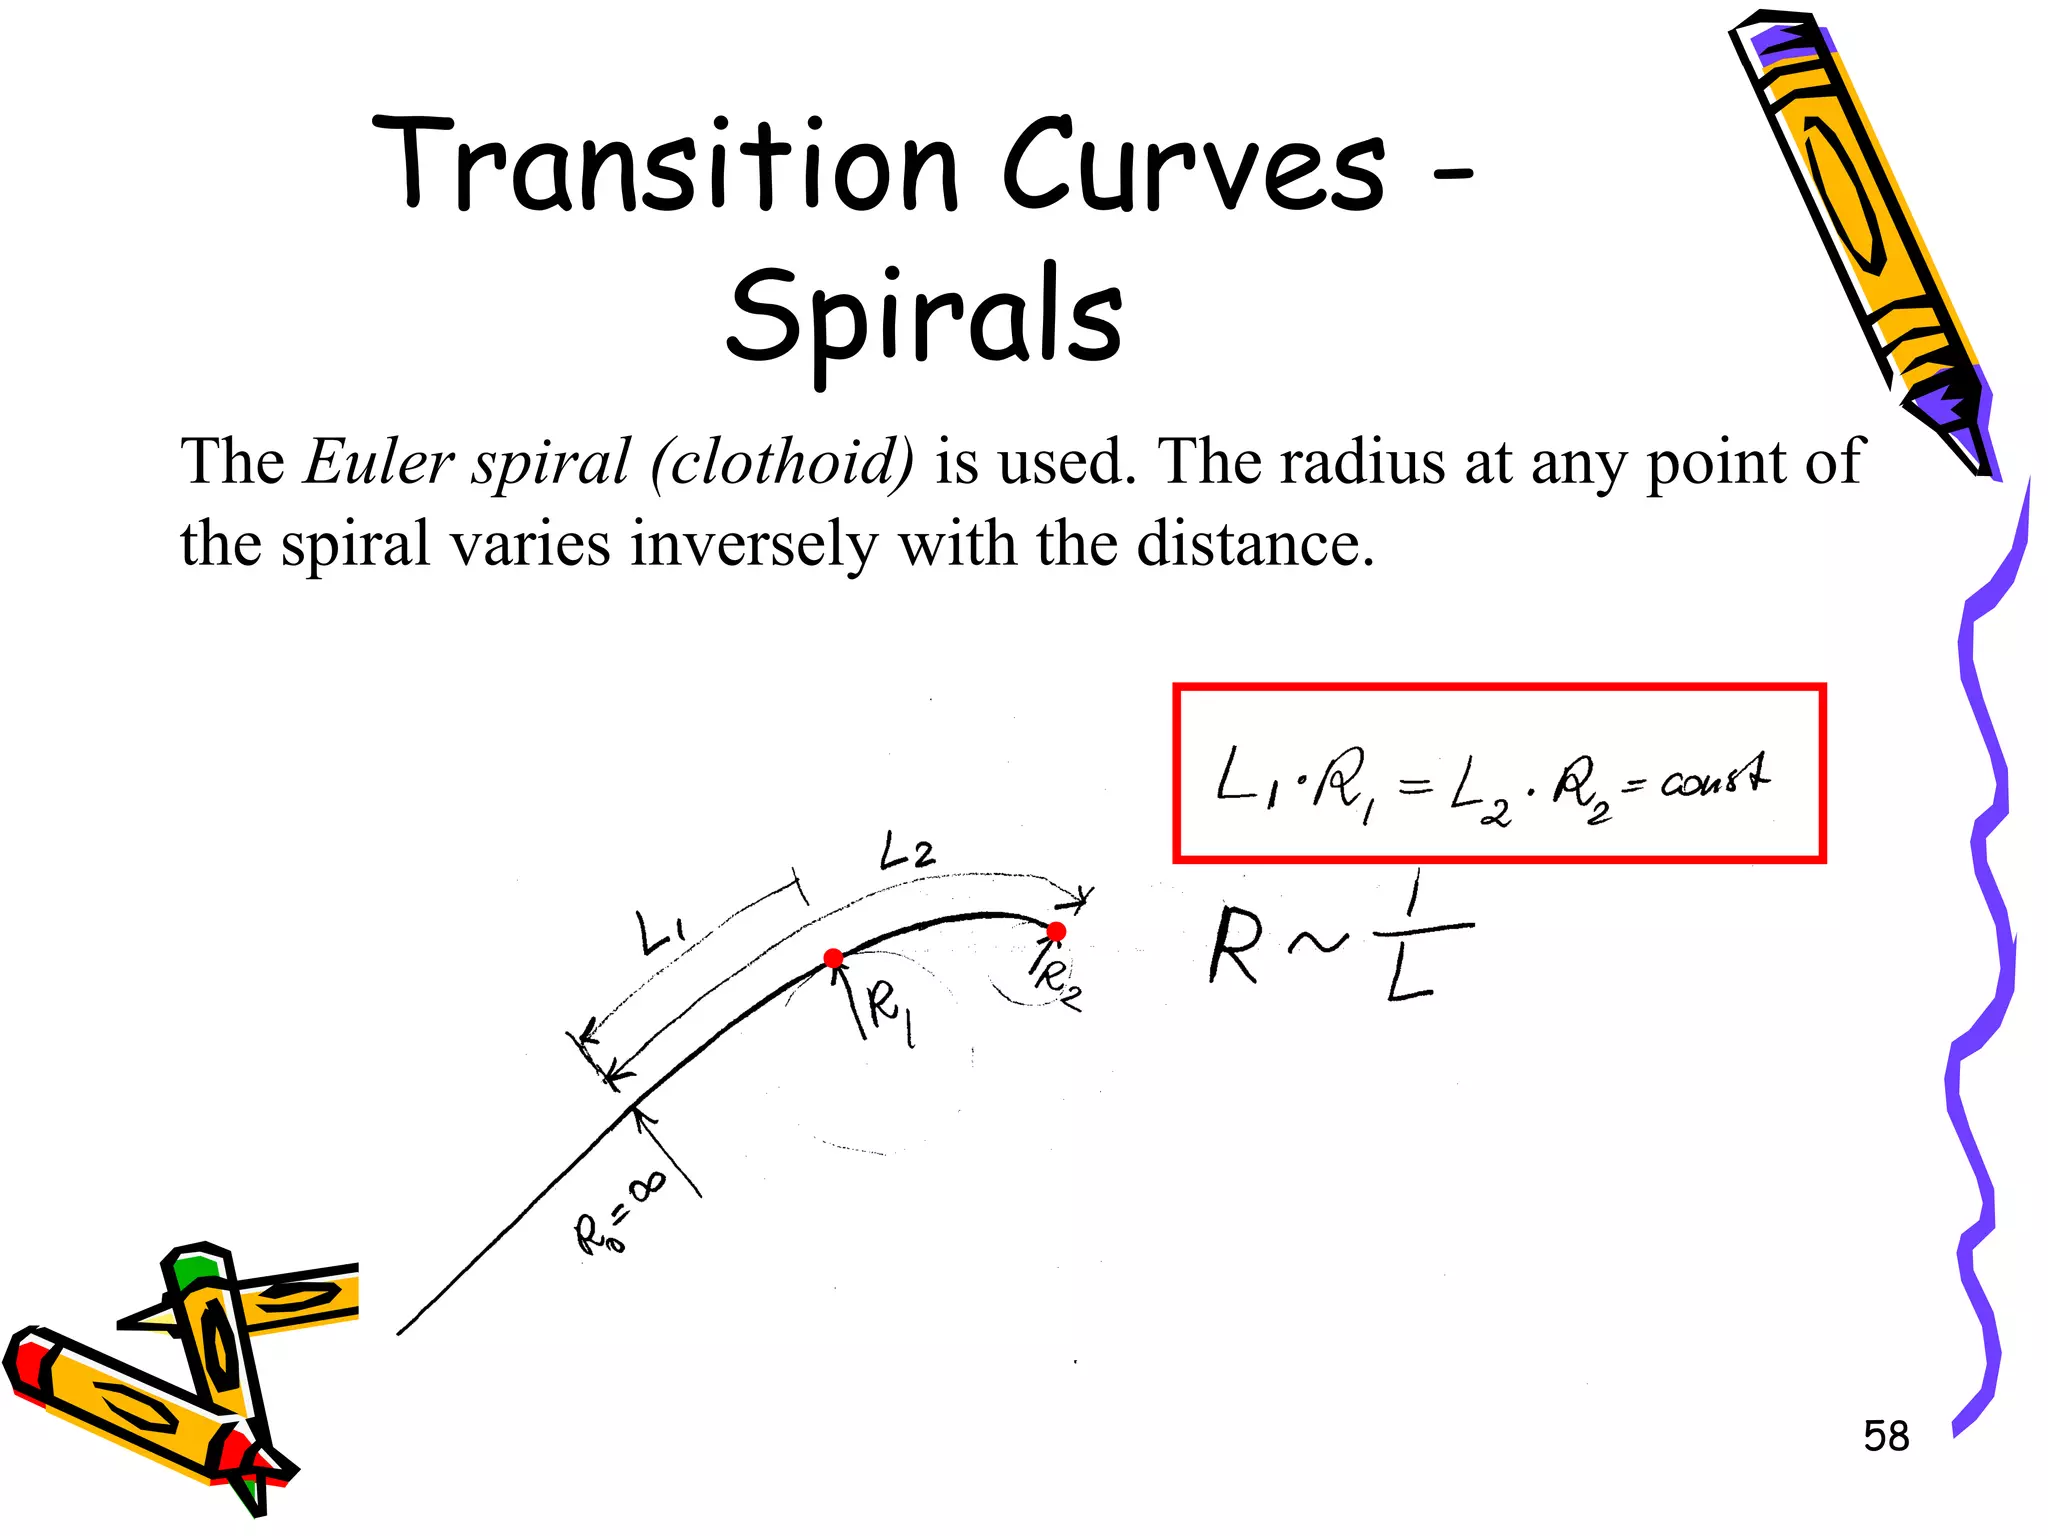
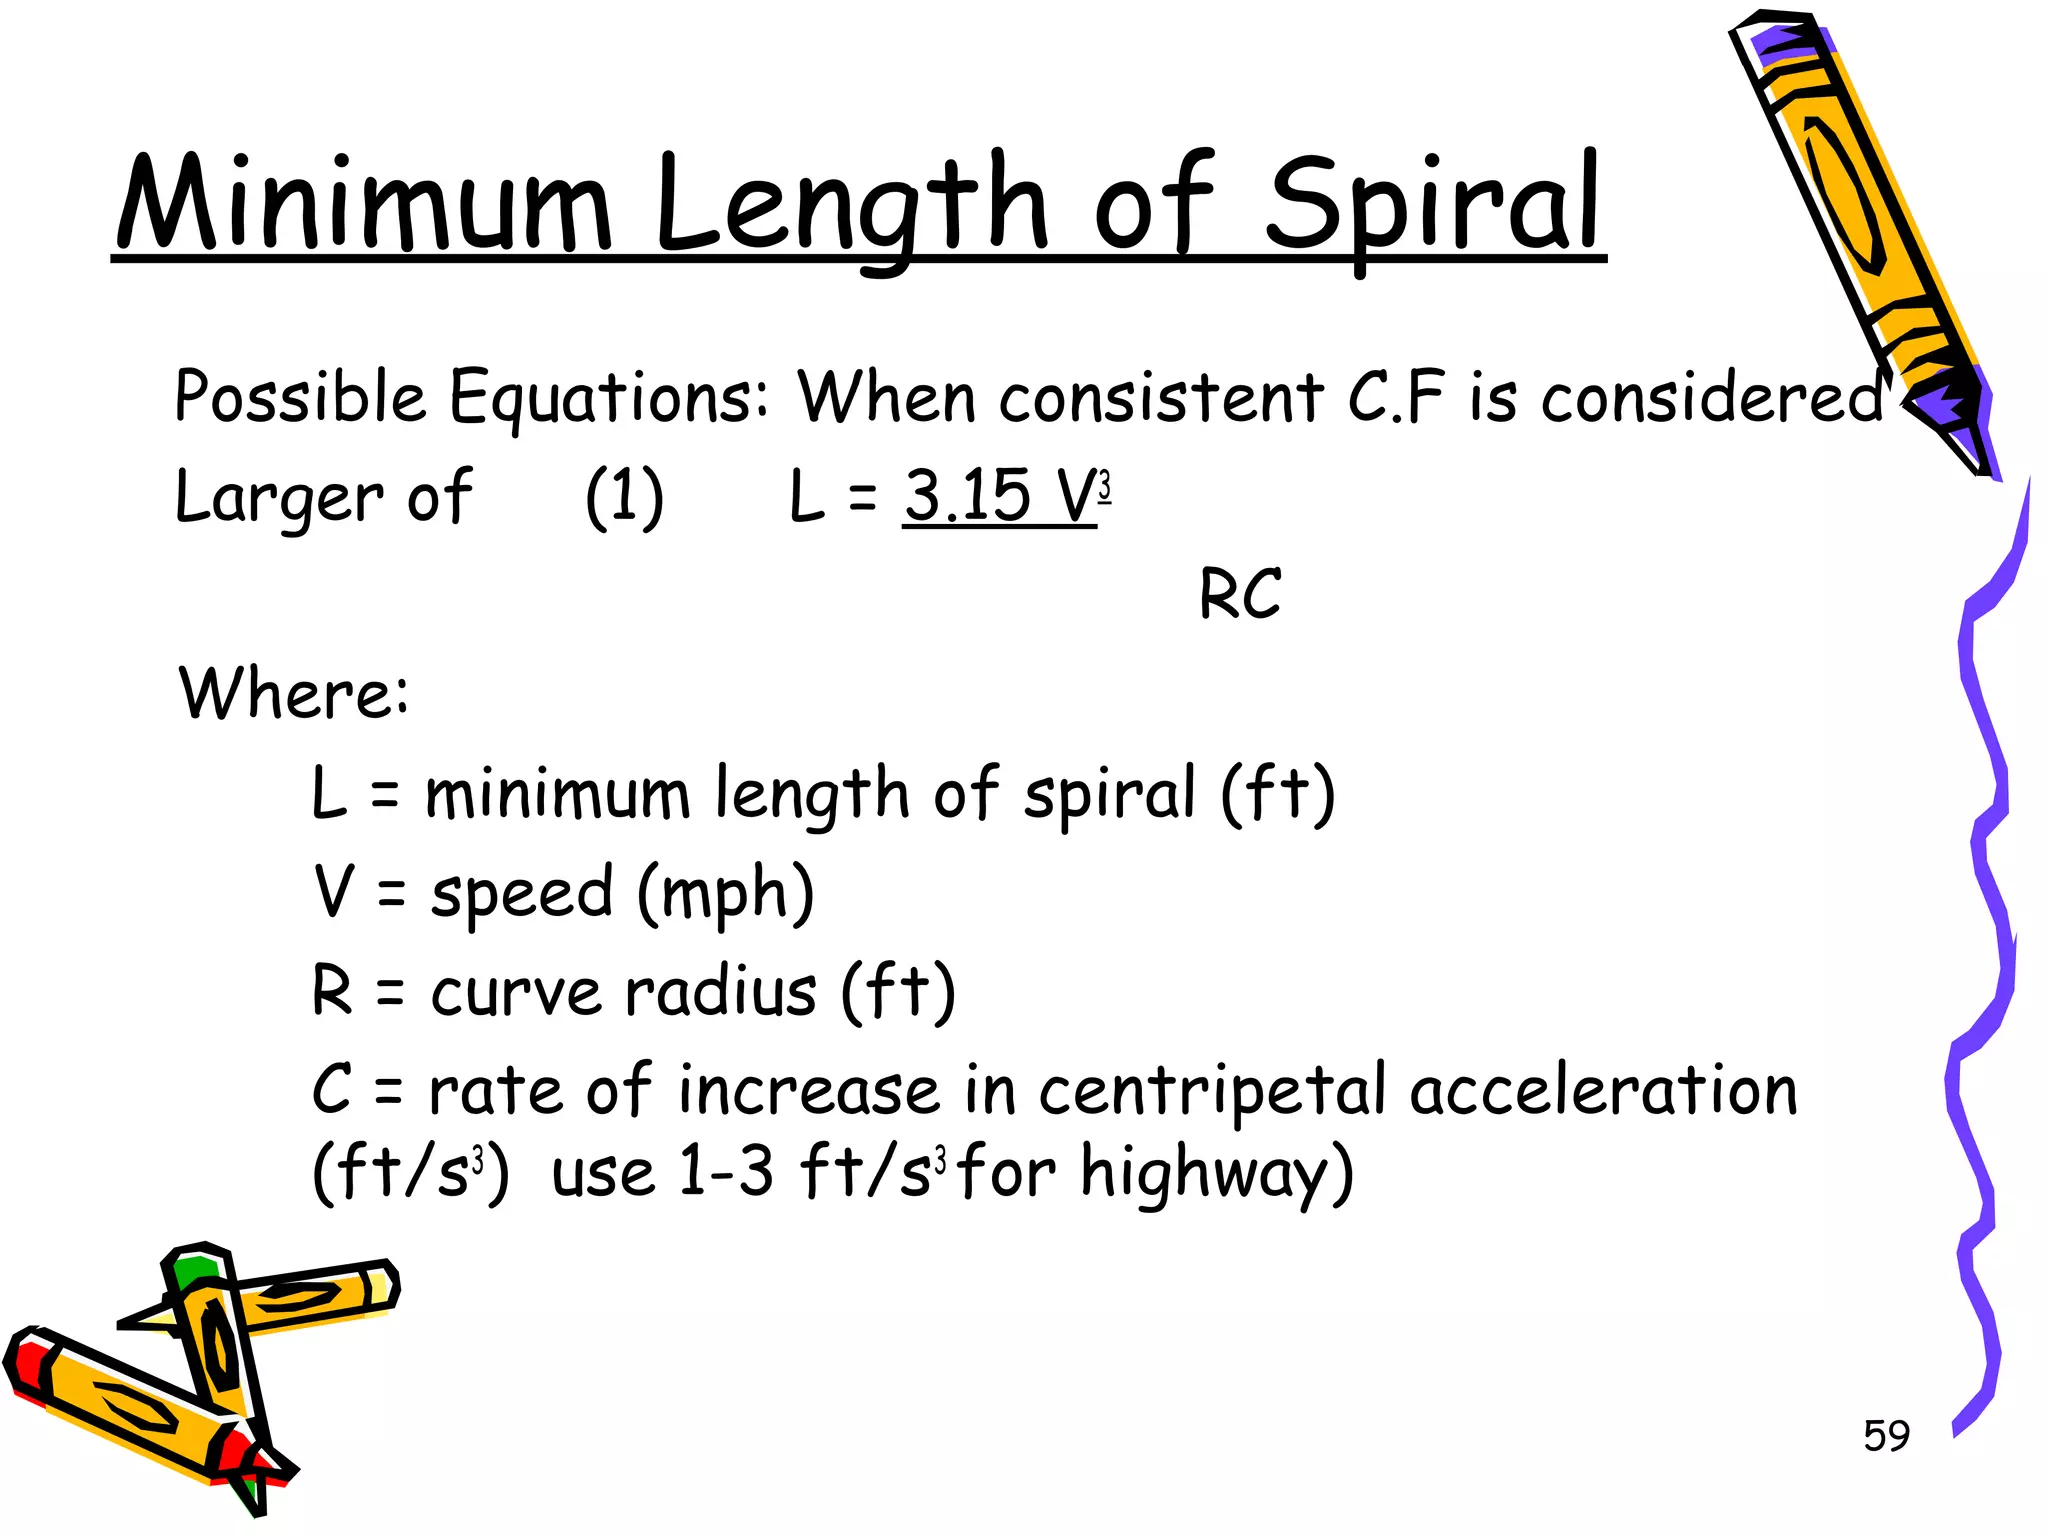
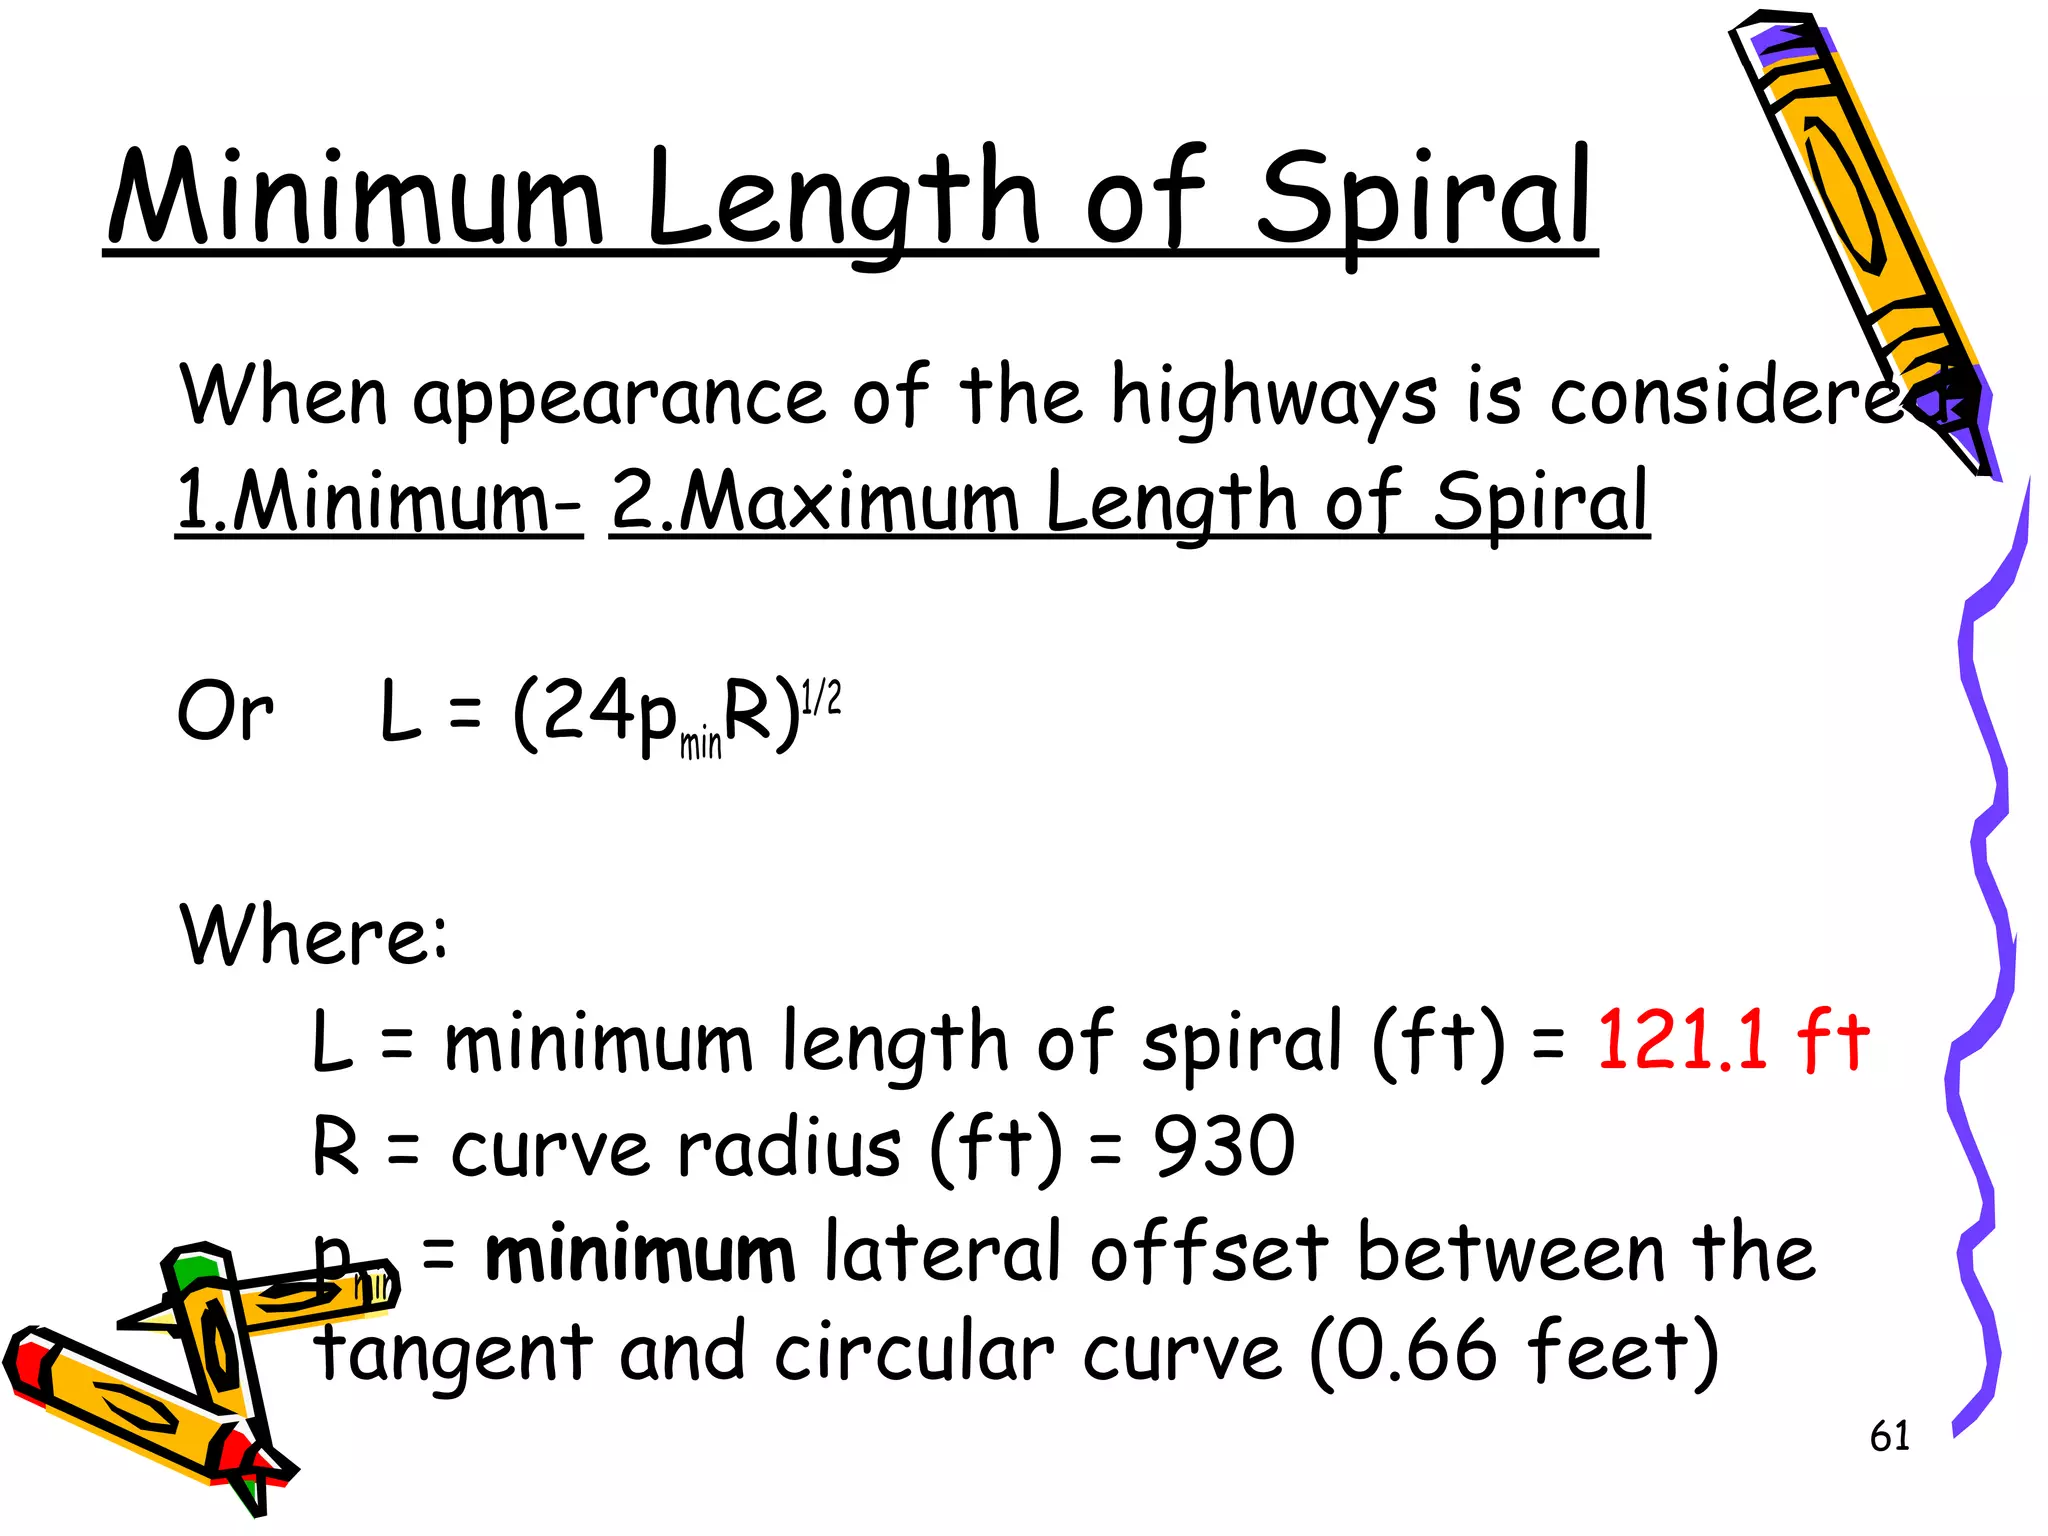


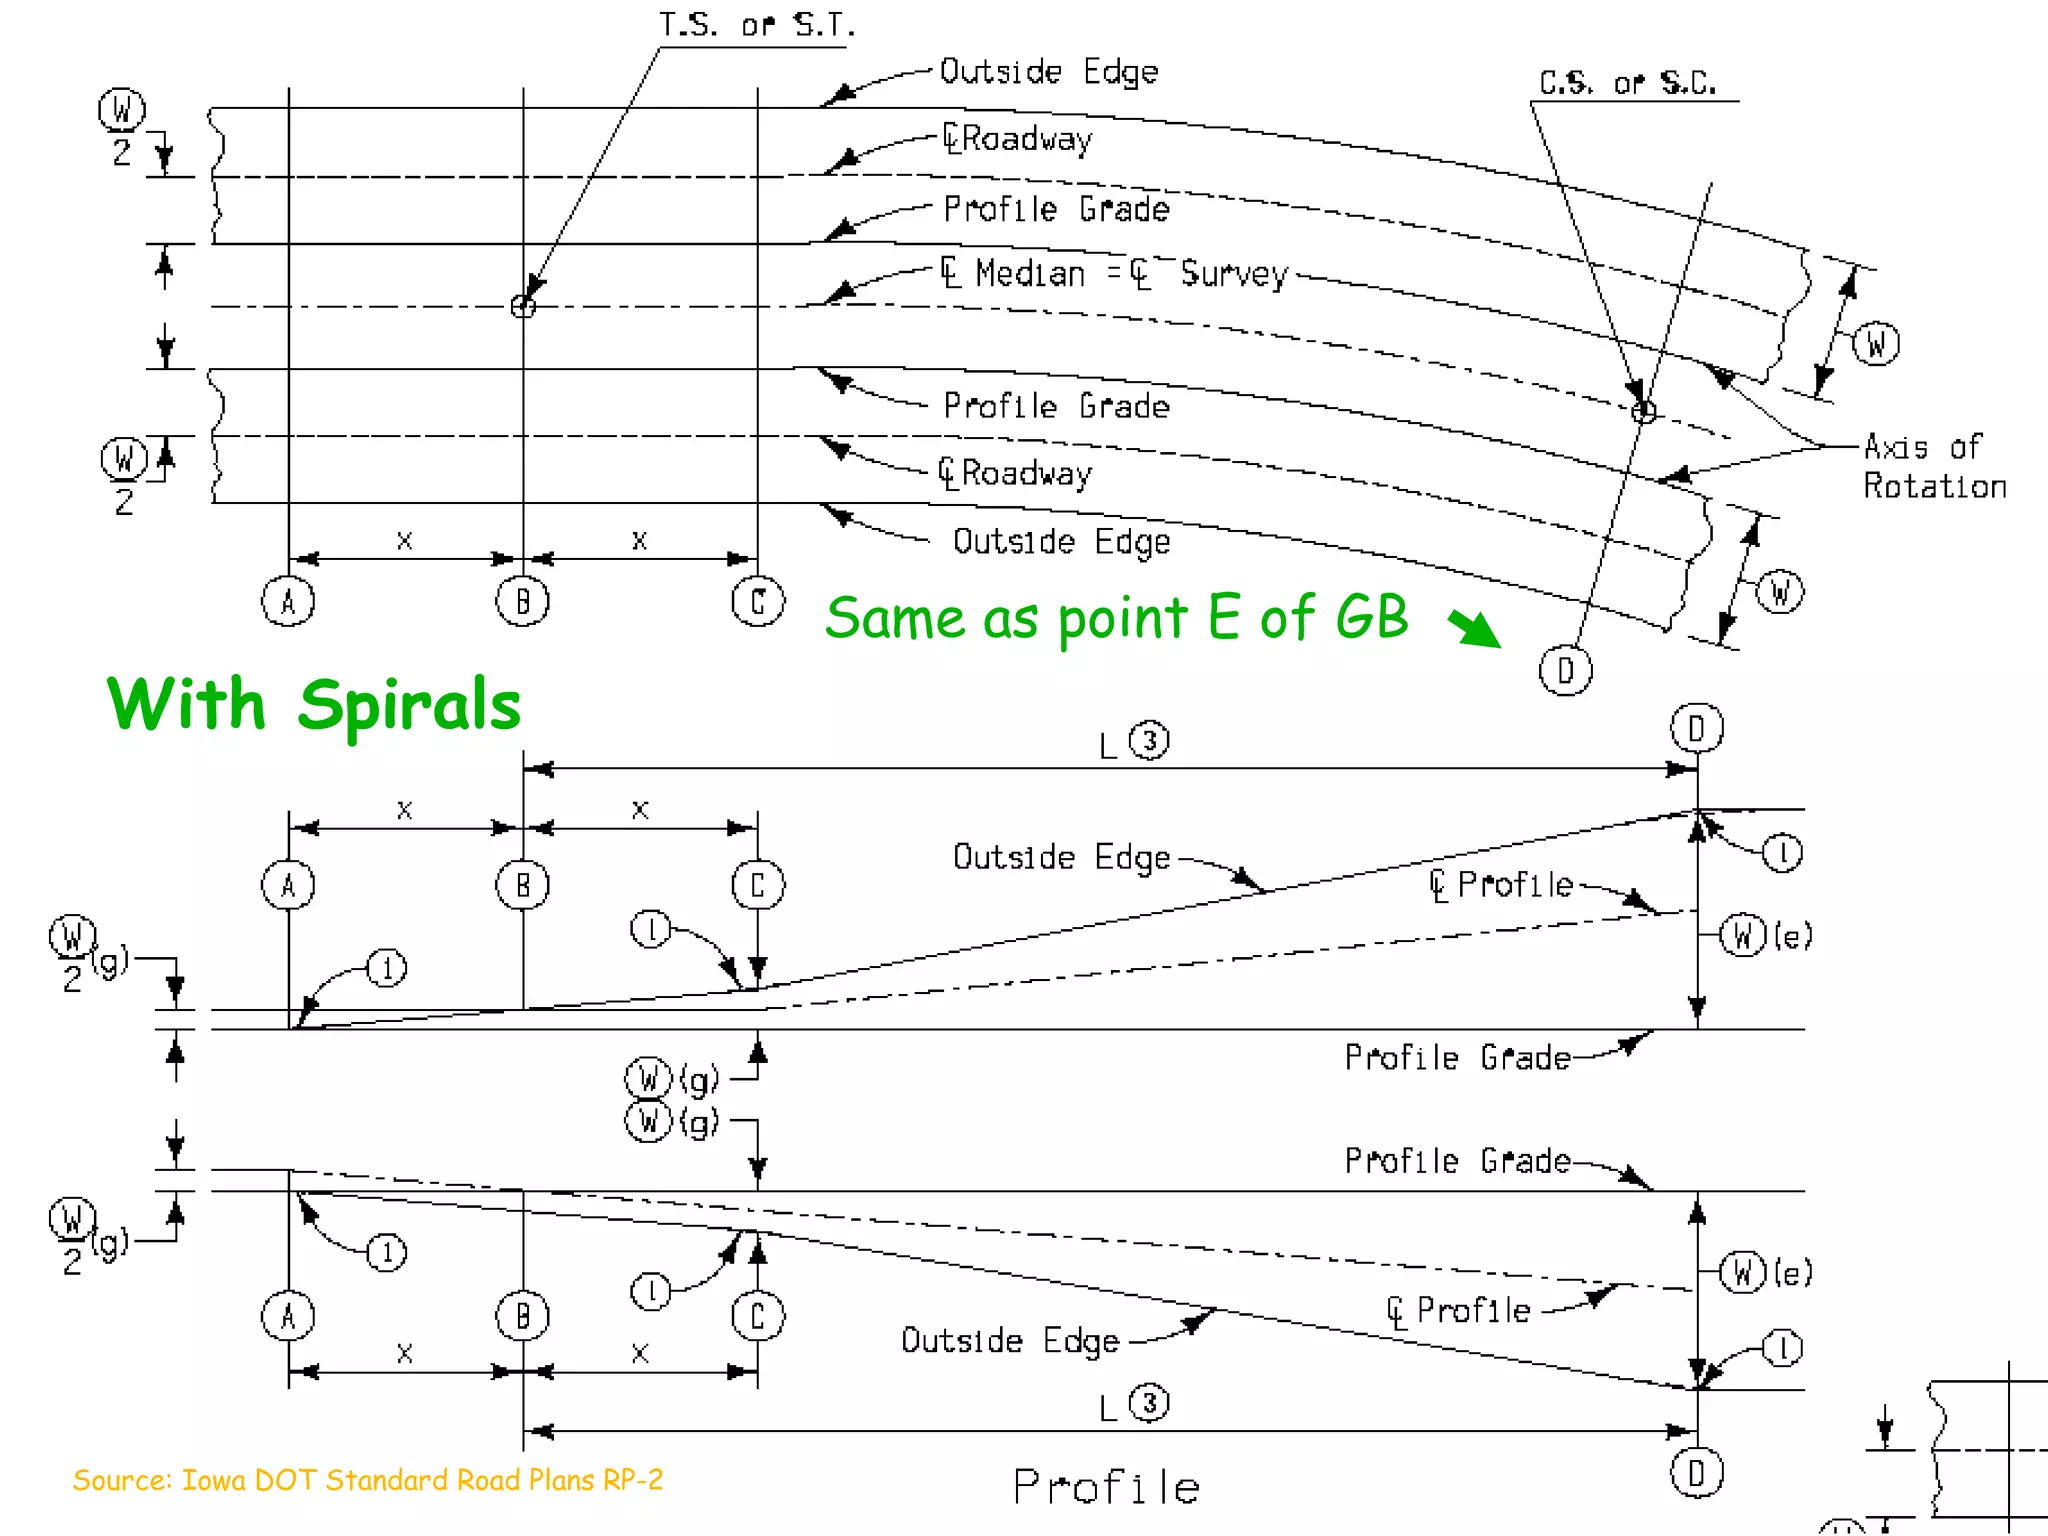
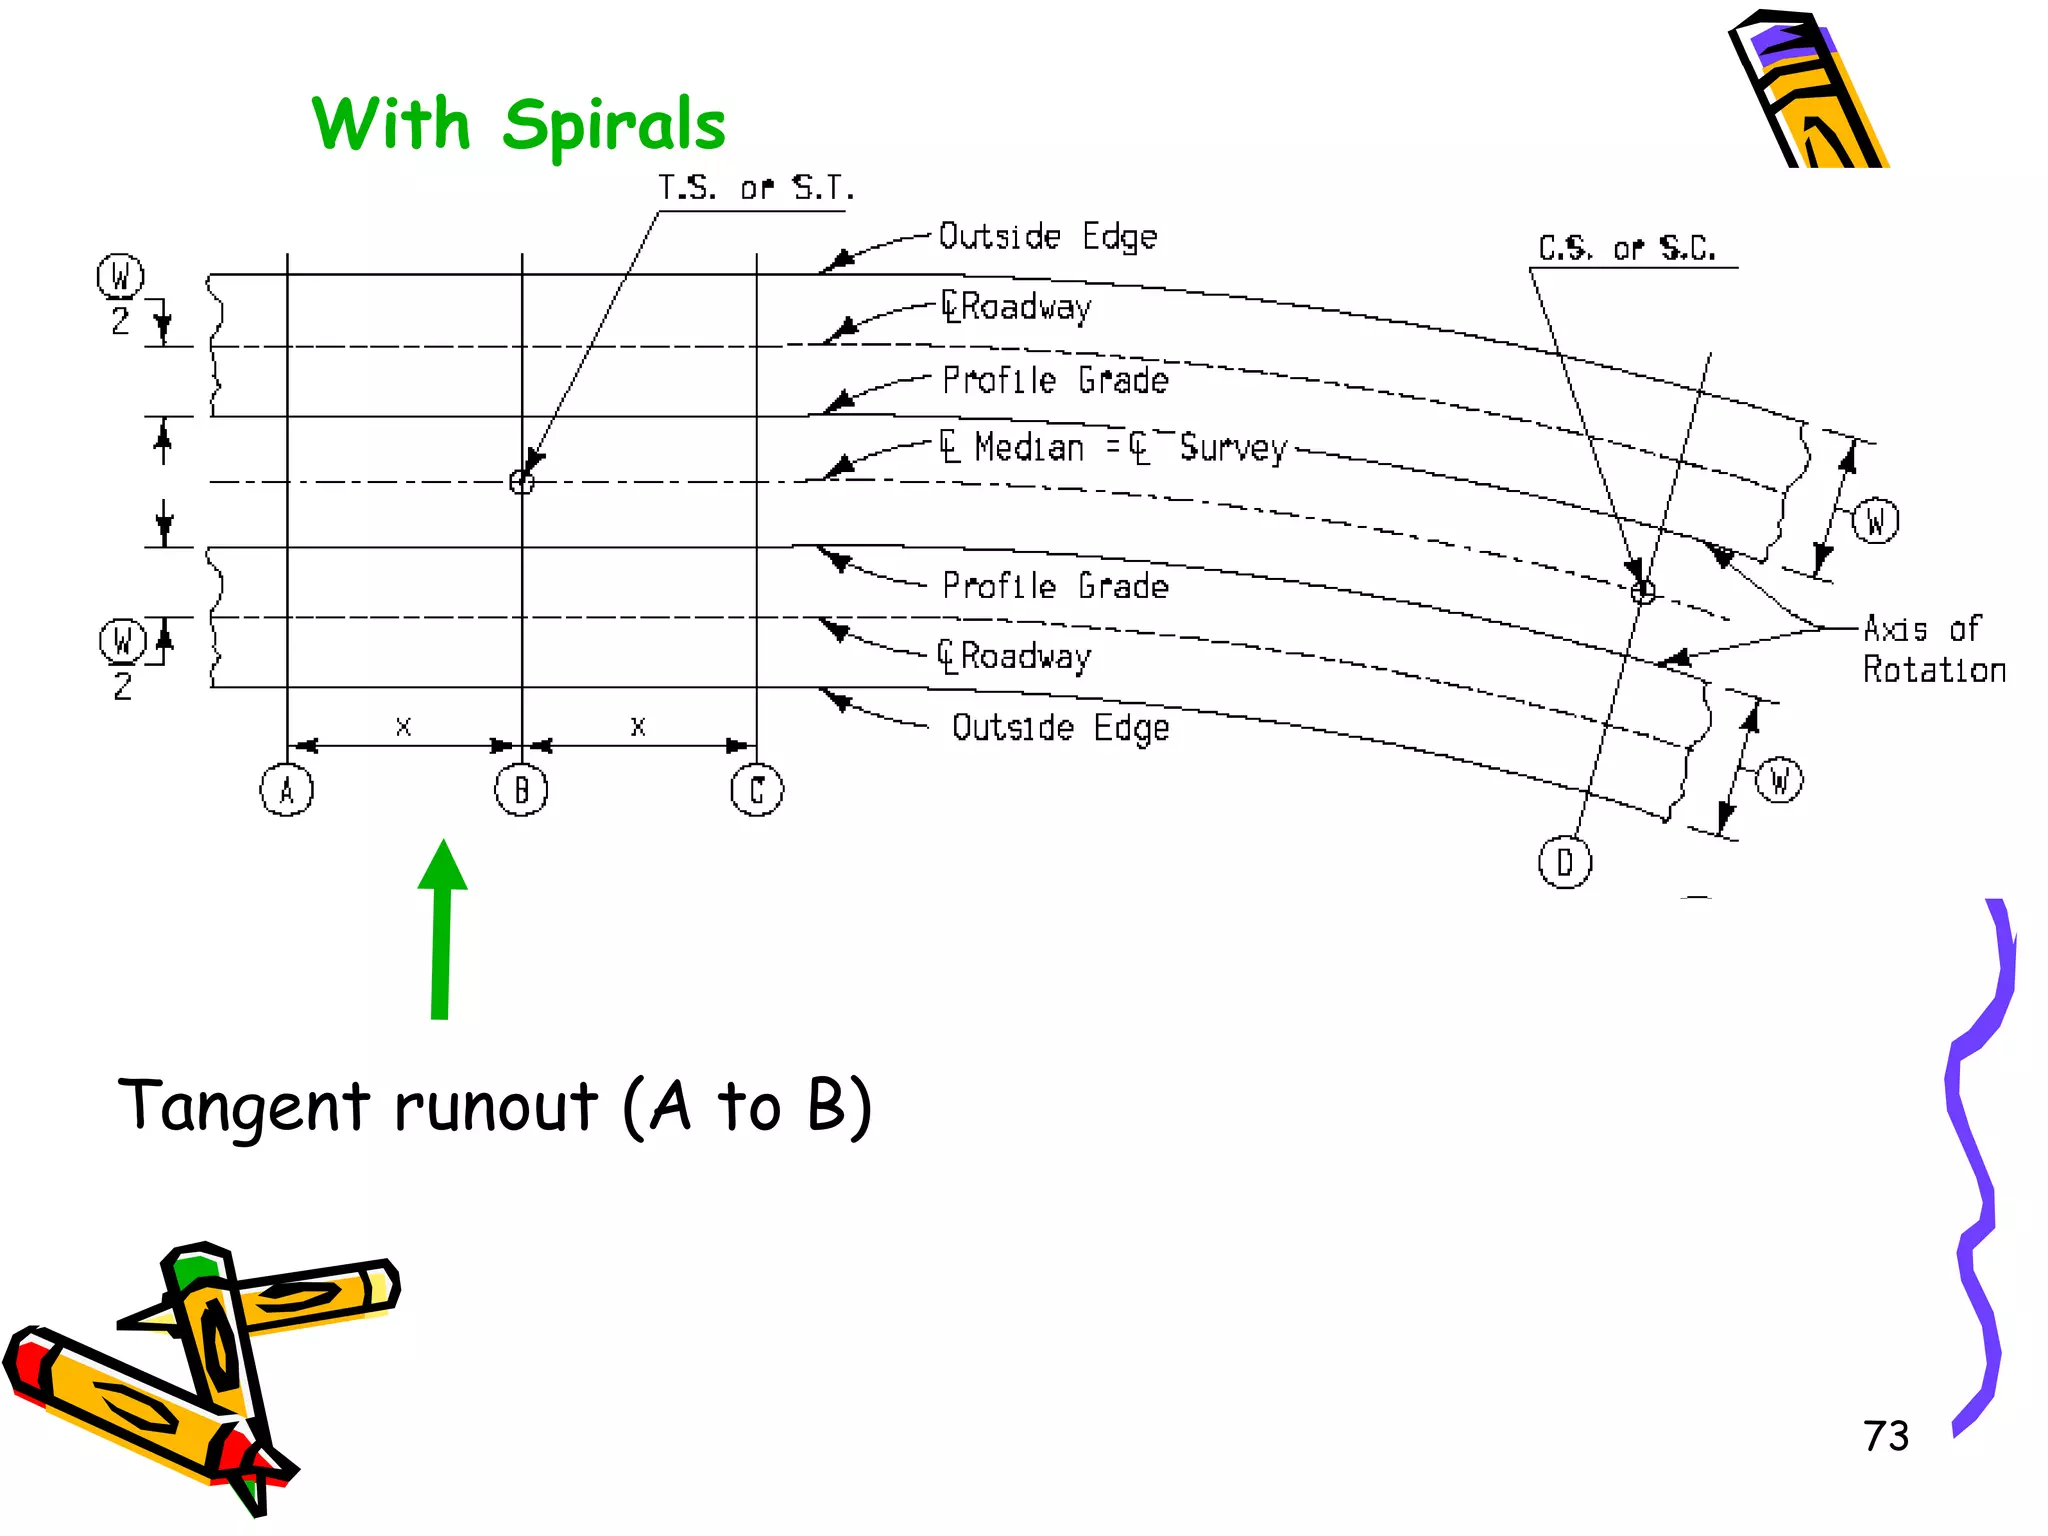
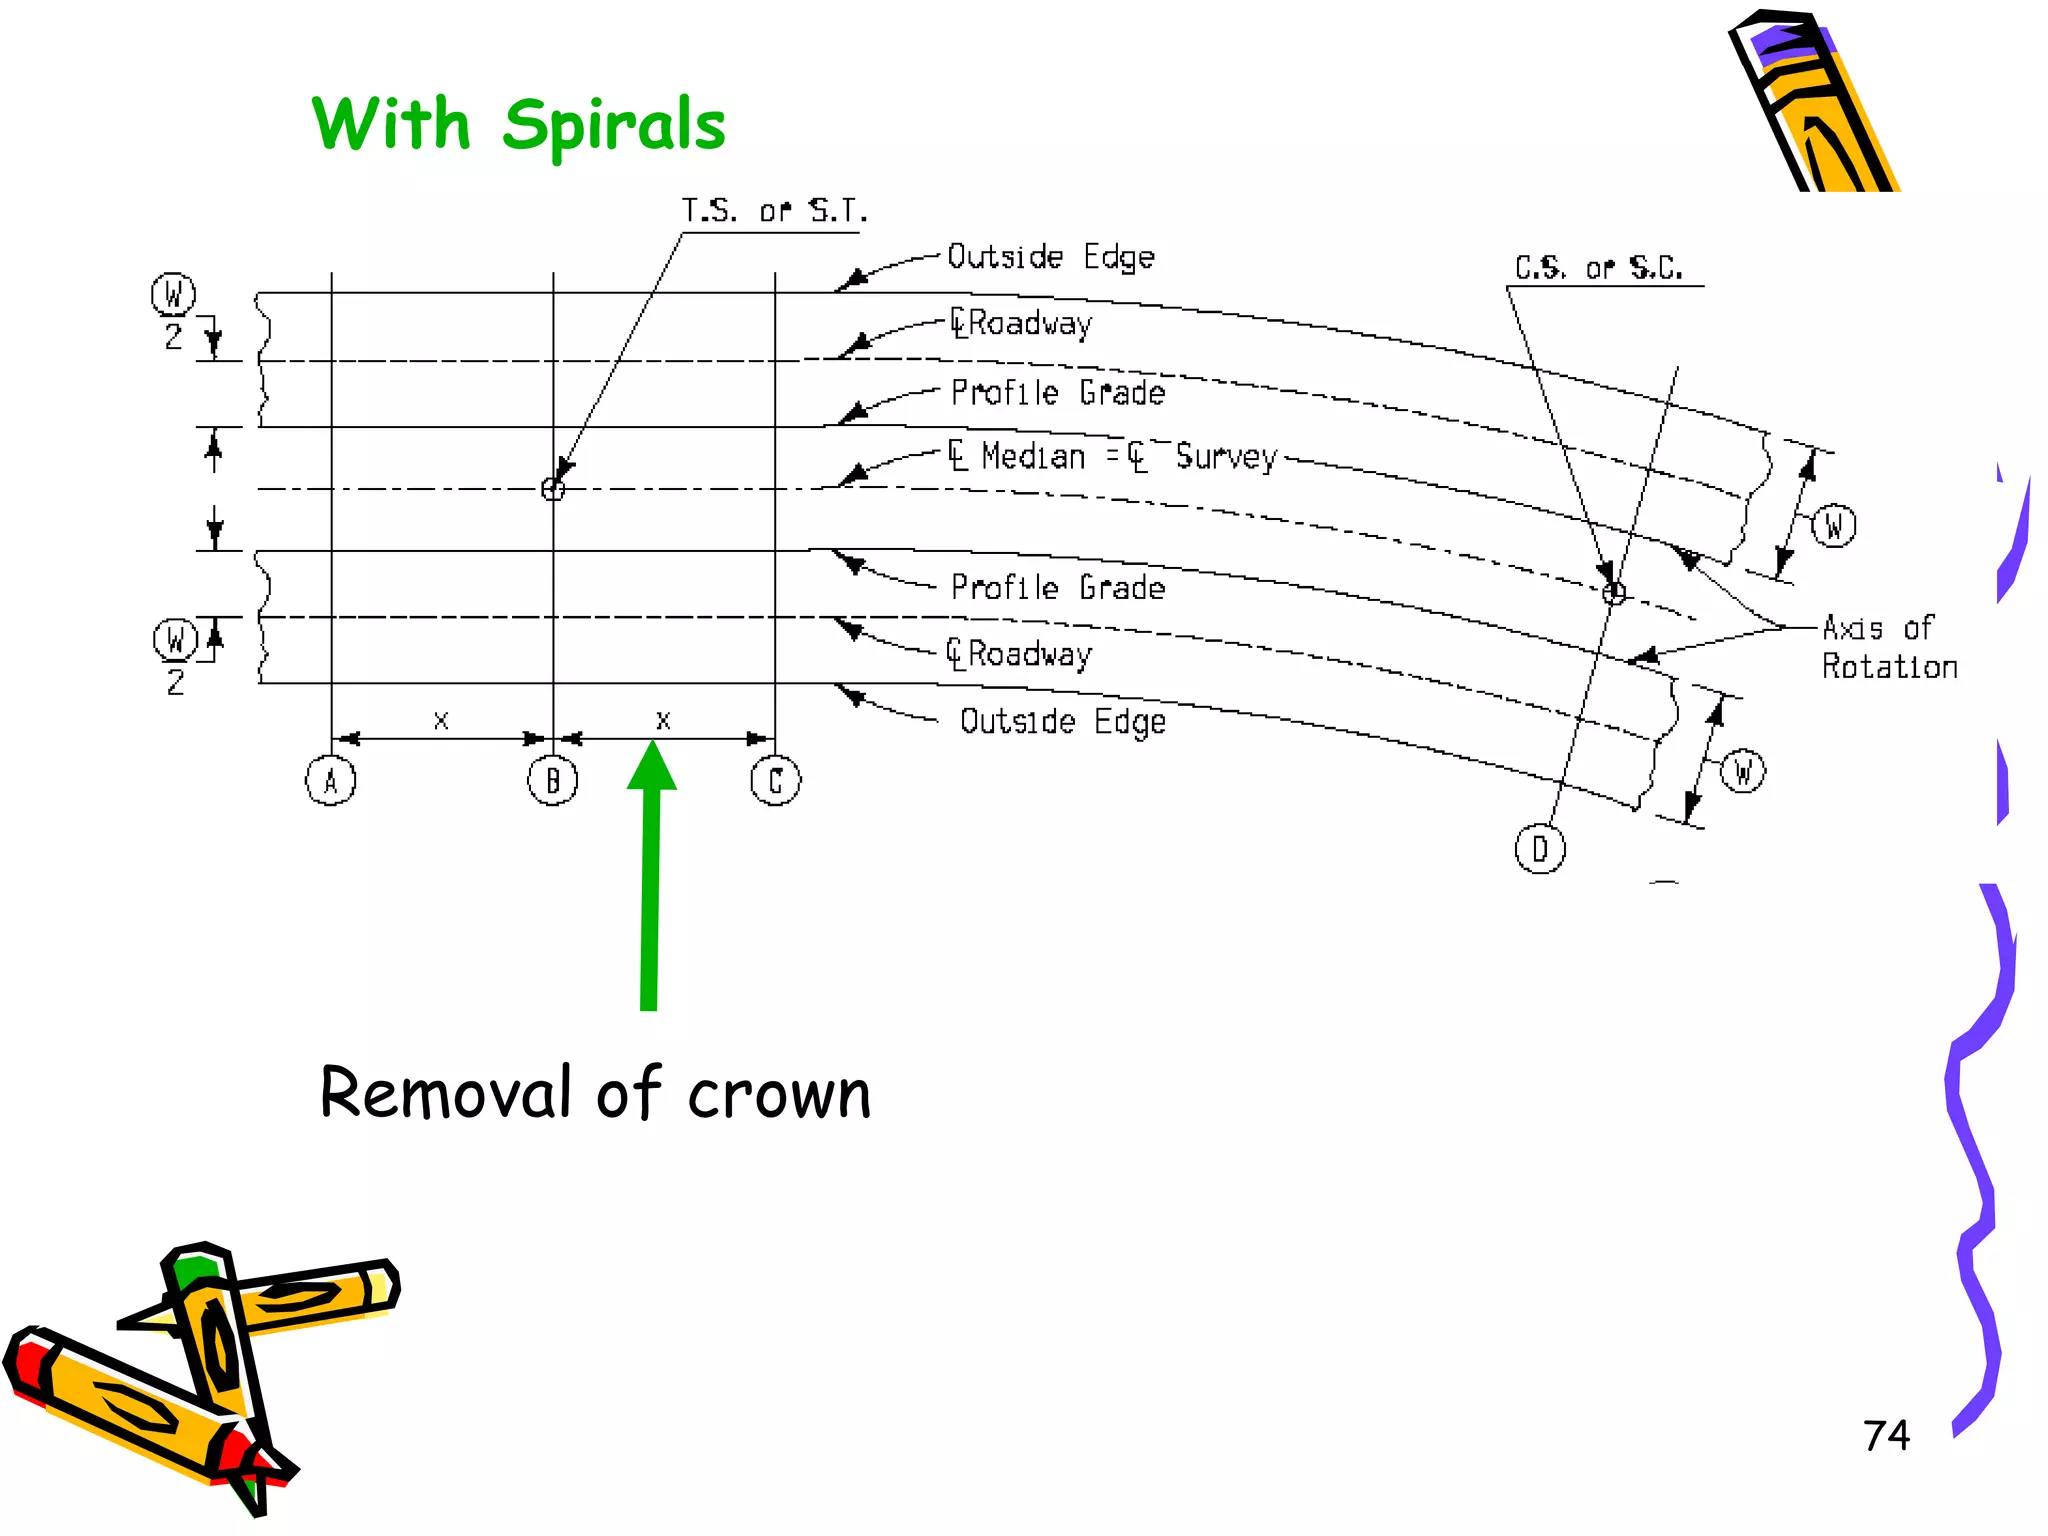

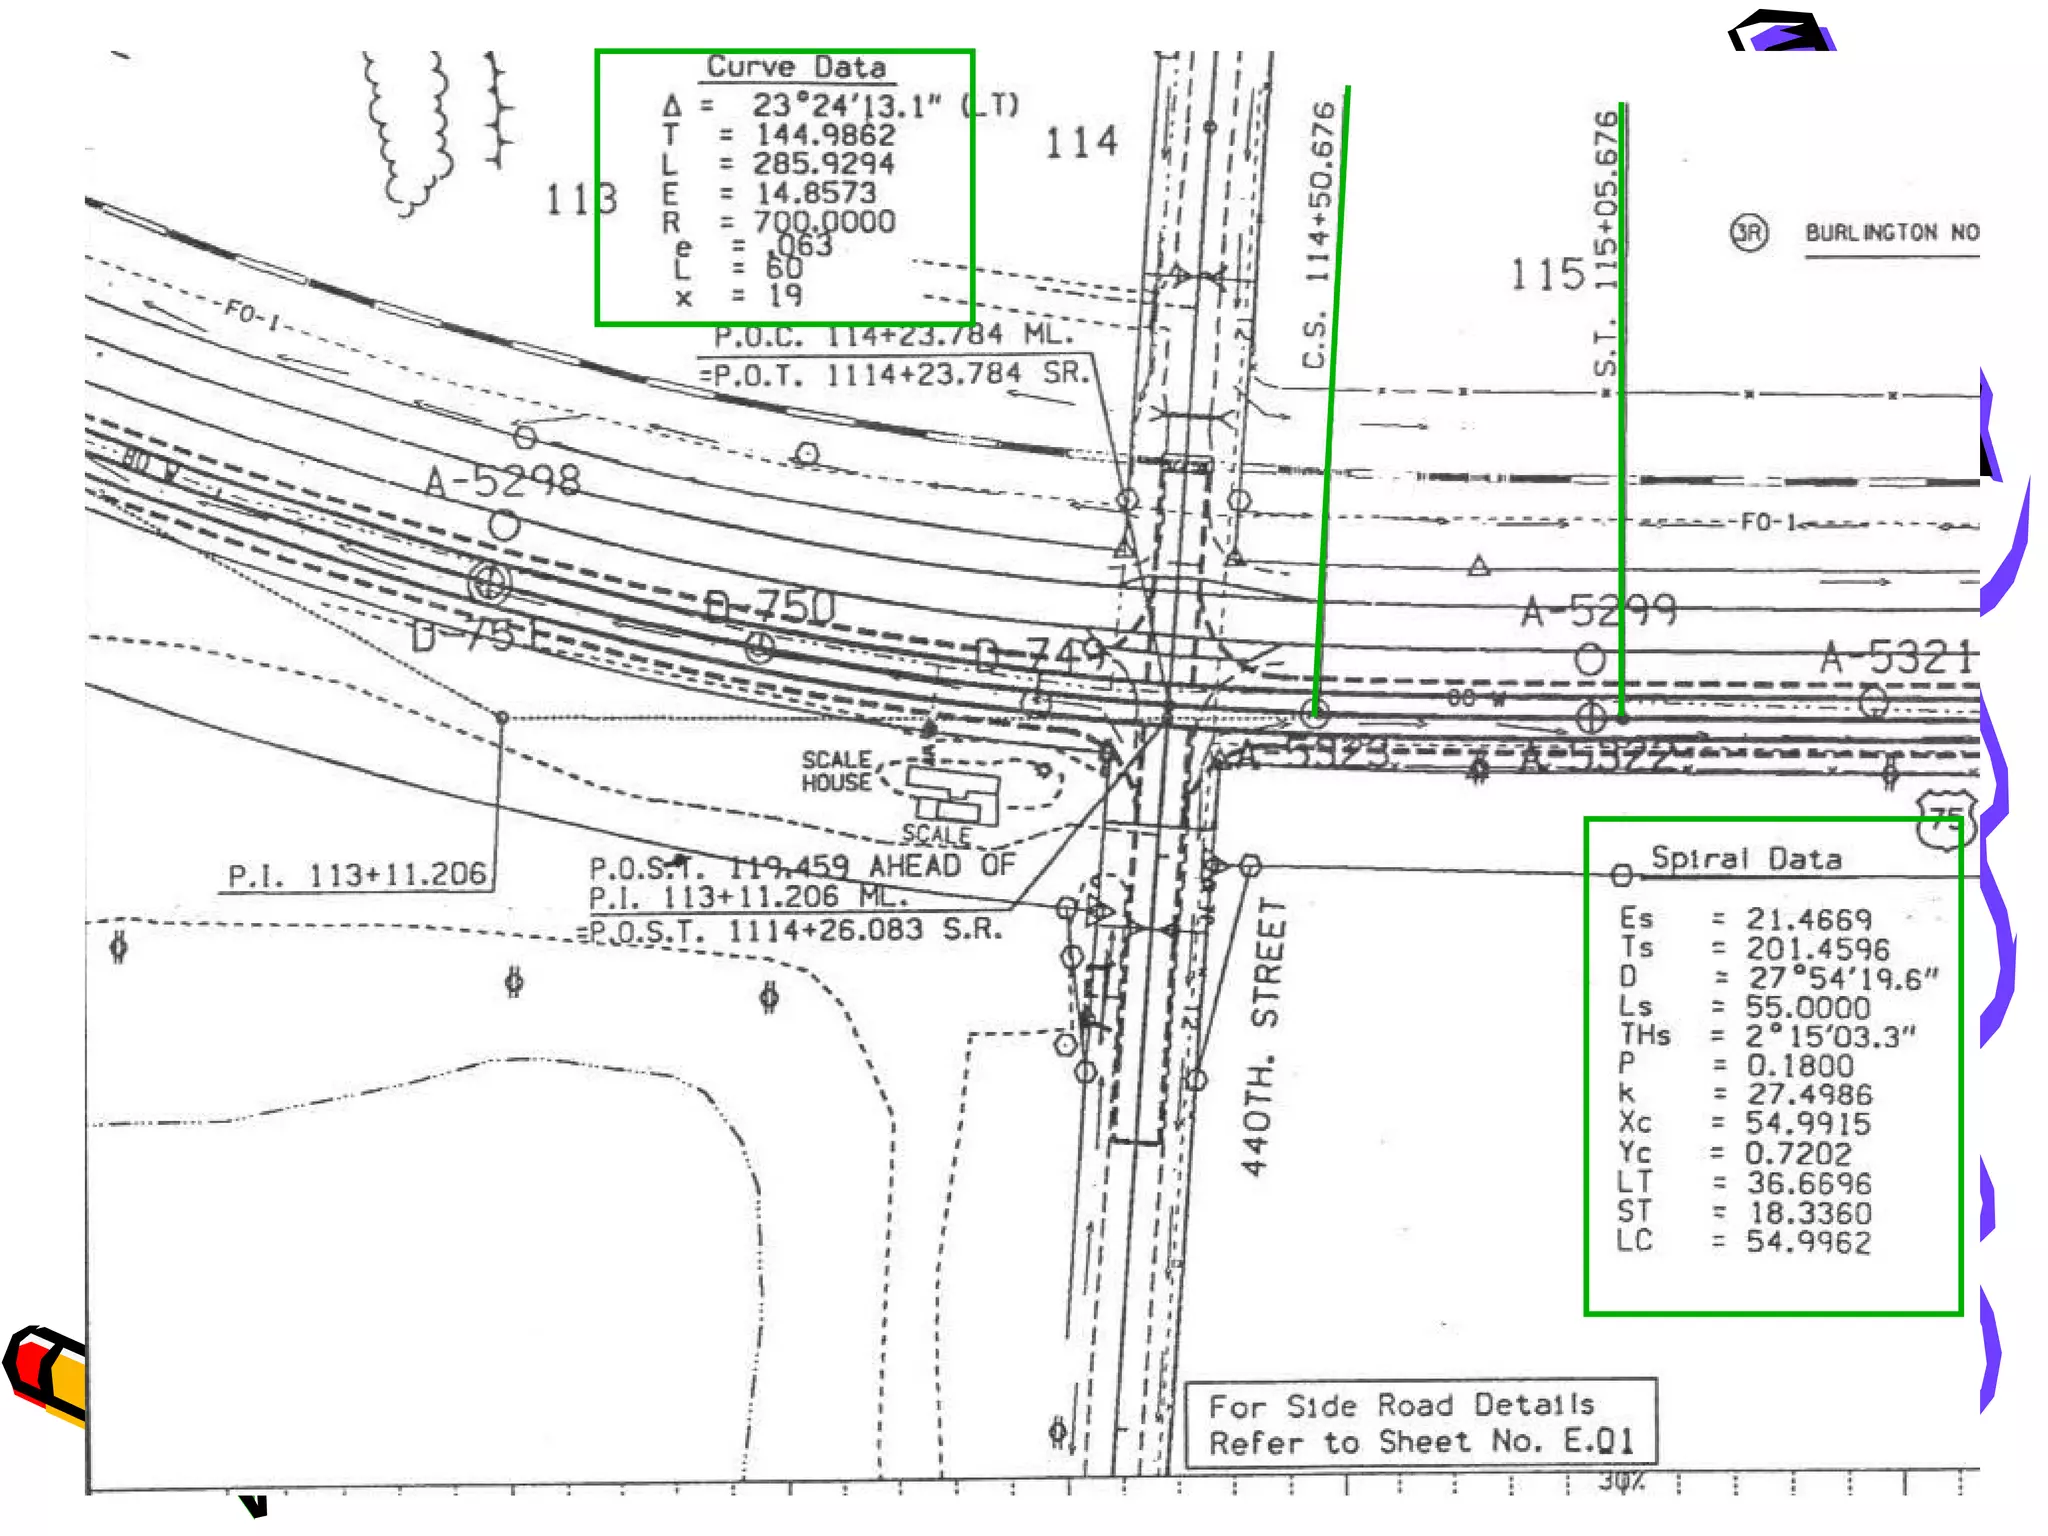


This document discusses sight distance and horizontal curves, superelevation, and transition curves. It provides the following key points: 1. Sight distance must be provided on horizontal curves to avoid obstructions. The middle ordinate equation calculates the maximum distance an obstruction can be from the centerline while maintaining sight distance. 2. Superelevation is used on curves to counteract centrifugal force. It is expressed as a ratio of outer edge height to width. Maximum rates vary from 4-12% depending on conditions. 3. Transition curves like spirals are used between tangents and curves to gradually change the radius. Their minimum length is calculated using equations involving design speed, radius, and rate


