Sight Distance
And
Road Alignment
Piter Biswas
piterbiswas11@gmail.com
Vickyson Naorem
SIGHT DISTANCE
Stopping Sight Distance:
The sight line is a chord of the curve,
and the stopping sight distance is measured along the
centerline of the inside lane around the curve.
Equation 3-40 applies only to circular curves longer than
the sight distance for the pertinent design speed.
Where sufficient stopping sight distance is not available
.the alternatives are:
 Increase the offset to the obstruction.
 Increase the radius.
 Reduce the design speed.
 A study reported by TRB, went on to develop a
model to assist in determining the cost-
effectiveness of lengthening a vertical curve to
increase sight distance over a crest.
 It is cost-effective when the design speed is more than
20mph below operating speed in the area.
 Traffic flows exceed 1500 vpd
 High volume intersection
 Sharp curve
 Steep downgrade
 Lane drop
SIGHT DISTANCE (Contd.)
Exhibit 3-57 is a design chart showing the middle ordinates needed for clear sight
areas that satisfy stopping sight distance criteria presented in Exhibit 3-1
SIGHT DISTANCE ON HORIZONTAL CURVES
Passing sight distance:
The minimum passing sight distance for a
two-lane roads or street is about four times as
great as the minimum stopping sight distance
at the same design speed. Equation(3-40).
According to AASHTO’s A Policy on
Geometric Design of Highways and Streets
(2001) passing
sight distance can be broken into four
components:
·
•The distance traveled by the passing vehicle during perception
and reaction time and during the
•initial acceleration to the point of encroachment on the opposite
lane.
•· The distance the passing vehicle travels while in the opposite
lane.
•· The distance between the passing vehicle at the end of its
maneuver and an opposing vehicle.
•· The distance traveled by an opposing vehicle for 2/3 of the time
the passing vehicle occupies the
•opposite lane.
SIGHT DISTANCE AT UNDER-CROSSINGS
Sight distance on the highway through a grade separation
should be at least as long as the minimum stopping sight
distance and preferably longer,
the structure fascia may cut the line of sight and limit the
sight distance to provide the minimum length of sag vertical
curve discussed above at grade separation structures.
The sight distance should not need to be reduced below the
minimum recommended values for stopping sight distance.
To check the available sight distance at an under-crossing
use ex 3-54 to 3-57 using an eye height of 2.4 m and object
height of 0.6 m
12
HORIZONTAL ALIGNMENT
Equations
ROAD ALIGNMENT
HORIZONTAL ALIGNMENT
 Design based on appropriate relationship
between design speed and curvature and
their interaction with side friction and super
elevation
 Along circular path, inertia causes the
vehicle to attempt to continue in a straight
line
 Super elevation and friction between tire
and roadway provides a force to offset the
vehicle’s inertia; this force is directed
toward the center of curvature (often called
centrifugal or centripetal force)
1. Tangents
2. Curves
3. Transitions
Curves require super elevation
(next lecture)
Reason for super: Banking of
curve, retard sliding, allow
more uniform speed, also
allow use of smaller radii
curves (less land)
HORIZONTAL ALIGNMENT
Rmin = ___V2______
15(e + f)
Where:
V = velocity (mph)
e = superelevation
f = friction (15 = gravity and unit
conversion)
RADIUS CALCULATION
• Rmin related to max. f and max. e allowed
• Rmin use max e and max f (defined by AASHTO,
DOT, and graphed in Green Book) and design
speed
• f is a function of speed, roadway surface, weather
condition, tire condition, and based on comfort –
drivers brake, make sudden lane changes and
changes within a lane when acceleration around a
curve becomes “uncomfortable”
• AASHTO: 0.5 @ 20 mph with new tires and wet
pavement to 0.35 @ 60 mph
• f decreases as speed increases (less tire/pavement
contact)
RADIUS CALCULATION
Design radius example:
assume a maximum e of
8% and design speed of
60 mph, what is the
minimum radius?
fmax = 0.12 (from Green
Book)
Rmin = _____602_________
15(0.08 + 0.12)
Rmin = 1200 feet
RADIUS CALCULATION (EXAMPLE)
For, emax = 4%?
Rmin = ___602_______
15(0.04 + 0.12)
Rmin = 1,500 feet
For emax = 4%?
Rmin =
_____602____________
____
15(0.04 + 0.12)
Rmin = 1,500 feet
Radius Calculation (Example)
19
CURVE TYPES
1. Simple curves with spirals
2. Broken Back – two curves same direction
(avoid)
3. Compound curves: multiple curves
connected directly together (use with
caution) go from large radii to smaller radii
and have R(large) < 1.5 R(small)
4. Reverse curves – two curves, opposite
direction (require separation typically for
superelevation attainment)
20
IMPORTANT COMPONENTS OF SIMPLE
CIRCULAR CURVE
 PC, PI, PT, E, M, and 
 L = 2()R()/360
 T = R tan (/2)
Source: Iowa DOT
Design Manual
21
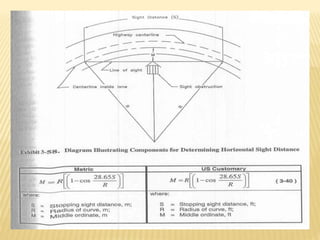
SIGHT DISTANCE FOR HORIZONTAL
CURVES
 Location of object along chord length that blocks
line of sight around the curve
 m = R(1 – cos [28.65 S])
R
Where:
m = line of sight
S = stopping sight distance
R = radius
22
VERTICAL ALIGNMENT
Equations
23
CURVE/GRADE TRADEOFF
 a 3% grade causes
a reduction in speed
of 10 mph after
1400 feet
24
VERTICAL ALIGNMENT - GENERAL
1. Parabolic shape
2. VPI, VPC, VPT, +/- grade, L
3. Types of crest and
sag curves – see
Exhibit 3-73 p. 269
Source: A Policy on Geometric
Design of Highways and Streets
(The Green Book). Washington, DC.
American Association of State
Highway and Transportation
Officials, 2001 4th Ed.
25
VERTICAL ALIGNMENT – GENERAL (CONT.)
4. Crest – stopping, or passing sight distance
controls
5. Sag – headlight/SSD distance, comfort,
drainage and appearance control
6. Green Book vertical curves defined by K =
L/A = length of vertical curve/difference in
grades (in percent) = length to change one
percent in grade
26
VERTICAL ALIGNMENT - GENERAL
Parabolic shape as applied to vertical curves
y = ax2 + bx + c
Where:
y = roadway elevation at distance x
x = distance from beginnning of vertical
curve
a, b = coefficients that define shape
c = elevation of PVC
27
VERTICAL ALIGNMENT - GENERAL
Parabolic shape as applied to vertical curves
a = G2 – G1
L
b = G1
Source: A Policy on Geometric
Design of Highways and Streets
(The Green Book). Washington, DC.
American Association of State
Highway and Transportation
Officials, 2001 4th Ed.
28
VERTICAL CURVE AASHTO CONTROLS (CREST)
1. Based on stopping sight distance
2. Minimum length must provide sight
distance S
3. Two situations (Crest, assumes 3.5
and 2.0 ft. heights)
Source: Transportation Engineering On-line
Lab Manual,
http://www.its.uidaho.edu/niatt_labmanual/
29
Assistant with Target Rod (2ft object height)
Observer with Sighting
Rod (3.5 ft)
30
VERTICAL CURVE AASHTO CONTROLS (CREST)
Note: for passing site distance, use 2800
instead of 2158
Source: A Policy on Geometric
Design of Highways and Streets
(The Green Book). Washington, DC.
American Association of State
Highway and Transportation
Officials, 2001 4th Ed.
31
 Can also use
K = L / A
Where
K = length of curve per percent algebraic
difference in intersecting grade
Charts from Green Book
32
From Green book
33
From Green book
34
VERTICAL CURVE AASHTO CONTROLS (CREST)
Since you do not at first know L, try one of
these equations and compare to
requirement, or use L = KA (see tables
and graphs in Green Book for a given A
and design speed)
Note min. L(ft) = 3V(mph) – Why?
35
SAG VERTICAL CURVES
 Sight distance is governed by nighttime
conditions
 Distance of curve illuminated by headlights need
to be considered
 Driver comfort
 Drainage
 General appearance
36
VERTICAL CURVE AASHTO CONTROLS (SAG)
Headlight Illumination sight distance with S < L
S < L
L = AS2
S > L
L = 2S – (400 + 3.5S)
A
Headlight Illumination sight distance with S > L
Source: A Policy on Geometric
Design of Highways and Streets
(The Green Book). Washington, DC.
American Association of State
Highway and Transportation
Officials, 2001 4th Ed.
400 + (3.5 * S)
37
VERTICAL CURVE AASHTO CONTROLS (SAG)
 For driver comfort use:
L = AV2
46.5
(limits g force to 1 fps/s)
 To consider general appearance use:
L = 100 A
Source: A Policy on Geometric
Design of Highways and Streets
(The Green Book). Washington, DC.
American Association of State
Highway and Transportation
Officials, 2001 4th Ed.
38
VERTICAL CURVE AASHTO CONTROLS (SAG)
 For curb drainage, want minimum of
0.3 percent grade within 50’ of low
point = need Kmax = 167 (US units)
 For appearance on high-type roads,
use minimum design speed of 50 mph
(K = 100)
 As in crest, use minimum L = 3V
39
OTHER IMPORTANT ISSUES:
 Use lighting if need to use shorter L than
headlight requirements
 Sight distance at under crossings
40
Source: Iowa DOT
Design Manual
41Source: Iowa DOT Design Manual
42
Source: Iowa DOT
Design Manual
Note: L is measured from here to here
Not here
GENERAL CONTROLS FOR VERTICAL ALIGNMENT
 A smooth grade-line with gradual changes.
 “roller=coaster” or “hidden-dip” type of profile should be
avoided.
 A “broken-back” grade-line (two vertical curves in the same
direction separated by a short section of tangent grade)
generally should be avoided.
 Where at-grade intersections occur on roadway sections
with moderate to steep grade, it is desirable to reduce the
grade through the intersection.
 Sag vertical curves should be avoided in cuts unless
adequate drainage can be provided.
COMBINATIONS OF HORIZONTAL AND VERTICAL
ALIGNMENT
General Design Controls:
 Curvature and grades should be in proper balance. Tangent alignment
or flat curvature or long grades and excessive curvature with flat grades.
A logical design is between those two.
 Vertical curvature superimposed on horizontal curvature, or vice versa,
generally results in amore pleasing facility.
 Sharp horizontal curvature should not be introduced at or near the top of
a crest vertical curve, this condition is undesirable because the driver
may not perceive the horizontal change in alignment. Suitable designs
can also be developed by using design values will above the appropriate
minimum values for the design speed.
 Sharp horizontal curvature should not be introduced near the bottom of
a steep grade approaching or near the low point of sag vertical curve.
Because the view of the road ahead is foreshortened..
COMBINATIONS OF HORIZONTAL AND VERTICAL
ALIGNMENT
 On two-lane roads and streets. It is appropriate to work toward long
tangent sections to assure sufficient passing sight distance in design.
 Both horizontal curvature and profile should be made as flat as practical
at intersections where sight distance along both roads or streets is
important .
 On divided highways and streets, variation on width of median and the
use of independent profiles and horizontal alignments for the separate
one-way roadways are some times desirable.
 In residential areas, the alignment should be designed to minimize
nuisance to the neighborhood, a depressed facility makes a highway
less visible . Minor horizontal adjustments increase the buffer zone .
 The alignment should be designed to enhance attractive scenic views of
the natural and manmade environment, such as rivers, rock formations

Sight distance and road allignment

  • 1.
    Sight Distance And Road Alignment PiterBiswas piterbiswas11@gmail.com Vickyson Naorem
  • 2.
    SIGHT DISTANCE Stopping SightDistance: The sight line is a chord of the curve, and the stopping sight distance is measured along the centerline of the inside lane around the curve. Equation 3-40 applies only to circular curves longer than the sight distance for the pertinent design speed. Where sufficient stopping sight distance is not available .the alternatives are:  Increase the offset to the obstruction.  Increase the radius.  Reduce the design speed.
  • 3.
     A studyreported by TRB, went on to develop a model to assist in determining the cost- effectiveness of lengthening a vertical curve to increase sight distance over a crest.  It is cost-effective when the design speed is more than 20mph below operating speed in the area.  Traffic flows exceed 1500 vpd  High volume intersection  Sharp curve  Steep downgrade  Lane drop SIGHT DISTANCE (Contd.)
  • 4.
    Exhibit 3-57 isa design chart showing the middle ordinates needed for clear sight areas that satisfy stopping sight distance criteria presented in Exhibit 3-1
  • 6.
    SIGHT DISTANCE ONHORIZONTAL CURVES Passing sight distance: The minimum passing sight distance for a two-lane roads or street is about four times as great as the minimum stopping sight distance at the same design speed. Equation(3-40).
  • 7.
    According to AASHTO’sA Policy on Geometric Design of Highways and Streets (2001) passing sight distance can be broken into four components: · •The distance traveled by the passing vehicle during perception and reaction time and during the •initial acceleration to the point of encroachment on the opposite lane. •· The distance the passing vehicle travels while in the opposite lane. •· The distance between the passing vehicle at the end of its maneuver and an opposing vehicle. •· The distance traveled by an opposing vehicle for 2/3 of the time the passing vehicle occupies the •opposite lane.
  • 8.
    SIGHT DISTANCE ATUNDER-CROSSINGS Sight distance on the highway through a grade separation should be at least as long as the minimum stopping sight distance and preferably longer, the structure fascia may cut the line of sight and limit the sight distance to provide the minimum length of sag vertical curve discussed above at grade separation structures. The sight distance should not need to be reduced below the minimum recommended values for stopping sight distance. To check the available sight distance at an under-crossing use ex 3-54 to 3-57 using an eye height of 2.4 m and object height of 0.6 m
  • 12.
  • 13.
    ROAD ALIGNMENT HORIZONTAL ALIGNMENT Design based on appropriate relationship between design speed and curvature and their interaction with side friction and super elevation  Along circular path, inertia causes the vehicle to attempt to continue in a straight line  Super elevation and friction between tire and roadway provides a force to offset the vehicle’s inertia; this force is directed toward the center of curvature (often called centrifugal or centripetal force)
  • 14.
    1. Tangents 2. Curves 3.Transitions Curves require super elevation (next lecture) Reason for super: Banking of curve, retard sliding, allow more uniform speed, also allow use of smaller radii curves (less land) HORIZONTAL ALIGNMENT
  • 15.
    Rmin = ___V2______ 15(e+ f) Where: V = velocity (mph) e = superelevation f = friction (15 = gravity and unit conversion) RADIUS CALCULATION
  • 16.
    • Rmin relatedto max. f and max. e allowed • Rmin use max e and max f (defined by AASHTO, DOT, and graphed in Green Book) and design speed • f is a function of speed, roadway surface, weather condition, tire condition, and based on comfort – drivers brake, make sudden lane changes and changes within a lane when acceleration around a curve becomes “uncomfortable” • AASHTO: 0.5 @ 20 mph with new tires and wet pavement to 0.35 @ 60 mph • f decreases as speed increases (less tire/pavement contact) RADIUS CALCULATION
  • 17.
    Design radius example: assumea maximum e of 8% and design speed of 60 mph, what is the minimum radius? fmax = 0.12 (from Green Book) Rmin = _____602_________ 15(0.08 + 0.12) Rmin = 1200 feet RADIUS CALCULATION (EXAMPLE) For, emax = 4%? Rmin = ___602_______ 15(0.04 + 0.12) Rmin = 1,500 feet
  • 18.
    For emax =4%? Rmin = _____602____________ ____ 15(0.04 + 0.12) Rmin = 1,500 feet Radius Calculation (Example)
  • 19.
    19 CURVE TYPES 1. Simplecurves with spirals 2. Broken Back – two curves same direction (avoid) 3. Compound curves: multiple curves connected directly together (use with caution) go from large radii to smaller radii and have R(large) < 1.5 R(small) 4. Reverse curves – two curves, opposite direction (require separation typically for superelevation attainment)
  • 20.
    20 IMPORTANT COMPONENTS OFSIMPLE CIRCULAR CURVE  PC, PI, PT, E, M, and   L = 2()R()/360  T = R tan (/2) Source: Iowa DOT Design Manual
  • 21.
    21 SIGHT DISTANCE FORHORIZONTAL CURVES  Location of object along chord length that blocks line of sight around the curve  m = R(1 – cos [28.65 S]) R Where: m = line of sight S = stopping sight distance R = radius
  • 22.
  • 23.
    23 CURVE/GRADE TRADEOFF  a3% grade causes a reduction in speed of 10 mph after 1400 feet
  • 24.
    24 VERTICAL ALIGNMENT -GENERAL 1. Parabolic shape 2. VPI, VPC, VPT, +/- grade, L 3. Types of crest and sag curves – see Exhibit 3-73 p. 269 Source: A Policy on Geometric Design of Highways and Streets (The Green Book). Washington, DC. American Association of State Highway and Transportation Officials, 2001 4th Ed.
  • 25.
    25 VERTICAL ALIGNMENT –GENERAL (CONT.) 4. Crest – stopping, or passing sight distance controls 5. Sag – headlight/SSD distance, comfort, drainage and appearance control 6. Green Book vertical curves defined by K = L/A = length of vertical curve/difference in grades (in percent) = length to change one percent in grade
  • 26.
    26 VERTICAL ALIGNMENT -GENERAL Parabolic shape as applied to vertical curves y = ax2 + bx + c Where: y = roadway elevation at distance x x = distance from beginnning of vertical curve a, b = coefficients that define shape c = elevation of PVC
  • 27.
    27 VERTICAL ALIGNMENT -GENERAL Parabolic shape as applied to vertical curves a = G2 – G1 L b = G1 Source: A Policy on Geometric Design of Highways and Streets (The Green Book). Washington, DC. American Association of State Highway and Transportation Officials, 2001 4th Ed.
  • 28.
    28 VERTICAL CURVE AASHTOCONTROLS (CREST) 1. Based on stopping sight distance 2. Minimum length must provide sight distance S 3. Two situations (Crest, assumes 3.5 and 2.0 ft. heights) Source: Transportation Engineering On-line Lab Manual, http://www.its.uidaho.edu/niatt_labmanual/
  • 29.
    29 Assistant with TargetRod (2ft object height) Observer with Sighting Rod (3.5 ft)
  • 30.
    30 VERTICAL CURVE AASHTOCONTROLS (CREST) Note: for passing site distance, use 2800 instead of 2158 Source: A Policy on Geometric Design of Highways and Streets (The Green Book). Washington, DC. American Association of State Highway and Transportation Officials, 2001 4th Ed.
  • 31.
    31  Can alsouse K = L / A Where K = length of curve per percent algebraic difference in intersecting grade Charts from Green Book
  • 32.
  • 33.
  • 34.
    34 VERTICAL CURVE AASHTOCONTROLS (CREST) Since you do not at first know L, try one of these equations and compare to requirement, or use L = KA (see tables and graphs in Green Book for a given A and design speed) Note min. L(ft) = 3V(mph) – Why?
  • 35.
    35 SAG VERTICAL CURVES Sight distance is governed by nighttime conditions  Distance of curve illuminated by headlights need to be considered  Driver comfort  Drainage  General appearance
  • 36.
    36 VERTICAL CURVE AASHTOCONTROLS (SAG) Headlight Illumination sight distance with S < L S < L L = AS2 S > L L = 2S – (400 + 3.5S) A Headlight Illumination sight distance with S > L Source: A Policy on Geometric Design of Highways and Streets (The Green Book). Washington, DC. American Association of State Highway and Transportation Officials, 2001 4th Ed. 400 + (3.5 * S)
  • 37.
    37 VERTICAL CURVE AASHTOCONTROLS (SAG)  For driver comfort use: L = AV2 46.5 (limits g force to 1 fps/s)  To consider general appearance use: L = 100 A Source: A Policy on Geometric Design of Highways and Streets (The Green Book). Washington, DC. American Association of State Highway and Transportation Officials, 2001 4th Ed.
  • 38.
    38 VERTICAL CURVE AASHTOCONTROLS (SAG)  For curb drainage, want minimum of 0.3 percent grade within 50’ of low point = need Kmax = 167 (US units)  For appearance on high-type roads, use minimum design speed of 50 mph (K = 100)  As in crest, use minimum L = 3V
  • 39.
    39 OTHER IMPORTANT ISSUES: Use lighting if need to use shorter L than headlight requirements  Sight distance at under crossings
  • 40.
  • 41.
    41Source: Iowa DOTDesign Manual
  • 42.
    42 Source: Iowa DOT DesignManual Note: L is measured from here to here Not here
  • 43.
    GENERAL CONTROLS FORVERTICAL ALIGNMENT  A smooth grade-line with gradual changes.  “roller=coaster” or “hidden-dip” type of profile should be avoided.  A “broken-back” grade-line (two vertical curves in the same direction separated by a short section of tangent grade) generally should be avoided.  Where at-grade intersections occur on roadway sections with moderate to steep grade, it is desirable to reduce the grade through the intersection.  Sag vertical curves should be avoided in cuts unless adequate drainage can be provided.
  • 44.
    COMBINATIONS OF HORIZONTALAND VERTICAL ALIGNMENT General Design Controls:  Curvature and grades should be in proper balance. Tangent alignment or flat curvature or long grades and excessive curvature with flat grades. A logical design is between those two.  Vertical curvature superimposed on horizontal curvature, or vice versa, generally results in amore pleasing facility.  Sharp horizontal curvature should not be introduced at or near the top of a crest vertical curve, this condition is undesirable because the driver may not perceive the horizontal change in alignment. Suitable designs can also be developed by using design values will above the appropriate minimum values for the design speed.  Sharp horizontal curvature should not be introduced near the bottom of a steep grade approaching or near the low point of sag vertical curve. Because the view of the road ahead is foreshortened..
  • 45.
    COMBINATIONS OF HORIZONTALAND VERTICAL ALIGNMENT  On two-lane roads and streets. It is appropriate to work toward long tangent sections to assure sufficient passing sight distance in design.  Both horizontal curvature and profile should be made as flat as practical at intersections where sight distance along both roads or streets is important .  On divided highways and streets, variation on width of median and the use of independent profiles and horizontal alignments for the separate one-way roadways are some times desirable.  In residential areas, the alignment should be designed to minimize nuisance to the neighborhood, a depressed facility makes a highway less visible . Minor horizontal adjustments increase the buffer zone .  The alignment should be designed to enhance attractive scenic views of the natural and manmade environment, such as rivers, rock formations