
Recommended
More Related Content
What's hot
What's hot (20)
Similar to Aaj ka trend 10.05.16
Similar to Aaj ka trend 10.05.16 (17)
Recently uploaded
Recently uploaded (20)
Aaj ka trend 10.05.16
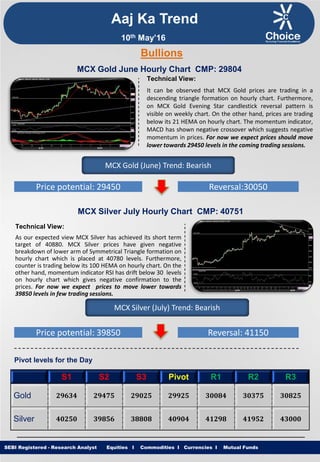
- 1. Equities I Commodities I Currencies I Mutual Funds Aaj Ka Trend Technical View: It can be observed that MCX Gold prices are trading in a descending triangle formation on hourly chart. Furthermore, on MCX Gold Evening Star candlestick reversal pattern is visible on weekly chart. On the other hand, prices are trading below its 21 HEMA on hourly chart. The momentum indicator, MACD has shown negative crossover which suggests negative momentum in prices. For now we expect prices should move lower towards 29450 levels in the coming trading sessions. SEBI Registered - Research Analyst Equities I Commodities I Currencies I Mutual Funds Bullions MCX Gold June Hourly Chart CMP: 29804 MCX Gold (June) Trend: Bearish Price potential: 29450 Reversal:30050 MCX Silver July Hourly Chart CMP: 40751 Technical View: As our expected view MCX Silver has achieved its short term target of 40880. MCX Silver prices have given negative breakdown of lower arm of Symmetrical Triangle formation on hourly chart which is placed at 40780 levels. Furthermore, counter is trading below its 100 HEMA on hourly chart. On the other hand, momentum indicator RSI has drift below 30 levels on hourly chart which gives negative confirmation to the prices. For now we expect prices to move lower towards 39850 levels in few trading sessions. MCX Silver (July) Trend: Bearish Price potential: 39850 Reversal: 41150 Pivot levels for the Day S1 S2 S3 Pivot R1 R2 R3 Gold 29634 29475 29025 29925 30084 30375 30825 Silver 40250 39856 38808 40904 41298 41952 43000 10th May’16
- 2. Equities I Commodities I Currencies I Mutual Funds Technical View: MCX Copper Prices are trading in falling channel formation on hourly charts. However, MCX Copper prices is trading below its 50 HEMA on hourly chart which indicates short term trend remains down. Furthermore, in COMEX Copper Evening Star candlestick reversal pattern is visible on weekly chart. On the other hand, momentum indicator RSI has moved below 40 levels on hourly chart which gives negative confirmation to the prices. For now we expect prices to move lower towards 305 levels in coming trading sessions. SEBI Registered - Research Analyst Equities I Commodities I Currencies I Mutual Funds MCX Copper June hourly Chart CMP: 313.05 MCX Copper (June) Trend: Bearish Price potential: 305 Reversal: 319 MCX Crude Oil May. Hourly Chart CMP: 2910 Technical View: As expected MCX Crude Oil traded on a lower side and almost achieved our short term target at 2902. On Weekly chart, the MCX Crude Oil price has completed a “Bearish White Swan Harmonic Pattern” at 3115 levels. On the other hand, momentum indicator RSI is trading below 40 levels on hourly chart which gives negative confirmation to the prices. Moreover MACD indicator its trading below its signal line on hourly basis. For now we expect prices to move lower towards 2830 levels in coming trading sessions. MCX Crude Oil (May) Trend: Bearish Price potential: 2830 Reversal: 2970 Pivot levels for the Day S1 S2 S3 Pivot R1 R2 R3 Copper 311.1 308.6 301.5 315.6 318.2 322.7 329.7 Crude 2860 2812 2671 2953 3001 3094 3235 Base Metal Energy Aaj Ka Trend 10th May’16
- 3. Equities I Commodities I Currencies I Mutual FundsSEBI Registered - Research Analyst Equities I Commodities I Currencies I Mutual Funds Other Base Metals & Energy S1 S2 S3 Pivot R1 R2 R3 Trend Copper 311.1 308.6 301.5 315.6 318.2 322.7 329.7 Aluminum 103.5 102.9 101.3 104.6 105.2 106.2 107.9 Lead 114.9 114.4 113.1 115.6 116.2 116.9 118.1 Nickel 570.0 561.5 536.4 586.6 595.1 611.7 636.8 Zinc 121.6 120.7 118.3 123.2 124.0 125.6 128.1 Natural Gas 115.3 125.6 122.5 128.7 118.4 131.8 134.9 Fundamental News: Gold futures fell sharply in European trade on Monday, as investors viewed Friday’s U.S. jobs data as less disappointing than first thought. Gold futures extended losses in North American trade on Monday, after falling sharply overnight, as the dollar firmed after data showing improving U.S. wage growth offset an overall weaker payroll report, maintaining expectations of two rate hikes this year. Gold is sensitive to moves in U.S. rates, as a rise would lift the opportunity cost of holding non-yielding assets such as bullion. A gradual path to higher rates is seen as less of a threat to gold prices than a swift series of increases. Oil prices trimmed gains in North American trade on Monday, after rallying sharply overnight as huge wildfires in rural Canada continue to hit supply from the country's vast oil sands reserves. Oil prices jumped on Monday as a huge wildfire in Canada's oil sand region knocked out over a million barrels in daily production capacity, contributing to a significant tightening of markets. Oil prices fell 2 percent or more on Monday after traders took in their stride the impact of wildfires on Canada's oil output and after another inventory build at the U.S. hub for crude futures. Brazil has joined a list of countries exporting diesel to Europe, reversing a traditional route and underscoring a weakening of the largest South American economy. U.S. natural gas futures edged lower on Monday, after the latest U.S. weather model called for mild temperatures over the next two weeks, which should reduce heating demand during that time. Aaj Ka Trend 10th May’16
- 4. Equities I Commodities I Currencies I Mutual FundsSEBI Registered - Research Analyst Equities I Commodities I Currencies I Mutual Funds International Market Commodity Closing Price Gold 1290.55 Silver 17.51 Crude Oil 44.61 Brent Crude Oil 45.32 Natural Gas 2.091 COMEX/NYMEX/ICE ( Precious Metals & Energy) Currency & Commodity Index Currency (Spot) Current Price USD / INR 66.60 Dollar Index 93.83 EUR / USD 1.1404 CRB Index* 179.91 Closing as on 09.05.16 *Closing as on 09.05.16 LME (Base Metals) ( $ per tones) Commodity Closing Price Copper 4686 Aluminum 1561 Zinc 1835 Lead 1730 Nickel 8605 SHFE (Base Metals) (Yuan per tones) Commodity Closing Price Copper 35860 Aluminum 11900 Zinc 14470 Lead 14150 Closing as on 09.05.16 Closing as on 09.05.16 LME INVENTORY DATA Aaj Ka Trend 03-May-16 04-May-16 05-May-16 06-May-16 09-May-16 Aluminium -6650 -12350 -2900 -6275 -2900 Copper 5175 1825 2300 225 2300 Lead -700 -200 -650 550 -650 Nickel 66 -1062 150 -1308 150 Zinc -2475 -4275 -1225 -1125 -1225 10th May’16
- 5. Equities I Commodities I Currencies I Mutual Funds This is solely for information of clients of Choice Broking and does not construe to be an investment advice. It is also not intended as an offer or solicitation for the purchase and sale of any financial instruments. Any action taken by you on the basis of the information contained herein is your responsibility alone and Choice Broking its subsidiaries or its employees or associates will not be liable in any manner for the consequences of such action taken by you. We have exercised due diligence in checking the correctness and authenticity of the information contained in this recommendation, but Choice Broking or any of its subsidiaries or associates or employees shall not be in any way responsible for any loss or damage that may arise to any person from any inadvertent error in the information contained in this recommendation or any action taken on basis of this information. Technical analysis studies market psychology, price patterns and volume levels. It is used to forecast future price and market movements. Technical analysis is complementary to fundamental analysis and news sources. The recommendations issued herewith might be contrary to recommendations issued by Choice Broking in the company research undertaken as the recommendations stated in this report is derived purely from technical analysis. Choice Broking has based this document on information obtained from sources it believes to be reliable but which it has not independently verified; Choice Broking makes no guarantee, representation or warranty and accepts no responsibility or liability as to its accuracy or completeness. The opinions contained within the report are based upon publicly available information at the time of publication and are subject to change without notice. The information and any disclosures provided herein are in summary form and have been prepared for informational purposes. The recommendations and suggested price levels are intended purely for trading purposes. The recommendations are valid for the day of the report however trading trends and volumes might vary substantially on an intraday basis and the recommendations may be subject to change. The information and any disclosures provided herein may be considered confidential. Any use, distribution, modification, copying, forwarding or disclosure by any person is strictly prohibited. The information and any disclosures provided herein do not constitute a solicitation or offer to purchase or sell any security or other financial product or instrument. The current performance may be unaudited. Past performance does not guarantee future returns. There can be no assurance that investments will achieve any targeted rates of return, and there is no guarantee against the loss of your entire investment. POTENTIAL CONFLICT OF INTEREST DISCLOSURE (as on date of report) Disclosure of interest statement – • Analyst interest of the stock /Instrument(s): - No. • Firm interest of the stock / Instrument (s): - No. Disclaimer Contact Us Amit Pathania Research Associate amit.pathania@choiceindia.com Rohan Patil Research Associate rohan.patil@choiceindia.com www.choiceindia.comcustomercare@choiceindia.com SEBI Registered - Research Analyst Equities I Commodities I Currencies I Mutual Funds Aaj Ka Trend 10th May’16 Neeraj Yadav Research Advisor neeraj.yadav@choiceindia.com Anish Vyas Senior Research Associate anish.vyas@choiceindia.com Amit Pathania Digitally signed by Amit Pathania DN: cn=Amit Pathania, o=Choice Equity Broking Pvt. ltd, ou=Research Department, email=amit.pathania@choiceindia.com, c=IN Date: 2016.05.10 08:51:17 +05'30'