Nepse Technical Analysis August 23 - August 27, 2015
•
0 likes•308 views

Nepse Weekly Technical Analysis August 23 - August 27, 2015

Recommended
Recommended
More Related Content
What's hot
What's hot (20)
Viewers also liked
Viewers also liked (12)
Similar to Nepse Technical Analysis August 23 - August 27, 2015
Similar to Nepse Technical Analysis August 23 - August 27, 2015 (15)
More from Kriti Capital & Investments Ltd.
More from Kriti Capital & Investments Ltd. (14)
Recently uploaded
Recently uploaded (20)
Nepse Technical Analysis August 23 - August 27, 2015
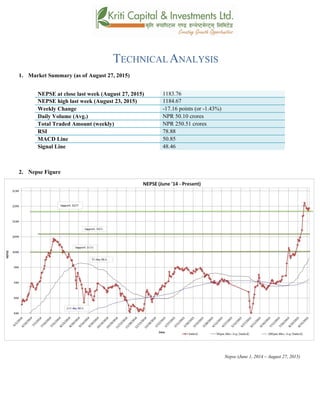
- 1. TECHNICALANALYSIS 1. Market Summary (as of August 27, 2015) NEPSE at close last week (August 27, 2015) 1183.76 NEPSE high last week (August 23, 2015) 1184.67 Weekly Change -17.16 points (or -1.43%) Daily Volume (Avg.) NPR 50.10 crores Total Traded Amount (weekly) NPR 250.51 crores RSI 78.88 MACD Line 50.85 Signal Line 48.46 2. Nepse Figure Nepse (June 1, 2014 – August 27, 2015)
- 2. 3. Trend Analysis Nepse ended on a bearish note for most of last week. However, the market ending in the red for most of last week is due to various market corrections. The volume transaction does not support the bearish move of the market as the volume turnover decreased significantly as compared to the turnover during the bullish period. The index lost 17.16 points (or down 1.43%) last week, to close at 1183.76. The benchmark index is still moving above the 50-day and 200-day moving average at a higher rate, indicating that the overall market trend looks good. 4. Resistance and Support Immediate Support 1175 Support 2 1130 Immediate Resistance 1250 Resistance 2 The lowest Nepse fell to last week was at 1175.57, and the highest level it reached is at 1184.67. It will not be a surprise for the market to surpass the resistance level of 1250 as the bullish trigger is still present in the market. The support level of 1175 will stay strong since it was an old high of the index. The new support and resistance level stands at 1175 and 1250 respectively. 5. Trend Indicator a.) MACD The MACD is a momentum oscillator formed by using two different types of moving averages, which provides specific buying or selling signals. When a MACD line crosses above the signal line, it is considered to be a positive sign and indicates a time to buy, and vice-versa. The Macd line is still moving above the signal line. However, the distance between the lines has decreased steadily. The Macd line did not gain as much where as the signal line increased throughout the week. By the end of the week, the macd and signal lines ended at 50.85 and 48.46 respectively. b.) RSI RSI is a form of leading indicator that is believed to be most effective during periods of sideways movement. Such indicators may create numerous buy and sell signals that are useful when the market is not clearly trending upwards or downwards.
- 3. Last week, the RSI fell significantly and hovered around late 70 and early 80 level, which still indicates high buying pressure in the market. The RSI at the beginning of last week was at 82.22 level. Towards the end of the week, it fell by 3.34 points to end at 78.88 level. c.) Bollinger Bands The Bollinger Band is a technical indicator that consists of a moving average (21-day) along with two trading bands above (upper band) and below it (lower band). The bands are an indication of volatility, which are represented by calculating standard deviation. The benchmark index came below the upper Bollinger band last week. The index is still between the upper and middle band. The bands also show prevalence of over-bought condition in the market. The distance between the upper and lower band is still wide, signifying high market volatility. 6. Volume Indicator (On-Balance Volume) On-Balance Volume (OBV) is a momentum indicator that relates volume to the current price of the index or security. It measures buying and selling pressure at the market. It acts as a cumulative indicator that adds volume on up days and subtracts volume on down days. If a price increase is supported by OBV, it confirms an uptrend, whereas if a price decrease is supported by OBV, it confirms a downtrend.
- 4. In the course of last week, the On-Balance Volume (OBV) did not support the fall experienced by Nepse. This shows that the market is going through its correction phase and is unlikely to trigger a bearish movement. The average weekly volume transactions fell to NPR 50.10 crores from NPR 80.33 crores the week prior. The market ended in the green on the last trading day of last week, and its volume transaction was 82.47 crores, which is higher as compared to last week’s average volume turnover. 7. Overview The Nepse index lost 17.16 points (or down 1.43%) last week to close at 1183.76. This fall in the benchmark index is due to various market corrections. The investors are booking investment profits as a result of an expanding bull market. The 50-day moving average (MA) is still moving upward at a steep rate, and also moving above the 200-day MA, showing a bullish attitude in the market. The average weekly volume transactions fell to NPR 50.10 crores from NPR 80.33 crores the week prior. The OBV does not support the fall in the index last week, signifying that the market trend looks good. The RSI ended at 78.88 level, still indicating a strong buying pressure in the market. The Bollinger bands also show prevalence of high market volatility as the distance between the upper and lower bands is widen. The current support and resistance level stands at 1175 and 1250 respectively.
- 5. k|fljlwsljZn]if0f !_ahf/ ;f/f+z -ebf}!), @)&@ ;Ddsf]_ aGb cªs -ebf}!), @)&@_ !!*#=&^ pRr cªs -uPsf] ;ftf_ !!*$=^& ;fKtflxs kl/jt{g –!&=!^ -–!=$#k|ltzt_ b}lgscf};t Jofkf/ ¿=%)=!)s/f]8 s'n ;fKtflxsJofkf/ ¿ @%)=%! s/f]8 cf/P;cfO{ &*=** PdP;L8L %)=*% l;UgnnfO{g $*=$^ @_ ahf/ k|j[lt Nepse (June 1, 2014 – August 27, 2015)
- 6. #_ 6]«G8 ljZn]if0f uPsf] ;ftf g]K;] kl/;"rssf/f]af/ lbgsf] w]/}h;f] lbg 36g uof] . uPsf] ;ftfsf] cl3Nnf] ;ftfdf a9]sf] ahf/df s]xL s/]S;g b]lvof] . g]K;] kl/;"rsdfcfPsf] ;fdfGolu/fj6 ;+u} sf/f]af/ /sddf ;d]t s]xLlu/fj6 b]lvof] . kl/;"rsn] !&=!^ cªsu'dfP/ nueu !!*#=&^ cªsdfaGbx'guof] .;fy} g]K;] kl/;"rsxfnsf] nflu %) lbg] d'leËPe/]h tyf @)) lbg] d'leËPe/]h eGbfdfly g} lxl8/x]sf] cj:yfn] ;du|dfahf/sf] l:ylt /fd|f] /x]sf] cj:yf /xof] . $_ 6]jftyfk|lt/f]w cªs glhssf] 6]jfcªs !!&% 6]jfcªs @ !!#) glhssf] k|lt/f]w cªs !@%) g]K;] kl/;"rsn] uPsf] ;ftf ;a}eGbftn !!&%=%% cªs 5'g k'Uof] eg] a9Ldf !!*$=^&cªs ;Ddk'Uof] . xfnsf] cj:yfdfahf/n] cfkmgf] glhssf] k|lt/f]w cªs !@%) ;d]t ;lhn} kf/ ug{ ;Sg] cj:yfklg /x]sf] 5 . xfnsf] nflu 6]jfcªstyfk|lt/f]w cªs !!&%tyf !@%) /x]sf] 5 . %_ g]K;] 6]«G8 ;"rs s_ d'leª Pe/]hsGeh]{G; 8fOeh]{G; -PdP;L8L_ PdP;L8Ldf b'O{ cf]6f /]vf x'G5g, h;df Pp6fn] ahf/sf] lbzf kl/jt{gsf] ;+s]t u5{ eg] csf]{n] ahf/sf] k|j[lQ -6«]08_ b]vfpg] u5{ . olb PdP;L8L /]vfn] l;Ung /]vfnfO{ tnaf6 dfly sf6]dfo;nfO{ ;sf/fTds ;+s]tsf ?kdflnO{G5 / o;n] z]o/x? lsGg] ;+s]t ub{5 . PdP;L8L nfO{g l;UgnnfO{g eGbfdfly g} /x]sf] cj:yf /xof] t/b'O{ nfO{g aLrsf] b'/Ldfeg] s]xLsdLcfPsf] cj:yf /xof] .PdP;L8L nfO{gl;UgnnfO{g sf] bfFhf]df s]xLtnem/]sf] cj:yf /xof] . xfnsf] nfluPdP;;L8L nfO{g tyfl;UgnnfO{g %)=*%tyf$*=$^df /x]sf] 5 .
- 7. v_ l/n]l6j :6«]Gy OG8]S; -cf/P;cfO{_ cf/P;cfO{ k|fljlwsljZn]if0fsf] o:tf] cf}hf/ xf], h;nfO{ Pstlkm{ ?kdfrln/x]sf] ahf/dfJofkf/ /0fgLlt agfpg a9L pkof]uL dflgG5 . To;}u/L, o;n] ahf/dfvl/b / ljlqmsf] :ki6 ;+s]t b]vfpg] u5{ . uPsf] ;ftfsf/f]af/sf] w]/}h;f] lbgcf/P;cfO{ &) b]lv *)cªsf] n]endf g} /xguof]h;nfOclxn] ahf/lgs} pRrcf]e/ a6 cj:yf dflgG5 .;ftfsf] z'?df*@=@@cªsdf /x]sf] cf?P;cfO{ ;ftfsf] cGTodf#=#$cªsn] 36]/ &*=**cªsdf /xguof] . u_ af]lnªu/ Aof08 af]lnªu/ Aof08 Ps k|fljlwsljZn]if0f ;"rsxf] h;df @!–lbg] d'leËPe/]hsf ;fyb'O{ Aof08 -Pp6f dfly_ / Pp6f tn_ x'G5g . lo Aof08x?n] cl:y/tfsf] ;+s]t ub{5g, h'g :6fG88{ 8]leP;g u0fgf u/]/ kQfnufO{G5 . g]K;] kl/;"rsuPsf] pkNnf] af]lnªu/ Aof08sf] tncfpguof]. g]K;] kl/;"rsxfnsf] nflupkNnf] tyfdWo Aof08 sf] aLrdf /x]sf] 5 h;n] ahf/ clxn] klgcf]e/ a6sf] l:yltdf /x]sf] ;+s]t ub{5 .pkNnf] tyftNnf] Jof08 aLrsf] a9g uPsf] b'/Ln] ahf/dfcl:y/tf a9g uPsf] ;+s]t ub{5 .
- 8. ^_ eNo'd ;'rs -cg–Aofn]G; eNo'd_ cg–Aofn]G; eNo'd n] ahf/dflsGg] tyf a]Rg] k|];/sf] ;+s]t ub{5 . ;d|udf of] ;"rsn] ahf/ dflyuPsf] cj:yftyftnem/]sf] cj:yfdfahf/dfsf/f]af/sf] eNo'd s:tf] /xof] ;+s]t ub{5 .
- 9. xfnsf] cj:yfdfcg–Aofn]G; eNo'dn] kl/;"rsnfO{ ;fyglbPsf] l:ylt /xof].uPsf] ;ftfsf] cl3Nnf] ;ftf a9]sf] ahf/df s]xL s/]S;g b]lvof] . ;ftfsf] cf};t sf/f]af/ /sddflu/fj6 b]lvof]h'guPsf] ;ftfsf] cl3Nnf] ;ftf ?= *)=## s/f]8 lyof] eg] uPsf] ;ftf ?= %)=!) s/f]8df /xguof] . ;ftfsf] clGtdlbgahf/ df ?= *@=$& s/f]8sf] sf/f]af/ eof] hf] ;ftfsf] cf};t sf/f]af/ /sdeGbf w]/} xf] . . ;du{dfM uPsf] ;ftf g]K;] kl/;'rsdf!&=!^cªssf] lu/fj6 b]lvof] h;sf] kmn?j?k kl/;"rs!!*#=&^dfaGbeof] .nufgLstf{x?n] xfnsf] laol/; ahf/dfcfkmgf] gfkmf a's u/]sf] cj:yf /xof] . xfnsf] cj:yfdf%) lbg] d'leËPe/]h @)) lbg] d'leËPe/]hnfO{ sf6L dfly lxl8/x]sf] cj:yf /x]sf] 5 h;n] ahf/cem} k"0f{ ?kdfa'lnz 6]«G8df /x]sf] ;+s]t ub{5.cf};t sf/f]af/ /sddflu/fj6 cfO{ ? *)=## s/f]8af6 36]/ ?= %)=!) s/f]8 /xguof] . &*=**cªsdf /x]sf] cf/P;cfO{n] clxn] klgahf/ lgs} alnof] cf]e/ a6 l:yltdf /x]sf] ;+s]t ub{5 . pkNnf] tyftNnf] af]lnªu/Jof08 aLrsf] a9g uPsf] b'/Ln] ahf/dfcl:y/tfsfod /x]sf] ;+s]t ub{5 .xfnsf] nflugofF 6]jfcªstyfk|lt/f]w cªs !!&%tyf !@%) /x]sf] 5 .