Nepse Technical Analysis August 30 - September 3, 2015
•
0 likes•259 views

Nepse Weekly Technical Analysis August 30 - September 3, 2015

Recommended
Recommended
More Related Content
What's hot
What's hot (20)
Viewers also liked
Viewers also liked (13)
Similar to Nepse Technical Analysis August 30 - September 3, 2015
Similar to Nepse Technical Analysis August 30 - September 3, 2015 (12)
More from Kriti Capital & Investments Ltd.
More from Kriti Capital & Investments Ltd. (18)
Recently uploaded
Recently uploaded (20)
Nepse Technical Analysis August 30 - September 3, 2015
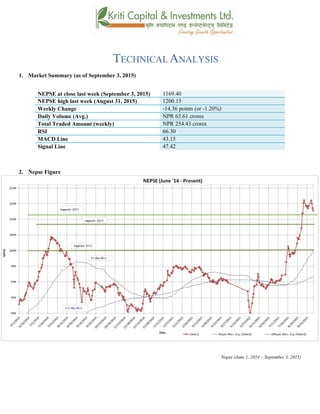
- 1. TECHNICALANALYSIS 1. Market Summary (as of September 3, 2015) NEPSE at close last week (September 3, 2015) 1169.40 NEPSE high last week (August 31, 2015) 1200.15 Weekly Change -14.36 points (or -1.20%) Daily Volume (Avg.) NPR 63.61 crores Total Traded Amount (weekly) NPR 254.43 crores RSI 66.30 MACD Line 43.15 Signal Line 47.42 2. Nepse Figure Nepse (June 1, 2014 – September 3, 2015)
- 2. 3. Trend Analysis Nepse followed a side-ways movement last week as it followed an upward and downward trend. The benchmark index started the week by ending in the green. However it landed in the red territory for the rest of the week. The index made a Double Top at 1200 level, with the support of 1175. At the end of the week, it broke down the immediate support of 1175, signifying that Nepse is possibly at a down trend. However, looking at the size of the structure (M-shaped double top), the down trend may not be a long-term one. Usually, double top causes the index to fall by twice its gap between the top level and the support level (1200 – 1175)*2, which comes to 1125. Last week’s trend gave the market some corrections. However, considering the recent bullish momentum, if the market reverses from last week’s trend, it will break its previous height of 1200. 4. Resistance and Support Immediate Support 1150 Support 2 1125 Immediate Resistance 1200 Resistance 2 At the end of last week, Nepse fell below its previous support level of 1175, and ended at 1169.40. It’s no surprise that the market would follow a downtrend after experiencing such a tremendous growth within a short time period. The current resistance stands at 1200 and the support level stand at 1150. Note: As per NRB directives, BFI’s are discouraged to announce cash dividend, causing investors to be optimistic regarding the banks announcement of bonus and right shares. Hence, this may not cause the index to take a heavyv downfall. Currently, Citizens Bank, Sanima Bank, and Kamana Bikash Bank, have announced attractive bonus shares to its shareholders. Hence, further announcements may reverse the market to go up again. 5. Trend Indicator a.) MACD The MACD is a momentum oscillator formed by using two different types of moving averages, which provides specific buying or selling signals. When a MACD line crosses above the signal line, it is considered to be a positive sign and indicates a time to buy, and vice-versa. The Macd line experienced a steady fall throughout last week. The signal line however remained stable for most of the week. The macd line crossed below the signal line towards the end of last week, signifying a bearish outlook of the market. By the end of the week, the macd and signal lines ended at 43.15 and 47.42 respectively.
- 3. b.) RSI RSI is a form of leading indicator that is believed to be most effective during periods of sideways movement. Such indicators may create numerous buy and sell signals that are useful when the market is not clearly trending upwards or downwards. The RSI, at the beginning of last week, stood at 81.04 level, suggesting high buying pressure. Through the course of the week, it fell significantly to end at 66.30 level. It fell by a staggering 14.74 points. This shows that the buying pressure in the market is slowing down. c.) Bollinger Bands The Bollinger Band is a technical indicator that consists of a moving average (21-day) along with two trading bands above (upper band) and below it (lower band). The bands are an indication of volatility, which are represented by calculating standard deviation. The benchmark index moved in a downward direction for most of last week, and moved closer towards the mid band. Currently, Nepse is hovering between the upper and mid bands. However, it has moved much closer towards the mid band, indicating a decrease in the overbought condition in the market. High level of market volatility still exists as the distance between the upper and lower band is still wide. 6. Volume Indicator (On-Balance Volume)
- 4. On-Balance Volume (OBV) is a momentum indicator that relates volume to the current price of the index or security. It measures buying and selling pressure at the market. It acts as a cumulative indicator that adds volume on up days and subtracts volume on down days. If a price increase is supported by OBV, it confirms an uptrend, whereas if a price decrease is supported by OBV, it confirms a downtrend. Last week, the OBV (On-Balance Volume) took a downward direction when the benchmark index fell as well. The volume increased last week, supporting the fall in Nepse. The average weekly volume transactions increased slightly to NPR 63.61 crores from NPR 50.10 crores the week prior. 7. Overview The Nepse index lost 14.36 points (or down 1.20%) last week to close at 1169.40. It’s no surprise that the market would follow a downtrend after experiencing such a tremendous growth within a short time period The 50-day moving average (MA) is still moving upward at a steep rate, and also moving above the 200-day MA, indicating that the overall outlook of the market looks good. The average weekly volume transactions increased slightly to NPR 63.61 crores from NPR 50.10 crores the week prior. The RSI ended at 66.30 level, which shows that the buying pressure in the market is gradually decreasing. The Bollinger bands still show prevalence of high market volatility as the distance between the upper and lower bands is comparatively wide. The new support and resistance level now stands at 1150 and 1200 respectively.
- 5. k|fljlwsljZn]if0f !_ahf/ ;f/f+z -ebf}!&, @)&@ ;Ddsf]_ aGb cªs -ebf}!), @)&@_ !!^(=$) pRr cªs -uPsf] ;ftf_ !@))=!% ;fKtflxs kl/jt{g –!$=#^ -–!=@)k|ltzt_ b}lgscf};t Jofkf/ ¿=^#=^!s/f]8 s'n ;fKtflxsJofkf/ ¿ @%$=$# s/f]8 cf/P;cfO{ ^^=#) PdP;L8L $#=!% l;UgnnfO{g $&=$@ @_ ahf/ k|j[lt Nepse (June 1, 2014 – September 3, 2015)
- 6. #_ 6]«G8 ljZn]if0f uPsf] ;ftf g]K;] kl/;"rsdf ;fO{8 a]h d'ed]G6 b]lvof] h;sf] kmn:j?k g]K;] kl/;"rsdflyhfg] / tnemg]{ 6]«G8 b]lvof] . ;ftf]sf z'?df a9]sf] ahf/ ;ftfsf] sf/f]af/ lbgdWo] w]/} h;f] lbgemg]{ s|d g} b]lvof] . g]K;] kl/;"rsn] !@)) cªs n]ennfO{ b'O{ k6s ;Dd 5'g k'Uof] . t/ ;ftfsf] cGTolt/ kl/;"rsn] !!&% sf] 6]jfcªsnfO{ sf6L cem} tn /xof] h;n] ahf/d lu/fj6sf] ;+s]t k|bfgu¥of] . ;fy} kl/;"rsdf b]lvPsf] 6]«G8n] lu/fj6sf] cj:yf w]/} lbg ;Dd g/xg] ;+s]t ub{5 / of] uPsf] cj:yfaf6 kl/;"rsdflylkmtf{ x'g] xf] eg] o;n] !@)) cªsnfO{ ;d]t sf6g ;Sg] cj:yf /x]sf] 5 . $_ 6]jftyfk|lt/f]w cªs glhssf] 6]jfcªs !!%) 6]jfcªs @ !!@% glhssf] k|lt/f]w cªs !@)) g]K;] kl/;"rsuPsf] ;ftfcfkmgf] klxn]sf] 6]jfcªs !!&% nfO{ sf6L Tof] eGbftn !!^(=$) df /xguof] . 5f]6f] ;dodf g} k|fKt u/]sf] p5fn ;Fu} ahf/df s]xL s/]S:fg b]lvof] . xfnsf] nfluk|lt/f]wcªs !@)) tyf 6]jfcªs !!%) /x]sf] 5 . gf]6 M xfnsf] nflu g]kfn /fi6« a}+saf6 hf/L gLltcg'?k a}+s ljQLo ;+:yfnfO{ gubnfefz+ eGbfaf]gz z]o/nfO{ k|fyldstfdf /fVghf]8 lbPcg'?kxfn t'?Gt} ahf/ tneg{ ;Sg] ;+Defjgfsd /x]sf] 5 . ;fy} s]xLæsÆju{sfljQLo ;+:yfn] cfkmgf z]o/wgLx?nfO{ gfkmf af6 af]gz z]o/x? lbg] eg]/ 3f]if0f u/] nut}o;n] ahf/nfO{ ;sf/fTds ?kdfdfly g} /fVg] ;+Defjgfalnof] 5 . %_ g]K;] 6]«G8 ;"rs s_ d'leª Pe/]hsGeh]{G; 8fOeh]{G; -PdP;L8L_ PdP;L8Ldf b'O{ cf]6f /]vf x'G5g, h;df Pp6fn] ahf/sf] lbzf kl/jt{gsf] ;+s]t u5{ eg] csf]{n] ahf/sf] k|j[lQ -6«]08_ b]vfpg] u5{ . olb PdP;L8L /]vfn] l;Ung /]vfnfO{ tnaf6 dfly sf6]dfo;nfO{ ;sf/fTds ;+s]tsf ?kdflnO{G5 / o;n] z]o/x? lsGg] ;+s]t ub{5 . uPsf] ;ftfPdP;L8L nfO{gdf s]xLlu/fj6 b]lvof] t/ l;UgnnfO{g eg] ;ftfsf] w]/} h;f] lbg Pp6} n]endf g} /xguof] . ;ftfsf] cGtolt/ PdP;L8L nfO{gl;UgneGbftn e/]sf] cj:yfn] ahf/dflaol/z 6]«G8 >[hgfeof] . xfnsf] nfluPdP;;L8L nfO{g tyfl;UgnnfO{g $#=!%tyf$&=$@df /x]sf] 5 .
- 7. v_ l/n]l6j :6«]Gy OG8]S; -cf/P;cfO{_ cf/P;cfO{ k|fljlwsljZn]if0fsf] o:tf] cf}hf/ xf], h;nfO{ Pstlkm{ ?kdfrln/x]sf] ahf/dfJofkf/ /0fgLlt agfpg a9L pkof]uL dflgG5 . To;}u/L, o;n] ahf/dfvl/b / ljlqmsf] :ki6 ;+s]t b]vfpg] u5{ . uPsf] ;ftfsf] z'?dfcf/P;cfO{ *!=)$ cªsdf /x]sf] lyof] h;n] ahf/dflgs} lsGg] xf]8afhL /x]sf] ;+s]t ub{5 . t/ ;ftfsf] afFsLsf/f]af/ lbgx?dfcf/P;cfO{ tneg]{ s|dhf/L /xof] . ;ftf e/Ldfcf?P;cfO{ hDdf !$=&$ cªsn] tneg{ uof] / o;n] ahf/dflsGg] xf]8afhLdf s]xLsdLcfPsf] ;+s]t ub{5 . u_ af]lnªu/ Aof08 af]lnªu/ Aof08 Ps k|fljlwsljZn]if0f ;"rsxf] h;df @!–lbg] d'leËPe/]hsf ;fyb'O{ Aof08 -Pp6f dfly_ / Pp6f tn_ x'G5g . lo Aof08x?n] cl:y/tfsf] ;+s]t ub{5g, h'g :6fG88{ 8]leP;g u0fgf u/]/ kQfnufO{G5 . g]K;] kl/;"rsuPsf] ;ftftneg]{ s|dd} b]lvof] / dWo Aof08sf] glhslt/ k'Uguof] . xfnsf] nflu g]K;] kl/;"rspkNnf] tyfdWo Aof08sf] sf] aLrlt/ /x]sf] 5 . dWo Aof08sf] glhslt/ /x]sf] cj:yfn] ahf/dfcf]e/–a6 sf] l:yltdf s]xLsdLcfPsf] ;+s]t ub{5 . pkNnf] tyftNnf] Aof08 aLrsf] b'/Ln] ahf/dfcl:y/tfcem} sfod /x]sf] ;+stub{5 .
- 8. ^_ eNo'd ;'rs -cg–Aofn]G; eNo'd_ cg–Aofn]G; eNo'd n] ahf/dflsGg] tyf a]Rg] k|];/sf] ;+s]t ub{5 . ;d|udf of] ;"rsn] ahf/ dflyuPsf] cj:yftyftnem/]sf] cj:yfdfahf/dfsf/f]af/sf] eNo'd s:tf] /xof] ;+s]t ub{5 . xfnsf] cj:yfdfcg–Aofn]G; eNo'dn tm em/]sf] cj:yf ;Fu} g]K;] kl/;"rsklgtneg{ uof] . uPsf] ;ftfsf/f]af/ /sddfeg] s]xL a[l4 b]lvof] . ;ftfsf] cf};t sf/f]af/ /sd ?= ^#=^! /xguof] hf] uPsf] ;ftfsf] cl3Nnf] ;ftf ?= %)=!) lyof] . . ;du{dfM uPsf] ;ftf g]K;] kl/;'rsdf!$=#^cªssf] lu/fj6 b]lvof] h;sf] kmn?j?k kl/;"rs!,!^(=$) cªsdfaGbeof] . 5f]6f] ;dodfahf/ a9g uPsf]n] s]xL s/]S;gx'g' :jefljs b]lvof] . xfnsf] cj:yfdf%) lbg] d'leËPe/]h @)) lbg] d'leËPe/]hnfO{ sf6L dfly lxl8/x]sf] cj:yf /x]sf] 5 h;n] ahf/;d|ddfce} klg /fd|} l:yltdf /x]sf] ;+s]t ub{5 .cf};t sf/f]af/ /sda9g uO{ ? %)=!) s/f]8af6 36]/ ?= ^#=^! s/f]8 /xguof] . ^#=^!cªsdf /x]sf] cf/P;cfO{n] clxn] ahf/ cf]e/ a6 l:yltaf6s]xLtnem/]sf] ;+s]t ub{5 .pkNnf] tyftNnf] af]lnªu/ Jof08 aLrsf] b'/Ln] ahf/dfcl:y/tfsfod /x]sf] ;+s]t ub{5 .xfnsf] nflugofF 6]jfcªstyfk|lt/f]w cªs !!%)tyf !@)) /x]sf] 5 .