Nepse Technical Analysis April 24 - April 28, 2016
•
0 likes•134 views

Nepse Weekly Technical Analysis April 24 - April 28, 2016

Recommended
Recommended
More Related Content
What's hot
What's hot (20)
Viewers also liked
Viewers also liked (11)
Similar to Nepse Technical Analysis April 24 - April 28, 2016
Similar to Nepse Technical Analysis April 24 - April 28, 2016 (12)
More from Kriti Capital & Investments Ltd.
More from Kriti Capital & Investments Ltd. (14)
Recently uploaded
Recently uploaded (20)
Nepse Technical Analysis April 24 - April 28, 2016
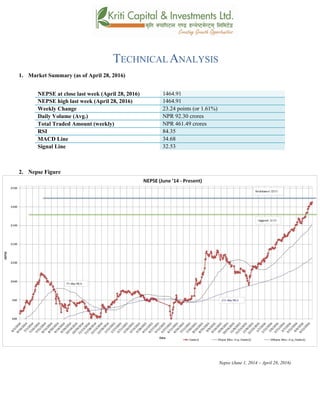
- 1. TECHNICAL ANALYSIS 1. Market Summary (as of April 28, 2016) NEPSE at close last week (April 28, 2016) 1464.91 NEPSE high last week (April 28, 2016) 1464.91 Weekly Change 23.24 points (or 1.61%) Daily Volume (Avg.) NPR 92.30 crores Total Traded Amount (weekly) NPR 461.49 crores RSI 84.35 MACD Line 34.68 Signal Line 32.53 2. Nepse Figure Nepse (June 1, 2014 – April 28, 2016)
- 2. 3. Trend Analysis The Nepse index created history again by reaching an all time height of 1464.91 at the end of last week. The index gained 23.24 points (or up 1.61%) in the course of the week. This shows that the bullish sentiment is still strong in the market. Nepse also corrected itself on Tuesday of last week by declining 8.64 points (or down 0.59%). The third quarter reports of the BFIs continue to show good results, which will increase demand for scripts in the market.The 50 days moving average is still running above 200 days moving average, indicating that the long term Nepse trend looks positive. 4. Resistance and Support Immediate Support 1390 Support 2 1350 Immediate Resistance 1500 Resistance 2 The current immediate support and resistance level stands the same at 1390 and 1500 respectively. By looking at the bullish momentum enduring in the market for a long time period, it seems that the index could cross above the immediate resistance level in the coming weeks. 5. Trend Indicator a.) MACD The MACD is a momentum oscillator formed by using two different types of moving averages, which provides specific buying or selling signals. When a MACD line crosses above the signal line, it is considered to be a positive sign and indicates a time to buy, and vice-versa. The Macd and the signal line stood at 33.44 and 29.47 respectively, at the beginning of last week. This appears to be a positive sigh as the macd line is running above the signal line. However, in the course of the week, the distance between the lines narrowed down. Currently, the macd and signal line stands at 34.68 and 32.53 respectively.
- 3. b.) RSI RSI is a form of leading indicator that is believed to be most effective during periods of sideways movement. Such indicators may create numerous buy and sell signals that are useful when the market is not clearly trending upwards or downwards. The RSI at the beginning of the week stood at 88.98 points. In the course of the week, it declined 4.62 points to close at 84.35 level. The RSI indicator continues to show high buying pressure in the market. However, it has remained above the 70’s zone for a long time period, indicating a strong bullish presence in the market. c.) Bollinger Bands The Bollinger Band is a technical indicator that consists of a moving average (21-day) along with two trading bands above (upper band) and below it (lower band). The bands are an indication of volatility, which are represented by calculating standard deviation. The benchmark index is hovering close to the upper Bollinger band, signifying over-bought condition in the market. The distance between the upper and lower bands has also diverged significantly as compared to previous weeks, indicating an increase in market volatility.
- 4. 6. Volume Indicator (On-Balance Volume) On-Balance Volume (OBV) is a momentum indicator that relates volume to the current price of the index or security. It measures buying and selling pressure at the market. It acts as a cumulative indicator that adds volume on up days and subtracts volume on down days. If a price increase is supported by OBV, it confirms an uptrend, whereas if a price decrease is supported by OBV, it confirms a downtrend. As evident from the graph above, the On-Balance Volume (OBV) continues to climb up at a faster rate as compared to the climb witnessed by the Nepse index. This increase in the OBV supports the bullish momentum present in the market. The average weekly volume transactions increased to NPR 92.30 crores from NPR 87.58 crores the week prior. 7. Overview The Nepse index climbed further up in the course of last week. The benchmark gained 23.24 points (or up 1.61%) to close at 1464.91, creating a new height. The 50-day and 200-day moving averages continue to climb up along with the benchmark index, indicating that the overall market condition looks good. The macd is climbing up and above the signal line, which supports the optimism present in the market. However, the distance between the lines is gradually converging. The RSI ended at 84.35 level, indicating high buying pressure in the market. The Bollinger bands show buying pressure in the market as the index is hovering close to the upper band. The bands also indicate an increase in the market volatility as the upper and lower bands have diverged significantly. The support and resistance level stands the same at 1390 and 1500 respectively.
- 5. k|fljlwsljZn]if0f !_ahf/ ;f/f+z -a}zfv !^, @)&#;Ddsf]_ aGb cªs -a}zfv !^, @)&#_ !$^$=(! pRr cªs -uPsf] ;ftf_ !$^$=(! ;fKtflxs kl/jt{g @#=@$ -!=^!k|ltzt_ b}lgscf};t Jofkf/ ¿=(@=#)s/f]8 s'n ;fKtflxsJofkf/ ¿ $^!=$( s/f]8 cf/P;cfO{ *$=#% PdP;L8L #$=^* l;UgnnfO{g #@=%# @_ ahf/ k|j[lt Nepse (June 1, 2014 – April 28, 2016)
- 6. #_ 6]«G8 ljZn]if0f uPsf] ;ftf g]K;] kl/;"rsn] km]l/cfkmgf] Oltxf; s} pRr cªsaf6 ug{ k'Uof] . @#=@$cªssf] a[[l4 ;Fu} g]K;] !$^$=(!cªsdfaGbeof] . clxn] klg g]K;] kl/;"rs a9g] s|dhf/L g} /x]sf] cj:yf 5h;n] ahf/dfclxn]klga'lnz 6]«G8df /x]sf] ;+s]t ub{5 . clxn] klgsDkgLx?sf] t];|f] q}dfl;ssf] ljQLoljj/0f k|sfzgx'gfn] klgo;n] ahf/df km]l/ s]xL p5fn NofPsf] b]lvG5 . ;du|dfclxn] klg kl/;"rs %) lbg] d'leËPe/]h tyf @)) lbg] d'leËeGbfdfly g} rln/x]sf] cj:yf ;du|dfahf/sf] l:ylt /fd|f] b]lvG5 . $_ 6]jftyfk|lt/f]w cªs glhssf] 6]jfcªs !#() 6]jfcªs @ !#%) glhssf] k|lt/f]w cªs !%)) clxn] klgglhssf] 6]jfcªs !#() tyfglhssf] k|lt/f]w cªs !%)) /x]sf] cj:yf 5 . g]K;] kl/;"rs a9g] s|ddf /x]sf] x'Fbfahf/n] cfkmgf] glhssf] k|lt/f]w cªs ;d]t kf/ ug{ ;Sg] cj:yfalnof] b]lvG5 . t/ cacfpg] ;ftfeg] kl/;"rsdfeg] s]xL s/]S;geg] b]lvg ;lsG5 . %_ g]K;] 6]«G8 ;"rs s_ d'leª Pe/]hsGeh]{G; 8fOeh]{G; -PdP;L8L_ PdP;L8Ldf b'O{ cf]6f /]vf x'G5g, h;df Pp6fn] ahf/sf] lbzf kl/jt{gsf] ;+s]t u5{ eg] csf]{n] ahf/sf] k|j[lQ -6«]08_ b]vfpg] u5{ . olb PdP;L8L /]vfn] l;Ung /]vfnfO{ tnaf6 dfly sf6]dfo;nfO{ ;sf/fTds ;+s]tsf ?kdflnO{G5 / o;n] z]o/x? lsGg] ;+s]t ub{5 . uPsf] ;ftfsf] z'?df PdP;L8L nfO{gtyfl;UgnnfO{g s|dzM##=$$ tyf @(=$&sf] l:yltdf /x]sf] lyof] / PdP;L8L nfO{g w]/} lbg kl5 km]l/ dflylt/ nDs]sf] cj:yf /xof] h;n] ahf/ km]l/ a'lnz 6]«G8 lt/ nDs]sf] ;+s]t ub{5 . t/ ;ftfsf] cGTolt/ b'O{ nfO{g aLrsf] b'/Ldfeg] s]xLsdLcfPsf] b]lvof] .;ftfsf] cGTodfPdP;L8L nfO{g tyfl;Ugns|dz M #$=^*tyf#@=%# /x]sf] 5 .
- 7. v_ l/n]l6j :6«]Gy OG8]S; -cf/P;cfO{_ cf/P;cfO{ k|fljlwsljZn]if0fsf] o:tf] cf}hf/ xf], h;nfO{ Pstlkm{ ?kdfrln/x]sf] ahf/dfJofkf/ /0fgLlt agfpg a9L pkof]uL dflgG5 . To;}u/L, o;n] ahf/dfvl/b / ljlqmsf] :ki6 ;+s]t b]vfpg] u5{ . cf/P;cfO{uPsf] ;ftfsf] z'?df**=(*cªsdf/x]sf] lyof] . t/ km]l/ ;ftfsf] afFsLlbgx?dfcf/P;cfO{df$=^@cªs a[l4 ;Fu} cf/P;cfO{ *$=#%cªsdfaGbeof] . w]/} nfdf] ;do b]lv &) cªseGbfdfly /x]sf] cf/P;cfO{n] ahf/dfalnof] a'lnz 6]«G8sf] ;+s]t ub{5 . u_ af]lnªu/ Aof08 af]lnªu/ Aof08 Ps k|fljlwsljZn]if0f ;"rsxf] h;df @!–lbg] d'leËPe/]hsf ;fyb'O{ Aof08 -Pp6f dfly_ / Pp6f tn_ x'G5g . lo Aof08x?n] cl:y/tfsf] ;+s]t ub{5g, h'g :6fG88{ 8]leP;g u0fgf u/]/ kQfnufO{G5 . uPsf] ;ftfklgg]K;] kl/;"rskm]l/ pkNnf] Aof08sf] glhsk'u]sf] cj:yf /xof] h;n] km]l/ ahf/dflsGg] xf]8afhL /x]sf] ;+s]t ub{5 . clxn] klgdWo Aof0f8n] ahf/sf] nfluglhssf] 6]jfcªssf] ?kdfsfdul//x]sf] 5 . pkNnf] tyftNnf] Jof08 aLrsf] b'/L clxn] s]xL a9]sf]n]ahf/sf]cl:y/tfdfs]xL a[l4 ePsf] ;+s]t ub{5 .
- 8. ;du{dfM uPsf] ;ftf g]K;] kl/;"rsdf km]l/@#=@$cªssf]] a[l4 b]lvof]h;sf] kmn:j?k kl/;"rsOltxf;pRrlaGb' !$^$=(!cªsdfaGbeof] . clxn] klg kl/;"rs %) lbg] d'leËPe/]h tyf @)) lbg] d'leËeGbfdflyuO{/x]sf] cj:yfn] ahf/ ;sf/fTds l:yltdf g} /x]sf] ;+s]t ub{5 .PdP;L8L nfO{g w]/} lbg kl5 km]l/ dflylt/ nDs]sf] cj:yf /xof] h;n] ahf/ km]l/ a'lnz 6]«G8 lt/ nDs]sf] ;+s]t ub{5 . &) cªseGbfdfly /x]sf] cf/P;cfO{ clxn] km]l/ahf/ lgs} g} cf]e/ a6 l:yltdf /x]sf] ;+s]t ub{5 . af]lnªu/ Aof08n] ;d]t ahf/sf] lsGg] xf]8afhL s]xL a9]sf] ;+s]t ub{5 / b'O{ nfO{g aLr a9g uPsf] b'/Ln] ahf/sf] cl:y/tf s]xL a9]sf] ;+s]t ub{5 . xfnsf] cj:yfdfgofF 6]jfcªstyfk|lt/f]w cªs s||dzM !#() tyf !%)) g} /x]sf] 5 .