Nepse technical analysis oct 08 oct 09, 2014 (eng & nep)
•
0 likes•194 views

Technical analysis of Nepal Stock Exchange (Nepse) index for the week from OCt 08, 2014 to Oct 09, 2014. The technical analysis includes summary, RSI, MACD and Bollinger band analysis. The analysis is done by Kriti Capital & Investments Ltd.

Recommended
Recommended
More Related Content
Viewers also liked
Viewers also liked (9)
Similar to Nepse technical analysis oct 08 oct 09, 2014 (eng & nep)
Similar to Nepse technical analysis oct 08 oct 09, 2014 (eng & nep) (20)
More from Kriti Capital & Investments Ltd.
More from Kriti Capital & Investments Ltd. (20)
Recently uploaded
Recently uploaded (20)
Nepse technical analysis oct 08 oct 09, 2014 (eng & nep)
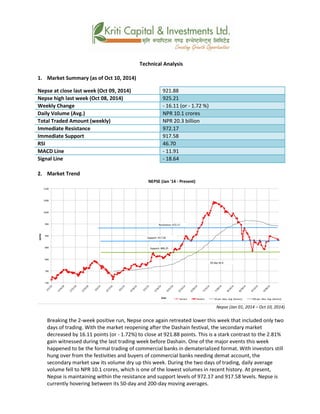
- 1. Technical Analysis 1. Market Summary (as of Oct 10, 2014) Nepse at close last week (Oct 09, 2014) 921.88 Nepse high last week (Oct 08, 2014) 925.21 Weekly Change - 16.11 (or - 1.72 %) Daily Volume (Avg.) NPR 10.1 crores Total Traded Amount (weekly) NPR 20.3 billion Immediate Resistance 972.17 Immediate Support 917.58 RSI 46.70 MACD Line - 11.91 Signal Line - 18.64 2. Market Trend Nepse (Jan 01, 2014 – Oct 10, 2014) Breaking the 2-week positive run, Nepse once again retreated lower this week that included only two days of trading. With the market reopening after the Dashain festival, the secondary market decreased by 16.11 points (or - 1.72%) to close at 921.88 points. This is a stark contrast to the 2.81% gain witnessed during the last trading week before Dashain. One of the major events this week happened to be the formal trading of commercial banks in dematerialized format. With investors still hung over from the festivities and buyers of commercial banks needing demat account, the secondary market saw its volume dry up this week. During the two days of trading, daily average volume fell to NPR 10.1 crores, which is one of the lowest volumes in recent history. At present, Nepse is maintaining within the resistance and support levels of 972.17 and 917.58 levels. Nepse is currently hovering between its 50-day and 200-day moving averages.
- 2. 3. RSI RSI is a form of leading indicator that is believed to be most effective during periods of sideways movement. Such indicators may create numerous buy and sell signals that are useful when the market is not clearly trending upwards or downwards. Though RSI increased to 51.41 levels during the prior week, it could not be sustained as it closed at 46.70 levels this past week. As a result, the RSI is well situated within the neutral zone, as there has been a balance in supply and demand for shares. RSI (Dec 01, 2013 – Oct 10, 2014) 4. MACD The MACD is a momentum oscillator formed by using two different types of moving averages, which provides specific buying or selling signals. When a MACD line crosses above the signal line, it is considered to be a positive sign and indicates a time to buy, and vice-versa. Since the MACD line crossed above the Signal line two trading weeks prior, the MACD line has been clearly diverging away above the Signal line. This represents a near term bullish momentum. By the end of the week, the MACD and Signal lines stood at -11.91 and -18.64 points respectively. MACD (Dec 01, 2013 – Oct 10, 2014) 5. Bollinger Bands The Bollinger Band is a technical indicator that consists of a moving average (21-day) along with two trading bands above (upper band) and below it (lower band). The bands are an indication of volatility, which are represented by calculating standard deviation. The Nepse line crossed above the mid-band the week before Dashain festival indicating a buy signal. However, it gradually began sloping downwards towards the mid-band. The converging of the upper and lower bands also indicates decreasing volatility in the market in recent times.
- 3. Bollinger Bands (Dec 01, 2013 – Oct 10, 2014) Overview: Though Nepse began stabilizing during the last two trading weeks before the Dashain festival, the secondary market could sustain the positive momentum. This past week, which only consisted of two days of trading, saw Nepse fall to 921.88 points, a decline of 16.11 points (or - 1.72%). There was a significant drop in volume during the week as investors remained cautious regarding trading of demat shares. As a result, the daily average volume fell to NPR 10.1 crores. Nepse is currently hovering between its nearest support and resistance levels of 917.58 and 972.17 points. The RSI fell this week as it closed slightly below the centerline at 46.70 levels. The MACD indicator shows that the near term momentum in the market has been on an upward trend in the last two weeks. The Bollinger Bands show decreasing volatility in the market as the market appears to be trending sideways. The various market indicators show that the secondary market has been stabilizing in recent times.
- 4. k|fljlws ljZn]if0f ahf/ ;f/f+z -cflZjg !( b]vL cflZjg @# ;Ddsf]_ aGb cªs -cflZjg @#_ M (@!=** pRr cªs -cflZjg @@_ M (@%=@! ;fKtflxs kl/jt{g M –!^=!! cªs -–!=&@ k|ltzt_ b}lgs cf};t Jofkf/ M ¿= !)=!) s/f]8 s'n ;fKtflxs Jofkf/ M ¿= @) ca{ # s/f]8 tTsflng 6]jf M (&@=!& tTsflng k|lt/f]w M (!&=%* cf/P;cfO{ M $^=&) PdP;L8L M –!!=(! l;Ugn nfO{g M –!*=^$ %) tyf @)) lbg] d'leª Pe/]h cl3Nnf] b'O{ xKtfb]lvsf] ;sf/fTds bf}8 tf]8b}, hDdf b'O{ lbg sf/f]af/ ePsf] o; ;ftf g]K;] k'gM 36]sf] 5 . bz}F kl5 v'n]sf] ahf/ !^=!! cªs -jf !=&@ k|ltzt_ n] 36]/ (@!=** cªsdf k'u]sf] 5 . of] bz}F cl3sf] clGtd sf/f]af/ xKtfdf b]lvPsf] @=*! k|ltztsf] nfe eGbf Psbd ljk/Lt xf] . o; xKtf cfPsf] Ps k|d'v 36gf eg]sf] jfl0fHo a}Fs cef}lts z]o/ sf/f]af/ ;'?jft xf] . nufgLstf{x? ce}m klg kj{df /x]sf] / jfl0fHo a}Fssf vl/bstf{x?n] cef}lts vftf vf]Ng' kg]{ x'gfn] o; ;ftf Jofkf/ -ef]No"d_ df 7"nf] lu/fj6 b]lvPsf] xf] . b'O{ sf/f]af/ lbgx?df, b}lgs cf}ift Jofkf/ -ef]No"d_ !)=! s/f]8 ?k}Fof /x]sf] lyof] h'g xfnsf] ;dodf ;a} eGbf sd Jofkf/ -ef]No"d_ xf] . xfnsf] ;dodf, g]K;] (&@=!& cªssf] k|lt/f]w tx / (!&=%* cªssf] ;dy{g tx lar /x]sf] 5 . xfn g]K;] %)–lbg] d'leË / @))–lbg] d'leË Pe/]h lar /x]sf] 5 . Nepse (Jan 01, 2014 – October 10, 2014)
- 5. l/n]l6j :6«]Gy OG8]S; -cf/P;cfO{_ cf/P;cfO{ k|fljlws ljZn]if0fsf] o:tf] cf}hf/ xf], h;nfO{ Pstlkm{ ?kdf rln/x]sf] ahf/df Jofkf/ /0fgLlt agfpg a9L pkof]uL dflgG5 . To;}u/L, o;n] ahf/df vl/b / ljlqmsf] :ki6 ;+s]t b]vfpg] u5{ . cl3Nnf] xKtf %!=$! cªsdf k'u]sf] cf/P;cfO{ o; ;ftf 36]/ $^=&) cªsdf k'u]sf] 5 . kmn:j?k, z]o/sf] dfu / cfk'tL{ ;Gt'lnt /x]sfn] cf/P;cfO{ t6:y If]qdf /x]sf] 5 . RSI (Jan 01, 2013 – October 10, 2014) d'leª Pe/]h sGeh]{G; 8fOeh]{G; -PdP;L8L_ PdP;L8Ldf b'O{ cf]6f /]vf x'G5g, h;df Pp6fn] ahf/sf] lbzf kl/jt{gsf] ;+s]t u5{ eg] csf]{n] ahf/sf] k|j[lQ -6«]08_ b]vfpg] u5{ . olb PdP;L8L /]vfn] l;Ung /]vfnfO{ tnaf6 dfly sf6]df o;nfO{ ;sf/fTds ;+s]tsf ?kdf lnO{G5 / o;n] z]o/x? lsGg] ;+s]t ub{5 . b'O{ xKtf cl3 PdP;L8L /]vfn] l;Ugn /]vfn] kf/ u/] b]lv PdP;L8L /]vf l;Ugn /]vf af6 6f9f uO{/x]sf] 5 . o;n] lgs6 eljiodf a'ln; k|j[ltsf] ;+s]t u/]sf] 5 . xKtfsf] cGTo;Dd, PdP;L8L /]vf / l;Ugn /]vf s|dzM –!!=(! / –!*=^$ cªsdf /x]sf] 5 . MACD (Jan 01, 2013 – October 10, 2014) af]lnªu/ Aof08 af]lnªu/ Aof08 Ps k|fljlws ljZn]if0f ;"rs xf] h;df @!–lbg] d'leË Pe/]hsf ;fy b'O{ Aof08 -Pp6f dfly_ / Pp6f tn_ x'G5g . lo Aof08x?n] cl:y/tfsf] ;+s]t ub{5g, h'g :6fG88{ 8]leP;g u0fgf u/]/ kQf nufO{G5 . bz}Fsf] Ps xKtf cl3 g]K;]n] dWo Aof08 kf/ u/]sf] lyof] . t/, g]K;] lj:tf/} dWo Aof08af6 emg{ yfn]sf] 5 . dflyNnf] / tNnf] Aof08 lar 36bf] b'/Ln] xfn ahf/df cl:y/tf 36]sf] 5 .
- 6. Bollinger Bands (Jan 01, 2013 – October 10, 2014) ;du{dfM bz}F cl3sf] b'O{ sf/f]af/ xKtf g]K;] l:y/ /x]tf klg, o; ;ftf bf];|f] ahf/df of] ;sf/fTds ult wfGg ;s]g . b'O{ lbg dfq sf/f]af/ ePsf] o; xKtf g]K;] !^=!! cªs -jf !=&@ k|ltzt_ n] 36]/ (@!=** cªsdf aGb ePsf] 5 . o; xKtf nufgLstf{x? cef}lts z]o/ sf/f]af/ k|lt ;hu /x]sfn] Jofkf/ -ef]No"d_ df lu/fj6 cfPsf] 5 . kmn:j?k, b}lgs cf}ift Jofkf/ !)=! s/f]8 ?k}Fofdf em/]sf] 5 . xfnsf] ;dodf, g]K;] (&@=!& cªssf] k|lt/f]w tx / (!&=%* cªssf] ;dy{g tx lar /x]sf] 5 . cf/P;cfO{ dWo /]vfaf6 yf]/} 36]/ $^=&) cªsdf k'u]sf] 5 . PdP;L8L ;"rsn] ahf/sf] lgs6 eljiosf] k|j[lt ut b'O{ ;ftfb]lv a9g] lbzfdf /x]sf] ;+s]t u/]sf] 5 . ahf/ t];f]{ g} /x]sfn] af]lnªu/ Aof08n] ahf/df cl:y/tf sd /x]sf] b]vfpF5 . ;du|df, ljleGg ;"rsx?n] ahf/ xfnsf] ;dodf l:y/ /x]sf] b]vfpF5 .