Nepse Technical Analysis 14 June - 18 June, 2015
•
0 likes•262 views

Nepse Weekly Technical Analysis 14 June - 18 June, 2015

Recommended
Recommended
More Related Content
Viewers also liked
Similar to Nepse Technical Analysis 14 June - 18 June, 2015
Similar to Nepse Technical Analysis 14 June - 18 June, 2015 (20)
More from Kriti Capital & Investments Ltd.
More from Kriti Capital & Investments Ltd. (20)
Recently uploaded
Recently uploaded (20)
Nepse Technical Analysis 14 June - 18 June, 2015
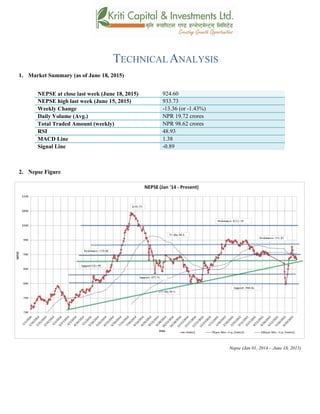
- 1. TECHNICAL ANALYSIS 1. Market Summary (as of June 18, 2015) NEPSE at close last week (June 18, 2015) 924.60 NEPSE high last week (June 15, 2015) 933.73 Weekly Change -13.36 (or -1.43%) Daily Volume (Avg.) NPR 19.72 crores Total Traded Amount (weekly) NPR 98.62 crores RSI 48.93 MACD Line 1.38 Signal Line -0.89 2. Nepse Figure Nepse (Jan 01, 2014 – June 18, 2015)
- 2. 3. Trend Analysis Nepse at the beginning of last week closed at 928.35. By the end of the week, it had made corrections by small margin to end at 924.60. Nepse moved along with 180 moving average (MA) for the majority orf last week, signifying that the 180 MA remains supportive to Nepse’s trend and acting as an immediate support level. Although Nepse fell most of this week due to various corrections, it is still at an up-trend momentum. 4. Resistance and Support Immediate Support 919 Support 2 910 Immediate Resistance 938 Resistance 2 972 If Nepse’s downfall continues and falls below support level of 919 on the historical price level, its next trend line support stands at 910. However, believing that the current downfall is due to various trend corrections, Nepse might possibly bounce back and cross over its immediate support level, in which case its next resistance level stands at 972. 5. Nepse Trend Indicator a.) Moving Average 180 days moving average works as an immediate support to the Nepse’s trend. Last week, 5-day moving average crossed below 180-days moving average on the last day of trading. However, the 5-days moving average closed above 20- days moving average, indicating that Nepse is still on short term bullish trend. However, 5-days MA cross down below 20-days MA could reverse the bullish trend to a bearish one. b.) MACD
- 3. The MACD is a momentum oscillator formed by using two different types of moving averages, which provides specific buying or selling signals. When a MACD line crosses above the signal line, it is considered to be a positive sign and indicates a time to buy, and vice-versa. The Macd line stands at a positive territory and above the signal line, indicating a bullish trend. By the end of last week, the Macd line fell down closer to zero-levels. However, until it makes a crossover below the signal line, there are chances of it bouncing up again. The Macd and the signal lines, last week, stood at 1.38 and -0.83 respectively. c.) RSI RSI is a form of leading indicator that is believed to be most effective during periods of sideways movement. Such indicators may create numerous buy and sell signals that are useful when the market is not clearly trending upwards or downwards. There is a positive divergence between Nepse index and RSI level. After making higher high of 64 level, the RSI fell back to 48.94 levels. By examining RSI’s historic data, the RSI seems to be at an up-trend in the short-run, where as in the long-run, it could follow a down-trend. d.) Bollinger Bands The Bollinger Band is a technical indicator that consists of a moving average (21-day) along with two trading bands above (upper band) and below it (lower band). The bands are an indication of volatility, which are represented by calculating standard deviation.
- 4. The benchmark index continued to decline last week. However, the index closed above the mid-bollinger band, signifying a possible bullish trend. This bullish momentum would reverse if the index drops below the mid-band. The gap between the upper and lower Bollinger bands remains wide, indicating huge market volatility. 6. Volume Indicator (On-Balance Volume) On-Balance Volume (OBV) measures buying and selling pressure at the market. It acts as a cumulative indicator that adds volume on up days and subtracts volume on down days. Volume pressure remains positive this week, considering that Nepse declined more than the OBV indicator. The average weekly volume transaction came down to 19.72 crores from 32.42 crores the week prior. This shows that Nepse’s decrease last week is not entirely due to profit booking in the market, in which case the index would fall even more and the volume should rise immensely. Last week, Nepse gained 5.23 points on Monday and volume was 22.10 crores, which is greater than the week’s average of 19.72 crores. Hence, the volume indicator gives a positive view of the market. 7. Overview The Nepse index declined most of last week. Closing at 924.60, the index lost -13.36 points (or -1.43%). The 50-day moving average is still moving below the 200-day moving average. This shows that the overall outlook of the market does not look good. However, this short term view of the market is likely due to various Nepse corrections. The average daily market volume fell to NPR 19.72 crores from NPR 32.42 crores the
- 5. week prior. The RSI still stands at a neutral position, ending at 48.93 level. The Macd line is above the signal line and at a positive zone, indicating a bullish trend. However, the Macd line bounced back on the last trading day, which could follow a down trend. Furthermore, the index is still between the middle and upper Bollinger bands, suggesting a bullish momentum. The immediate support and resistance level still stands at 919 and 938 respectively.
- 6. k|fljlwsljZn]if0f !_ahf/ ;f/f+z -cfiff9 #, @)&@ ;Ddsf]_ aGb cªs -cfiff9#, @)&@_ (@$=^) pRr cªs -uPsf] ;ftf_ (##=&# ;fKtflxs kl/jt{g –!#=#^ -–!=$#k|ltzt_ b}lgscf};t Jofkf/ ¿=!(=&@s/f]8 s'n ;fKtflxsJofkf/ ¿=(*=^@ s/f]8 cf/P;cfO{ $*=(# PdP;L8L !=#* l;UgnnfO{g –)=*( @_ ahf/ k|j[lt Nepse (Jan 01, 2014 – June 18, 2015)
- 7. #_ 6]«G8 ljZn]if0f uPsf] ;ftfeGbf cl3Nnf] ;ftf (@*=#%cªsdfaGbePsf] g]K;] kl/;"rsuPsf] ;ftf s]xL 36g uO{ (@$=^) cªsdf /xguof] . g]K;] kl/;"rsuPsf] ;ftf w]/}h;f] !*) lbg] d'leËPe/]h ;+u ;+u} lx8]sf] cj:yf /xof] h;n] !*) lbg]d'leËPe/]hn]xfn g]K;] kl/;"rssf 6]«G8nfO{ ;fylbO{/x]sf] cj:yf b]lvof] / ;+u ;+u} glhsf] 6]jfcªssf] ?kdf ;d]t sfd u/of] . uPsf] ;ftf kl/;"rs s]xLdfqfdf 36]sf] ePklgahf/dfcem} ck–6]«G8 /x]sf] ;+s]t /xof] . $_ 6]jftyfk|lt/f]w cªs glhssf] 6]jfcªs (!( 6]jfcªs @ (!) glhssf] k|lt/f]w cªs (#* k|lt/f]w cªs @ (&@ %_ g]K;] 6]«G8 ;"rs s_ d'leËPe/]h !*) d'leËPe/]hn] glhssf] 6]jfcªssf] ?kdfsfd u/]sf] 5 . uPsf] ;ftf % lbg] d'leËPe/]h nfO{gn] !*) lbg] d'leËPe/]hnfO{gnfO{ sf/f]af/ lbgsf] clGtdlbg s|; ul/ !*) lbg] d'leËPe/]hnfO{geGbftnem/]sf] 5 . t/ % lbg] d'leËPe/]h nfO{gcem} @) lbg] d'leËPe/]h nfO{g eGbfdfly g} /x]sf] cj:yfn] ahf/df5f]6f]
- 8. cjlwsf] nflua'ln; 6]«G8d} /x]sf] ;+s]t ub{5 . t/ % lbg] d'leËPe/]h nfO{gn] @) lbg] d'leËPe/]h nfO{gnfO{ sf6L tnem/]dfo;n] ahf/dflaol/; 6«]G8sf] ;+s]t ug]{5 . v_ d'leª Pe/]hsGeh]{G; 8fOeh]{G; -PdP;L8L_ PdP;L8Ldf b'O{ cf]6f /]vf x'G5g, h;df Pp6fn] ahf/sf] lbzf kl/jt{gsf] ;+s]t u5{ eg] csf]{n] ahf/sf] k|j[lQ -6«]08_ b]vfpg] u5{ . olb PdP;L8L /]vfn] l;Ung /]vfnfO{ tnaf6 dfly sf6]dfo;nfO{ ;sf/fTds ;+s]tsf ?kdflnO{G5 / o;n] z]o/x? lsGg] ;+s]t ub{5 . PdP;L8L nfO{gxfn C0ffTds If]qnfO{ 5f8L ;sf/fTds If]qdf /x]sf] cj:yfn] ahf/ a'ln; 6«]G8df /x]sf] ;+s]t ub{5 . t/ uPsf] ;ftfsf] cGTolt/ PdP;L8L nfO{gtnemg{ uO{ z"Go n]ensf] glhsk'Uguof] . l;UgnnfO{gnfO{ sf6L tn gem/] ;DdPdP;L8L nfO{gcem} dflyhfg ;Sg] ;+Defjgf /x]sf] 5 . PdP;L8L nfO{guPsf] ;ftf !=#* tyfl;UngnfO{g –)=*# df /xguof] . u_ l/n]l6j :6«]Gy OG8]S; -cf/P;cfO{_ cf/P;cfO{ k|fljlwsljZn]if0fsf] o:tf] cf}hf/ xf], h;nfO{ Pstlkm{ ?kdfrln/x]sf] ahf/dfJofkf/ /0fgLlt agfpg a9L pkof]uL dflgG5 . To;}u/L, o;n] ahf/dfvl/b / ljlqmsf] :ki6 ;+s]t b]vfpg] u5{ . g]K;] kl/;"rstyfcf/P;cfO{ n]endf ;sf/fTds 8fO{e/h]G; /x]sf] 5 . ^$=@@ cªssf] n]ennfO{ 5'g k'u]sf] cf/P;cfO{ $*=($ n]endfk'u]sf] 5 . 5f]6f] cjlwsf] nfluck–6]«G8df /x]sf] cf/P;cfO{n] bL3{sflngcj:yfdf 8fpg–6]«G8 k5ofpg ;Sg] cj:yf /x]sf] 5.
- 9. 3_ af]lnªu/ Aof08 af]lnªu/ Aof08 Ps k|fljlwsljZn]if0f ;"rsxf] h;df @!–lbg] d'leËPe/]hsf ;fyb'O{ Aof08 -Pp6f dfly_ / Pp6f tn_ x'G5g . lo Aof08x?n] cl:y/tfsf] ;+s]t ub{5g, h'g :6fG88{ 8]leP;g u0fgf u/]/ kQfnufO{G5 . g]K;] kl/;"rsuPsf] ;ftfklgtn g} emg]{ 6]«G8 /xof] t/ kl/;"rsdWo Jof08 eGbfdfly g} /x]sf] cj:Yffn] ahf/dfxfna'ln; 6]«G8 g} /x]sf] ;+s]t ub{5 . g]K;] kl/;"rsdWo Jof08 tnem/]dfo;n] ahf/sf] a'ln; cj:yf ;dfKteO{ laol/; cj:yfsf] ;+s]t ub{5 . pkNnf] tyftNnf] Aof08sf] b'/Ln] cem} klgahf/dfcl:yt/tfsfod /x]sf] ;+s]t ub{5 . ^_ eNo'd ;'rs -cg–Aofn]G; eNo'd_ cg–Aofn]G; eNo'd n] ahf/dflsGg] tyf a]Rg] k|];/sf] ;+s]t ub{5 . ;d|udf of] ;"rsn] ahf/ dflyuPsf] cj:yftyftnem/]sf] cj:yfdfahf/dfsf/f]af/sf] eNo'd s:tf] /xof] ;+s]t ub{5 .
- 10. sf/f]af/ /sdsf] eNo'duPsf] ;ftf g]K;] kl/;"rstnem/]tfklg ;sf/fTds g} /xof] . cf};t sf/f]af/ /sduPsf] ;ftf !(=&@ s/f]8 /xof] h'g cl3Nnf] ;ftf #@=$@ s/f]8 /x]sf] lyof] / ;f] ;"rsn] g]K;]dfgfkmfd'vLsf/f]af/x? sdePsf] ;+s]t ub{5 . gfkmfd'vLsf/f]af/x? a9L ePsf] cj:yfdfcf};t sf/f]af/ /sd a9L x'g] u/]sf] 5 . uPsf] ;ftfsf] eNo'd ;"rsn] ahf/ cem} ;sf/fTds /x]sf] ;+s]t ub{5 . ;du{dfM uPsf] ;ftf g]K;] kl/;"rs w]/}h;f] sf/f]af/ lbgtn g} 36g uof] . cl3Nnf] ;ftfeGbf –!#=#^ cªsu'dfPsf] kl/;"rs (@$=^) cªsdf ;dfKteof] . %)–lbg] d'leËPe/]hxfn@))–lbg] d'leËPe/]heGbftn /x]sf] cj:yfn] ahf/dfcl:y/tfcem} sfod /x]sf] ;+s]t ub{5 . 5f]6f] cjlwsf] nflueg] ahf/df s]xL ;'wf/ b]lvPsf] 5 . cf};t sf/f]af/ /sd ;d]t uPsf] ;ftf 36g uO{ !(=&@ s/f]8 /xguof] hf] ;f] eGbf cl3Nnf] #@=$@ s/f]8 /x]sf] lyof] . $*=(#cªsdf /x]sf] cf/P;cfO{ xfn Go"6«n cj:yfdf /x]sf] 5 .z"GonfO{g eGbfdfly r9]sf] PdP;L8LnfO{gn] ahf/dfa'ln; 6«]G8 /x]sf] ;+s]t ub{5 .pkNnf] tyftNnf] af]lnªu/ Jof08 aLrsf] b'/Ln] ahf/dfcem} lgs} g} cl:y/tf /x]sf] ;+s]t ub{5 . uPsf] ;ftfklg6]jfcªs (!(=** cªs /xguPsf] 5 / k|lt/f]w cªs (#*=$! /x]sf] 5 .