This document discusses key geographical skills and investigation techniques including:
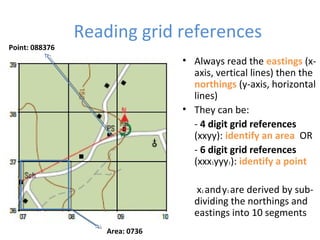
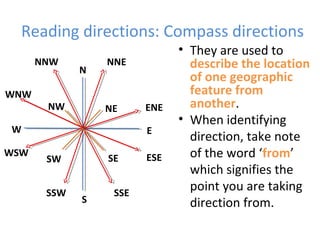
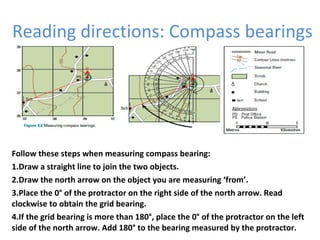
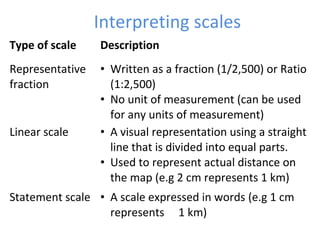
- Reading topographical maps such as grid references, directions, and scales
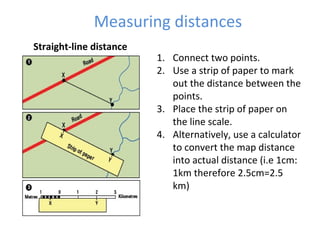
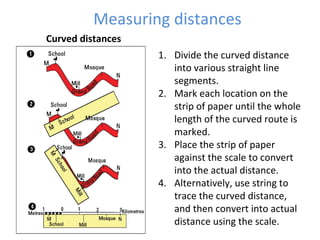
- Measuring distances on maps using straight or curved routes
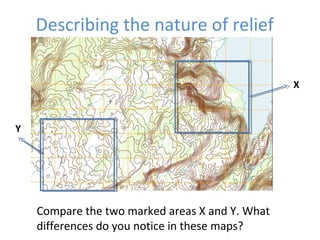
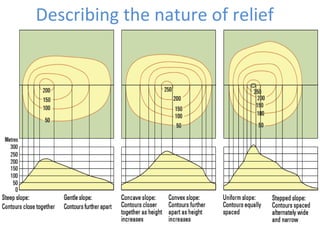
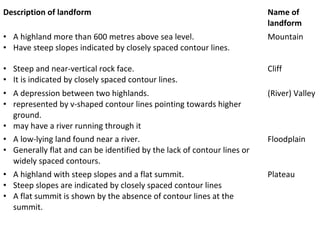
- Interpreting landforms and relief using contour lines and describing features like mountains, valleys, and plateaus
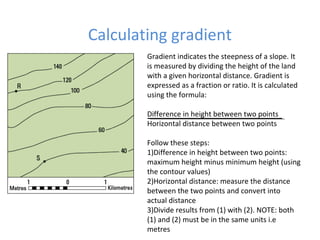
- Calculating gradients to determine the steepness of slopes
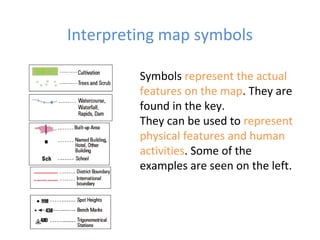
- Interpreting map symbols to understand physical and human features
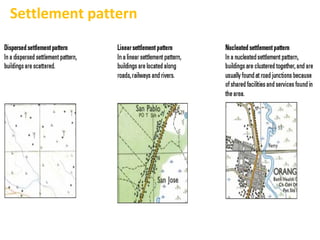
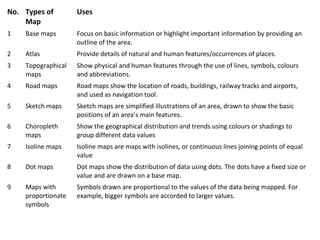
- Analyzing settlement patterns and different types of maps
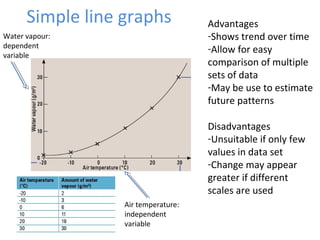
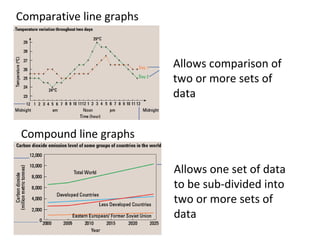
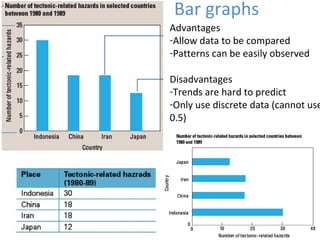
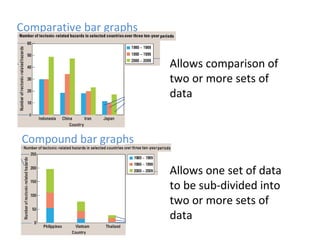
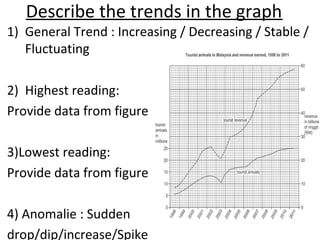
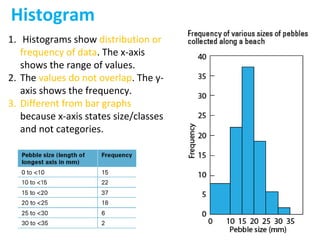
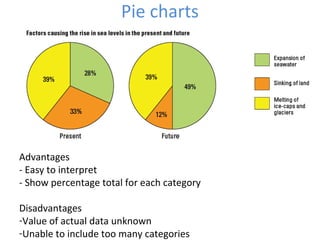
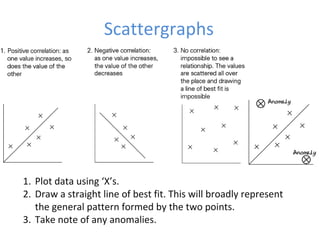
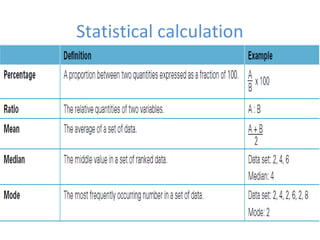
- Constructing and interpreting graphs like line graphs, bar graphs, histograms and scatterplots to visualize geographical data
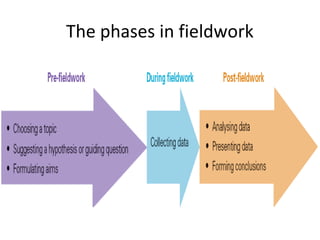
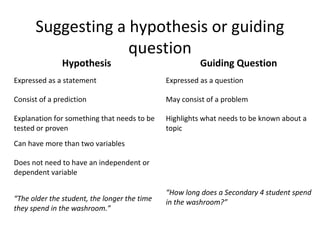
- Following the phases of fieldwork which include forming hypotheses or questions, collecting data, analyzing results and drawing conclusions