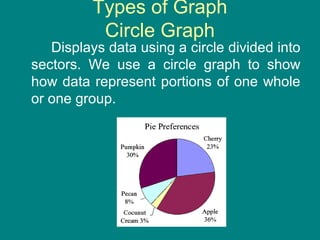
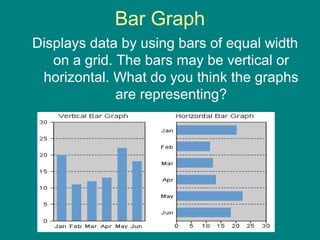
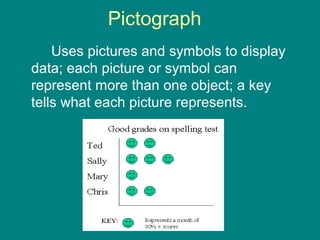
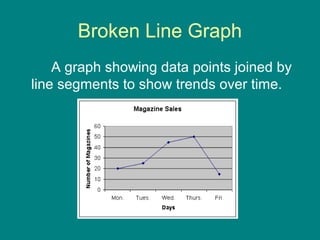
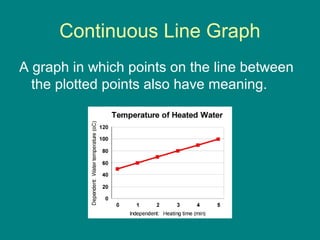
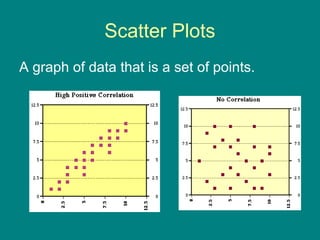
CAMPION SCHOOL BHAURI
Presentation on
Graphs
Submitted to Submitted by
What is Graph
Two-dimensional drawing showing a relationship (usually
between two set of numbers) by means of a line, curve, a series of
bars, or other symbols. Typically, an independent variable is
represented on the horizontal line (X-axis) and an dependent variable
on the vertical line (Y-axis). The perpendicular axis intersect at a point
called origin, and are calibrated in the units of the quantities
represented. Though a graph usually has four quadrants representing
the positive and negative values of the variables, usually only the
north-east quadrant is shown when the negative values do not exist or
are of no interest.
Types of Graph
Circle Graph
Displays data using a circle divided into
sectors. We use a circle graph to show
how data represent portions of one whole
or one group.
Bar Graph
Displays data by using bars of equal width
on a grid. The bars may be vertical or
horizontal. What do you think the graphs
are representing?
Pictograph
Uses pictures and symbols to display
data; each picture or symbol can
represent more than one object; a key
tells what each picture represents.
Broken Line Graph
A graph showing data points joined by
line segments to show trends over time.
Continuous Line Graph
A graph in which points on the line between
the plotted points also have meaning.
Scatter Plots
A graph of data that is a set of points.

Graph ppt

  • 1.
    CAMPION SCHOOL BHAURI Presentationon Graphs Submitted to Submitted by
  • 2.
    What is Graph Two-dimensionaldrawing showing a relationship (usually between two set of numbers) by means of a line, curve, a series of bars, or other symbols. Typically, an independent variable is represented on the horizontal line (X-axis) and an dependent variable on the vertical line (Y-axis). The perpendicular axis intersect at a point called origin, and are calibrated in the units of the quantities represented. Though a graph usually has four quadrants representing the positive and negative values of the variables, usually only the north-east quadrant is shown when the negative values do not exist or are of no interest.
  • 3.
    Types of Graph CircleGraph Displays data using a circle divided into sectors. We use a circle graph to show how data represent portions of one whole or one group.
  • 4.
    Bar Graph Displays databy using bars of equal width on a grid. The bars may be vertical or horizontal. What do you think the graphs are representing?
  • 5.
    Pictograph Uses pictures andsymbols to display data; each picture or symbol can represent more than one object; a key tells what each picture represents.
  • 6.
    Broken Line Graph Agraph showing data points joined by line segments to show trends over time.
  • 7.
    Continuous Line Graph Agraph in which points on the line between the plotted points also have meaning.
  • 8.
    Scatter Plots A graphof data that is a set of points.