
Recommended
More Related Content
What's hot
What's hot (20)
Viewers also liked
Viewers also liked (20)
Similar to LS GE Slides - Map Reading
Similar to LS GE Slides - Map Reading (20)
More from LEEENNA
More from LEEENNA (20)
Recently uploaded
Recently uploaded (20)
LS GE Slides - Map Reading
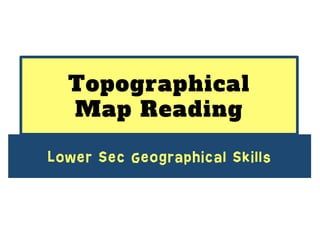
- 1. Topographical Map Reading Lower Sec Geographical Skills
- 2. 1) Map • A representation of an area of land or sea in the form of a diagram. • We often refer to maps when we travel or when we are finding our way to places.
- 3. 1) Map • It can show boundaries between countries, physical features, elevation, cities, roads, climates, economic activities etc.
- 4. 1) Map • It can show boundaries between countries, physical features, elevation, cities, roads, climates, economic activities etc.
- 5. 1) Map • It can show boundaries between countries, physical features, elevation, cities, roads, climates, economic activities etc.
- 6. 1) Map Is a globe a map? • Yes! Globes are some of the most accurate maps that exist.
- 8. Notice any differences? (Commonly used)
- 9. Area accurate Peters Projection Map overlaid with commonly used Mercator Projection Map Mercator Map Peters Map
- 10. 2) Map Symbols Used to represent physical & human features in an area.
- 11. 2) Map Symbols • The legend: contains symbols to help us locate features on the map.
- 12. 3) Compass • An instrument containing a magnetized pointer that shows the direction of the magnetic north & bearings from it.
- 13. 3) Compass (i. Compass Direction) • There are four compass points (cardinal points): North (N), South (S), East (E) & West (W) • If the north line or compass rose is not given on the map, assume that north is towards the top of the map.
- 14. 3) Compass (i. Compass Direction) • Can be further divided into eight compass points (intercardinal / ordinal points).
- 15. 3) Compass (i. Compass Direction) • A 16-point compass rose (secondary intercardinal points):
- 16. 3) Compass (ii. Compass Bearing) • The compass direction between two points measured in degrees. ( ˚) ( ˚) ( ˚) ( ˚) ( ˚) ( ˚) ( ˚) ( ˚)
- 17. 3) Compass (ii. Compass Bearing) • Find the compass bearing of the nearest hospital from your current location. Step 1: Draw compass rose on current location. Your current location Nearest hospital N
- 18. 3) Compass (ii. Compass Bearing) • Find the compass bearing of the nearest hospital from your current location. Step 2: Join both locations with a straight line. Your current location Nearest hospital N
- 19. 3) Compass (ii. Compass Bearing) • Find the compass bearing of the nearest hospital from your current location. Step 3: Measure clockwise starting from the north arrow. Your current location Nearest hospital N
- 20. 3) Compass (ii. Compass Bearing) • Find the compass bearing of the nearest hospital from your current location. Step 3: Measure clockwise starting from the north arrow. Your current location Nearest hospital N 180˚
- 21. 3) Compass (ii. Compass Bearing) • Find the compass bearing of the nearest hospital from your current location. Step 3: Measure clockwise starting from the north arrow. Your current location Nearest hospital N Ans: 180˚ + 72˚ = 252˚ 180˚
- 22. 3) Compass (ii. Compass Bearing) • Modern instruments:
- 23. 4) Contour Lines • Lines drawn on maps connecting points of equal elevation (ie. equal heights).
- 24. 4) Contour Lines When contour lines are far apart, it means that the height of land changes very li<le over a short distance. This indicates a gentler slope. When contour lines are close together, it means that height of land changes a lot over a short distance. This indicates a steep slope.
- 25. 4) Contour Lines
- 26. 5) Scale • All maps show things smaller than they are in real life. • Maps are drawn to scale for accuracy. Ratio scale Linear scale
- 27. 5) Scale (i. Ratio scale) 1 : 25 000 means that 1 cm on the map represents 25 000 cm on the actual ground. Ratio scale 1 : 25000 1 cm (on map) : 25000 cm (actual ground) ÷ 100 1 cm (on map) : 250 m (actual ground) ÷ 1000 1 cm (on map) : 0.25 km (actual ground)
- 28. 5) Scale (ii. Linear scale) A distance of 3 cm on the map represents 1 km on the actual ground. Linear scale
- 29. 6) Grid Reference • Vertical grid lines are called eastings because their values increase eastwards.
- 30. 6) Grid Reference • Horizontal grid lines are called Northings because their values increase northwards.
- 31. 6) Grid Reference (i. 4 Figure grid) • Used to identify the general location of a feature on a map.
- 32. 6) Grid Reference (i. 4 Figure grid) Find the 4 figure grid reference of Lake Cedric. Step 1: Find the grid where Lake Cedric is located in. Step 1
- 33. 6) Grid Reference (i. 4 Figure grid) Find the 4 figure grid reference of Lake Cedric. Step 2: Extend the lines on the Left-bottom corner. Step 2
- 34. 6) Grid Reference (i. 4 Figure grid) Find the 4 figure grid reference of Lake Cedric. Step 3: Write down the easting first, followed by the northing. Ans: 2 1 3 9
- 35. 6) Grid Reference (ii. 6 Figure grid) • Gives a more specific location of a feature on a map.
- 36. 6) Grid Reference (ii. 6 Figure grid) Find the 6 figure grid reference of Bob’s Boathouse. Step 1: Find the grid where Bob’s Boathouse is located in. Step 1
- 37. 6) Grid Reference (ii. 6 Figure grid) Find the 6 figure grid reference of Bob’s Boathouse. Step 2: Extend the lines on the Left-bottom corner. Step 2
- 38. 6) Grid Reference (ii. 6 Figure grid) Find the 6 figure grid reference of Bob’s Boathouse. Step 3: Write down the 4 figure grid reference. Step 2 2 1 __ 3 8 __
- 39. 6) Grid Reference (ii. 6 Figure grid) Find the 6 figure grid reference of Bob’s Boathouse. Step 4: Divide the length & breadth of the grid into 10 equal parts. Step 2 2 1 __ 3 8 __
- 40. 6) Grid Reference (ii. 6 Figure grid) Find the 6 figure grid reference of Bob’s Boathouse. Step 5: Count the grid line. Fill in the blank with the line number. Step 2 2 1 __ 3 8 __ 7 4 4 7