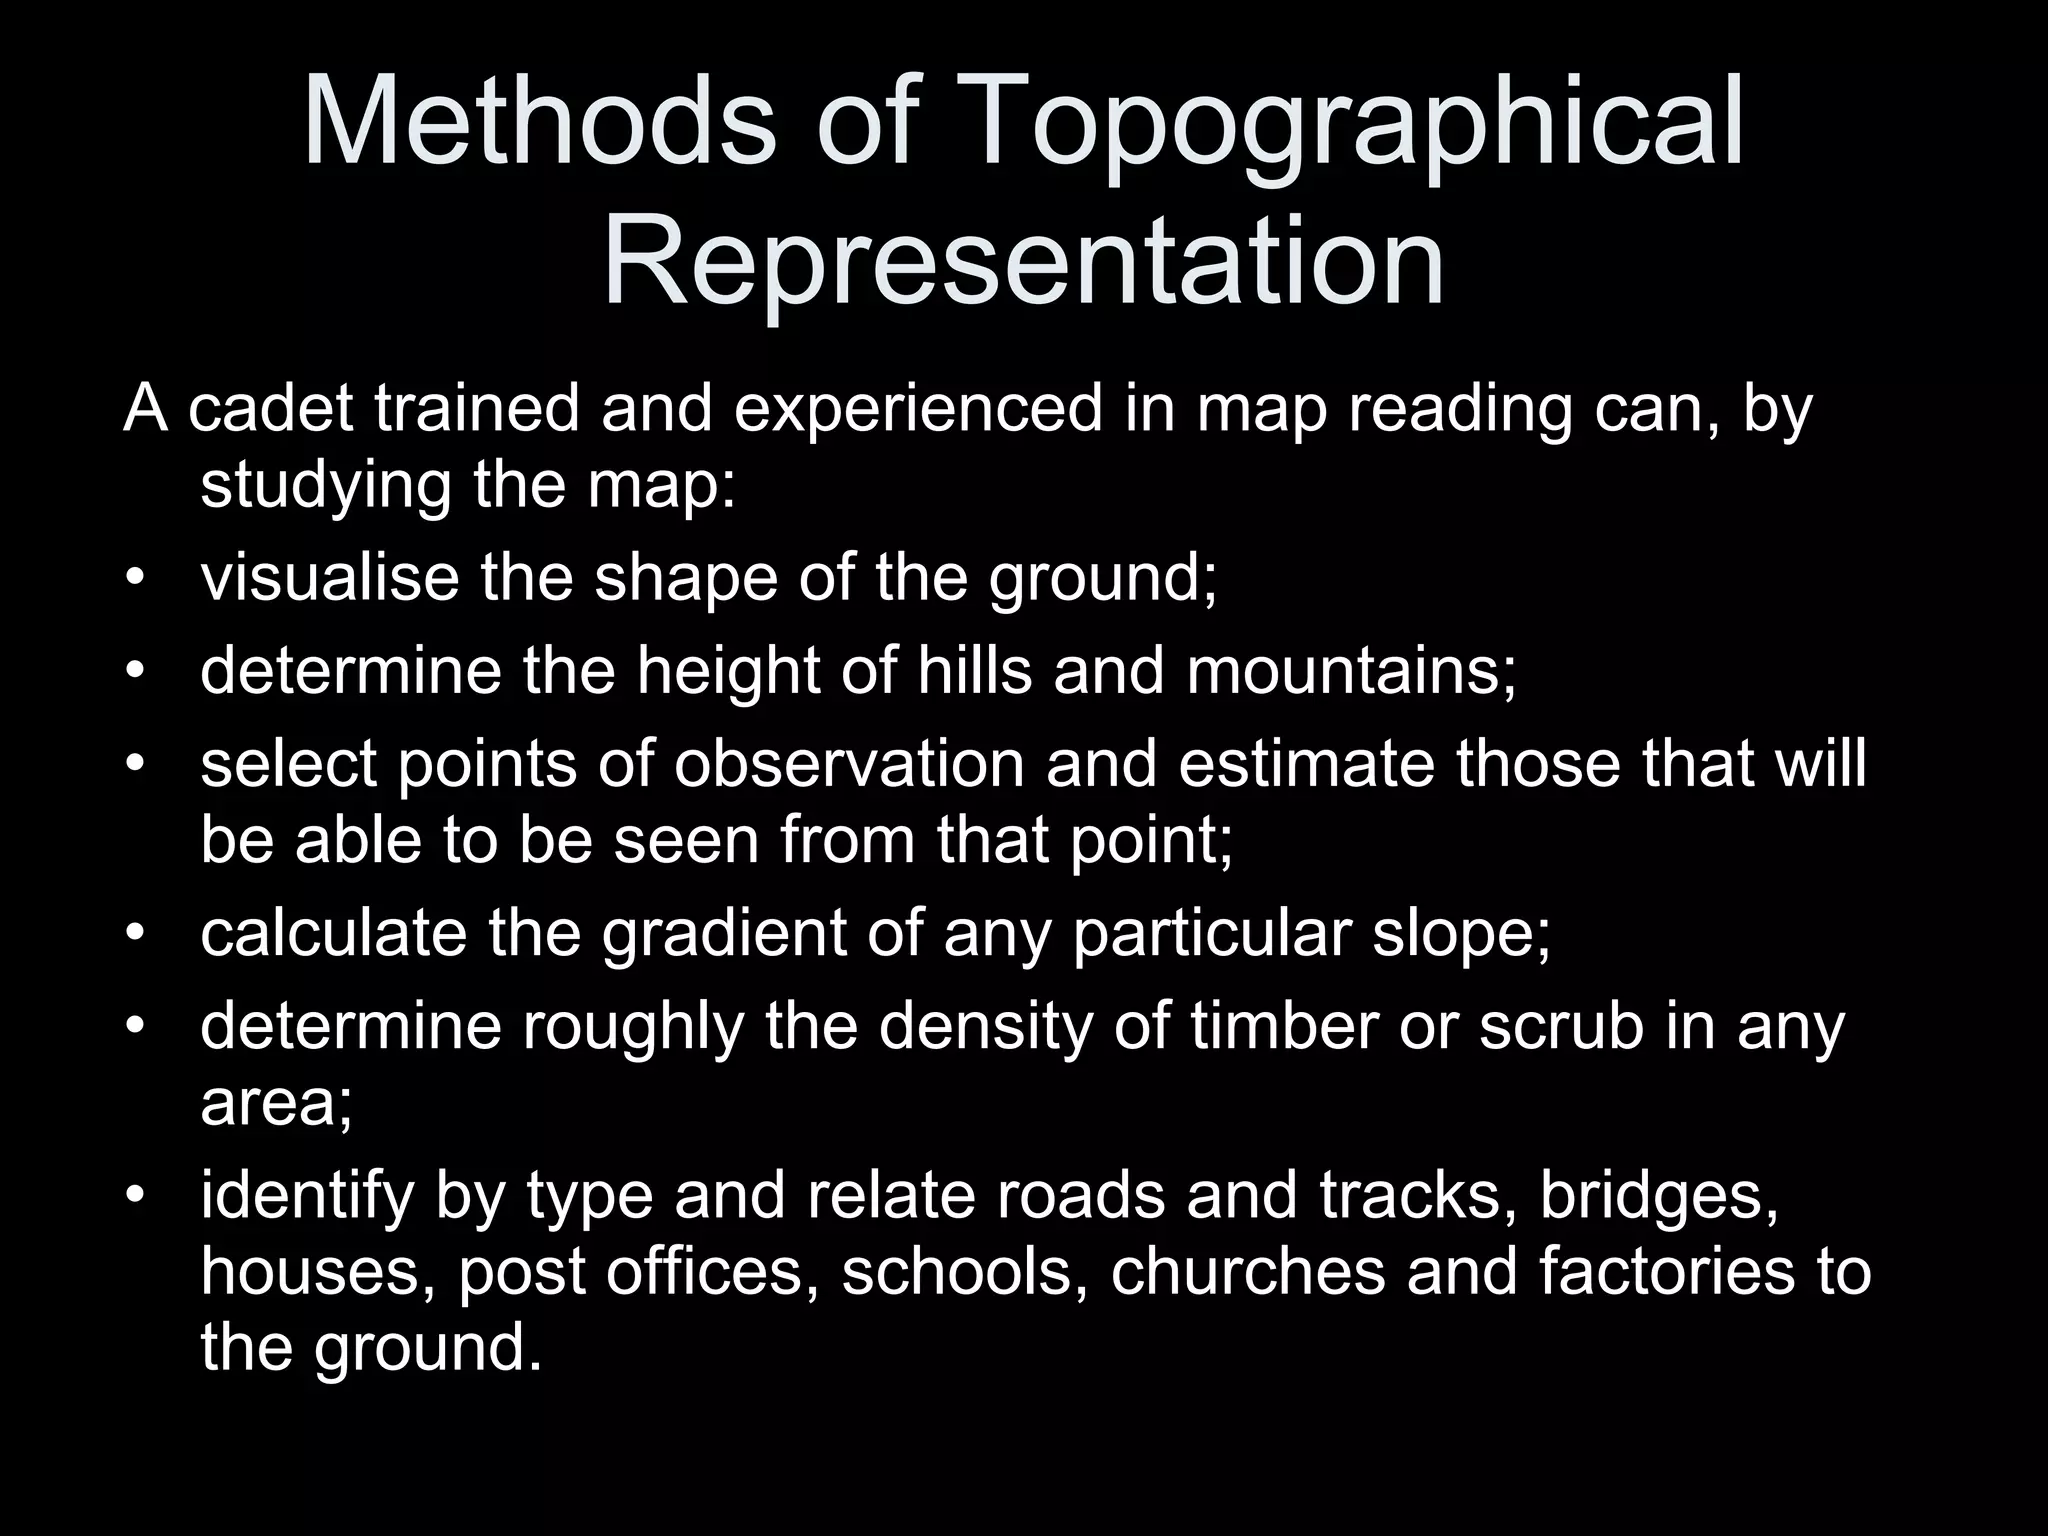
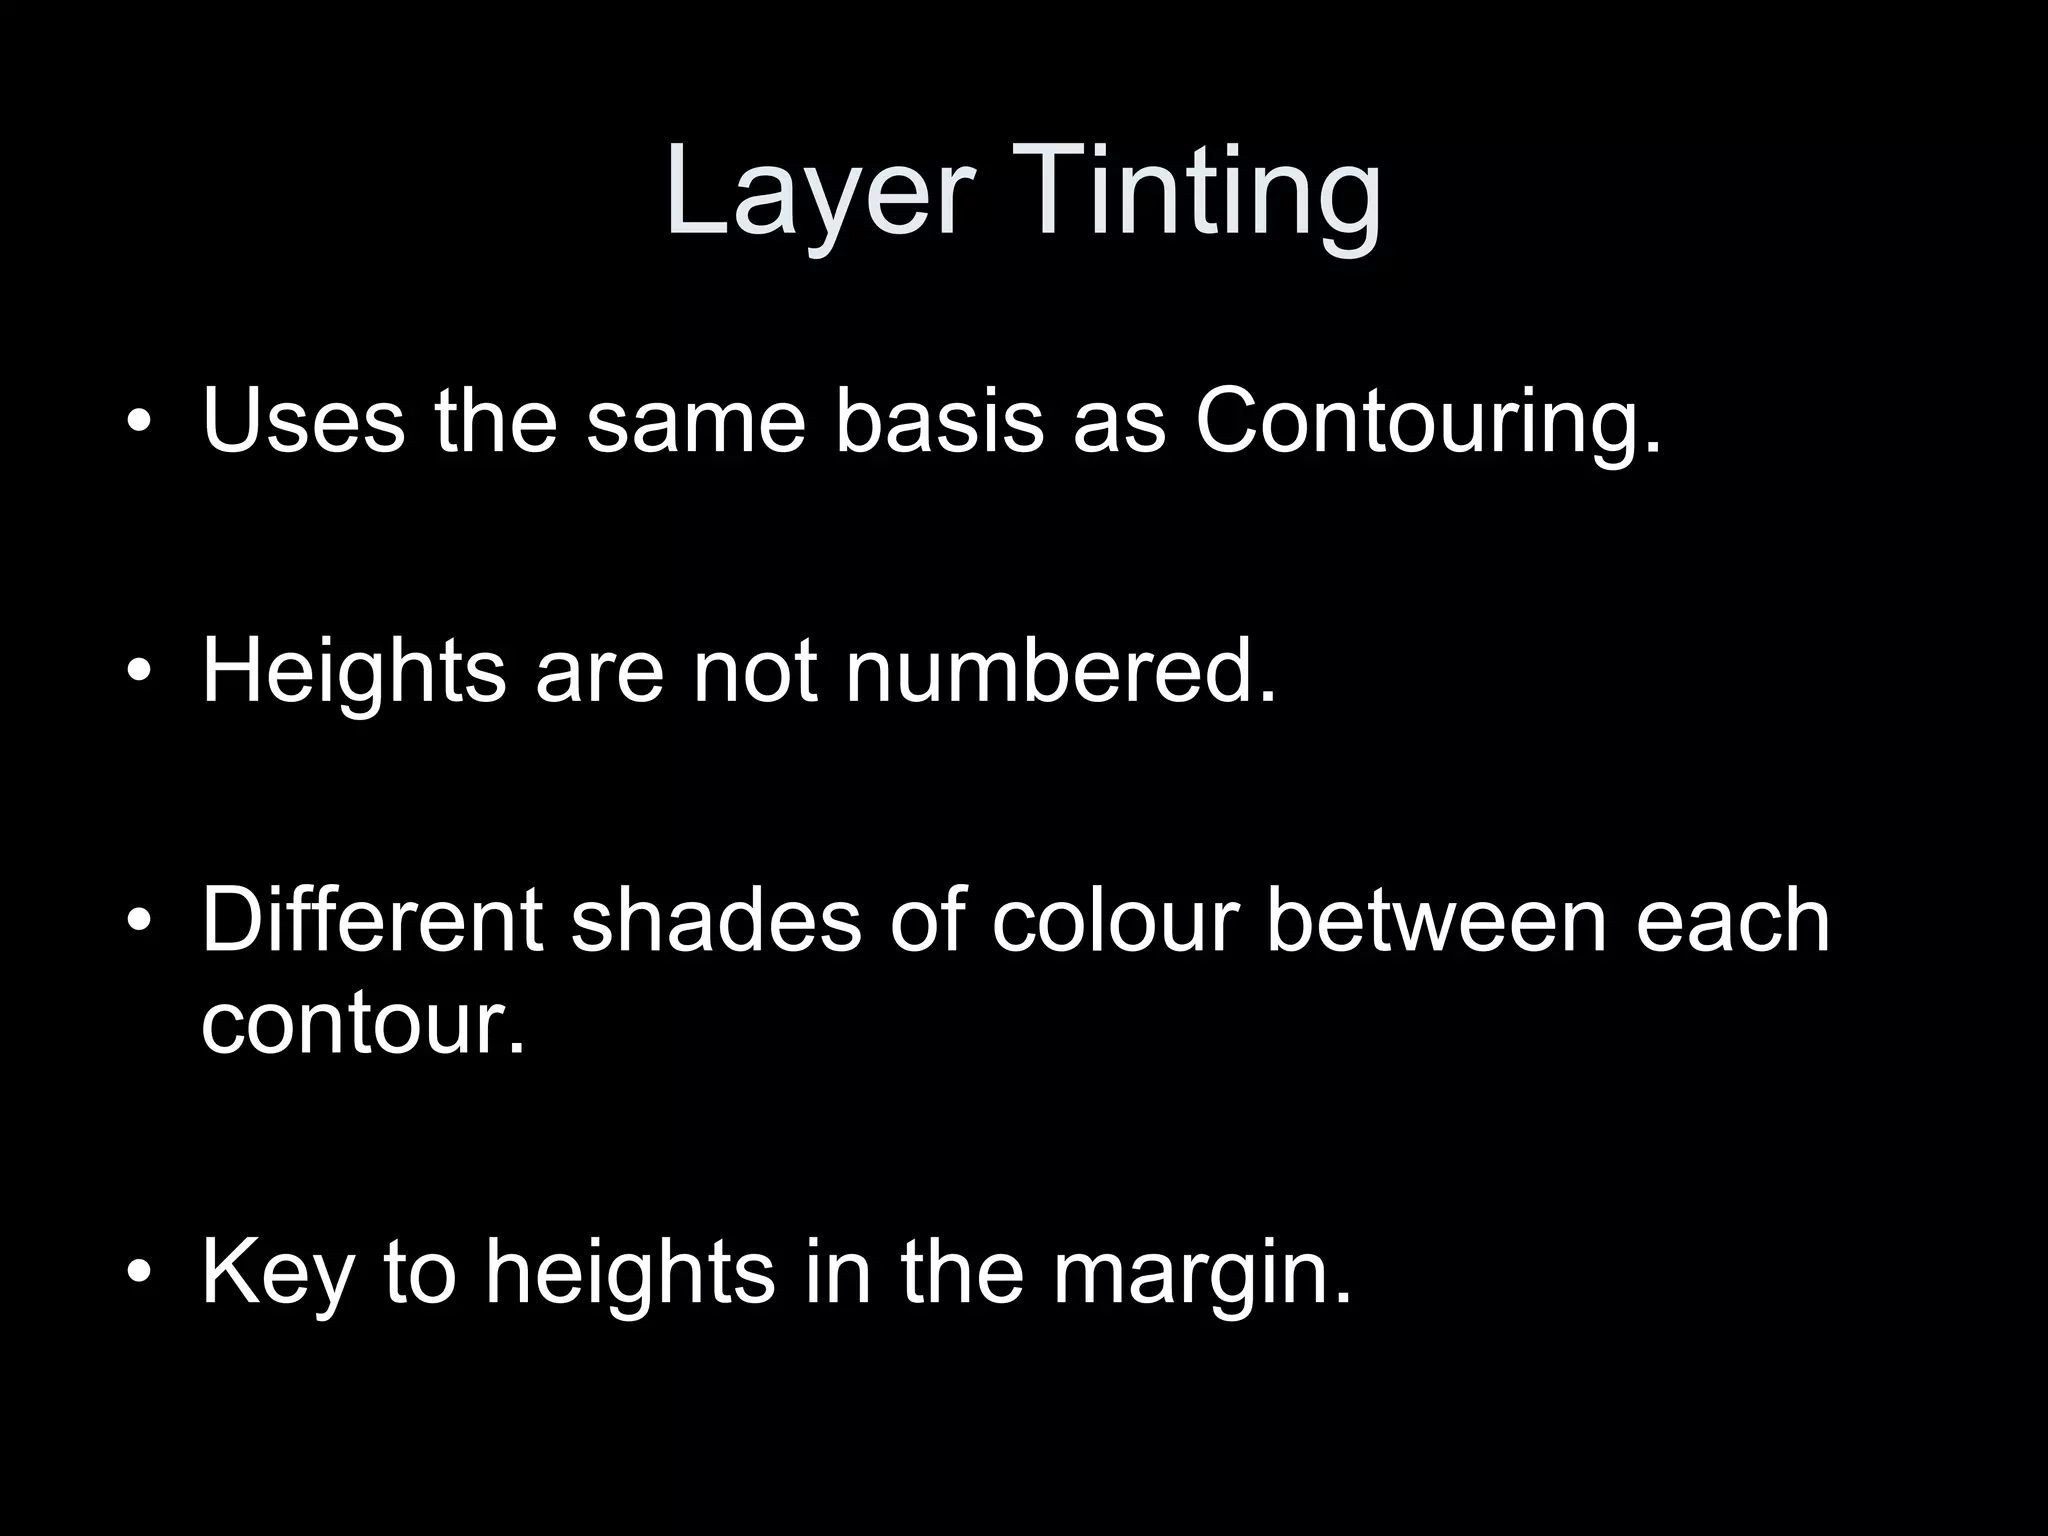
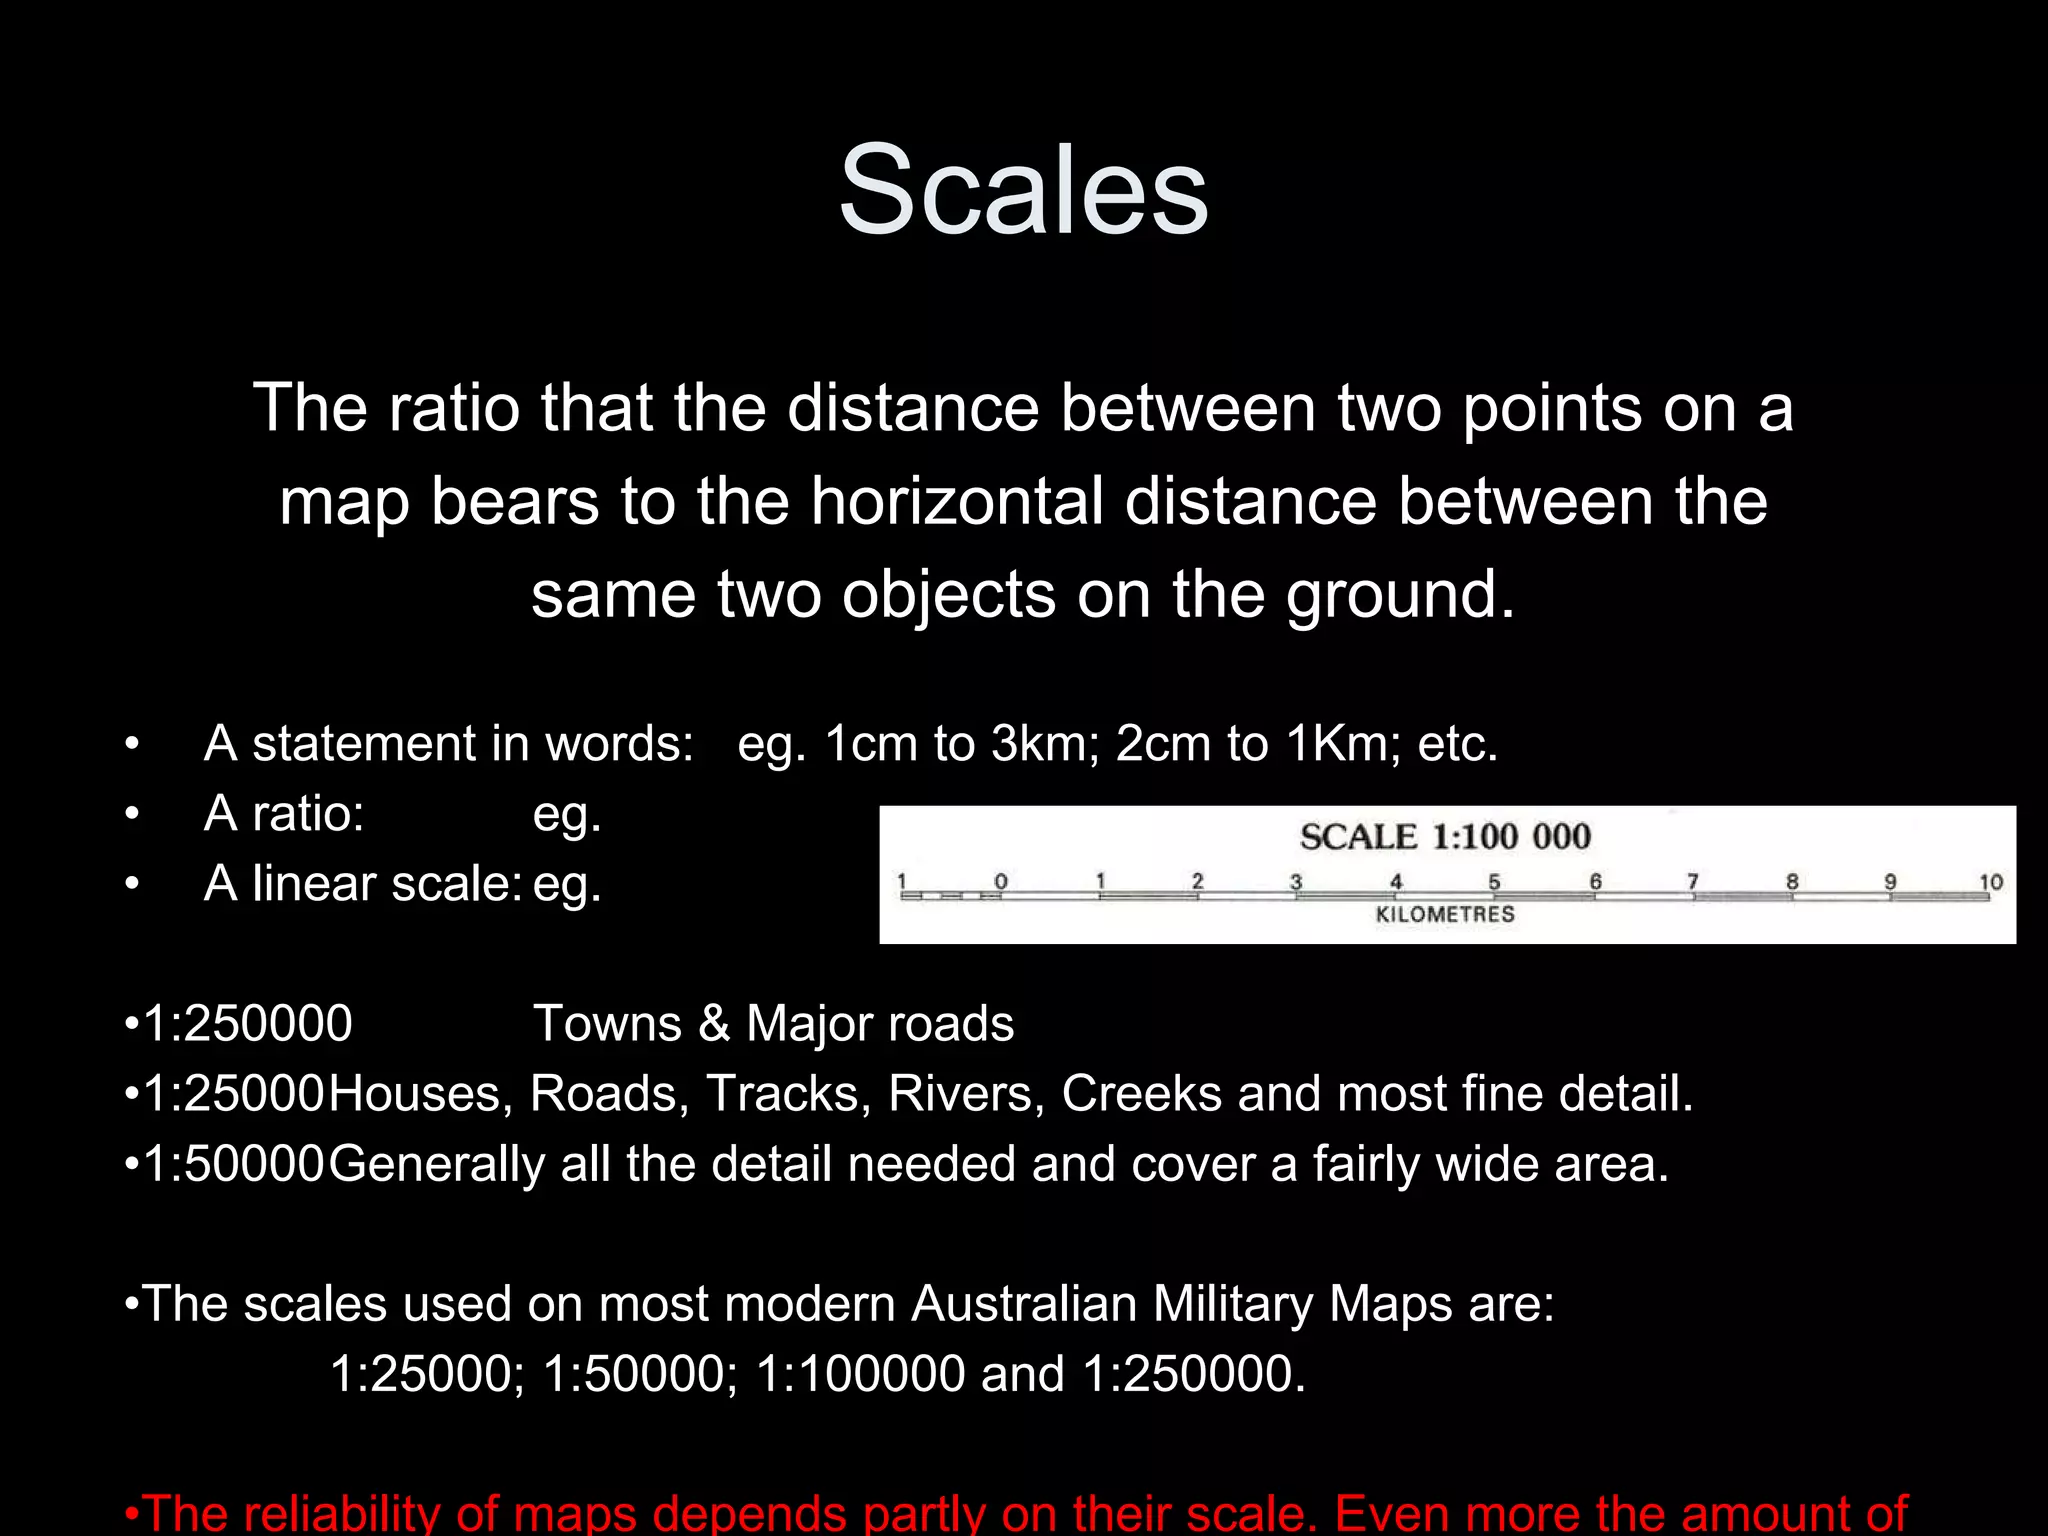
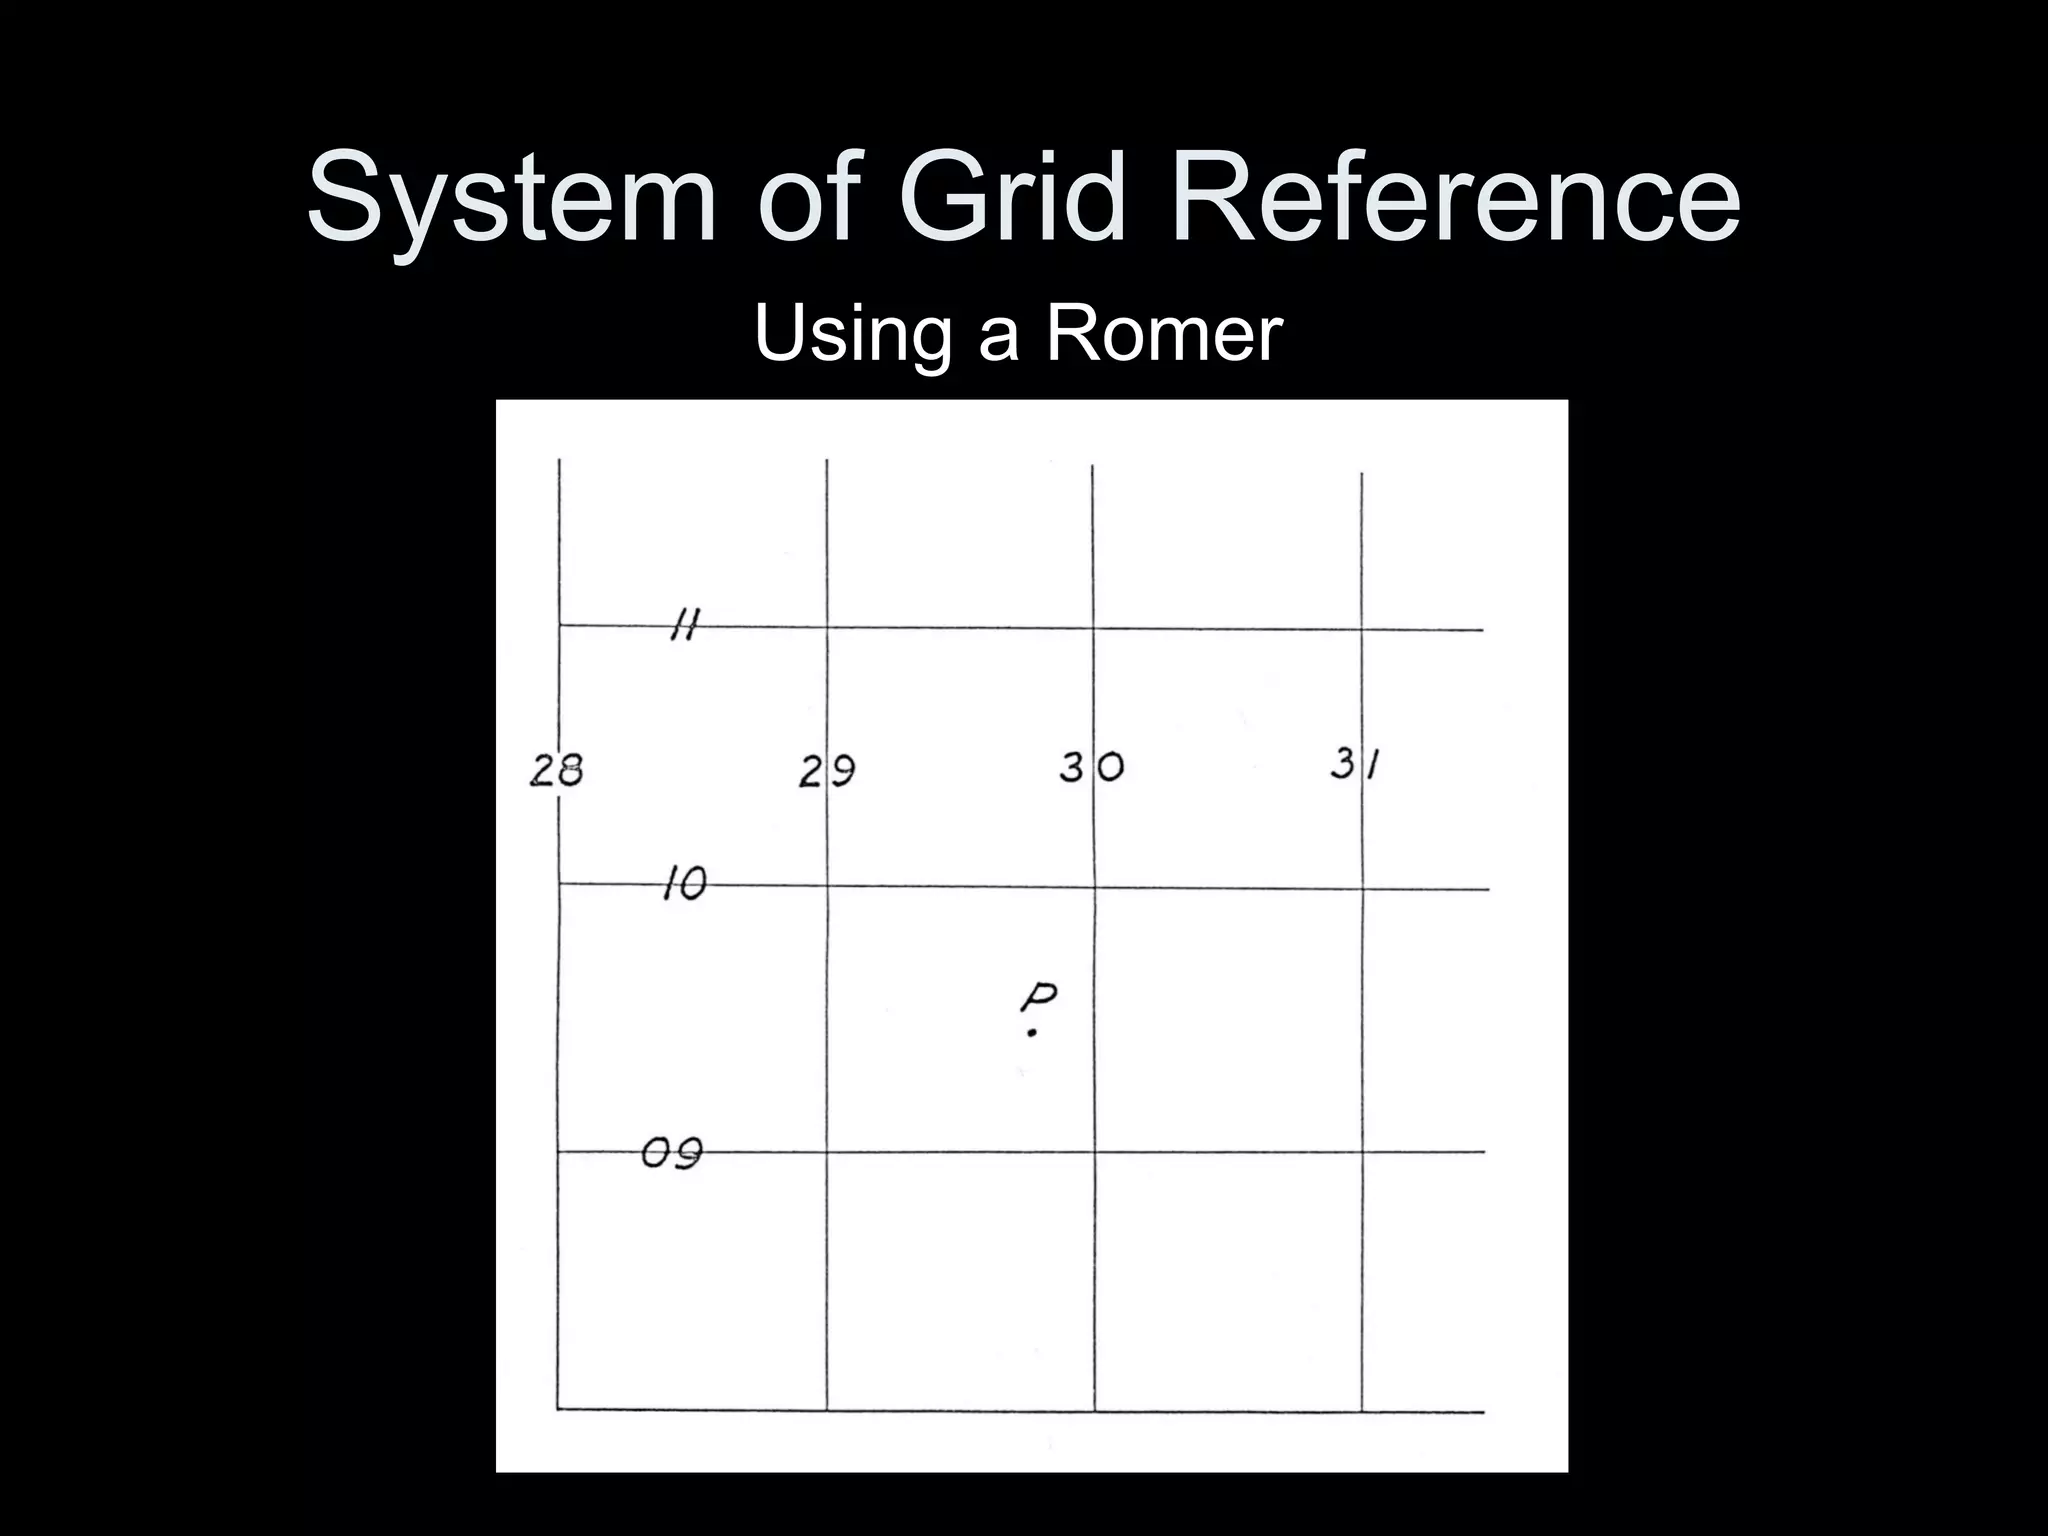
FCP 3: Map Reading By CFSGT Griffin Putland
Objectives State: The definition of a map, Types of maps, Map titles and marginal information, Topographical features, Methods of topographical representation, Scales, System of grid reference.
The Definition of a Map A map is a representation of part of the earth's surface drawn to scale on a flat surface showing natural and artificial features.
Why Bother? A map is a flat surface. The ground is three dimensional. We need a method to represent the third dimension (height). To be a good map reader you must be able to see the shape of the ground from the information supplied on the map.
Why Bother? The purpose in instructing cadets in map reading is to enable them to: Find their way about the countryside. Recognise features on the ground and on the map. Understand the information given on the map so that they can picture the ground even though they have not seen it. Transmit and receive quickly and accurately, information concerning positions, directions and movement of personnel.
Types of Maps Topographical
Map Titles and Marginal Information Title Edition Map number Scale Contour Interval Legend of topographical features Magnetic variation Date of survey Titles and numbers of adjoining maps.
Topographical Features Topography? Any natural feature in a landscape. Hills; Mountains; Valleys; Plains; Rivers; And many more.
Methods of Topographical Representation A cadet trained and experienced in map reading can, by studying the map: visualise the shape of the ground; determine the height of hills and mountains; select points of observation and estimate those that will be able to be seen from that point; calculate the gradient of any particular slope; determine roughly the density of timber or scrub in any area; identify by type and relate roads and tracks, bridges, houses, post offices, schools, churches and factories to the ground.
Techniques Used Spot heights; Contours; and Layer tinting.
Spot Heights Marked as a black filled in square or dot. Usually placed on the peak of a hill or the lowest point of a valley. They are labelled with the points height Above Mean Sea Level (AMSL)
Spot Heights
Contours An imaginary line on the ground at the same height AMSL along its length. Each contour is drawn the same vertical distance above the one below. The shape of the contour line indicates the shape of the ground.
Contours
Layer Tinting Uses the same basis as Contouring. Heights are not numbered. Different shades of colour between each contour. Key to heights in the margin.
Scales The ratio that the distance between two points on a map bears to the horizontal distance between the same two objects on the ground. A statement in words: eg. 1cm to 3km; 2cm to 1Km; etc. A ratio: eg. A linear scale: eg. 1:250000 Towns & Major roads 1:25000 Houses, Roads, Tracks, Rivers, Creeks and most fine detail. 1:50000 Generally all the detail needed and cover a fairly wide area. The scales used on most modern Australian Military Maps are: 1:25000; 1:50000; 1:100000 and 1:250000. The reliability of maps depends partly on their scale. Even more the amount of detail that can be shown depends on the scale. Annex B shows the differences between scales. Linear scale This is a line or several lines, usually at the bottom of the sheet suitably divided so that a distance on the map can be converted quickly and accurately to miles, kilometres or nautical miles depending on the graduation of the scale. means that one millimetre of length or one centimetre or one inch or one unit of length on the map corresponds to 100,0000 of the same units on the ground
Calculating Distances Straight Line: Lay the edge of a piece of paper along the track. Mark each end of the line with a small dash. Lay the paper along the scale line with the right hand mark against one of the primary divisions and left hand opposite the secondary divisions. The distance is then the distance to right of zero plus the fraction left of zero. Bendy Line – Method 1: Lay a piece of cotton (not stretched) along the track, carefully tracing the line of the track. Stretch the cotton tight, transfer it to the scale line and measure as above. Bendy Line – Method 2: Pretend the road is made up of a number of straight sections. Lay a piece of paper along the first section, put a dash at the starting point and at the point where the road swings away from the edge of the paper. Taking care not to move the position of the second tick on the road, pivot the paper about the second tick, until the next section of road is along the edge of the paper and mark it again. Keep repeating this process until the finishing point is reached. The total distance then is recorded as a straight line between the first and last tick, and can be measured on the linear scale as above. With a Linear Scale
Calculating Distances Measuring the distance between the two points on the map. Multiply by the denominator of the ratio. Dividing by the appropriate conversion figure (eg cm -> m). Q: The distance between two points on a 1:50000 map is 5.81cm, what is the corresponding distance on the ground? A: Distance on ground = 5.81 x 50000 = 290500 cm 1 m = 100 cm 290500 ÷ 100 =  2905 m With a Ratio
System of Grid Reference We use the Australian Grid System. Any point in Australia can be represented as a 6 figure Grid Reference. Vertical lines: Eastings. Horizontal lines: Northings. Parallel, at 1000 m spacing. To find the Grid Reference: Locate the Easting either side of the point you are identifying. Divide the space between them into 10 even parts and in your head number these dividing lines 1 -> 9 from the left. The first 2 digits of the Grid Reference are from the left Easting: follow the it down to the margin and record the number shown. The 3 rd  digit is from the smaller divisions between the Eastings. The final 3 digits represent the vertical position in the same manner. Remember: Eastings are numbered from the left and Northings are numbered from bottom to top
System of Grid Reference Using a Romer
Questions Review questions. What: Is the definition of a map? Are the types of maps? Is a topographical feature? Are the 3 main methods of topographical representation? Are the three methods of scale representation?

FCP 3 - Map Reading - CFSGT Putland - Mar 10

  • 1.
    FCP 3: MapReading By CFSGT Griffin Putland
  • 2.
    Objectives State: Thedefinition of a map, Types of maps, Map titles and marginal information, Topographical features, Methods of topographical representation, Scales, System of grid reference.
  • 3.
    The Definition ofa Map A map is a representation of part of the earth's surface drawn to scale on a flat surface showing natural and artificial features.
  • 4.
    Why Bother? Amap is a flat surface. The ground is three dimensional. We need a method to represent the third dimension (height). To be a good map reader you must be able to see the shape of the ground from the information supplied on the map.
  • 5.
    Why Bother? Thepurpose in instructing cadets in map reading is to enable them to: Find their way about the countryside. Recognise features on the ground and on the map. Understand the information given on the map so that they can picture the ground even though they have not seen it. Transmit and receive quickly and accurately, information concerning positions, directions and movement of personnel.
  • 6.
    Types of MapsTopographical
  • 7.
    Map Titles andMarginal Information Title Edition Map number Scale Contour Interval Legend of topographical features Magnetic variation Date of survey Titles and numbers of adjoining maps.
  • 8.
    Topographical Features Topography?Any natural feature in a landscape. Hills; Mountains; Valleys; Plains; Rivers; And many more.
  • 9.
    Methods of TopographicalRepresentation A cadet trained and experienced in map reading can, by studying the map: visualise the shape of the ground; determine the height of hills and mountains; select points of observation and estimate those that will be able to be seen from that point; calculate the gradient of any particular slope; determine roughly the density of timber or scrub in any area; identify by type and relate roads and tracks, bridges, houses, post offices, schools, churches and factories to the ground.
  • 10.
    Techniques Used Spotheights; Contours; and Layer tinting.
  • 11.
    Spot Heights Markedas a black filled in square or dot. Usually placed on the peak of a hill or the lowest point of a valley. They are labelled with the points height Above Mean Sea Level (AMSL)
  • 12.
  • 13.
    Contours An imaginaryline on the ground at the same height AMSL along its length. Each contour is drawn the same vertical distance above the one below. The shape of the contour line indicates the shape of the ground.
  • 14.
  • 15.
    Layer Tinting Usesthe same basis as Contouring. Heights are not numbered. Different shades of colour between each contour. Key to heights in the margin.
  • 16.
    Scales The ratiothat the distance between two points on a map bears to the horizontal distance between the same two objects on the ground. A statement in words: eg. 1cm to 3km; 2cm to 1Km; etc. A ratio: eg. A linear scale: eg. 1:250000 Towns & Major roads 1:25000 Houses, Roads, Tracks, Rivers, Creeks and most fine detail. 1:50000 Generally all the detail needed and cover a fairly wide area. The scales used on most modern Australian Military Maps are: 1:25000; 1:50000; 1:100000 and 1:250000. The reliability of maps depends partly on their scale. Even more the amount of detail that can be shown depends on the scale. Annex B shows the differences between scales. Linear scale This is a line or several lines, usually at the bottom of the sheet suitably divided so that a distance on the map can be converted quickly and accurately to miles, kilometres or nautical miles depending on the graduation of the scale. means that one millimetre of length or one centimetre or one inch or one unit of length on the map corresponds to 100,0000 of the same units on the ground
  • 17.
    Calculating Distances StraightLine: Lay the edge of a piece of paper along the track. Mark each end of the line with a small dash. Lay the paper along the scale line with the right hand mark against one of the primary divisions and left hand opposite the secondary divisions. The distance is then the distance to right of zero plus the fraction left of zero. Bendy Line – Method 1: Lay a piece of cotton (not stretched) along the track, carefully tracing the line of the track. Stretch the cotton tight, transfer it to the scale line and measure as above. Bendy Line – Method 2: Pretend the road is made up of a number of straight sections. Lay a piece of paper along the first section, put a dash at the starting point and at the point where the road swings away from the edge of the paper. Taking care not to move the position of the second tick on the road, pivot the paper about the second tick, until the next section of road is along the edge of the paper and mark it again. Keep repeating this process until the finishing point is reached. The total distance then is recorded as a straight line between the first and last tick, and can be measured on the linear scale as above. With a Linear Scale
  • 18.
    Calculating Distances Measuringthe distance between the two points on the map. Multiply by the denominator of the ratio. Dividing by the appropriate conversion figure (eg cm -> m). Q: The distance between two points on a 1:50000 map is 5.81cm, what is the corresponding distance on the ground? A: Distance on ground = 5.81 x 50000 = 290500 cm 1 m = 100 cm 290500 ÷ 100 = 2905 m With a Ratio
  • 19.
    System of GridReference We use the Australian Grid System. Any point in Australia can be represented as a 6 figure Grid Reference. Vertical lines: Eastings. Horizontal lines: Northings. Parallel, at 1000 m spacing. To find the Grid Reference: Locate the Easting either side of the point you are identifying. Divide the space between them into 10 even parts and in your head number these dividing lines 1 -> 9 from the left. The first 2 digits of the Grid Reference are from the left Easting: follow the it down to the margin and record the number shown. The 3 rd digit is from the smaller divisions between the Eastings. The final 3 digits represent the vertical position in the same manner. Remember: Eastings are numbered from the left and Northings are numbered from bottom to top
  • 20.
    System of GridReference Using a Romer
  • 21.
    Questions Review questions.What: Is the definition of a map? Are the types of maps? Is a topographical feature? Are the 3 main methods of topographical representation? Are the three methods of scale representation?