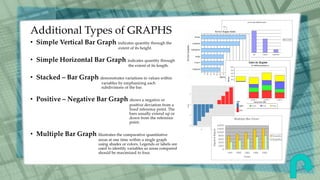
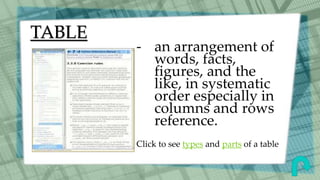
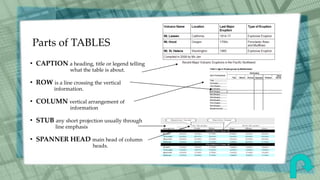
SlideShare a Scribd company logo
1 of 18
By: Prof.Mardelyn L. Dumayas
GRAPHIC AIDS
In Making Reports
GRAPHIC AID pertains to any form
of illustration like charts, pictures,
diagrams, maps, and tables that aim
to enhance textual information for
appreciation and better
understanding of the topic being
reported or discussed.
Kinds of GRAPHIC AIDS in Reports:
• Figure
• Graph
• Inset
• Chart
• Clip Art
• Map
• Diagram
• Picture
• Pictogram
• Side Bar
• Table
FIGURE an image or
representation of
anything by means of
painting, carving,
modeling, or drawing
to illustrate a
statement.
GRAPH
a diagram or curve
representing the
successive values of a
changing quantity.
Click to see additional types of graphs
Additional Types of GRAPHS
• Simple Vertical Bar Graph indicates quantity through the
extent of its height.
• Simple Horizontal Bar Graph indicates quantity through
the extent of its length.
• Stacked – Bar Graph demonstrates variations in values within
variables by emphasizing each
subdivisions of the bar.
• Positive – Negative Bar Graph shows a negative or
positive deviation from a
fixed reference point. The
bars usually extend up or
down from the reference
point.
• Multiple Bar Graph illustrates the comparative quantitative
areas at one time within a single graph
using shades or colors. Legends or labels are
used to identify variables so areas compared
should be maximized to four.
INSET
something set in or
inserted as a small
picture or map within
the border of a larger
one .
CHART
a sheet that gives
information in tabular
form or by graphic
representation.
CLIP ART any predesigned art
image that may be
copied or pasted or
imported into textual
presentations in order
to make reports more
attractive.
MAP - a representation as
on a paper of all the
parts of the earth or its
part.
- shows physical
features, political
divisions, distribution
of population and
others
DIAGRAM something marked out
by lines, outlines,
drawing, parts or
operation of
something, like a Venn
diagram that shows a
series of logically
interconnected graphs
PICTURE
a painting, drawing
or photograph of a
person, object or
scene
PICTOGRAM
a chart that uses bars
made of pictures
(Lesikar, 1988)
SIDE BAR - any textual or
illustrative
presentation the
supports the main
discussion
- Usually enclaved in a
border line or light
shades to distinguish
it from the main text
TABLE
- an arrangement of
words, facts,
figures, and the
like, in systematic
order especially in
columns and rows
reference.
Click to see types and parts of a table
TWO (2) Types of TABLES
• SPOT Table is an integral part of the text that is after,
before or in between the body of text.
• REFERENCE Table is positioned independently either near the
text, that is, at the right, or at the left side of the text to which it refers or in the
appendix.
Parts of TABLES
• CAPTION a heading, title or legend telling
what the table is about.
• ROW is a line crossing the vertical
information.
• COLUMN vertical arrangement of
information
• STUB any short projection usually through
line emphasis
• SPANNER HEAD main head of column
heads.
Thank you.
By: Prof.Mardelyn L. Dumayas

More Related Content

What's hot

Color Theory
Color TheoryColor Theory
Color Theoryslhallman
 
Principles of Design - Graphic Design Theory
Principles of Design - Graphic Design TheoryPrinciples of Design - Graphic Design Theory
Principles of Design - Graphic Design TheoryAbanoub Hanna
 
Principles of design
Principles of designPrinciples of design
Principles of designSurhan Fatima
 
Presentation on diagram and flowchart
Presentation on diagram and flowchartPresentation on diagram and flowchart
Presentation on diagram and flowchartSwarnima Tiwari
 
Elements and Principles of Design
Elements and Principles of DesignElements and Principles of Design
Elements and Principles of DesignKM Claudio
 
The principles of design 1
The principles of design 1The principles of design 1
The principles of design 1Carla Hinds
 
Typography, A Presentation
Typography, A PresentationTypography, A Presentation
Typography, A PresentationGraeme Smith
 
Types of charts in Excel and How to use them
Types of charts in Excel and How to use themTypes of charts in Excel and How to use them
Types of charts in Excel and How to use themVijay Perepa
 
Microsoft Power Point
Microsoft Power PointMicrosoft Power Point
Microsoft Power PointOwly Eyes
 
Painting and Drawing
Painting and DrawingPainting and Drawing
Painting and DrawingAngela Clarke
 
Elements and Principles of Design
Elements and Principles of DesignElements and Principles of Design
Elements and Principles of DesignRavi Bhadauria
 
Principles of Good Logo Design
Principles of Good Logo DesignPrinciples of Good Logo Design
Principles of Good Logo DesignJake Van Ness
 
elements and principles of design
elements and principles of designelements and principles of design
elements and principles of designShahril Khairi
 

What's hot (20)

The principles of design
The principles of designThe principles of design
The principles of design
 
Elements of Design
Elements of DesignElements of Design
Elements of Design
 
Color schemes ppt
Color schemes pptColor schemes ppt
Color schemes ppt
 
Color Theory
Color TheoryColor Theory
Color Theory
 
Elements & Principles of Art
Elements & Principles of ArtElements & Principles of Art
Elements & Principles of Art
 
Principles of Design - Graphic Design Theory
Principles of Design - Graphic Design TheoryPrinciples of Design - Graphic Design Theory
Principles of Design - Graphic Design Theory
 
Principles of design
Principles of designPrinciples of design
Principles of design
 
Presentation on diagram and flowchart
Presentation on diagram and flowchartPresentation on diagram and flowchart
Presentation on diagram and flowchart
 
Elements of Art: Line
Elements of Art: LineElements of Art: Line
Elements of Art: Line
 
Elements and Principles of Design
Elements and Principles of DesignElements and Principles of Design
Elements and Principles of Design
 
The principles of design 1
The principles of design 1The principles of design 1
The principles of design 1
 
Typography, A Presentation
Typography, A PresentationTypography, A Presentation
Typography, A Presentation
 
Types of charts in Excel and How to use them
Types of charts in Excel and How to use themTypes of charts in Excel and How to use them
Types of charts in Excel and How to use them
 
Microsoft Power Point
Microsoft Power PointMicrosoft Power Point
Microsoft Power Point
 
Painting and Drawing
Painting and DrawingPainting and Drawing
Painting and Drawing
 
Elements and Principles of Design
Elements and Principles of DesignElements and Principles of Design
Elements and Principles of Design
 
5 Reasons Typography is Powerful
5 Reasons Typography is Powerful5 Reasons Typography is Powerful
5 Reasons Typography is Powerful
 
Principles of Good Logo Design
Principles of Good Logo DesignPrinciples of Good Logo Design
Principles of Good Logo Design
 
elements and principles of design
elements and principles of designelements and principles of design
elements and principles of design
 
Typography
TypographyTypography
Typography
 

Viewers also liked

Graphic aids....present
Graphic aids....presentGraphic aids....present
Graphic aids....presentCiccone Tucker
 
Lesson 23 graphic aids
Lesson 23 graphic aidsLesson 23 graphic aids
Lesson 23 graphic aidsWenny Wang Wu
 
Graphic aids reading
Graphic aids readingGraphic aids reading
Graphic aids readingana0123
 
Graphic and visual aids in communication
Graphic and visual aids in communicationGraphic and visual aids in communication
Graphic and visual aids in communicationSmart Safayet
 
Communicating quantitative information (pecha kucha)
Communicating quantitative information (pecha kucha)Communicating quantitative information (pecha kucha)
Communicating quantitative information (pecha kucha)tsteks
 
Graphic aids 2.cartoons A lecture By Allah Dad Khan VP The University Of Agr...
Graphic aids 2.cartoons A lecture  By Allah Dad Khan VP The University Of Agr...Graphic aids 2.cartoons A lecture  By Allah Dad Khan VP The University Of Agr...
Graphic aids 2.cartoons A lecture By Allah Dad Khan VP The University Of Agr...Mr.Allah Dad Khan
 
What is a map- Introduction to Map Skills Presentation
What is a map- Introduction to Map Skills PresentationWhat is a map- Introduction to Map Skills Presentation
What is a map- Introduction to Map Skills Presentationesample458
 
Information text features ppt
Information text features pptInformation text features ppt
Information text features pptVELIZM
 
Graphic organizer Presentation
Graphic organizer PresentationGraphic organizer Presentation
Graphic organizer Presentationdavidborer1
 
Using Graphic Organizers To Differentiate Instruction
Using Graphic Organizers To Differentiate InstructionUsing Graphic Organizers To Differentiate Instruction
Using Graphic Organizers To Differentiate Instructionulamb
 

Viewers also liked (20)

Graphic aids....present
Graphic aids....presentGraphic aids....present
Graphic aids....present
 
Lesson 23 graphic aids
Lesson 23 graphic aidsLesson 23 graphic aids
Lesson 23 graphic aids
 
Graphic aids
Graphic aidsGraphic aids
Graphic aids
 
Graphic aids (2)
Graphic aids (2)Graphic aids (2)
Graphic aids (2)
 
Graphic aids reading
Graphic aids readingGraphic aids reading
Graphic aids reading
 
Graphic and visual aids in communication
Graphic and visual aids in communicationGraphic and visual aids in communication
Graphic and visual aids in communication
 
Graphic communication
Graphic communicationGraphic communication
Graphic communication
 
Communicating quantitative information (pecha kucha)
Communicating quantitative information (pecha kucha)Communicating quantitative information (pecha kucha)
Communicating quantitative information (pecha kucha)
 
Graphic aids 2.cartoons A lecture By Allah Dad Khan VP The University Of Agr...
Graphic aids 2.cartoons A lecture  By Allah Dad Khan VP The University Of Agr...Graphic aids 2.cartoons A lecture  By Allah Dad Khan VP The University Of Agr...
Graphic aids 2.cartoons A lecture By Allah Dad Khan VP The University Of Agr...
 
Types of maps
Types of mapsTypes of maps
Types of maps
 
Karnaugh Maps
Karnaugh MapsKarnaugh Maps
Karnaugh Maps
 
Basics of Map reading
Basics of Map reading Basics of Map reading
Basics of Map reading
 
K map
K mapK map
K map
 
Map Parts
Map PartsMap Parts
Map Parts
 
What is a map- Introduction to Map Skills Presentation
What is a map- Introduction to Map Skills PresentationWhat is a map- Introduction to Map Skills Presentation
What is a map- Introduction to Map Skills Presentation
 
Information text features ppt
Information text features pptInformation text features ppt
Information text features ppt
 
Graphic organizer Presentation
Graphic organizer PresentationGraphic organizer Presentation
Graphic organizer Presentation
 
Using Graphic Organizers To Differentiate Instruction
Using Graphic Organizers To Differentiate InstructionUsing Graphic Organizers To Differentiate Instruction
Using Graphic Organizers To Differentiate Instruction
 
Text features
Text featuresText features
Text features
 
Teaching Aids
Teaching AidsTeaching Aids
Teaching Aids
 

Similar to Graphic Aids in Making Reports

Teaching with visual symbols
Teaching with visual symbolsTeaching with visual symbols
Teaching with visual symbolsIra Sagu
 
DIAGRAMMATIC AND GRAPHICAL REPRESENTATION OF DATA (UMAR ABDULLAH).pdf
DIAGRAMMATIC AND GRAPHICAL REPRESENTATION OF DATA (UMAR ABDULLAH).pdfDIAGRAMMATIC AND GRAPHICAL REPRESENTATION OF DATA (UMAR ABDULLAH).pdf
DIAGRAMMATIC AND GRAPHICAL REPRESENTATION OF DATA (UMAR ABDULLAH).pdfdhah472
 
transcoding_linear_to_non-linear_text.pptx
transcoding_linear_to_non-linear_text.pptxtranscoding_linear_to_non-linear_text.pptx
transcoding_linear_to_non-linear_text.pptxGladdysJoyRomano
 
Different Diagrams & Charts in Modern Education (Educational Technology)
Different Diagrams & Charts in Modern Education (Educational Technology)Different Diagrams & Charts in Modern Education (Educational Technology)
Different Diagrams & Charts in Modern Education (Educational Technology)Jewel Jem
 
Teaching with Visual Symbols
Teaching with Visual SymbolsTeaching with Visual Symbols
Teaching with Visual SymbolsMariz Ombajin
 
Các loại biểu đồ trình bày dữ liệu kinh doanh
Các loại biểu đồ trình bày dữ liệu kinh doanhCác loại biểu đồ trình bày dữ liệu kinh doanh
Các loại biểu đồ trình bày dữ liệu kinh doanhChng83
 
Eductechreport
EductechreportEductechreport
Eductechreportakotoh
 
Spreadsheet terminology
Spreadsheet terminologySpreadsheet terminology
Spreadsheet terminologyTammy Carter
 
Visual Information.pptx
Visual Information.pptxVisual Information.pptx
Visual Information.pptxTiaBronte
 
Educational Technology 1
Educational Technology 1Educational Technology 1
Educational Technology 1Jaevon Bingayan
 
GRAPHICAL REPRESENTATION.pptx(unit 4).pptx
GRAPHICAL REPRESENTATION.pptx(unit 4).pptxGRAPHICAL REPRESENTATION.pptx(unit 4).pptx
GRAPHICAL REPRESENTATION.pptx(unit 4).pptxJOSEPHINELENTAF
 
What is Line Graph
What is Line GraphWhat is Line Graph
What is Line GraphAsad Afridi
 
Different Types of Graphs - Copy.pptx
Different Types of Graphs - Copy.pptxDifferent Types of Graphs - Copy.pptx
Different Types of Graphs - Copy.pptxChrysler Kayce
 
Ed tech report (graphic materials)
Ed tech report (graphic materials)Ed tech report (graphic materials)
Ed tech report (graphic materials)Cloie
 
Graphical Representation of data
Graphical Representation of dataGraphical Representation of data
Graphical Representation of dataJijo K Mathew
 

Similar to Graphic Aids in Making Reports (20)

Teaching with visual symbols
Teaching with visual symbolsTeaching with visual symbols
Teaching with visual symbols
 
DIAGRAMMATIC AND GRAPHICAL REPRESENTATION OF DATA (UMAR ABDULLAH).pdf
DIAGRAMMATIC AND GRAPHICAL REPRESENTATION OF DATA (UMAR ABDULLAH).pdfDIAGRAMMATIC AND GRAPHICAL REPRESENTATION OF DATA (UMAR ABDULLAH).pdf
DIAGRAMMATIC AND GRAPHICAL REPRESENTATION OF DATA (UMAR ABDULLAH).pdf
 
Visual symbols
Visual symbolsVisual symbols
Visual symbols
 
transcoding_linear_to_non-linear_text.pptx
transcoding_linear_to_non-linear_text.pptxtranscoding_linear_to_non-linear_text.pptx
transcoding_linear_to_non-linear_text.pptx
 
Different Diagrams & Charts in Modern Education (Educational Technology)
Different Diagrams & Charts in Modern Education (Educational Technology)Different Diagrams & Charts in Modern Education (Educational Technology)
Different Diagrams & Charts in Modern Education (Educational Technology)
 
Teaching with Visual Symbols
Teaching with Visual SymbolsTeaching with Visual Symbols
Teaching with Visual Symbols
 
Các loại biểu đồ trình bày dữ liệu kinh doanh
Các loại biểu đồ trình bày dữ liệu kinh doanhCác loại biểu đồ trình bày dữ liệu kinh doanh
Các loại biểu đồ trình bày dữ liệu kinh doanh
 
Eductechreport
EductechreportEductechreport
Eductechreport
 
Spreadsheet terminology
Spreadsheet terminologySpreadsheet terminology
Spreadsheet terminology
 
Textual Aids.pptx
Textual Aids.pptxTextual Aids.pptx
Textual Aids.pptx
 
Visual Information.pptx
Visual Information.pptxVisual Information.pptx
Visual Information.pptx
 
Educational Technology 1
Educational Technology 1Educational Technology 1
Educational Technology 1
 
GRAPHICAL REPRESENTATION.pptx(unit 4).pptx
GRAPHICAL REPRESENTATION.pptx(unit 4).pptxGRAPHICAL REPRESENTATION.pptx(unit 4).pptx
GRAPHICAL REPRESENTATION.pptx(unit 4).pptx
 
What is Line Graph
What is Line GraphWhat is Line Graph
What is Line Graph
 
Different Types of Graphs - Copy.pptx
Different Types of Graphs - Copy.pptxDifferent Types of Graphs - Copy.pptx
Different Types of Graphs - Copy.pptx
 
Graphic materials
Graphic materialsGraphic materials
Graphic materials
 
teaching visual symbols
teaching visual symbolsteaching visual symbols
teaching visual symbols
 
Ed tech report (graphic materials)
Ed tech report (graphic materials)Ed tech report (graphic materials)
Ed tech report (graphic materials)
 
Graphical Representation of data
Graphical Representation of dataGraphical Representation of data
Graphical Representation of data
 
Computer midterms
Computer midtermsComputer midterms
Computer midterms
 

Recently uploaded

Paris 2024 Olympic Geographies - an activity
Paris 2024 Olympic Geographies - an activityParis 2024 Olympic Geographies - an activity
Paris 2024 Olympic Geographies - an activityGeoBlogs
 
Accessible design: Minimum effort, maximum impact
Accessible design: Minimum effort, maximum impactAccessible design: Minimum effort, maximum impact
Accessible design: Minimum effort, maximum impactdawncurless
 
BASLIQ CURRENT LOOKBOOK LOOKBOOK(1) (1).pdf
BASLIQ CURRENT LOOKBOOK  LOOKBOOK(1) (1).pdfBASLIQ CURRENT LOOKBOOK  LOOKBOOK(1) (1).pdf
BASLIQ CURRENT LOOKBOOK LOOKBOOK(1) (1).pdfSoniaTolstoy
 
Science 7 - LAND and SEA BREEZE and its Characteristics
Science 7 - LAND and SEA BREEZE and its CharacteristicsScience 7 - LAND and SEA BREEZE and its Characteristics
Science 7 - LAND and SEA BREEZE and its CharacteristicsKarinaGenton
 
Presentation by Andreas Schleicher Tackling the School Absenteeism Crisis 30 ...
Presentation by Andreas Schleicher Tackling the School Absenteeism Crisis 30 ...Presentation by Andreas Schleicher Tackling the School Absenteeism Crisis 30 ...
Presentation by Andreas Schleicher Tackling the School Absenteeism Crisis 30 ...EduSkills OECD
 
Introduction to AI in Higher Education_draft.pptx
Introduction to AI in Higher Education_draft.pptxIntroduction to AI in Higher Education_draft.pptx
Introduction to AI in Higher Education_draft.pptxpboyjonauth
 
MENTAL STATUS EXAMINATION format.docx
MENTAL     STATUS EXAMINATION format.docxMENTAL     STATUS EXAMINATION format.docx
MENTAL STATUS EXAMINATION format.docxPoojaSen20
 
PSYCHIATRIC History collection FORMAT.pptx
PSYCHIATRIC   History collection FORMAT.pptxPSYCHIATRIC   History collection FORMAT.pptx
PSYCHIATRIC History collection FORMAT.pptxPoojaSen20
 
18-04-UA_REPORT_MEDIALITERAСY_INDEX-DM_23-1-final-eng.pdf
18-04-UA_REPORT_MEDIALITERAСY_INDEX-DM_23-1-final-eng.pdf18-04-UA_REPORT_MEDIALITERAСY_INDEX-DM_23-1-final-eng.pdf
18-04-UA_REPORT_MEDIALITERAСY_INDEX-DM_23-1-final-eng.pdfssuser54595a
 
The basics of sentences session 2pptx copy.pptx
The basics of sentences session 2pptx copy.pptxThe basics of sentences session 2pptx copy.pptx
The basics of sentences session 2pptx copy.pptxheathfieldcps1
 
Sanyam Choudhary Chemistry practical.pdf
Sanyam Choudhary Chemistry practical.pdfSanyam Choudhary Chemistry practical.pdf
Sanyam Choudhary Chemistry practical.pdfsanyamsingh5019
 
Measures of Central Tendency: Mean, Median and Mode
Measures of Central Tendency: Mean, Median and ModeMeasures of Central Tendency: Mean, Median and Mode
Measures of Central Tendency: Mean, Median and ModeThiyagu K
 
CARE OF CHILD IN INCUBATOR..........pptx
CARE OF CHILD IN INCUBATOR..........pptxCARE OF CHILD IN INCUBATOR..........pptx
CARE OF CHILD IN INCUBATOR..........pptxGaneshChakor2
 
Introduction to ArtificiaI Intelligence in Higher Education
Introduction to ArtificiaI Intelligence in Higher EducationIntroduction to ArtificiaI Intelligence in Higher Education
Introduction to ArtificiaI Intelligence in Higher Educationpboyjonauth
 
POINT- BIOCHEMISTRY SEM 2 ENZYMES UNIT 5.pptx
POINT- BIOCHEMISTRY SEM 2 ENZYMES UNIT 5.pptxPOINT- BIOCHEMISTRY SEM 2 ENZYMES UNIT 5.pptx
POINT- BIOCHEMISTRY SEM 2 ENZYMES UNIT 5.pptxSayali Powar
 
URLs and Routing in the Odoo 17 Website App
URLs and Routing in the Odoo 17 Website AppURLs and Routing in the Odoo 17 Website App
URLs and Routing in the Odoo 17 Website AppCeline George
 
_Math 4-Q4 Week 5.pptx Steps in Collecting Data
_Math 4-Q4 Week 5.pptx Steps in Collecting Data_Math 4-Q4 Week 5.pptx Steps in Collecting Data
_Math 4-Q4 Week 5.pptx Steps in Collecting DataJhengPantaleon
 
Hybridoma Technology ( Production , Purification , and Application )
Hybridoma Technology  ( Production , Purification , and Application  ) Hybridoma Technology  ( Production , Purification , and Application  )
Hybridoma Technology ( Production , Purification , and Application ) Sakshi Ghasle
 
Crayon Activity Handout For the Crayon A
Crayon Activity Handout For the Crayon ACrayon Activity Handout For the Crayon A
Crayon Activity Handout For the Crayon AUnboundStockton
 

Recently uploaded (20)

Paris 2024 Olympic Geographies - an activity
Paris 2024 Olympic Geographies - an activityParis 2024 Olympic Geographies - an activity
Paris 2024 Olympic Geographies - an activity
 
Accessible design: Minimum effort, maximum impact
Accessible design: Minimum effort, maximum impactAccessible design: Minimum effort, maximum impact
Accessible design: Minimum effort, maximum impact
 
BASLIQ CURRENT LOOKBOOK LOOKBOOK(1) (1).pdf
BASLIQ CURRENT LOOKBOOK  LOOKBOOK(1) (1).pdfBASLIQ CURRENT LOOKBOOK  LOOKBOOK(1) (1).pdf
BASLIQ CURRENT LOOKBOOK LOOKBOOK(1) (1).pdf
 
Science 7 - LAND and SEA BREEZE and its Characteristics
Science 7 - LAND and SEA BREEZE and its CharacteristicsScience 7 - LAND and SEA BREEZE and its Characteristics
Science 7 - LAND and SEA BREEZE and its Characteristics
 
Presentation by Andreas Schleicher Tackling the School Absenteeism Crisis 30 ...
Presentation by Andreas Schleicher Tackling the School Absenteeism Crisis 30 ...Presentation by Andreas Schleicher Tackling the School Absenteeism Crisis 30 ...
Presentation by Andreas Schleicher Tackling the School Absenteeism Crisis 30 ...
 
Introduction to AI in Higher Education_draft.pptx
Introduction to AI in Higher Education_draft.pptxIntroduction to AI in Higher Education_draft.pptx
Introduction to AI in Higher Education_draft.pptx
 
MENTAL STATUS EXAMINATION format.docx
MENTAL     STATUS EXAMINATION format.docxMENTAL     STATUS EXAMINATION format.docx
MENTAL STATUS EXAMINATION format.docx
 
PSYCHIATRIC History collection FORMAT.pptx
PSYCHIATRIC   History collection FORMAT.pptxPSYCHIATRIC   History collection FORMAT.pptx
PSYCHIATRIC History collection FORMAT.pptx
 
18-04-UA_REPORT_MEDIALITERAСY_INDEX-DM_23-1-final-eng.pdf
18-04-UA_REPORT_MEDIALITERAСY_INDEX-DM_23-1-final-eng.pdf18-04-UA_REPORT_MEDIALITERAСY_INDEX-DM_23-1-final-eng.pdf
18-04-UA_REPORT_MEDIALITERAСY_INDEX-DM_23-1-final-eng.pdf
 
The basics of sentences session 2pptx copy.pptx
The basics of sentences session 2pptx copy.pptxThe basics of sentences session 2pptx copy.pptx
The basics of sentences session 2pptx copy.pptx
 
Sanyam Choudhary Chemistry practical.pdf
Sanyam Choudhary Chemistry practical.pdfSanyam Choudhary Chemistry practical.pdf
Sanyam Choudhary Chemistry practical.pdf
 
Measures of Central Tendency: Mean, Median and Mode
Measures of Central Tendency: Mean, Median and ModeMeasures of Central Tendency: Mean, Median and Mode
Measures of Central Tendency: Mean, Median and Mode
 
CARE OF CHILD IN INCUBATOR..........pptx
CARE OF CHILD IN INCUBATOR..........pptxCARE OF CHILD IN INCUBATOR..........pptx
CARE OF CHILD IN INCUBATOR..........pptx
 
Introduction to ArtificiaI Intelligence in Higher Education
Introduction to ArtificiaI Intelligence in Higher EducationIntroduction to ArtificiaI Intelligence in Higher Education
Introduction to ArtificiaI Intelligence in Higher Education
 
Model Call Girl in Tilak Nagar Delhi reach out to us at 🔝9953056974🔝
Model Call Girl in Tilak Nagar Delhi reach out to us at 🔝9953056974🔝Model Call Girl in Tilak Nagar Delhi reach out to us at 🔝9953056974🔝
Model Call Girl in Tilak Nagar Delhi reach out to us at 🔝9953056974🔝
 
POINT- BIOCHEMISTRY SEM 2 ENZYMES UNIT 5.pptx
POINT- BIOCHEMISTRY SEM 2 ENZYMES UNIT 5.pptxPOINT- BIOCHEMISTRY SEM 2 ENZYMES UNIT 5.pptx
POINT- BIOCHEMISTRY SEM 2 ENZYMES UNIT 5.pptx
 
URLs and Routing in the Odoo 17 Website App
URLs and Routing in the Odoo 17 Website AppURLs and Routing in the Odoo 17 Website App
URLs and Routing in the Odoo 17 Website App
 
_Math 4-Q4 Week 5.pptx Steps in Collecting Data
_Math 4-Q4 Week 5.pptx Steps in Collecting Data_Math 4-Q4 Week 5.pptx Steps in Collecting Data
_Math 4-Q4 Week 5.pptx Steps in Collecting Data
 
Hybridoma Technology ( Production , Purification , and Application )
Hybridoma Technology  ( Production , Purification , and Application  ) Hybridoma Technology  ( Production , Purification , and Application  )
Hybridoma Technology ( Production , Purification , and Application )
 
Crayon Activity Handout For the Crayon A
Crayon Activity Handout For the Crayon ACrayon Activity Handout For the Crayon A
Crayon Activity Handout For the Crayon A
 

Graphic Aids in Making Reports

  • 1. By: Prof.Mardelyn L. Dumayas GRAPHIC AIDS In Making Reports
  • 2. GRAPHIC AID pertains to any form of illustration like charts, pictures, diagrams, maps, and tables that aim to enhance textual information for appreciation and better understanding of the topic being reported or discussed.
  • 3. Kinds of GRAPHIC AIDS in Reports: • Figure • Graph • Inset • Chart • Clip Art • Map • Diagram • Picture • Pictogram • Side Bar • Table
  • 4. FIGURE an image or representation of anything by means of painting, carving, modeling, or drawing to illustrate a statement.
  • 5. GRAPH a diagram or curve representing the successive values of a changing quantity. Click to see additional types of graphs
  • 6. Additional Types of GRAPHS • Simple Vertical Bar Graph indicates quantity through the extent of its height. • Simple Horizontal Bar Graph indicates quantity through the extent of its length. • Stacked – Bar Graph demonstrates variations in values within variables by emphasizing each subdivisions of the bar. • Positive – Negative Bar Graph shows a negative or positive deviation from a fixed reference point. The bars usually extend up or down from the reference point. • Multiple Bar Graph illustrates the comparative quantitative areas at one time within a single graph using shades or colors. Legends or labels are used to identify variables so areas compared should be maximized to four.
  • 7. INSET something set in or inserted as a small picture or map within the border of a larger one .
  • 8. CHART a sheet that gives information in tabular form or by graphic representation.
  • 9. CLIP ART any predesigned art image that may be copied or pasted or imported into textual presentations in order to make reports more attractive.
  • 10. MAP - a representation as on a paper of all the parts of the earth or its part. - shows physical features, political divisions, distribution of population and others
  • 11. DIAGRAM something marked out by lines, outlines, drawing, parts or operation of something, like a Venn diagram that shows a series of logically interconnected graphs
  • 12. PICTURE a painting, drawing or photograph of a person, object or scene
  • 13. PICTOGRAM a chart that uses bars made of pictures (Lesikar, 1988)
  • 14. SIDE BAR - any textual or illustrative presentation the supports the main discussion - Usually enclaved in a border line or light shades to distinguish it from the main text
  • 15. TABLE - an arrangement of words, facts, figures, and the like, in systematic order especially in columns and rows reference. Click to see types and parts of a table
  • 16. TWO (2) Types of TABLES • SPOT Table is an integral part of the text that is after, before or in between the body of text. • REFERENCE Table is positioned independently either near the text, that is, at the right, or at the left side of the text to which it refers or in the appendix.
  • 17. Parts of TABLES • CAPTION a heading, title or legend telling what the table is about. • ROW is a line crossing the vertical information. • COLUMN vertical arrangement of information • STUB any short projection usually through line emphasis • SPANNER HEAD main head of column heads.