Five key types of graphic aids are bar graphs, line graphs, pie charts, flowcharts, and tables, which visually organize and relate different types of data.
Definitions:-
• Graphic communicationas the name suggests is
communication through graphics and graphic aids .
It is the process of creating , producing, and
distributing material incorporating words and
images to convey data, concepts and emotions.
3.
• Graphic aidspresent information in pictorial
form or in other specific formats in order to
consolidate, clarify or prove the written
material they go with.
PHOTOGRAPHS
• Photographs arethe most realistic and
dramatic representation of physical features.
In a good photograph the reader can see
exactly what the writer is talking about.
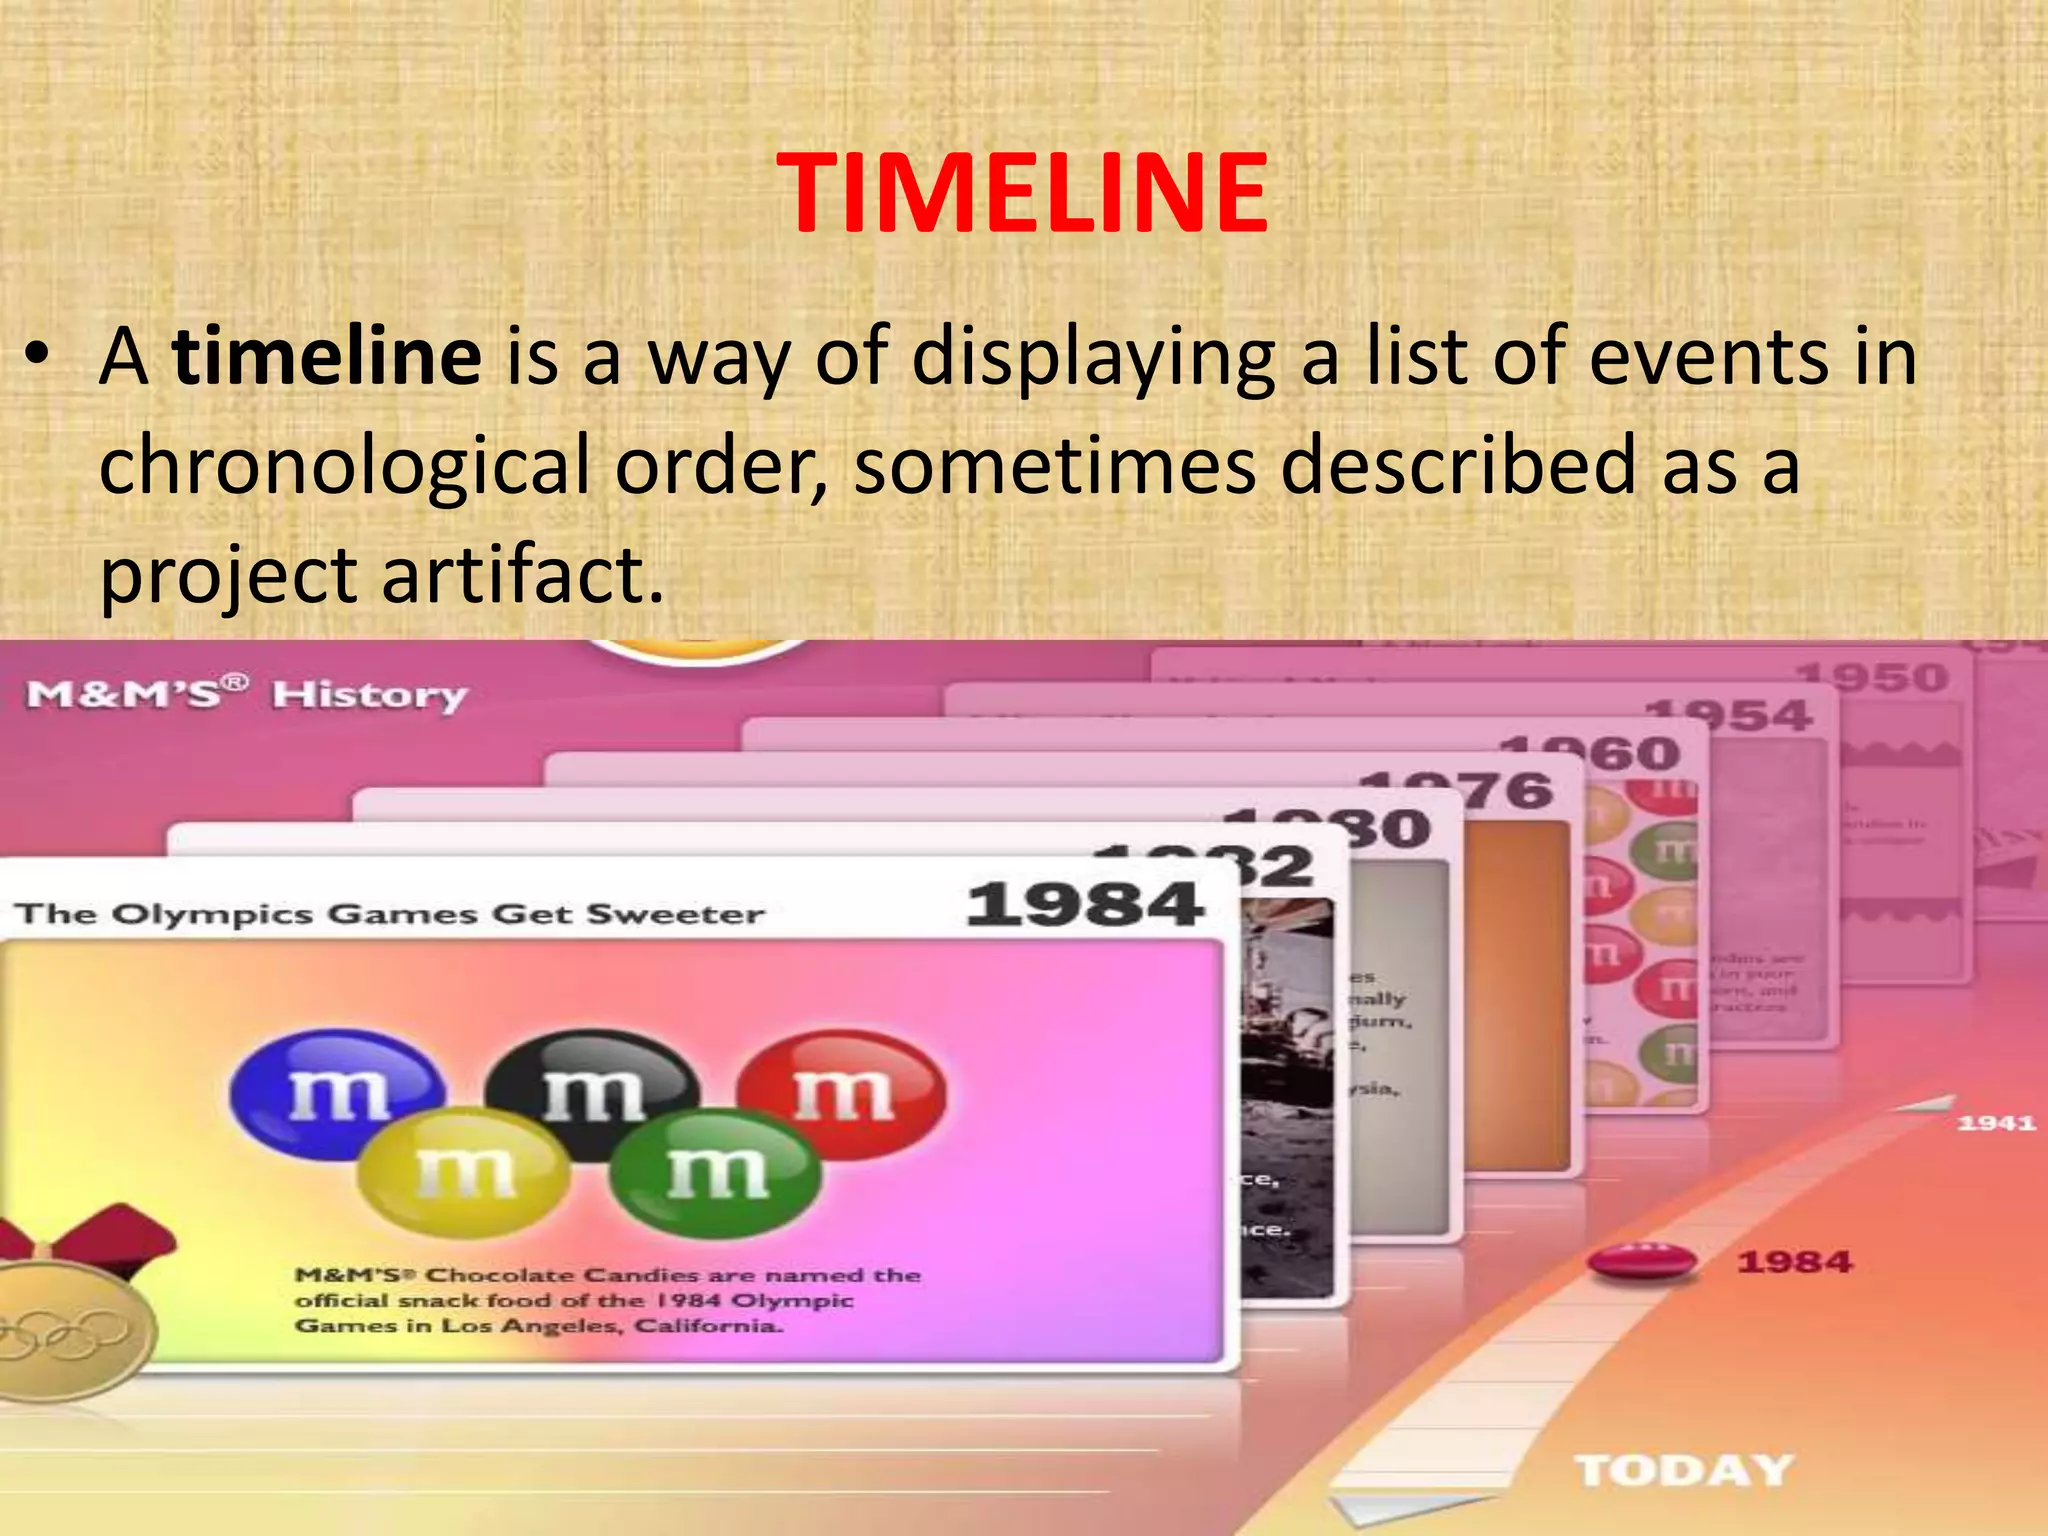
TIMELINE
• A timelineis a way of displaying a list of events in
chronological order, sometimes described as a
project artifact.
9.
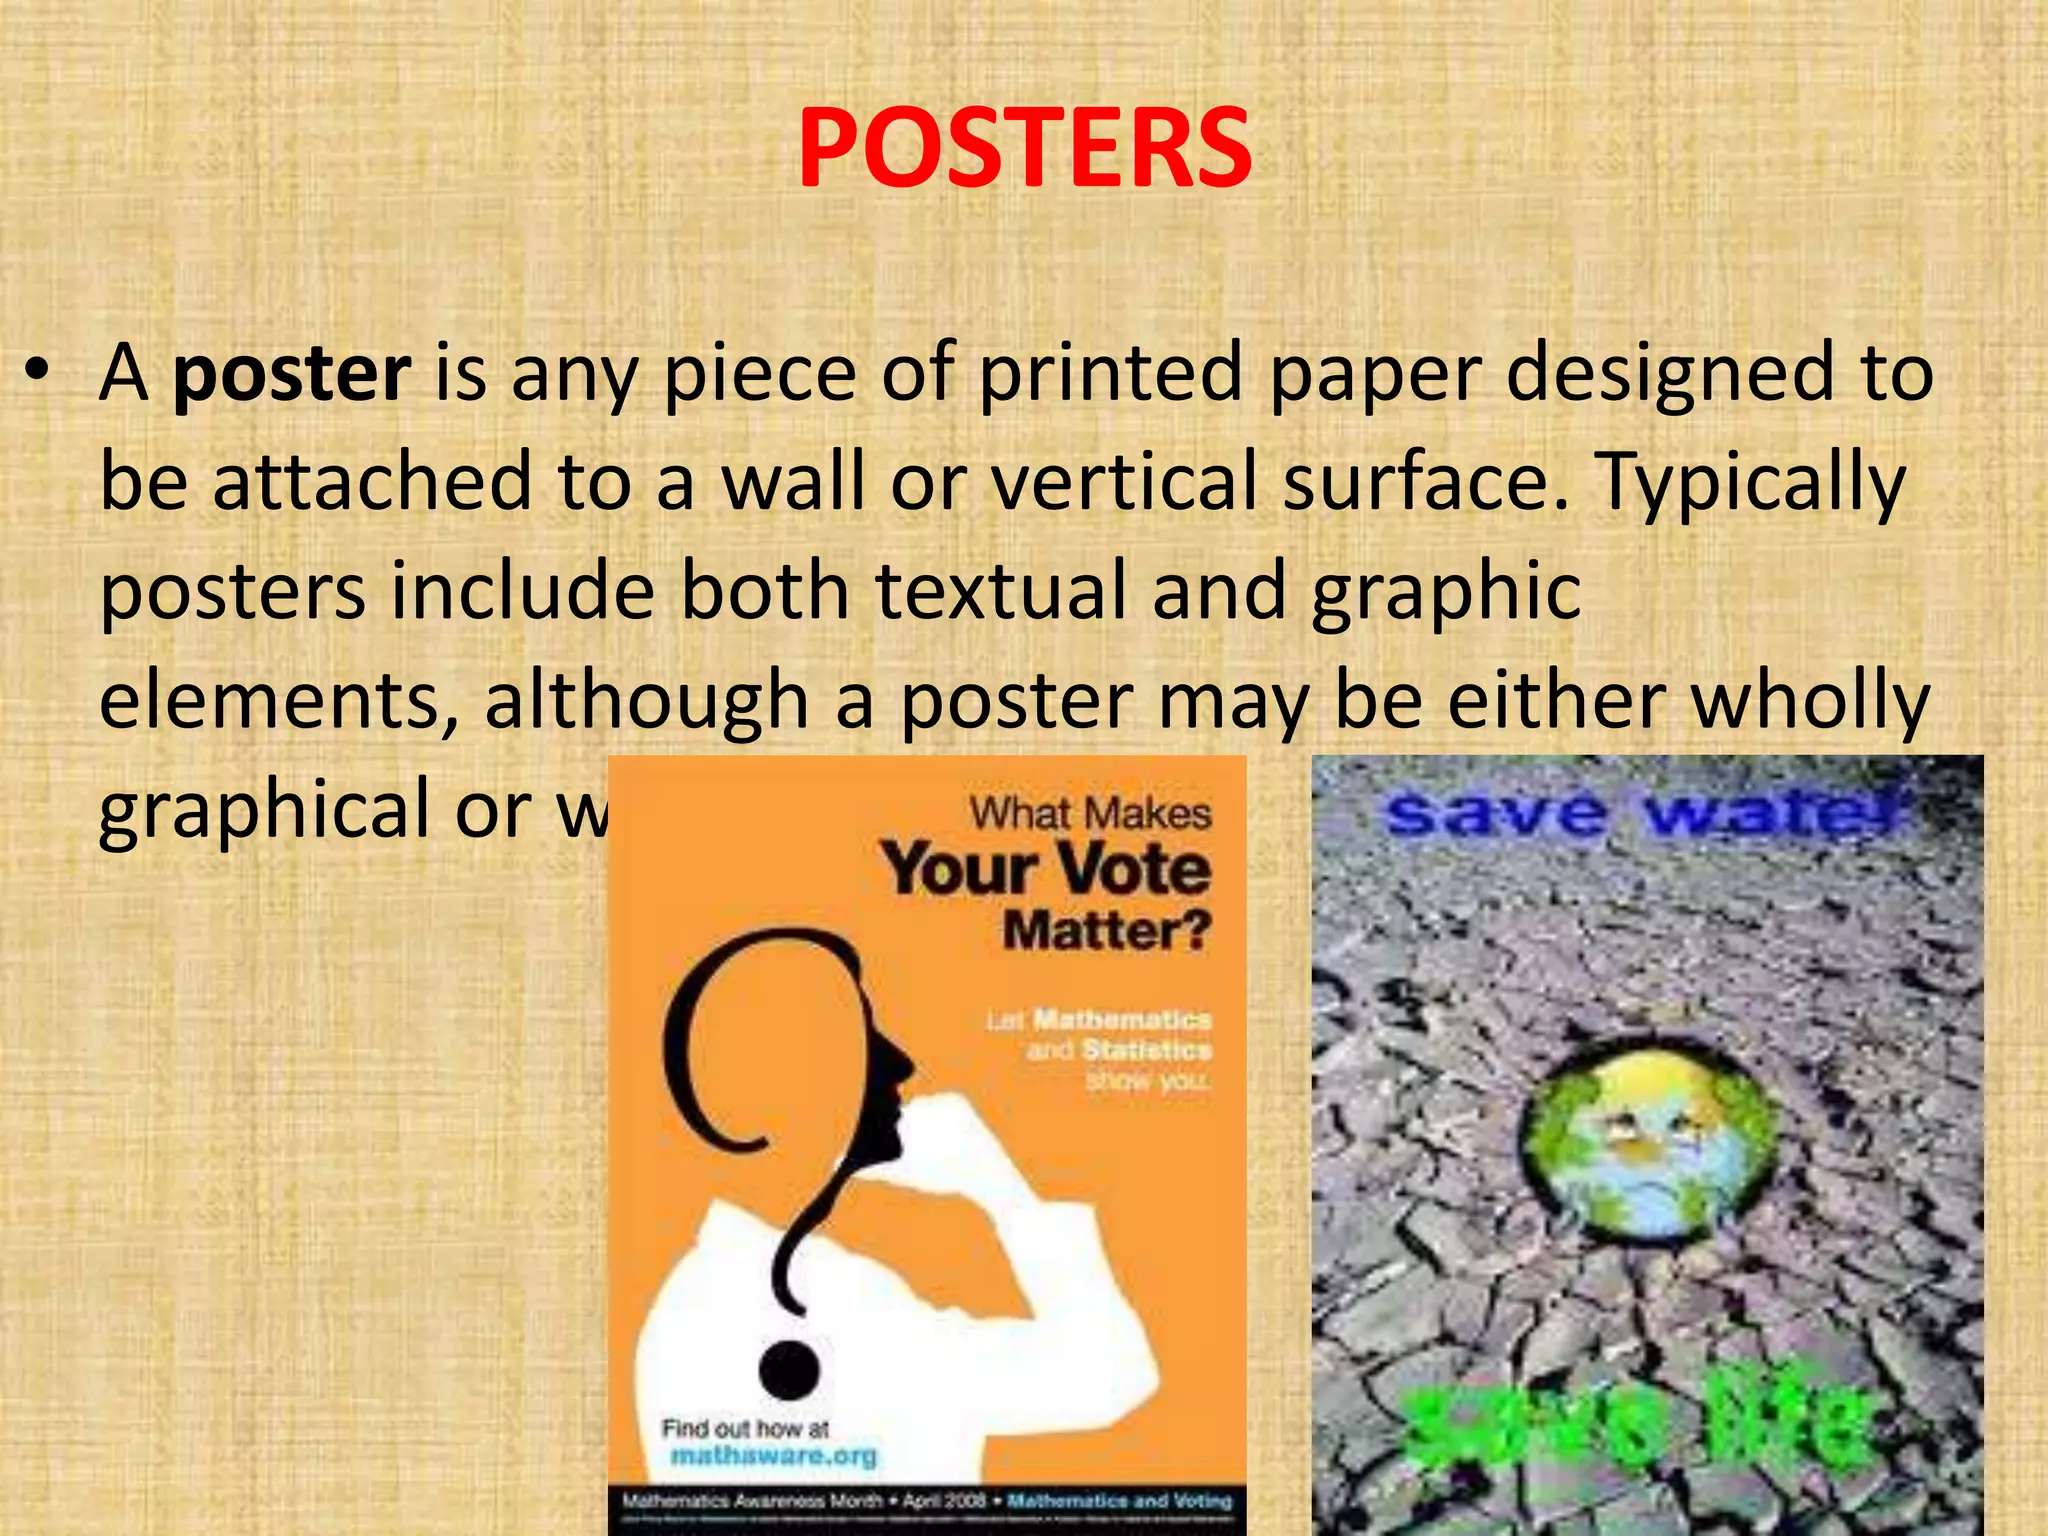
POSTERS
• A posteris any piece of printed paper designed to
be attached to a wall or vertical surface. Typically
posters include both textual and graphic
elements, although a poster may be either wholly
graphical or wholly text.
10.
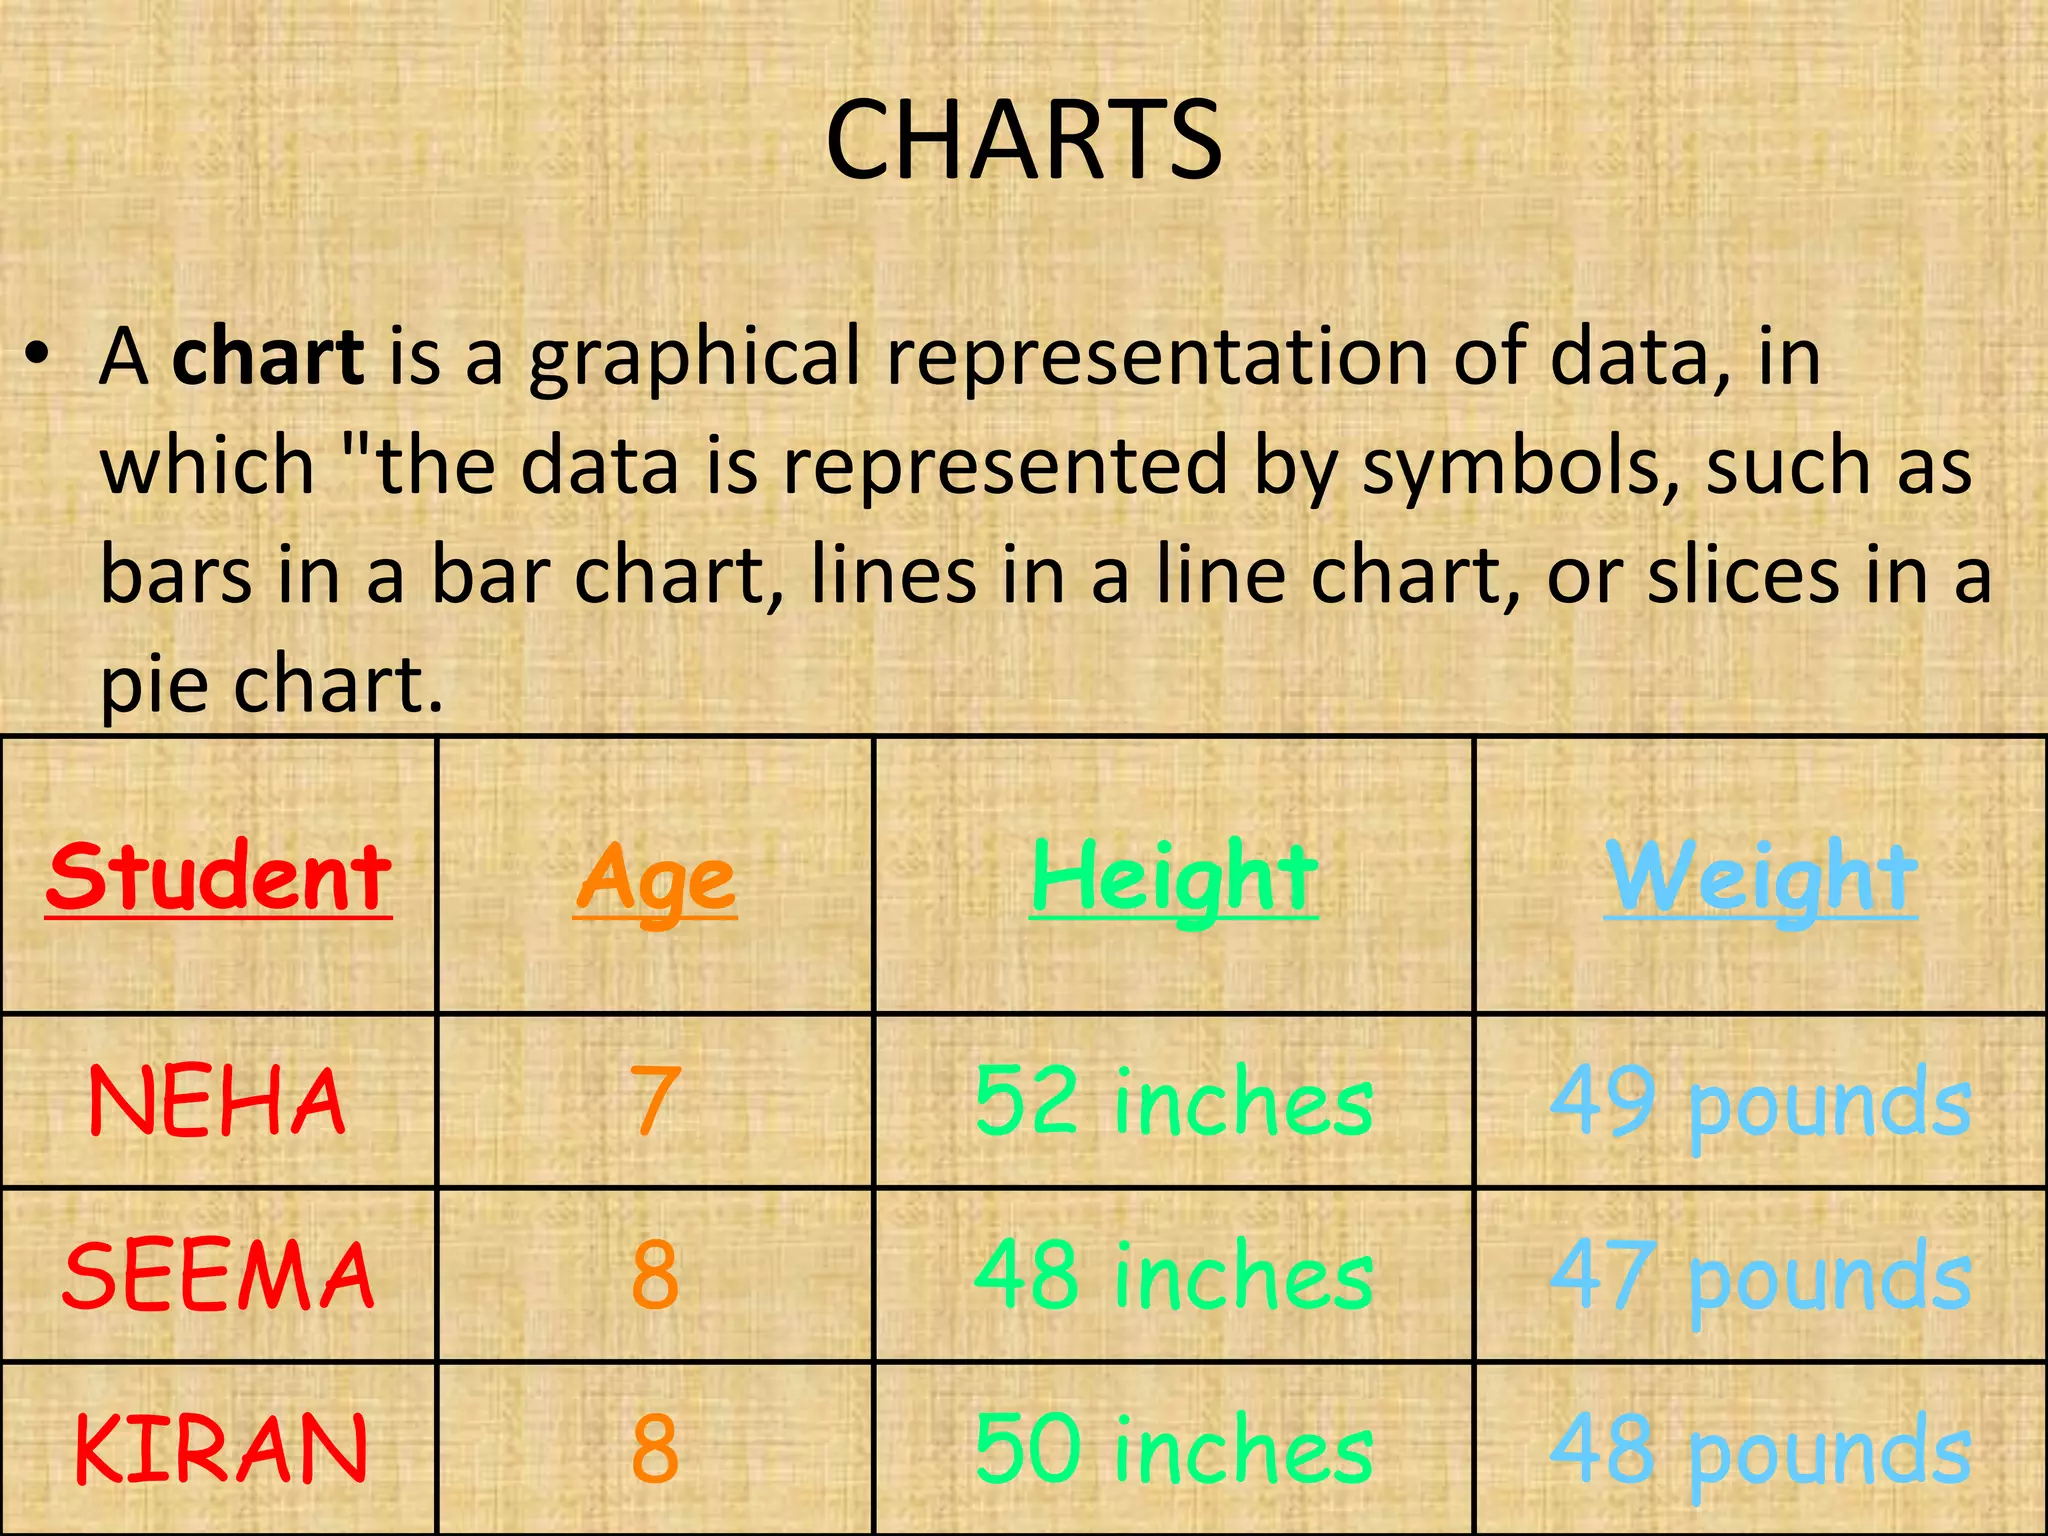
CHARTS
• A chartis a graphical representation of data, in
which "the data is represented by symbols, such as
bars in a bar chart, lines in a line chart, or slices in a
pie chart.
Student Age Height Weight
NEHA 7 52 inches 49 pounds
SEEMA 8 48 inches 47 pounds
KIRAN 8 50 inches 48 pounds
11.
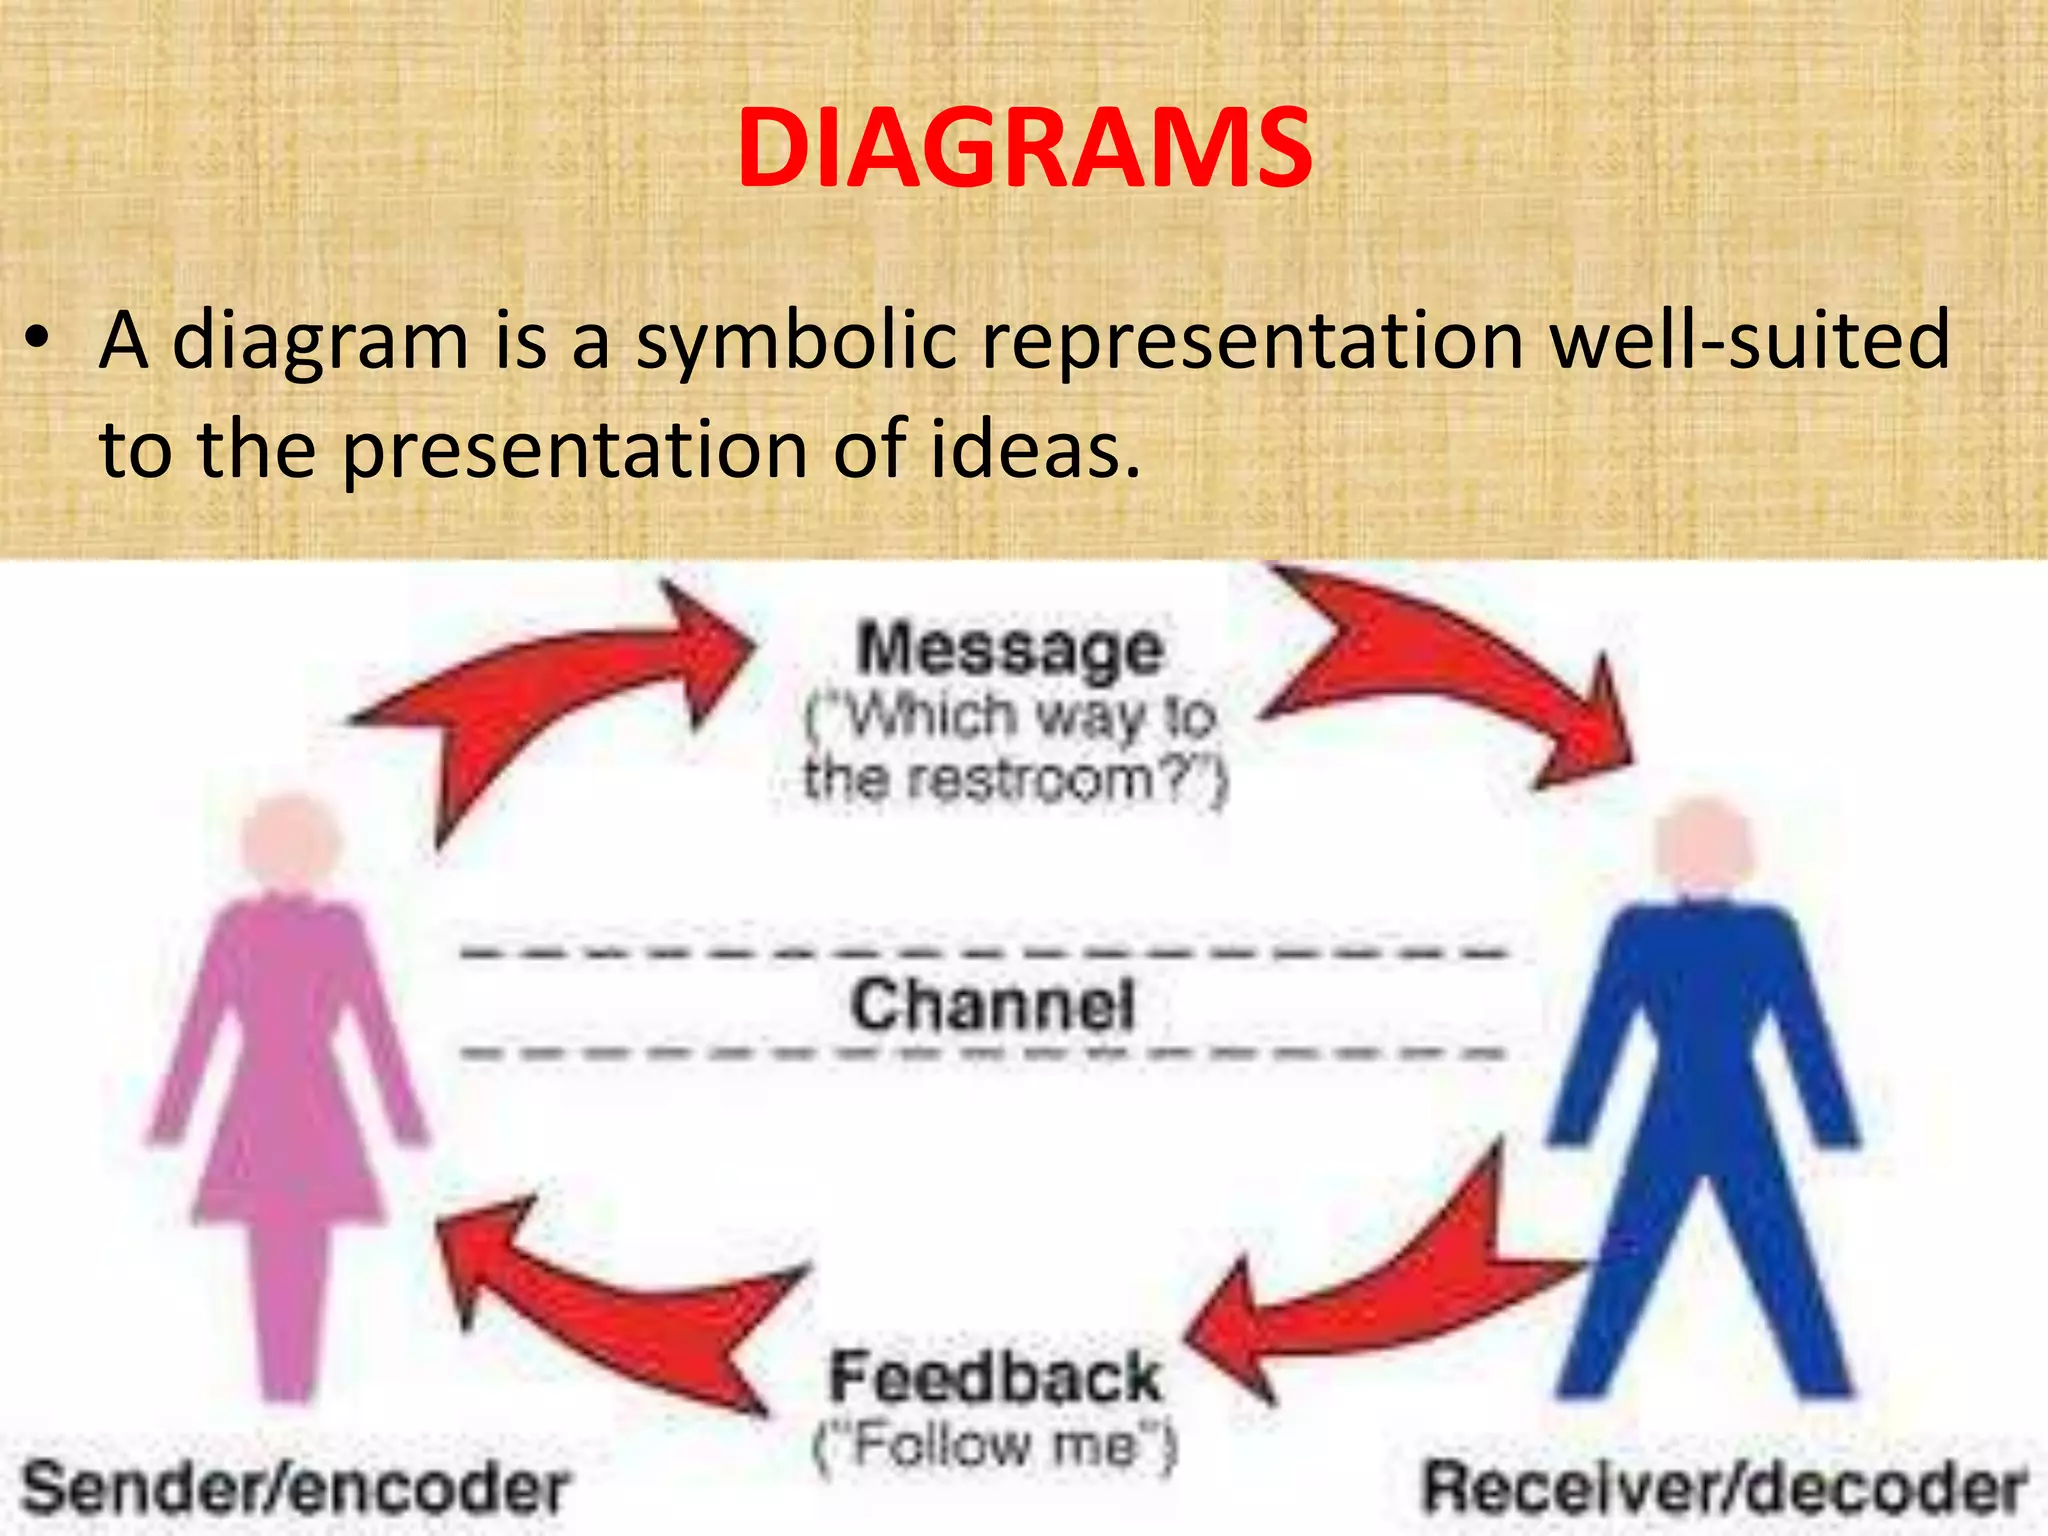
DIAGRAMS
• A diagramis a symbolic representation well-suited
to the presentation of ideas.
12.
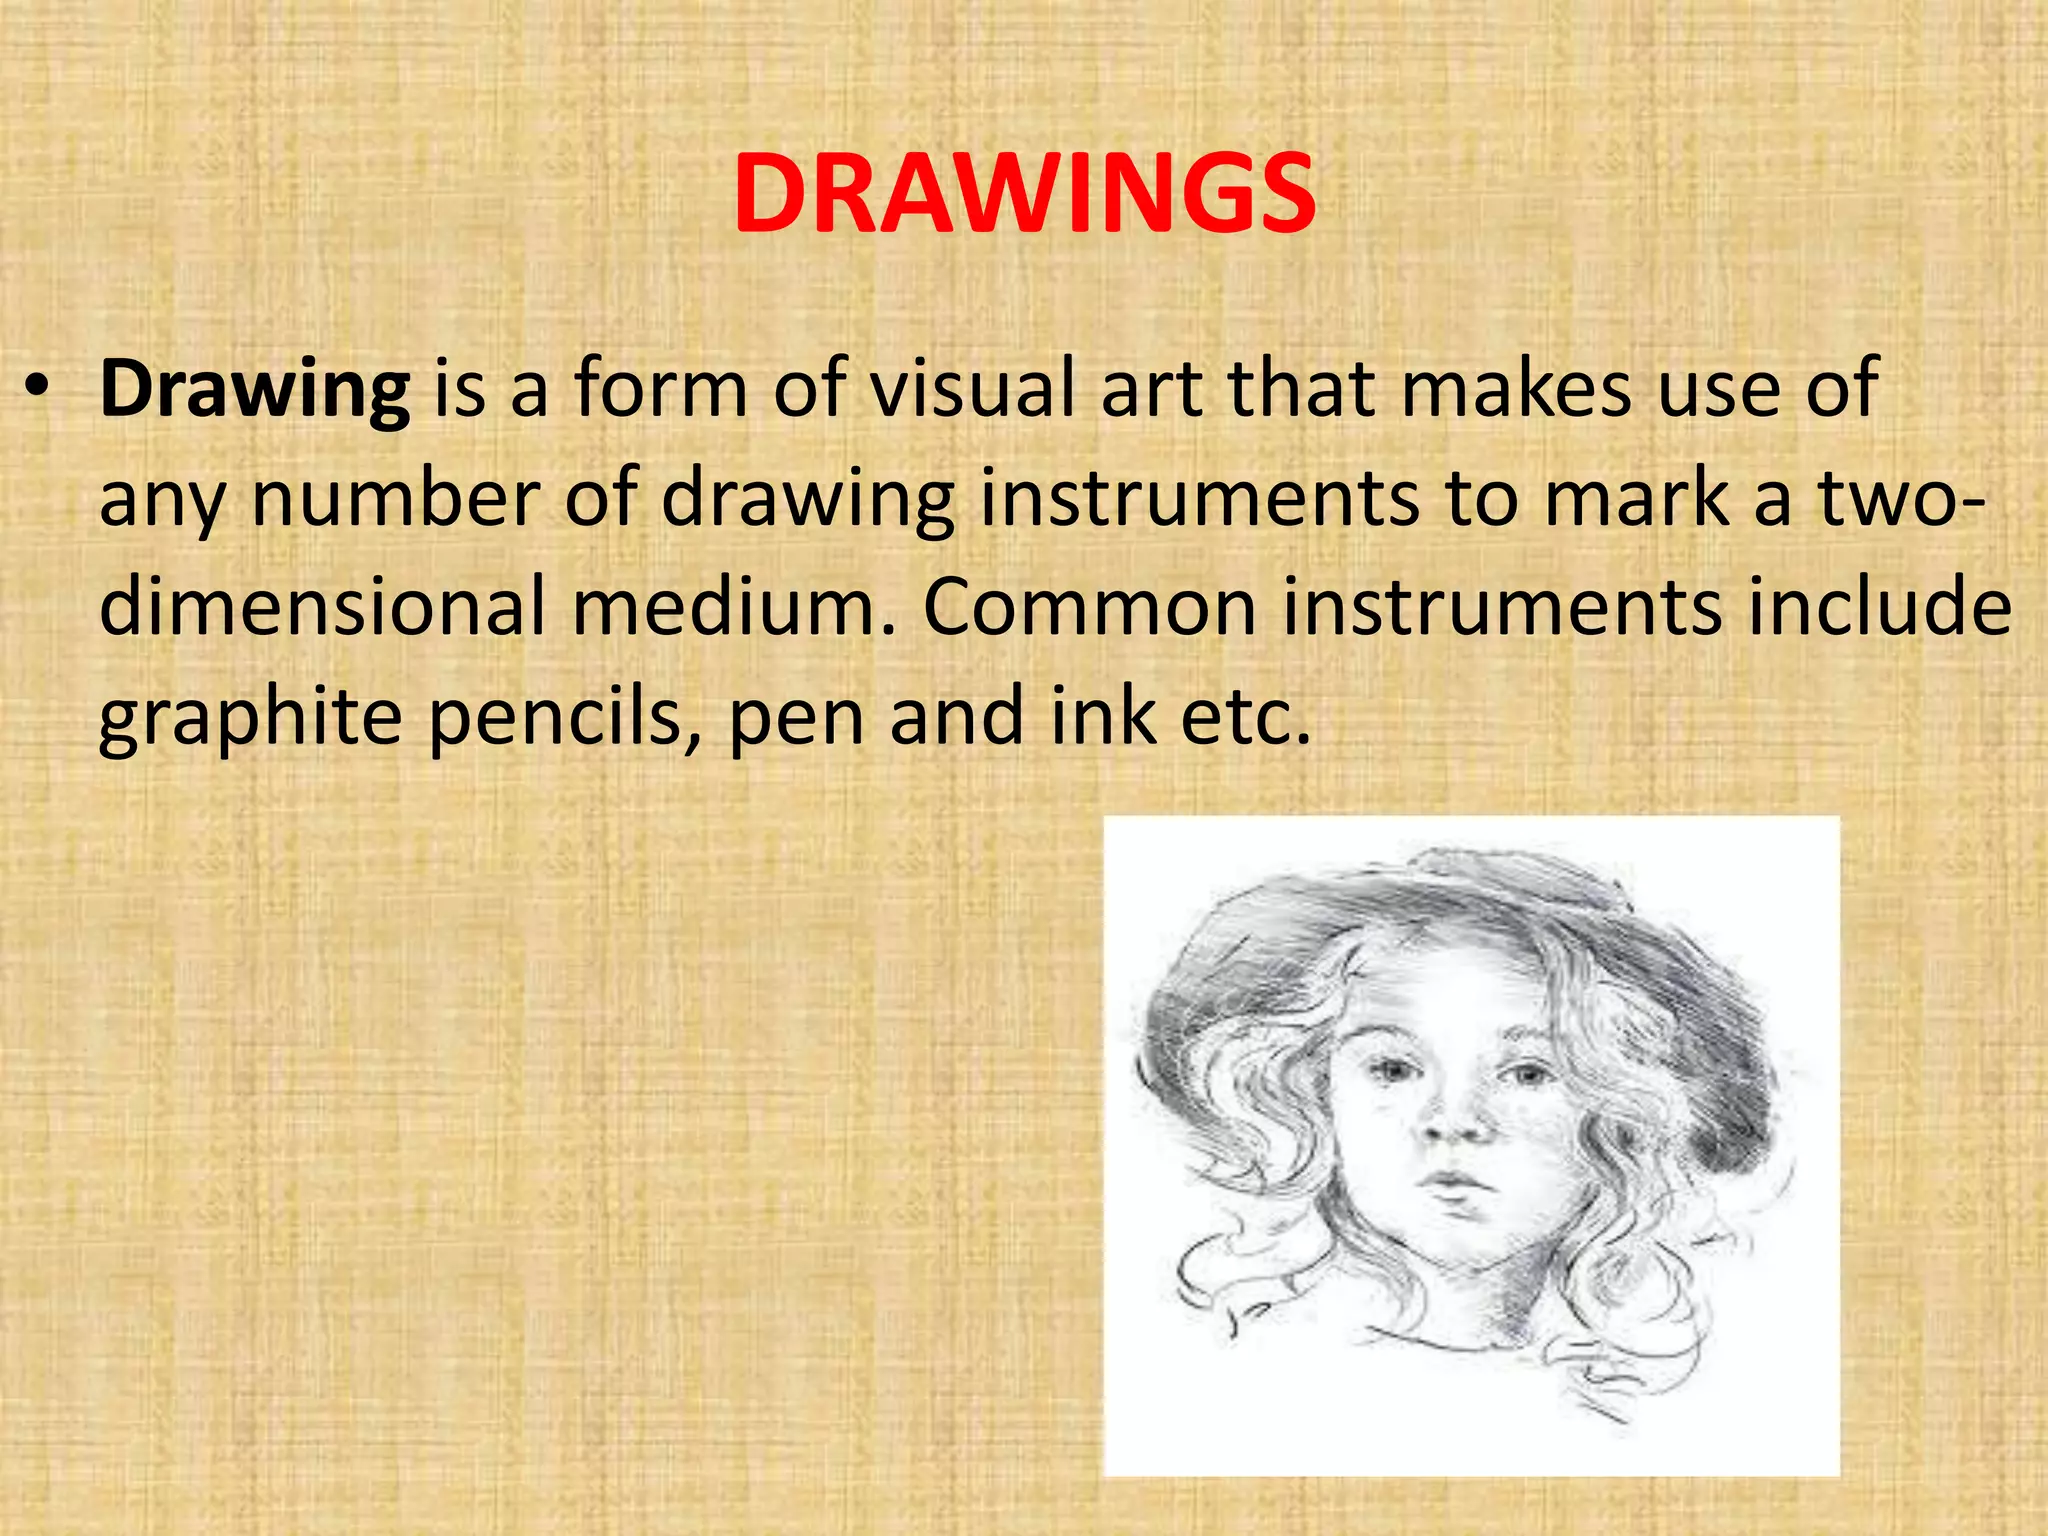
DRAWINGS
• Drawing isa form of visual art that makes use of
any number of drawing instruments to mark a two-
dimensional medium. Common instruments include
graphite pencils, pen and ink etc.
13.
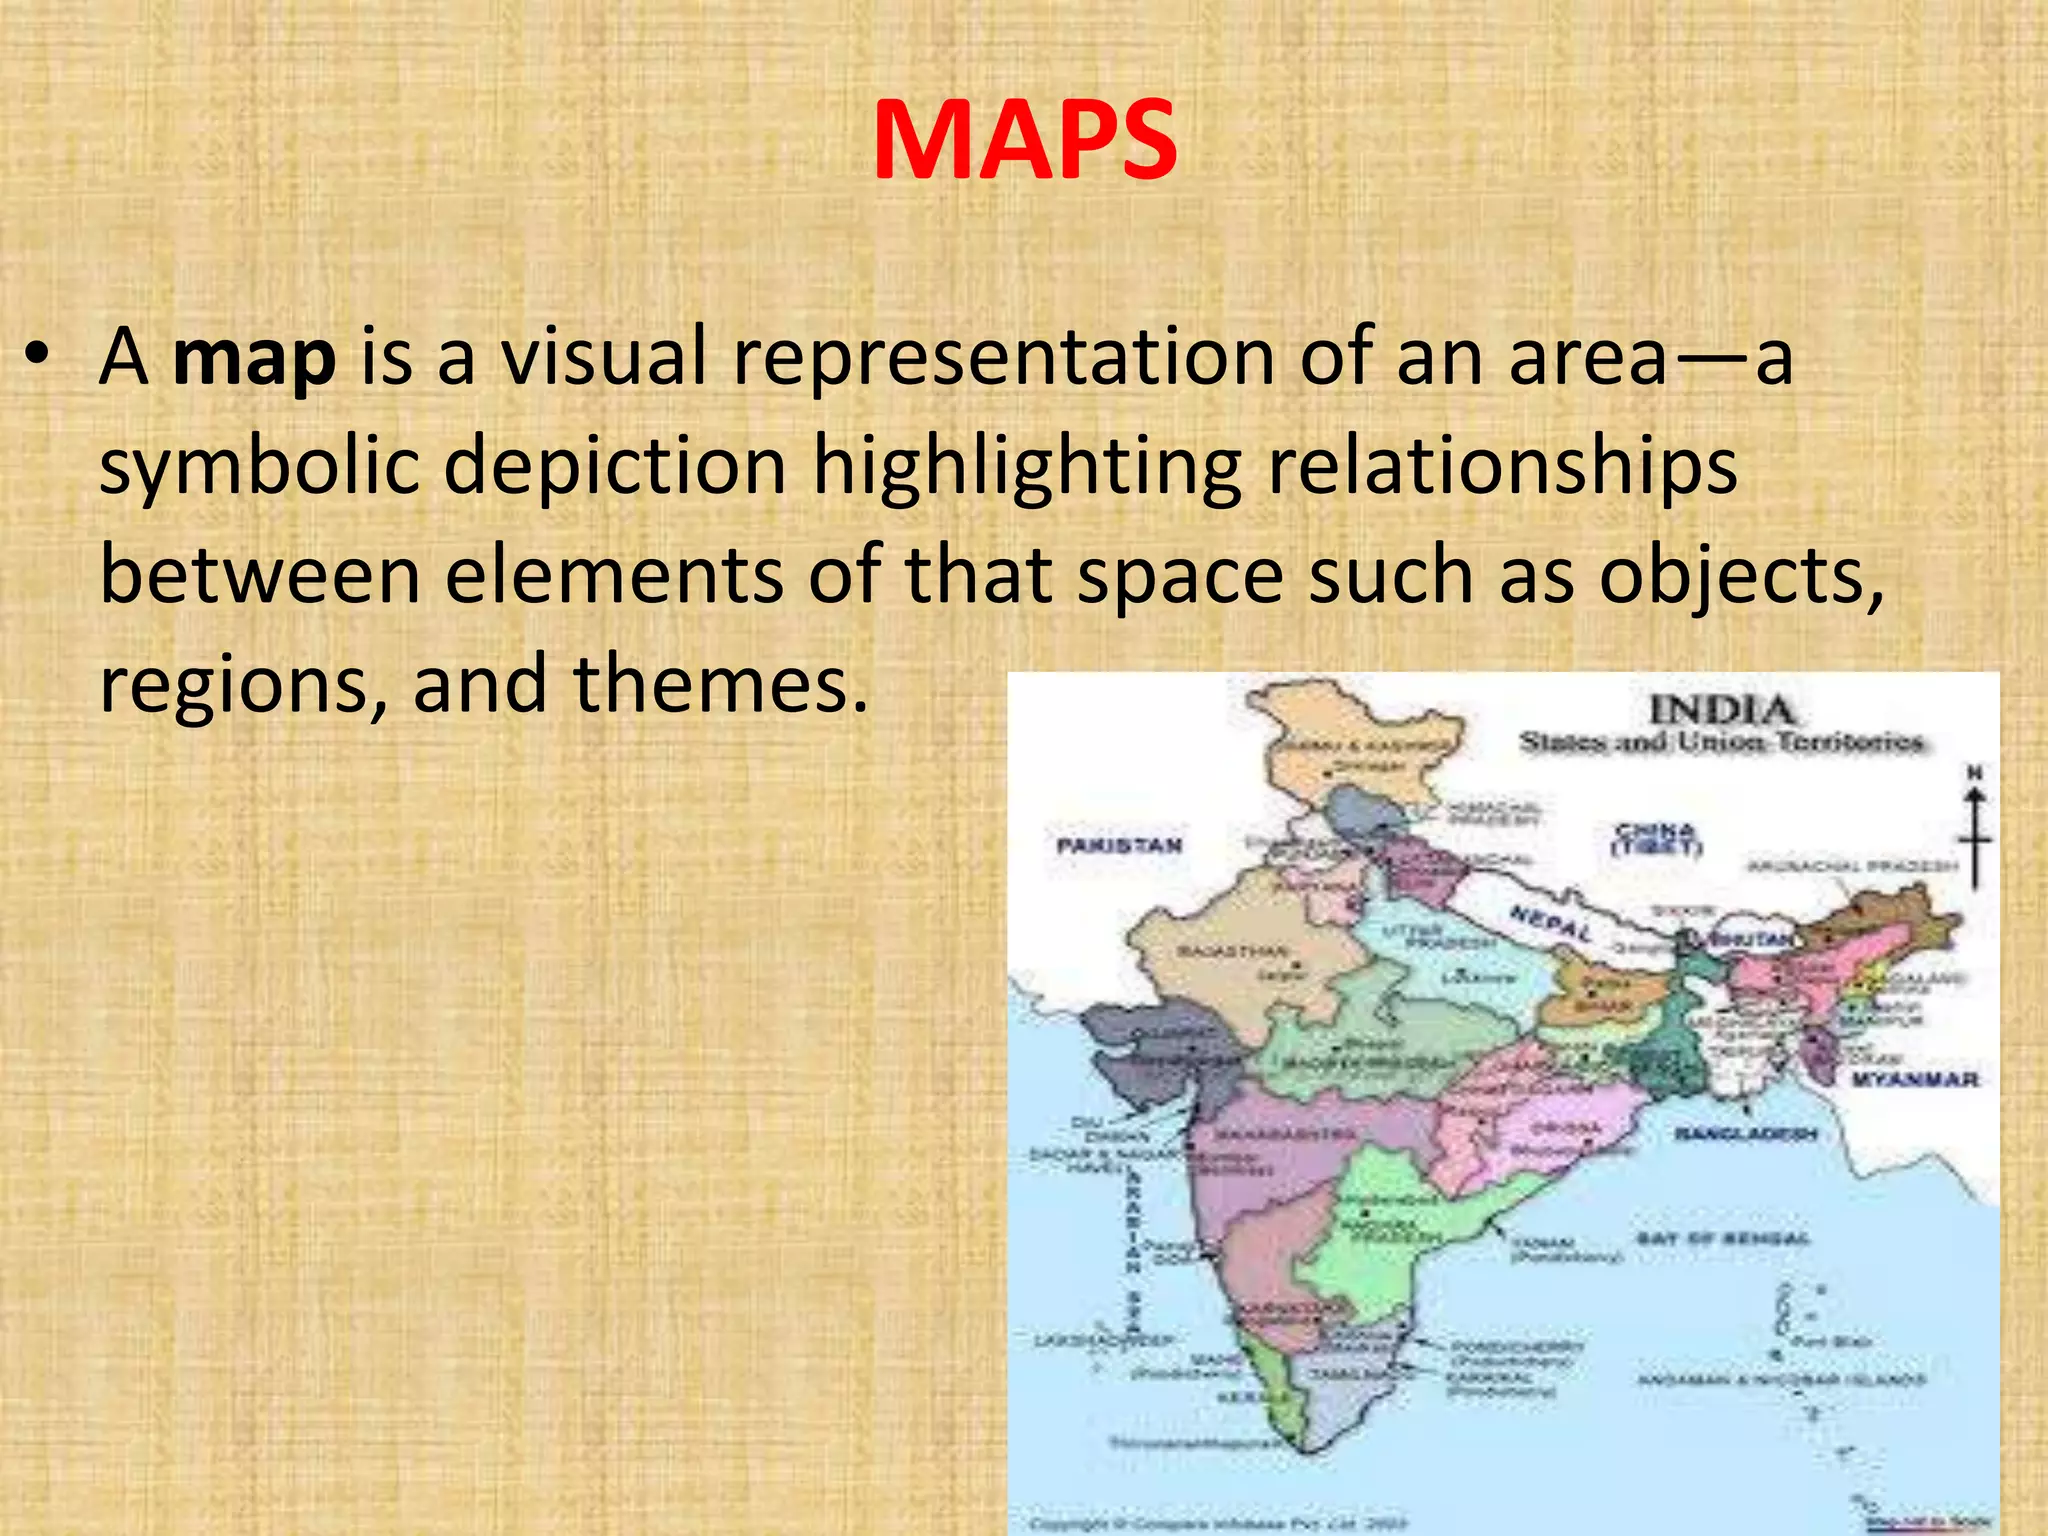
MAPS
• A mapis a visual representation of an area—a
symbolic depiction highlighting relationships
between elements of that space such as objects,
regions, and themes.
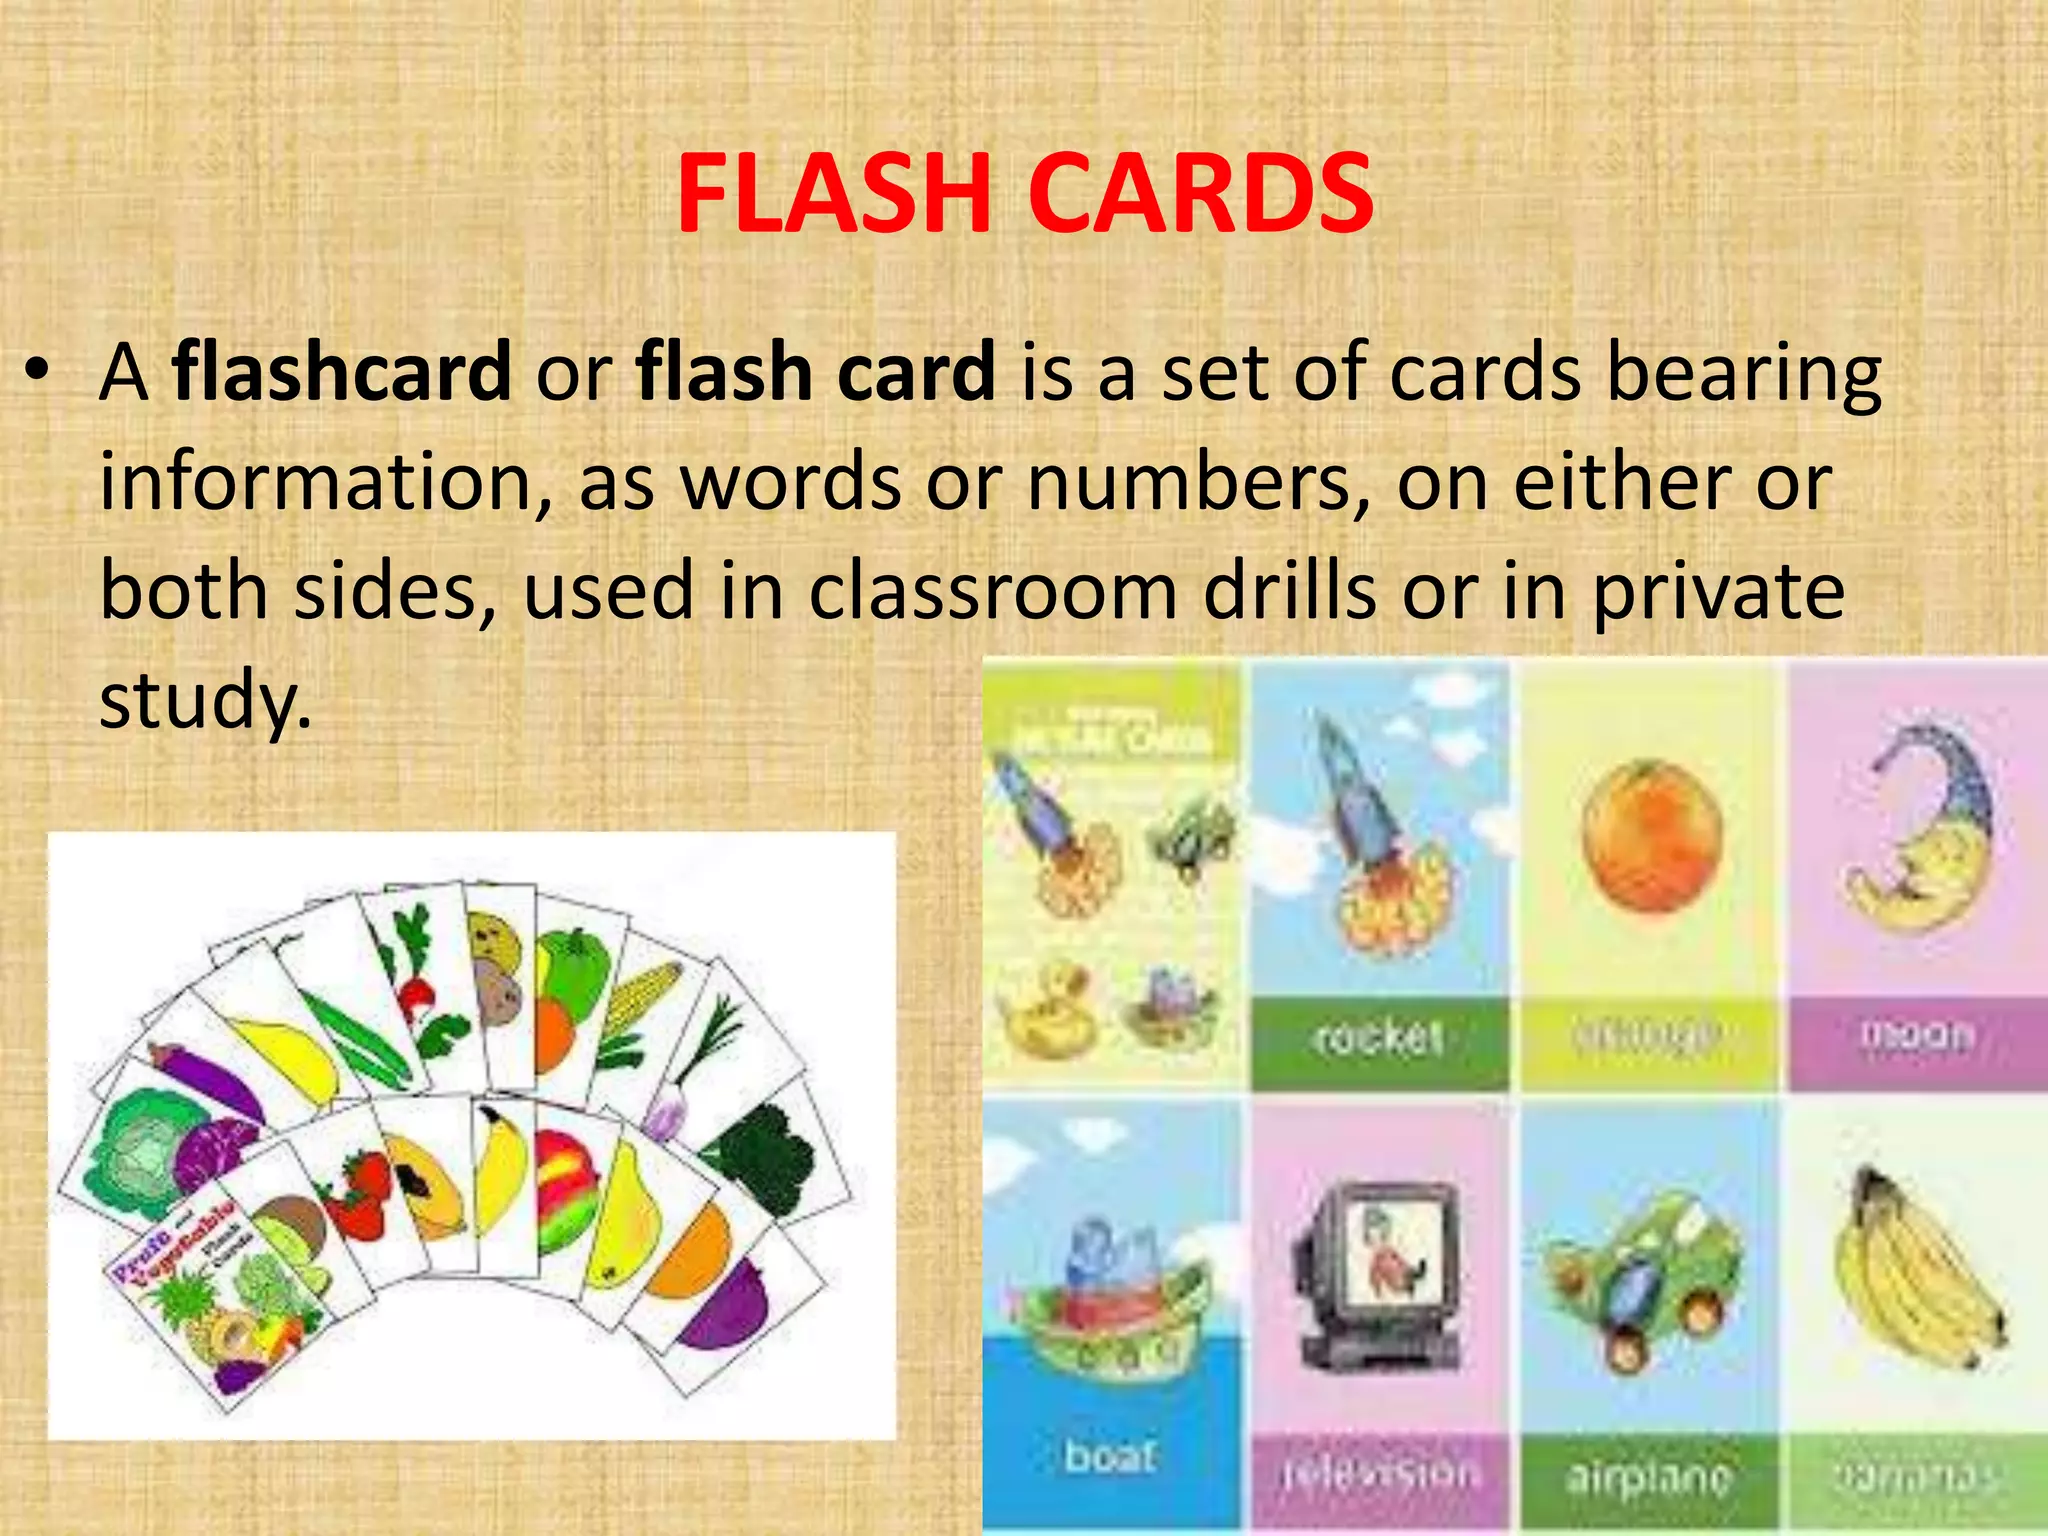
FLASH CARDS
• Aflashcard or flash card is a set of cards bearing
information, as words or numbers, on either or
both sides, used in classroom drills or in private
study.
16.
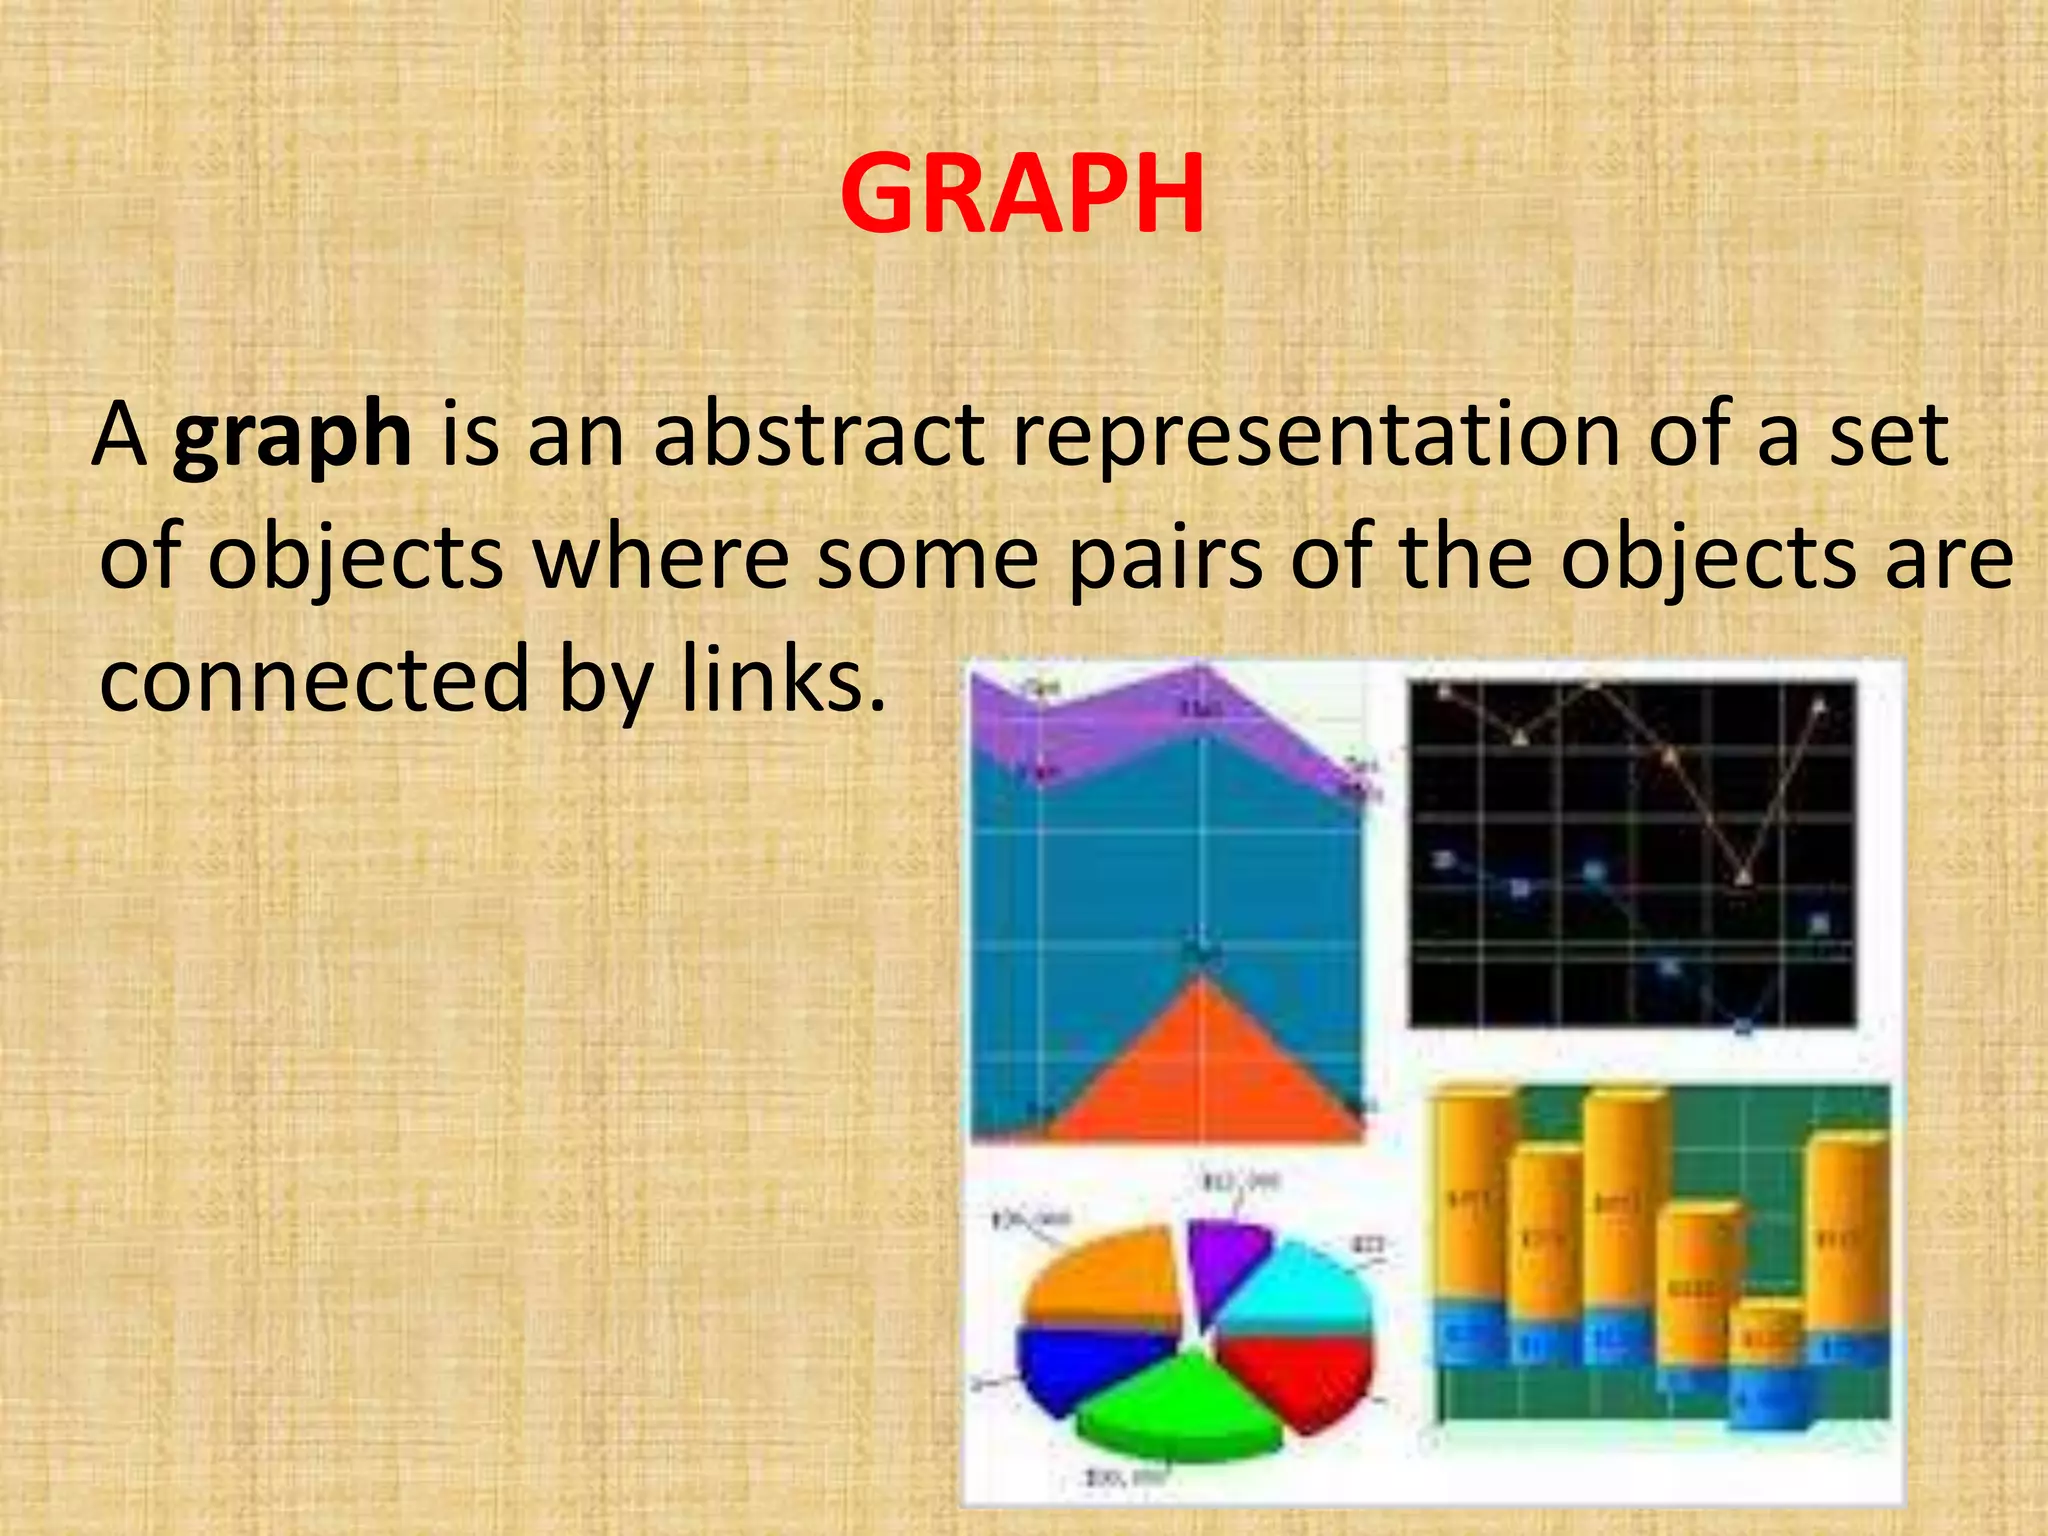
GRAPH
A graph isan abstract representation of a set
of objects where some pairs of the objects are
connected by links.
17.
Five Types ofGraphs
5 common types of graphic aids are:
• Bar graphs
• Line graphs
• Pie charts
• Flowcharts
• Tables
18.
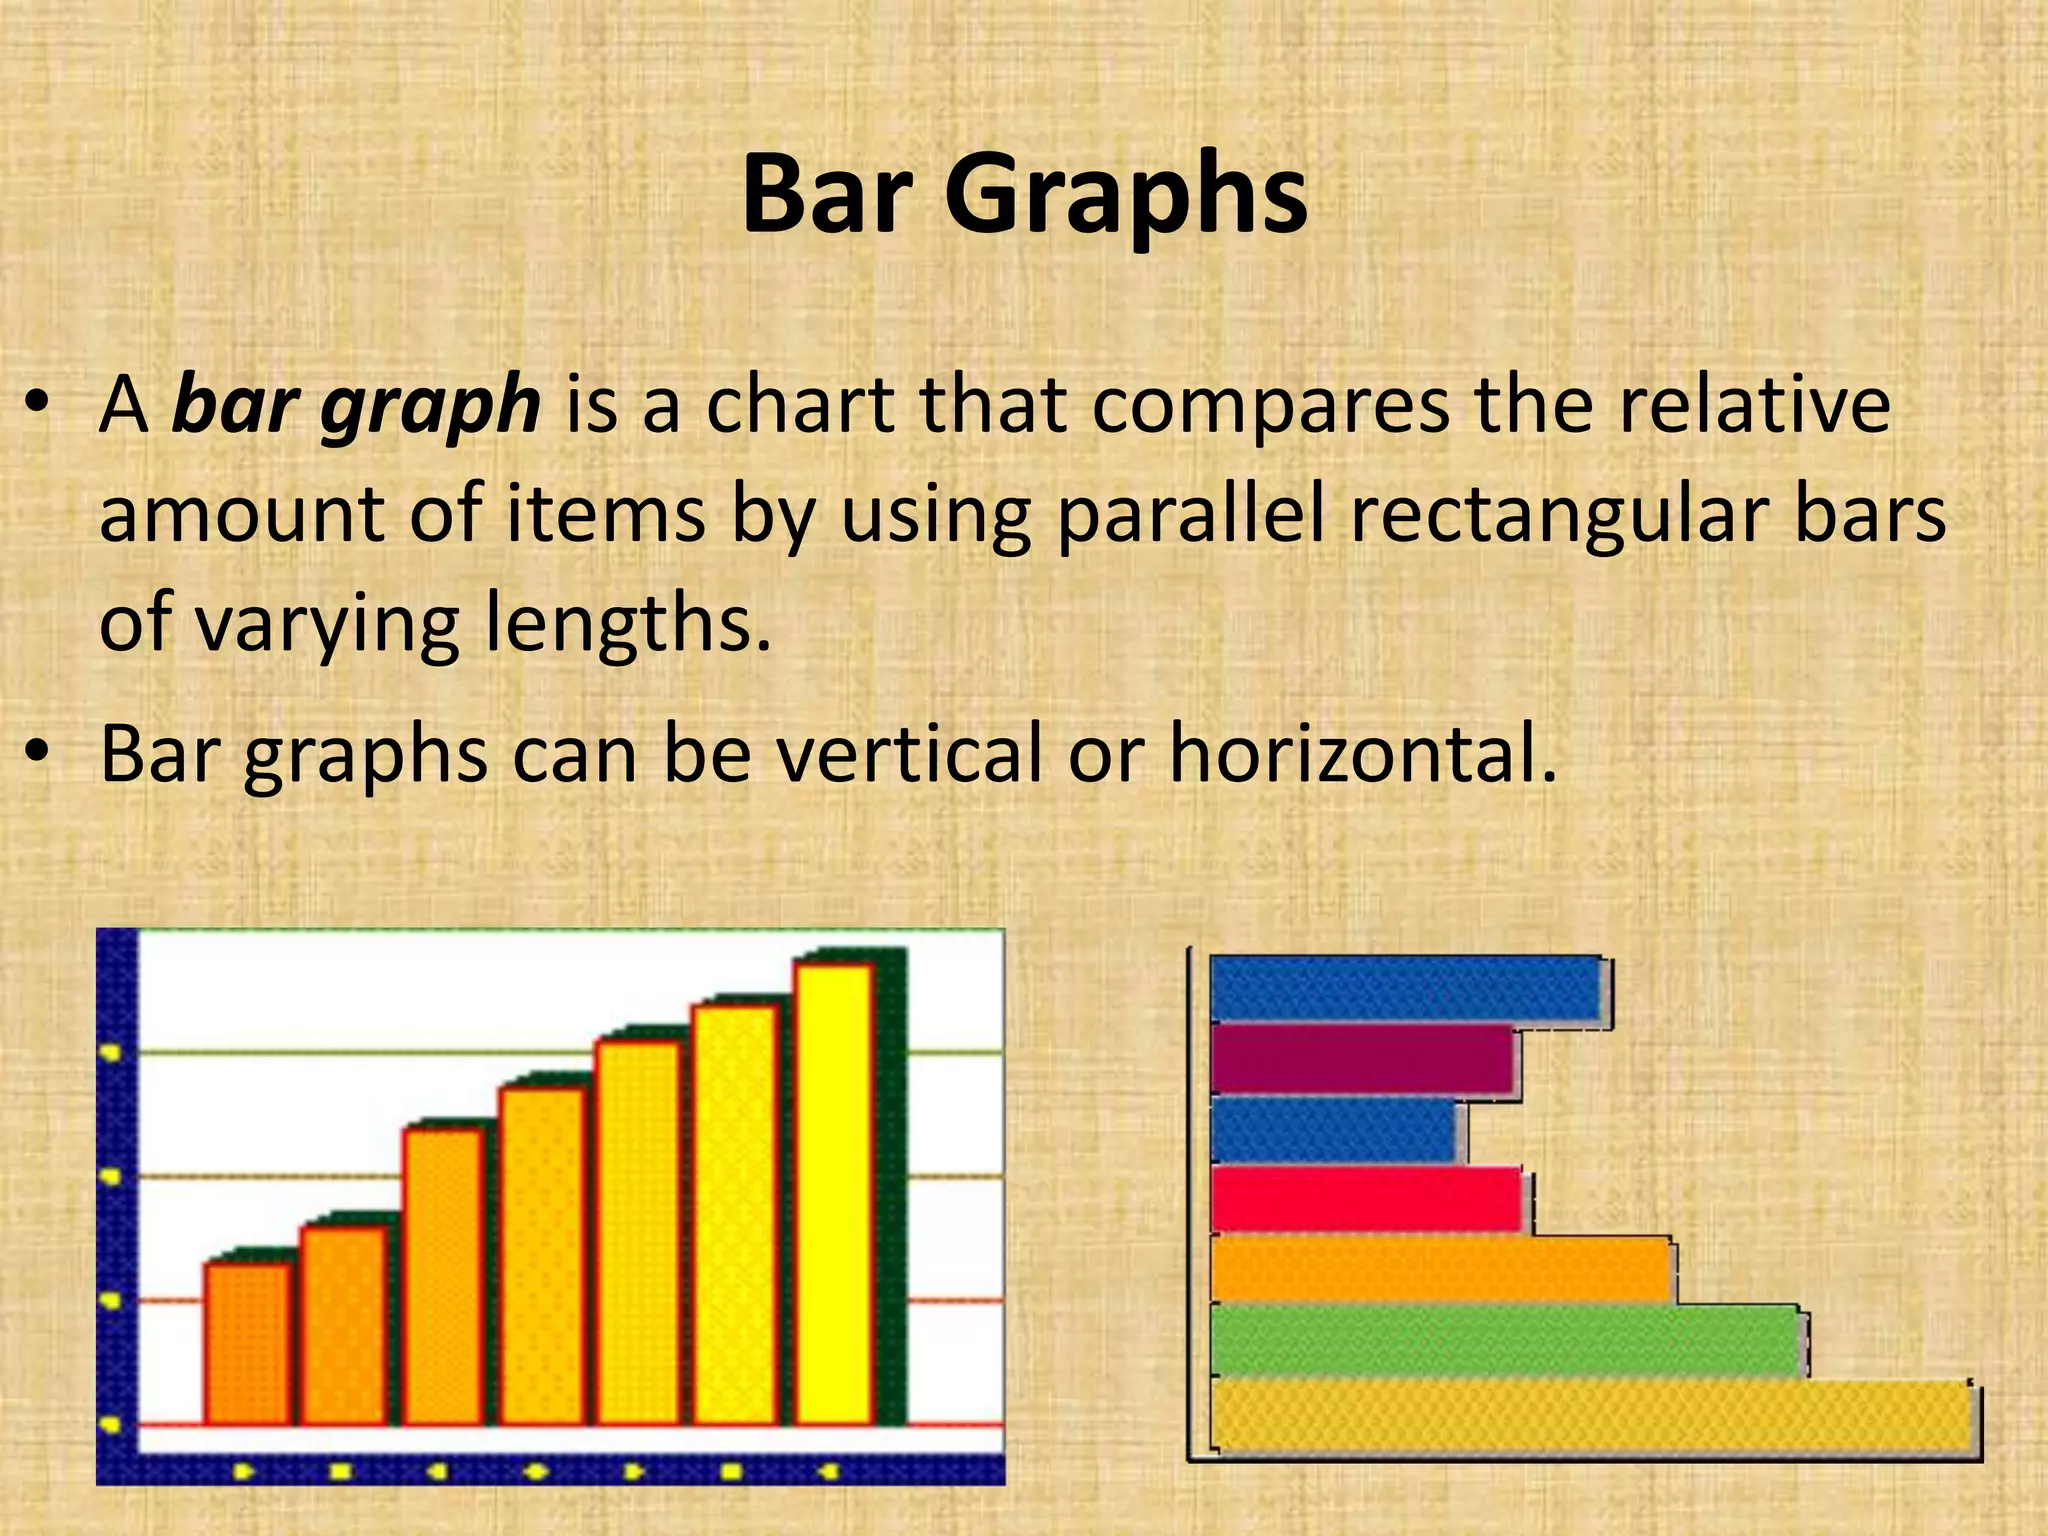
Bar Graphs
• Abar graph is a chart that compares the relative
amount of items by using parallel rectangular bars
of varying lengths.
• Bar graphs can be vertical or horizontal.
19.
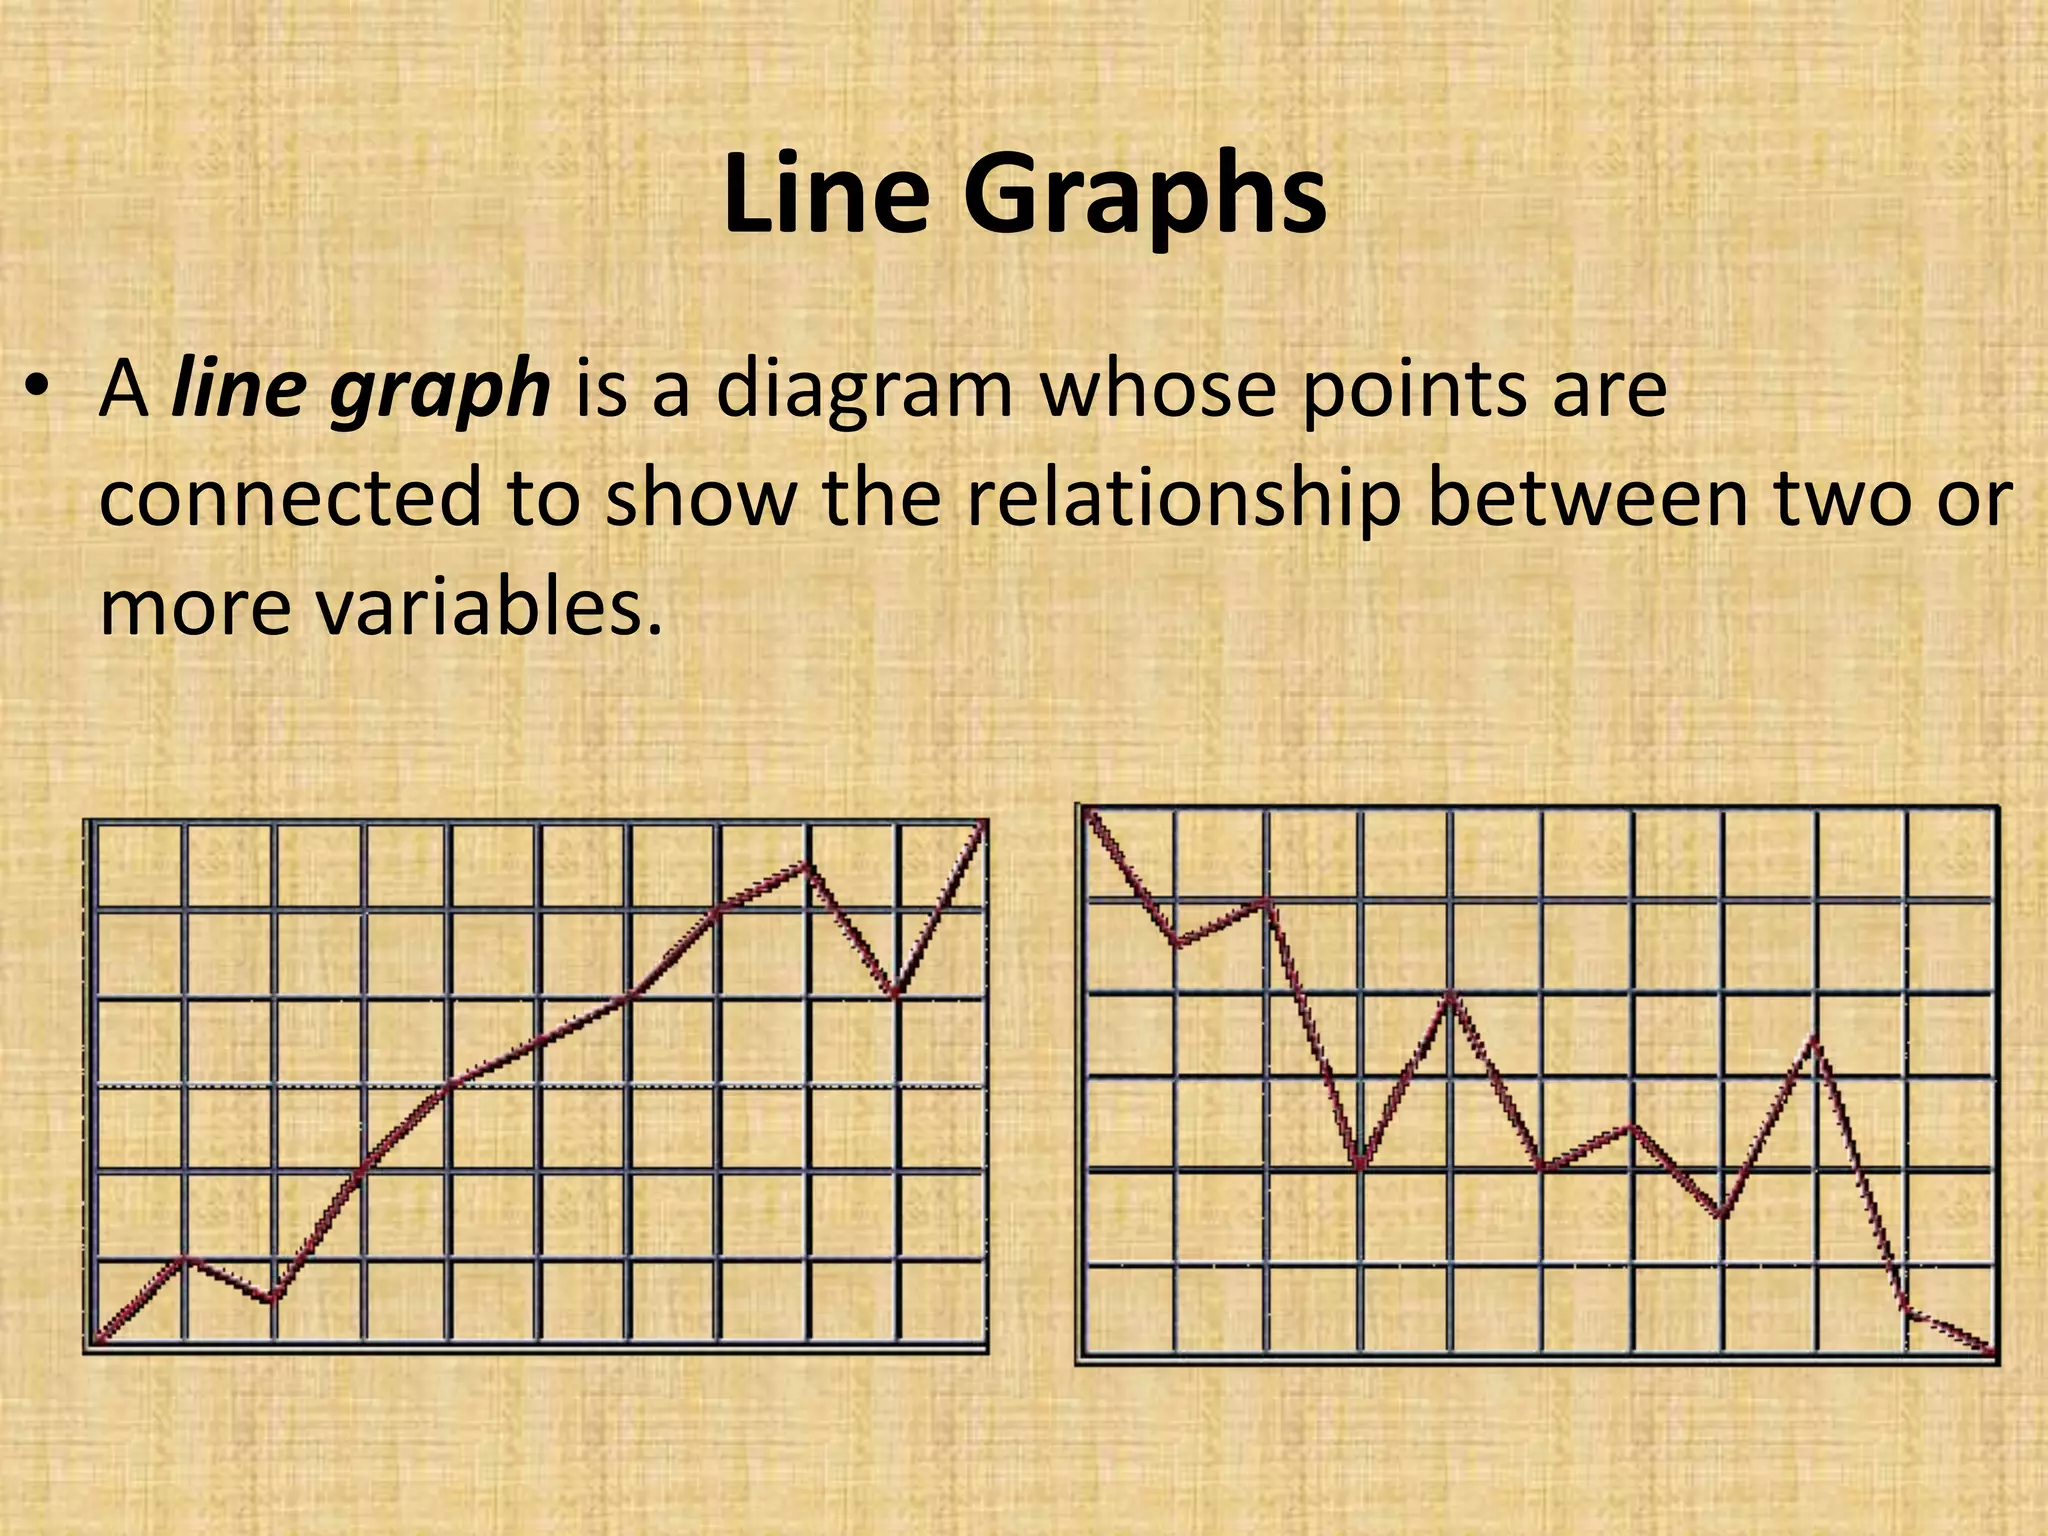
Line Graphs
• Aline graph is a diagram whose points are
connected to show the relationship between two or
more variables.
20.
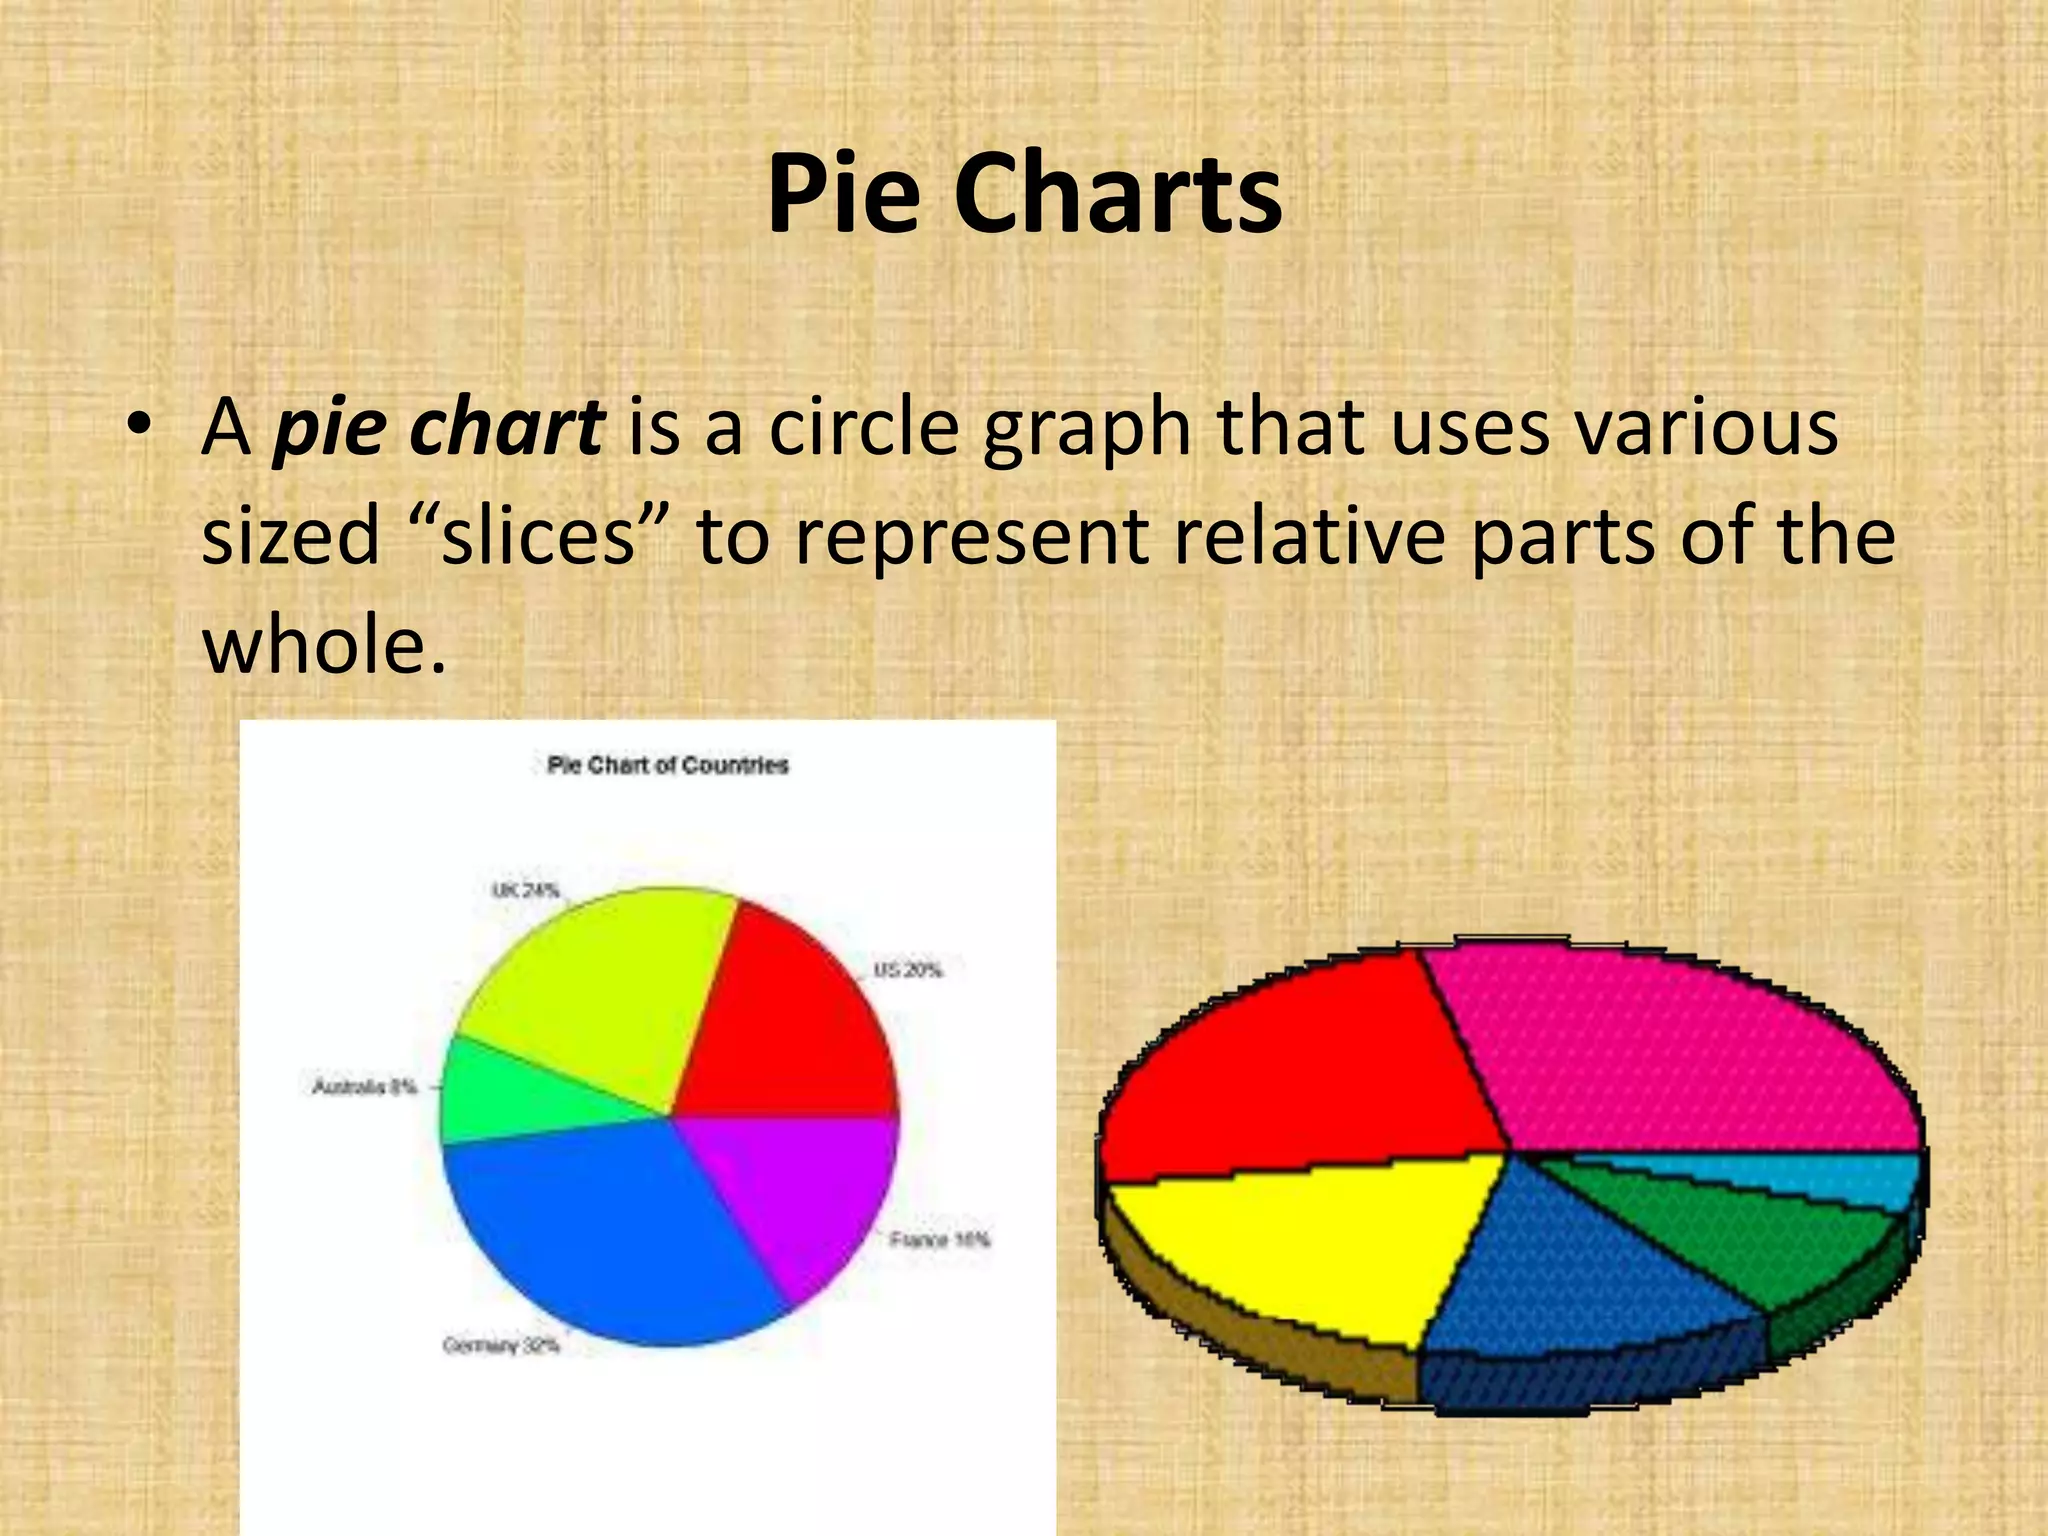
Pie Charts
• Apie chart is a circle graph that uses various
sized “slices” to represent relative parts of the
whole.
21.
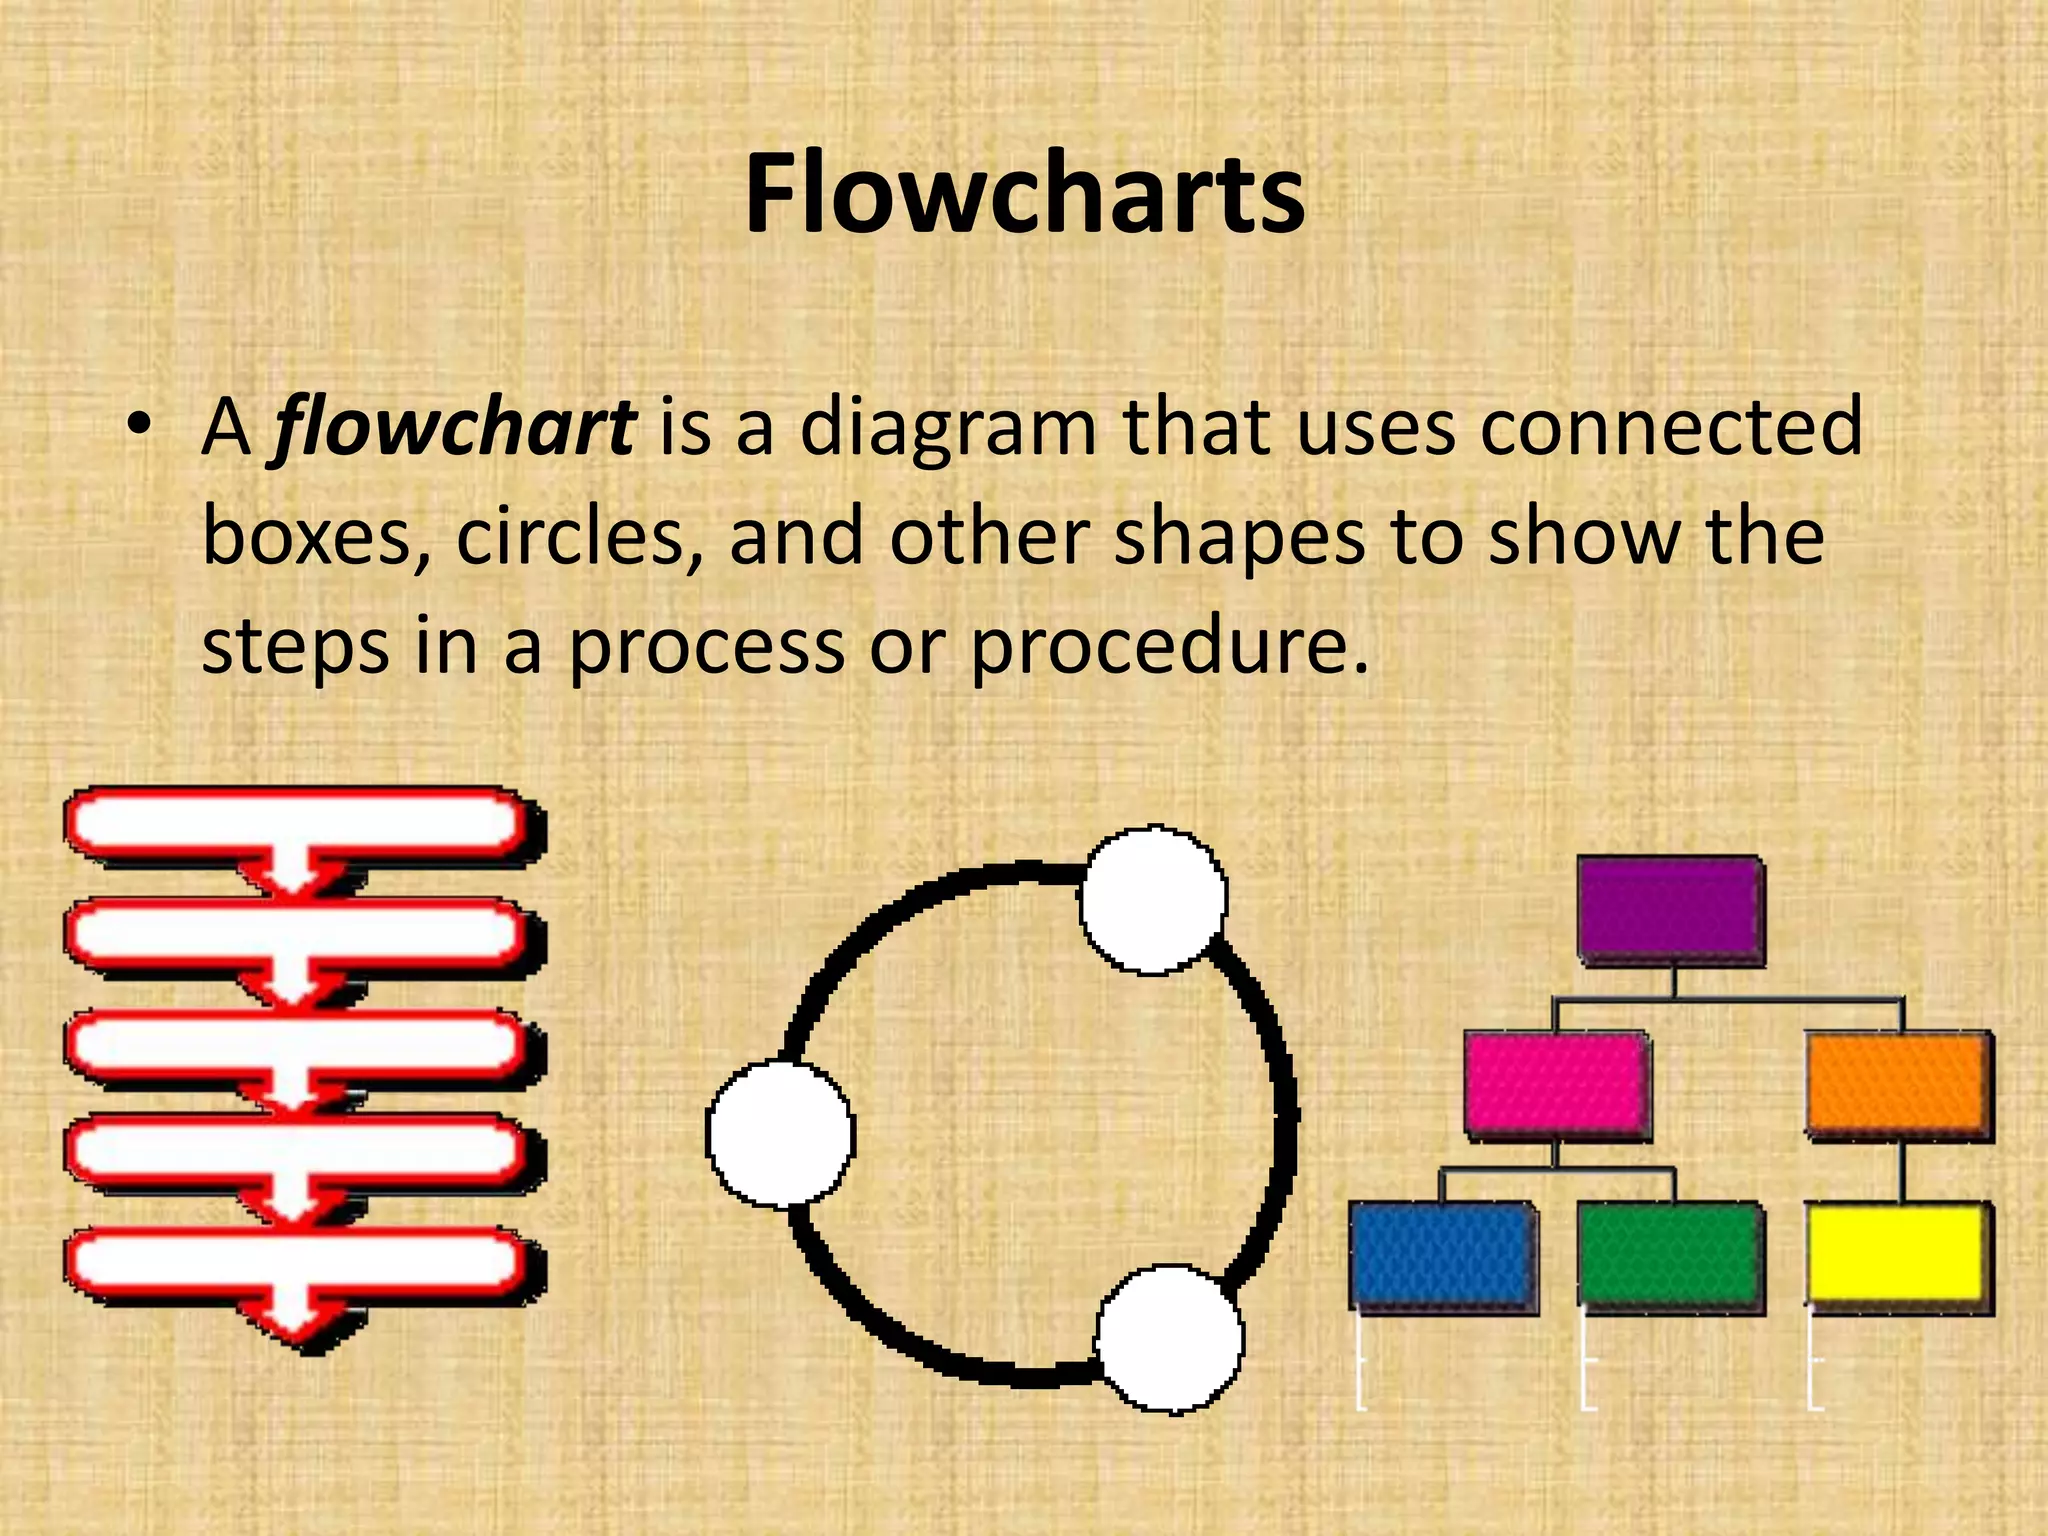
Flowcharts
• A flowchartis a diagram that uses connected
boxes, circles, and other shapes to show the
steps in a process or procedure.
22.
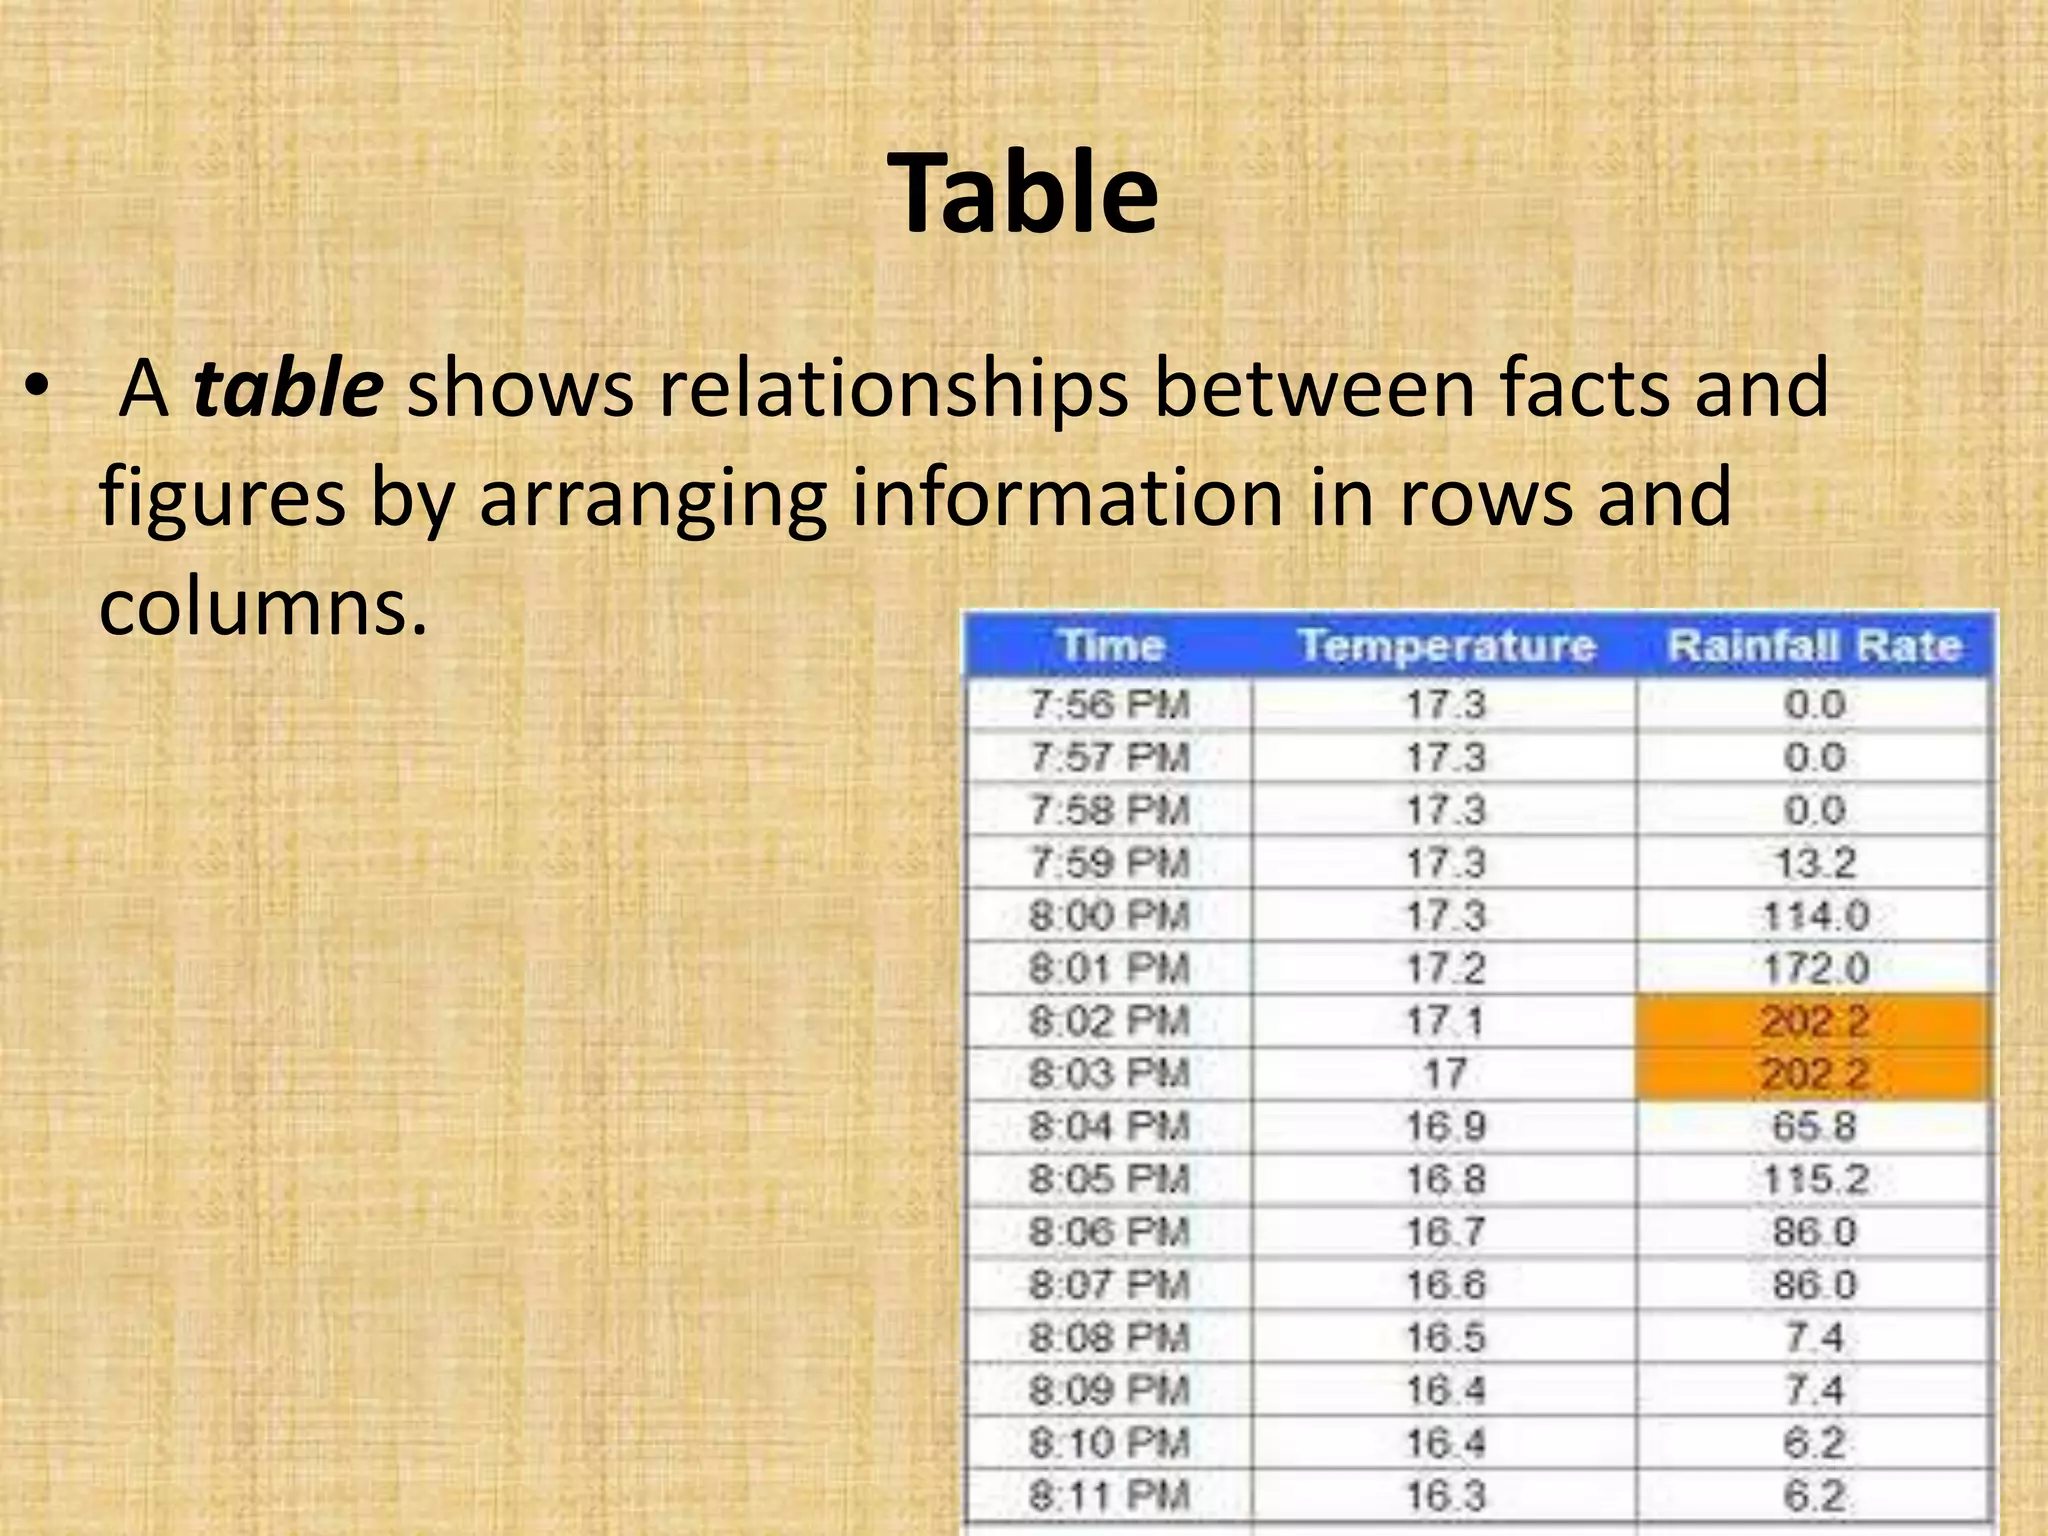
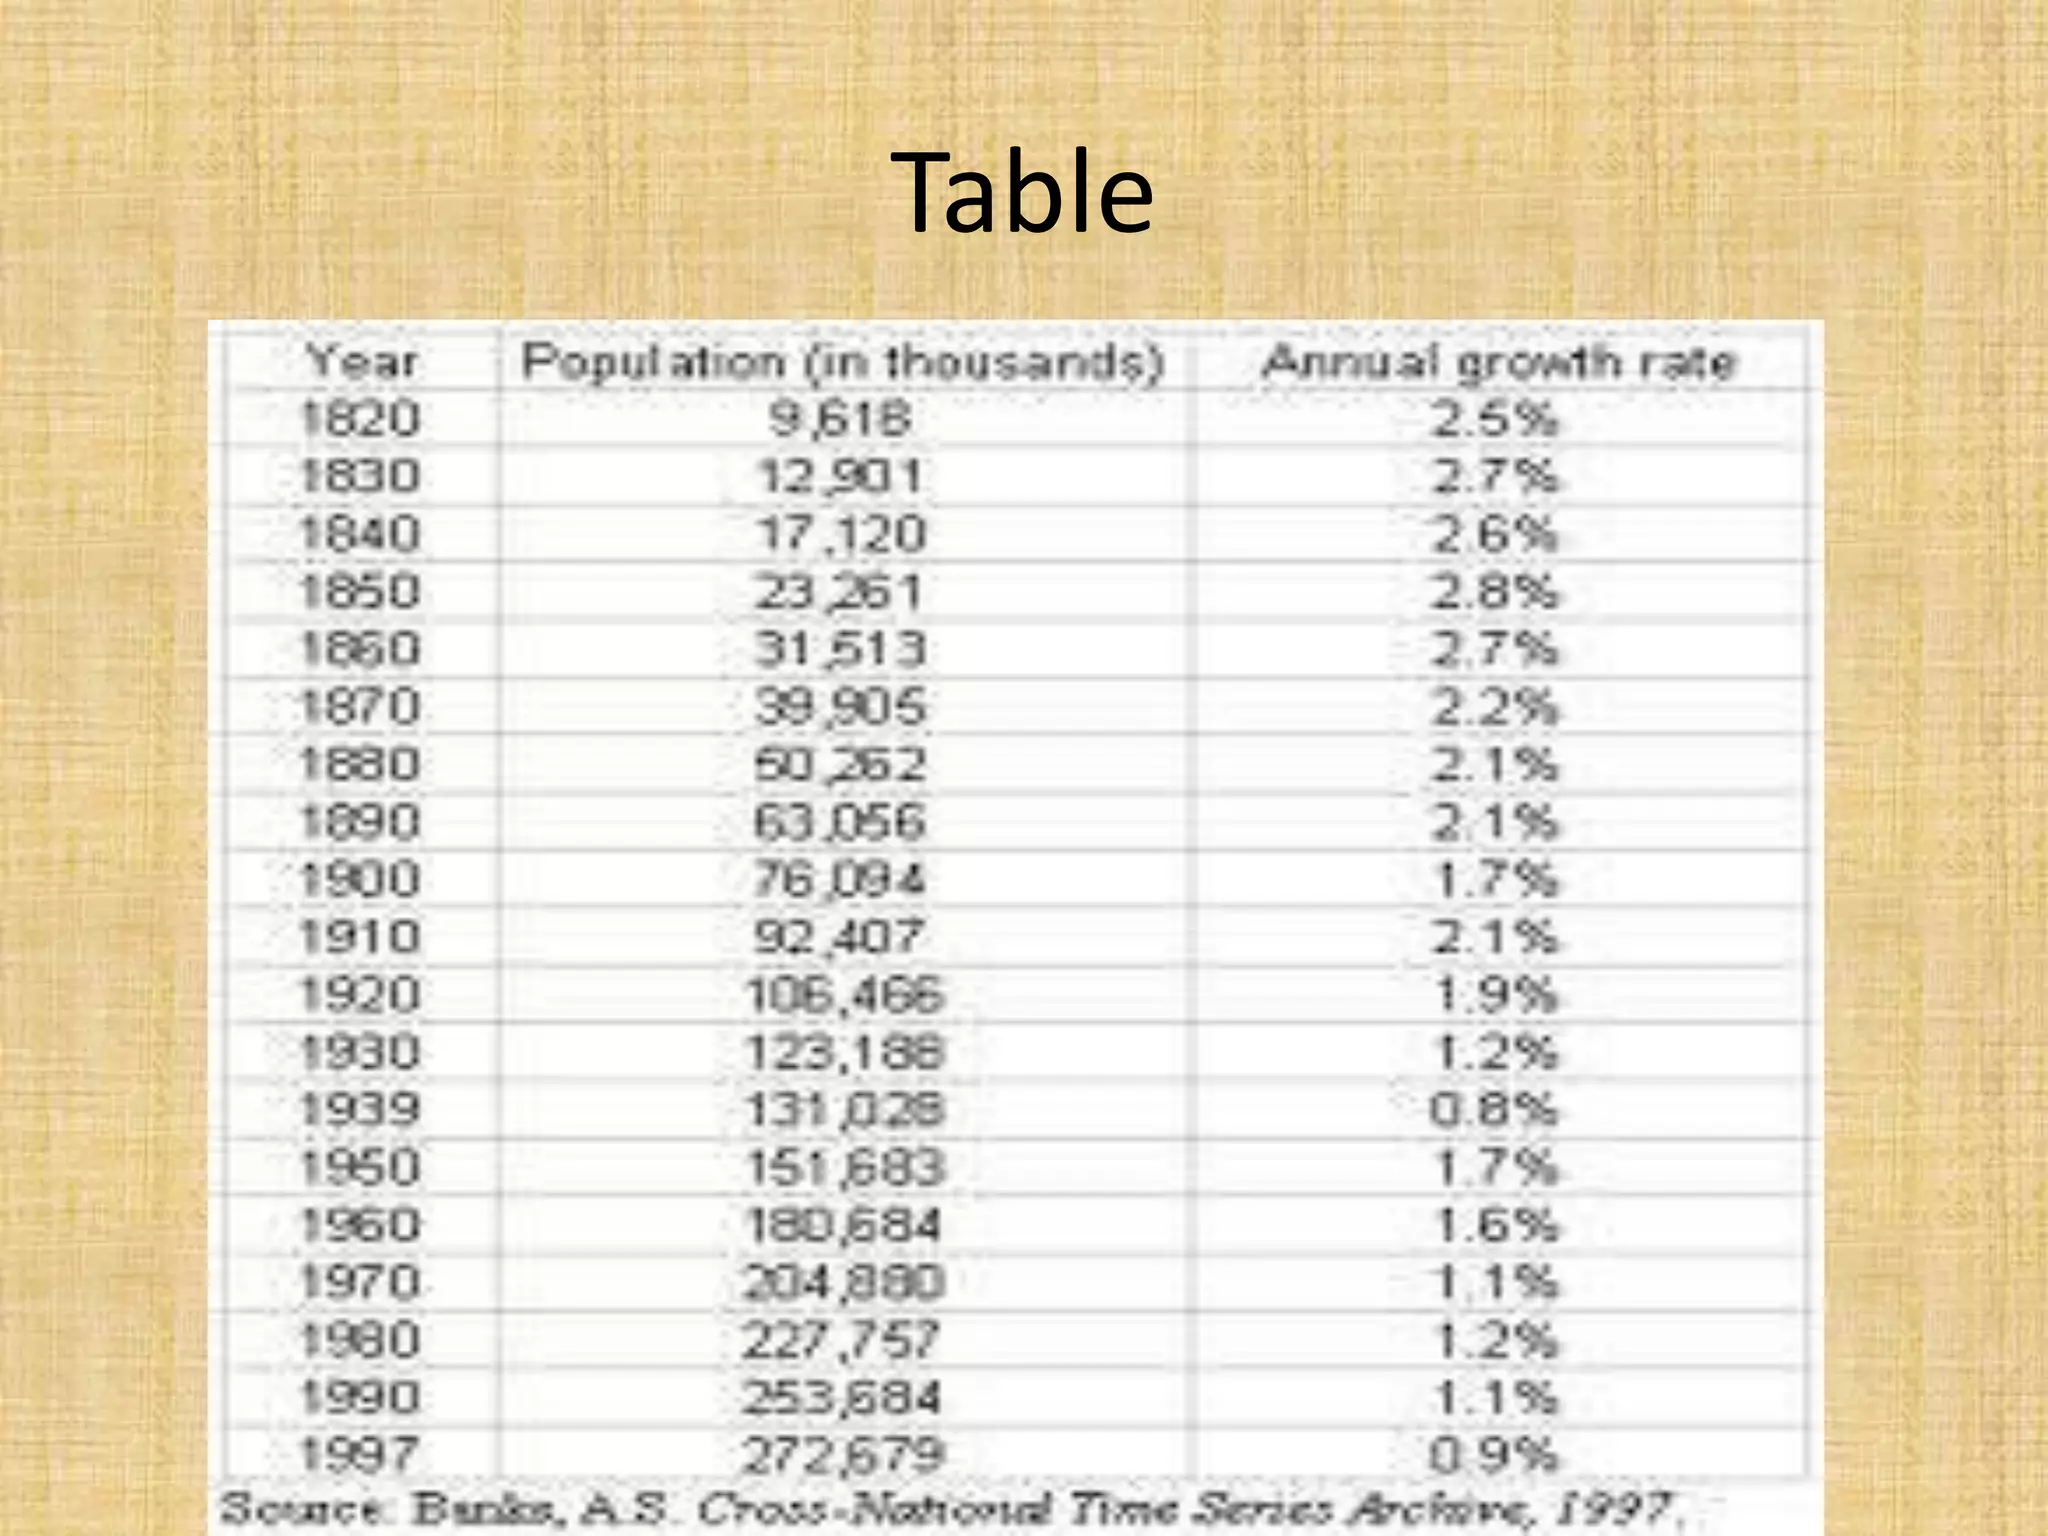
Table
• A tableshows relationships between facts and
figures by arranging information in rows and
columns.


![Vibe Coding vs. Spec-Driven Development [Free Meetup]](https://cdn.slidesharecdn.com/ss_thumbnails/vibecodingvsspecdrivendevelopment-251209105622-43f455e7-thumbnail.jpg?width=640&height=640&fit=bounds)


