
Recommended
More Related Content
What's hot
What's hot (20)
Similar to Aaj ka trend 09.09.16
Similar to Aaj ka trend 09.09.16 (19)
Recently uploaded
Recently uploaded (20)
Aaj ka trend 09.09.16
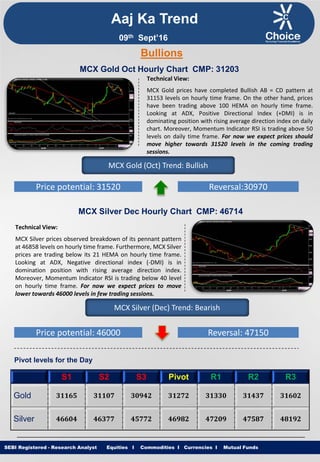
- 1. Equities I Commodities I Currencies I Mutual Funds Aaj Ka Trend Technical View: MCX Gold prices have completed Bullish AB = CD pattern at 31153 levels on hourly time frame. On the other hand, prices have been trading above 100 HEMA on hourly time frame. Looking at ADX, Positive Directional Index (+DMI) is in dominating position with rising average direction index on daily chart. Moreover, Momentum Indicator RSI is trading above 50 levels on daily time frame. For now we expect prices should move higher towards 31520 levels in the coming trading sessions. SEBI Registered - Research Analyst Equities I Commodities I Currencies I Mutual Funds Bullions MCX Gold Oct Hourly Chart CMP: 31203 MCX Gold (Oct) Trend: Bullish Price potential: 31520 Reversal:30970 MCX Silver Dec Hourly Chart CMP: 46714 Technical View: MCX Silver prices observed breakdown of its pennant pattern at 46858 levels on hourly time frame. Furthermore, MCX Silver prices are trading below its 21 HEMA on hourly time frame. Looking at ADX, Negative directional index (-DMI) is in domination position with rising average direction index. Moreover, Momentum Indicator RSI is trading below 40 level on hourly time frame. For now we expect prices to move lower towards 46000 levels in few trading sessions. MCX Silver (Dec) Trend: Bearish Price potential: 46000 Reversal: 47150 Pivot levels for the Day S1 S2 S3 Pivot R1 R2 R3 Gold 31165 31107 30942 31272 31330 31437 31602 Silver 46604 46377 45772 46982 47209 47587 48192 09th Sept’16
- 2. Equities I Commodities I Currencies I Mutual Funds Technical View: MCX Copper prices have witnessed breakout of its Inverted Head & Shoulder pattern at 313.80 levels on hourly chart. In addition, COMEX Copper is trading in a rectangle formation in hourly time frame. Moreover, Counter is trading above its 50 HEMA which indicates strength head on hourly chart. On the other hand, momentum indicator RSI is hovering near 50 levels on hourly chart. For now we expect prices to move higher towards 320.50 levels in coming trading sessions. SEBI Registered - Research Analyst Equities I Commodities I Currencies I Mutual Funds MCX Copper Nov hourly Chart CMP: 314 MCX Copper (Nov) Trend: Bullish Price potential: 320.50 Reversal: 308 MCX Crude Oil Sept. Hourly Chart CMP: 3164 Technical View: MCX Crude oil prices achieved our short term target of 3085 in yesterdays trading sessions. MCX Crude Oil witnessed breakout of its Triangle pattern at 3078 levels on hourly time frame. Looking at ADX, Positive directional index (+DMI) is in domination position with rising average direction index. Counter is trading above its 21 HEMA on Hourly time chart. Moreover, Momentum indicator RSI is trading above 60 levels on hourly basis. For now we expect prices to move higher towards 3210 levels in coming trading sessions. MCX Crude Oil (Sept) Trend: Bullish Price potential: 3210 Reversal: 3075 Pivot levels for the Day S1 S2 S3 Pivot R1 R2 R3 Copper 311.5 309.9 307.1 312.7 314.3 315.5 318.3 Crude 3061 2975 2842 3108 3194 3241 3374 Base Metal Energy Aaj Ka Trend 09th Sept’16
- 3. Equities I Commodities I Currencies I Mutual FundsSEBI Registered - Research Analyst Equities I Commodities I Currencies I Mutual Funds Other Base Metals & Energy S1 S2 S3 Pivot R1 R2 R3 Trend Copper 311.5 309.9 307.1 312.7 314.3 315.5 318.3 Aluminum 104.9 104.4 103.7 105.2 105.6 105.9 106.7 Lead 126.1 124.8 122.8 126.9 128.1 128.9 131.0 Nickel 680.2 674.1 663.9 684.3 690.4 694.5 704.7 Zinc 152.8 151.5 149.4 153.5 154.8 155.6 157.6 Natural Gas 181.6 175.8 167.0 184.6 190.4 193.4 202.2 Fundamental News: Gold prices traded in a narrow range in early Asia on Thursday with trade figures regionally in focus led by China. Gold prices rose slightly in Asia on Thursday after China trade data showed an unexpected gain in imports. Gold prices struggled for direction in North American trade on Thursday, as investors digested the latest U.S. data as well as comments from European Central Bank President Mario Draghi. Oil prices rose sharply during European hours on Thursday, extending strong overnight gains as market players awaited fresh weekly information on U.S. stockpiles of crude and refined products. Oil prices rose more than 1.5 percent on Thursday after U.S. industry data showed a large drawdown in crude stocks, reflecting the impact of an Atlantic storm. Algeria's energy minister will meet his Saudi counterpart and OPEC's secretary-general in Paris on Friday as part of moves towards clinching a global deal on stabilizing crude output to support oil prices, an Algerian official and OPEC sources said. Oil prices extended gains in North American hours on Thursday, rising to the strongest levels of the session after data showed that crude supplies in the U.S. fell by the most since April 1985. U.S. natural gas futures extended gains on Thursday morning, after data showed that natural gas supplies in storage in the U.S. rose less than forecast last week. Aaj Ka Trend 09th Sept’16
- 4. Equities I Commodities I Currencies I Mutual FundsSEBI Registered - Research Analyst Equities I Commodities I Currencies I Mutual Funds International Market Commodity Closing Price Gold 1338.85 Silver 19.61 Crude Oil 47.24 Brent Crude Oil 49.58 Natural Gas 2.811 COMEX/NYMEX/ICE ( Precious Metals & Energy) Currency & Commodity Index Currency (Spot) Current Price USD / INR 66.42 Dollar Index 94.84 EUR / USD 1.1277 CRB Index* 185.63 Closing as on 08.09.16 *Closing as on 08.09.16 LME (Base Metals) ( $ per tones) Commodity Closing Price Copper 4664 Aluminum 1590.50 Zinc 2314 Lead 1925 Nickel 10345 SHFE (Base Metals) (Yuan per tones) Commodity Closing Price Copper 36670 Aluminum 12025 Zinc 18165 Lead 14100 Closing as on 08.09.16 Closing as on 08.09.16 LME INVENTORY DATA Aaj Ka Trend 01-Sept-16 05-Sept-16 06-Sept-16 07-Sept-16 08-Sept-16 Aluminium -6650 -6975 -3900 -5450 -6700 Copper 11250 13725 6450 10300 -1375 Lead -25 0 -225 -425 200 Nickel -1025 -666 138 -744 105 Zinc -850 -575 -575 -1350 -175 09th Sept’16
- 5. Equities I Commodities I Currencies I Mutual Funds This is solely for information of clients of Choice Broking and does not construe to be an investment advice. It is also not intended as an offer or solicitation for the purchase and sale of any financial instruments. Any action taken by you on the basis of the information contained herein is your responsibility alone and Choice Broking its subsidiaries or its employees or associates will not be liable in any manner for the consequences of such action taken by you. We have exercised due diligence in checking the correctness and authenticity of the information contained in this recommendation, but Choice Broking or any of its subsidiaries or associates or employees shall not be in any way responsible for any loss or damage that may arise to any person from any inadvertent error in the information contained in this recommendation or any action taken on basis of this information. Technical analysis studies market psychology, price patterns and volume levels. It is used to forecast future price and market movements. Technical analysis is complementary to fundamental analysis and news sources. The recommendations issued herewith might be contrary to recommendations issued by Choice Broking in the company research undertaken as the recommendations stated in this report is derived purely from technical analysis. Choice Broking has based this document on information obtained from sources it believes to be reliable but which it has not independently verified; Choice Broking makes no guarantee, representation or warranty and accepts no responsibility or liability as to its accuracy or completeness. The opinions contained within the report are based upon publicly available information at the time of publication and are subject to change without notice. The information and any disclosures provided herein are in summary form and have been prepared for informational purposes. The recommendations and suggested price levels are intended purely for trading purposes. The recommendations are valid for the day of the report however trading trends and volumes might vary substantially on an intraday basis and the recommendations may be subject to change. The information and any disclosures provided herein may be considered confidential. Any use, distribution, modification, copying, forwarding or disclosure by any person is strictly prohibited. The information and any disclosures provided herein do not constitute a solicitation or offer to purchase or sell any security or other financial product or instrument. The current performance may be unaudited. Past performance does not guarantee future returns. There can be no assurance that investments will achieve any targeted rates of return, and there is no guarantee against the loss of your entire investment. POTENTIAL CONFLICT OF INTEREST DISCLOSURE (as on date of report) Disclosure of interest statement – • Analyst interest of the stock /Instrument(s): - No. • Firm interest of the stock / Instrument (s): - No. Disclaimer Contact Us Amit Pathania Research Associate amit.pathania@choiceindia.com Rohan Patil Research Associate rohan.patil@choiceindia.com www.choicebroking.incustomercare@choiceindia.com SEBI Registered - Research Analyst Equities I Commodities I Currencies I Mutual Funds Aaj Ka Trend 09th Sept’16 Neeraj Yadav Research Advisor neeraj.yadav@choiceindia.com Anish Vyas Senior Research Associate anish.vyas@choiceindia.com Anish Vyas Digitally signed by Anish Vyas DN: cn=Anish Vyas, o=Choice Merchandise Broking Pvt. Ltd, ou=Sr. Research Associate, email=anish.vyas@choiceindia.com, c=IN Date: 2016.09.09 08:45:53 +05'30'