
Recommended
More Related Content
What's hot
What's hot (20)
Viewers also liked
Viewers also liked (15)
Similar to Aaj ka trend 12.05.16
Similar to Aaj ka trend 12.05.16 (20)
Recently uploaded
Recently uploaded (20)
Aaj ka trend 12.05.16
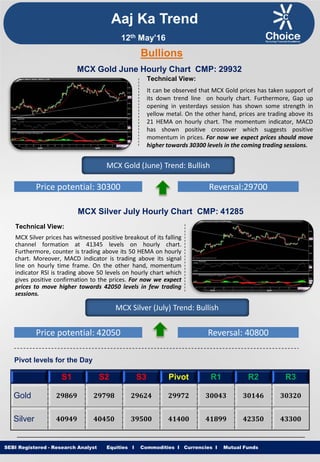
- 1. Equities I Commodities I Currencies I Mutual Funds Aaj Ka Trend Technical View: It can be observed that MCX Gold prices has taken support of its down trend line on hourly chart. Furthermore, Gap up opening in yesterdays session has shown some strength in yellow metal. On the other hand, prices are trading above its 21 HEMA on hourly chart. The momentum indicator, MACD has shown positive crossover which suggests positive momentum in prices. For now we expect prices should move higher towards 30300 levels in the coming trading sessions. SEBI Registered - Research Analyst Equities I Commodities I Currencies I Mutual Funds Bullions MCX Gold June Hourly Chart CMP: 29932 MCX Gold (June) Trend: Bullish Price potential: 30300 Reversal:29700 MCX Silver July Hourly Chart CMP: 41285 Technical View: MCX Silver prices has witnessed positive breakout of its falling channel formation at 41345 levels on hourly chart. Furthermore, counter is trading above its 50 HEMA on hourly chart. Moreover, MACD indicator is trading above its signal line on hourly time frame. On the other hand, momentum indicator RSI is trading above 50 levels on hourly chart which gives positive confirmation to the prices. For now we expect prices to move higher towards 42050 levels in few trading sessions. MCX Silver (July) Trend: Bullish Price potential: 42050 Reversal: 40800 Pivot levels for the Day S1 S2 S3 Pivot R1 R2 R3 Gold 29869 29798 29624 29972 30043 30146 30320 Silver 40949 40450 39500 41400 41899 42350 43300 12th May’16
- 2. Equities I Commodities I Currencies I Mutual Funds Technical View: MCX Copper Prices have witnessed breakout of its Falling channel formation at 314.90 on hourly charts. However, MCX Copper prices is trading above its 21 HEMA on hourly chart which indicates short term trend remains up. On the other hand, momentum indicator RSI is taking support near 40 levels on hourly chart which gives positive confirmation to the prices. For now we expect prices to move higher towards 322 levels in coming trading sessions. SEBI Registered - Research Analyst Equities I Commodities I Currencies I Mutual Funds MCX Copper June hourly Chart CMP: 312.55 MCX Copper (June) Trend: Bullish Price potential: 322 Reversal: 308.20 MCX Crude Oil May. Hourly Chart CMP: 3076 Technical View: MCX Crude Oil prices are trading near its horizontal trend line resistance on hourly time frame. On Weekly chart, the MCX Crude Oil price has completed a “Bearish White Swan Harmonic Pattern” at 3115 levels. Moreover, counter is trading below its 100 DEMA on Daily chart. On the other hand, momentum indicator RSI is facing resistance at 60 levels on hourly chart which gives negative confirmation to the prices. For now we expect prices to move lower towards 2970 levels in coming trading sessions. MCX Crude Oil (May) Trend: Bearish Price potential: 2970 Reversal: 3110 Pivot levels for the Day S1 S2 S3 Pivot R1 R2 R3 Copper 312.4 310.6 306.5 314.6 316.4 318.7 322.7 Crude 2979 2892 2757 3027 3114 3162 3297 Base Metal Energy Aaj Ka Trend 12th May’16
- 3. Equities I Commodities I Currencies I Mutual FundsSEBI Registered - Research Analyst Equities I Commodities I Currencies I Mutual Funds Other Base Metals & Energy S1 S2 S3 Pivot R1 R2 R3 Trend Copper 312.4 310.6 306.5 314.6 316.4 318.7 322.7 Aluminum 103.9 103.4 102.2 104.5 105.1 105.7 106.8 Lead 117.4 116.6 114.9 118.3 119.1 120.0 121.7 Nickel 587.1 580.7 570.6 590.8 597.2 600.9 611.0 Zinc 124.7 122.9 120.0 125.8 127.6 128.7 131.6 Natural Gas 142.0 139.6 135.4 143.8 146.2 148.0 152.2 Fundamental News: Gold rose in Asia on Wednesday as investors digested a mixed U.S. hiring report. The Federal Reserve has continually reiterated that it is taking a data-driven approach to the timing of its first interest rate hike in 2016. Any rate hikes by the Fed this year are viewed as bearish for gold, which struggles to compete with high-yield bearing assets in rising rate environments. Gold futures were higher in European trade on Wednesday, after falling to the lowest level in almost two weeks overnight, as investors continued to monitor movements in the U.S. dollar. West Texas Intermediate oil prices fell in European trade on Wednesday, after rising sharply overnight, amid speculation weekly supply data due later in the session will show U.S. crude inventories rose at a faster pace than expected last week. The West's energy watchdog, the International Energy Agency, faces a possible legal split from its parent body following decades of friction and fresh disagreements over cooperation with China, a document seen by Reuters shows. Oil prices fluctuated on Wednesday as Canadian oil sands production was expected to gradually ramp up following closures due to wildfires and as record crude inventories put pressure on markets. Oil prices surrendered most of their early gains on Wednesday, with U.S. crude turning negative, on worries that government data could show another big U.S. crude stock build despite supportive Canadian supply outages. West Texas Intermediate oil futures came off the lowest levels of the session and hit intraday highs in North America trade on Wednesday, after data showed that oil supplies in the U.S. registered an unexpected sharp decline. Aaj Ka Trend 12th May’16
- 4. Equities I Commodities I Currencies I Mutual FundsSEBI Registered - Research Analyst Equities I Commodities I Currencies I Mutual Funds International Market Commodity Closing Price Gold 1277.75 Silver 17.42 Crude Oil 45.80 Brent Crude Oil 47.14 Natural Gas 2.16 COMEX/NYMEX/ICE ( Precious Metals & Energy) Currency & Commodity Index Currency (Spot) Current Price USD / INR 66.56 Dollar Index 93.80 EUR / USD 1.1424 CRB Index* 183.33 Closing as on 11.05.16 *Closing as on 11.05.16 LME (Base Metals) ( $ per tones) Commodity Closing Price Copper 4708 Aluminum 1564 Zinc 1903 Lead 1772.50 Nickel 8885 SHFE (Base Metals) (Yuan per tones) Commodity Closing Price Copper 36000 Aluminum 12130 Zinc 15085 Lead 13040 Closing as on 11.05.16 Closing as on 11.05.16 LME INVENTORY DATA Aaj Ka Trend 05-May-16 06-May-16 09-May-16 10-May-16 11-May-16 Aluminium -2900 -6275 -2900 -7150 -7375 Copper 2300 225 2300 1300 725 Lead -650 550 -650 1575 -50 Nickel 150 -1308 150 24 -690 Zinc -1225 -1125 -1225 -825 -875 12th May’16
- 5. Equities I Commodities I Currencies I Mutual Funds This is solely for information of clients of Choice Broking and does not construe to be an investment advice. It is also not intended as an offer or solicitation for the purchase and sale of any financial instruments. Any action taken by you on the basis of the information contained herein is your responsibility alone and Choice Broking its subsidiaries or its employees or associates will not be liable in any manner for the consequences of such action taken by you. We have exercised due diligence in checking the correctness and authenticity of the information contained in this recommendation, but Choice Broking or any of its subsidiaries or associates or employees shall not be in any way responsible for any loss or damage that may arise to any person from any inadvertent error in the information contained in this recommendation or any action taken on basis of this information. Technical analysis studies market psychology, price patterns and volume levels. It is used to forecast future price and market movements. Technical analysis is complementary to fundamental analysis and news sources. The recommendations issued herewith might be contrary to recommendations issued by Choice Broking in the company research undertaken as the recommendations stated in this report is derived purely from technical analysis. Choice Broking has based this document on information obtained from sources it believes to be reliable but which it has not independently verified; Choice Broking makes no guarantee, representation or warranty and accepts no responsibility or liability as to its accuracy or completeness. The opinions contained within the report are based upon publicly available information at the time of publication and are subject to change without notice. The information and any disclosures provided herein are in summary form and have been prepared for informational purposes. The recommendations and suggested price levels are intended purely for trading purposes. The recommendations are valid for the day of the report however trading trends and volumes might vary substantially on an intraday basis and the recommendations may be subject to change. The information and any disclosures provided herein may be considered confidential. Any use, distribution, modification, copying, forwarding or disclosure by any person is strictly prohibited. The information and any disclosures provided herein do not constitute a solicitation or offer to purchase or sell any security or other financial product or instrument. The current performance may be unaudited. Past performance does not guarantee future returns. There can be no assurance that investments will achieve any targeted rates of return, and there is no guarantee against the loss of your entire investment. POTENTIAL CONFLICT OF INTEREST DISCLOSURE (as on date of report) Disclosure of interest statement – • Analyst interest of the stock /Instrument(s): - No. • Firm interest of the stock / Instrument (s): - No. Disclaimer Contact Us Amit Pathania Research Associate amit.pathania@choiceindia.com Rohan Patil Research Associate rohan.patil@choiceindia.com www.choiceindia.comcustomercare@choiceindia.com SEBI Registered - Research Analyst Equities I Commodities I Currencies I Mutual Funds Aaj Ka Trend 12th May’16 Neeraj Yadav Research Advisor neeraj.yadav@choiceindia.com Anish Vyas Senior Research Associate anish.vyas@choiceindia.com Anish Vyas Digitally signed by Anish Vyas DN: cn=Anish Vyas, o=Choice Merchandise Broking Pvt. Ltd, ou=Sr. Research Associate, email=anish.vyas@choiceindia.com, c=IN Date: 2016.05.12 08:28:42 +05'30'