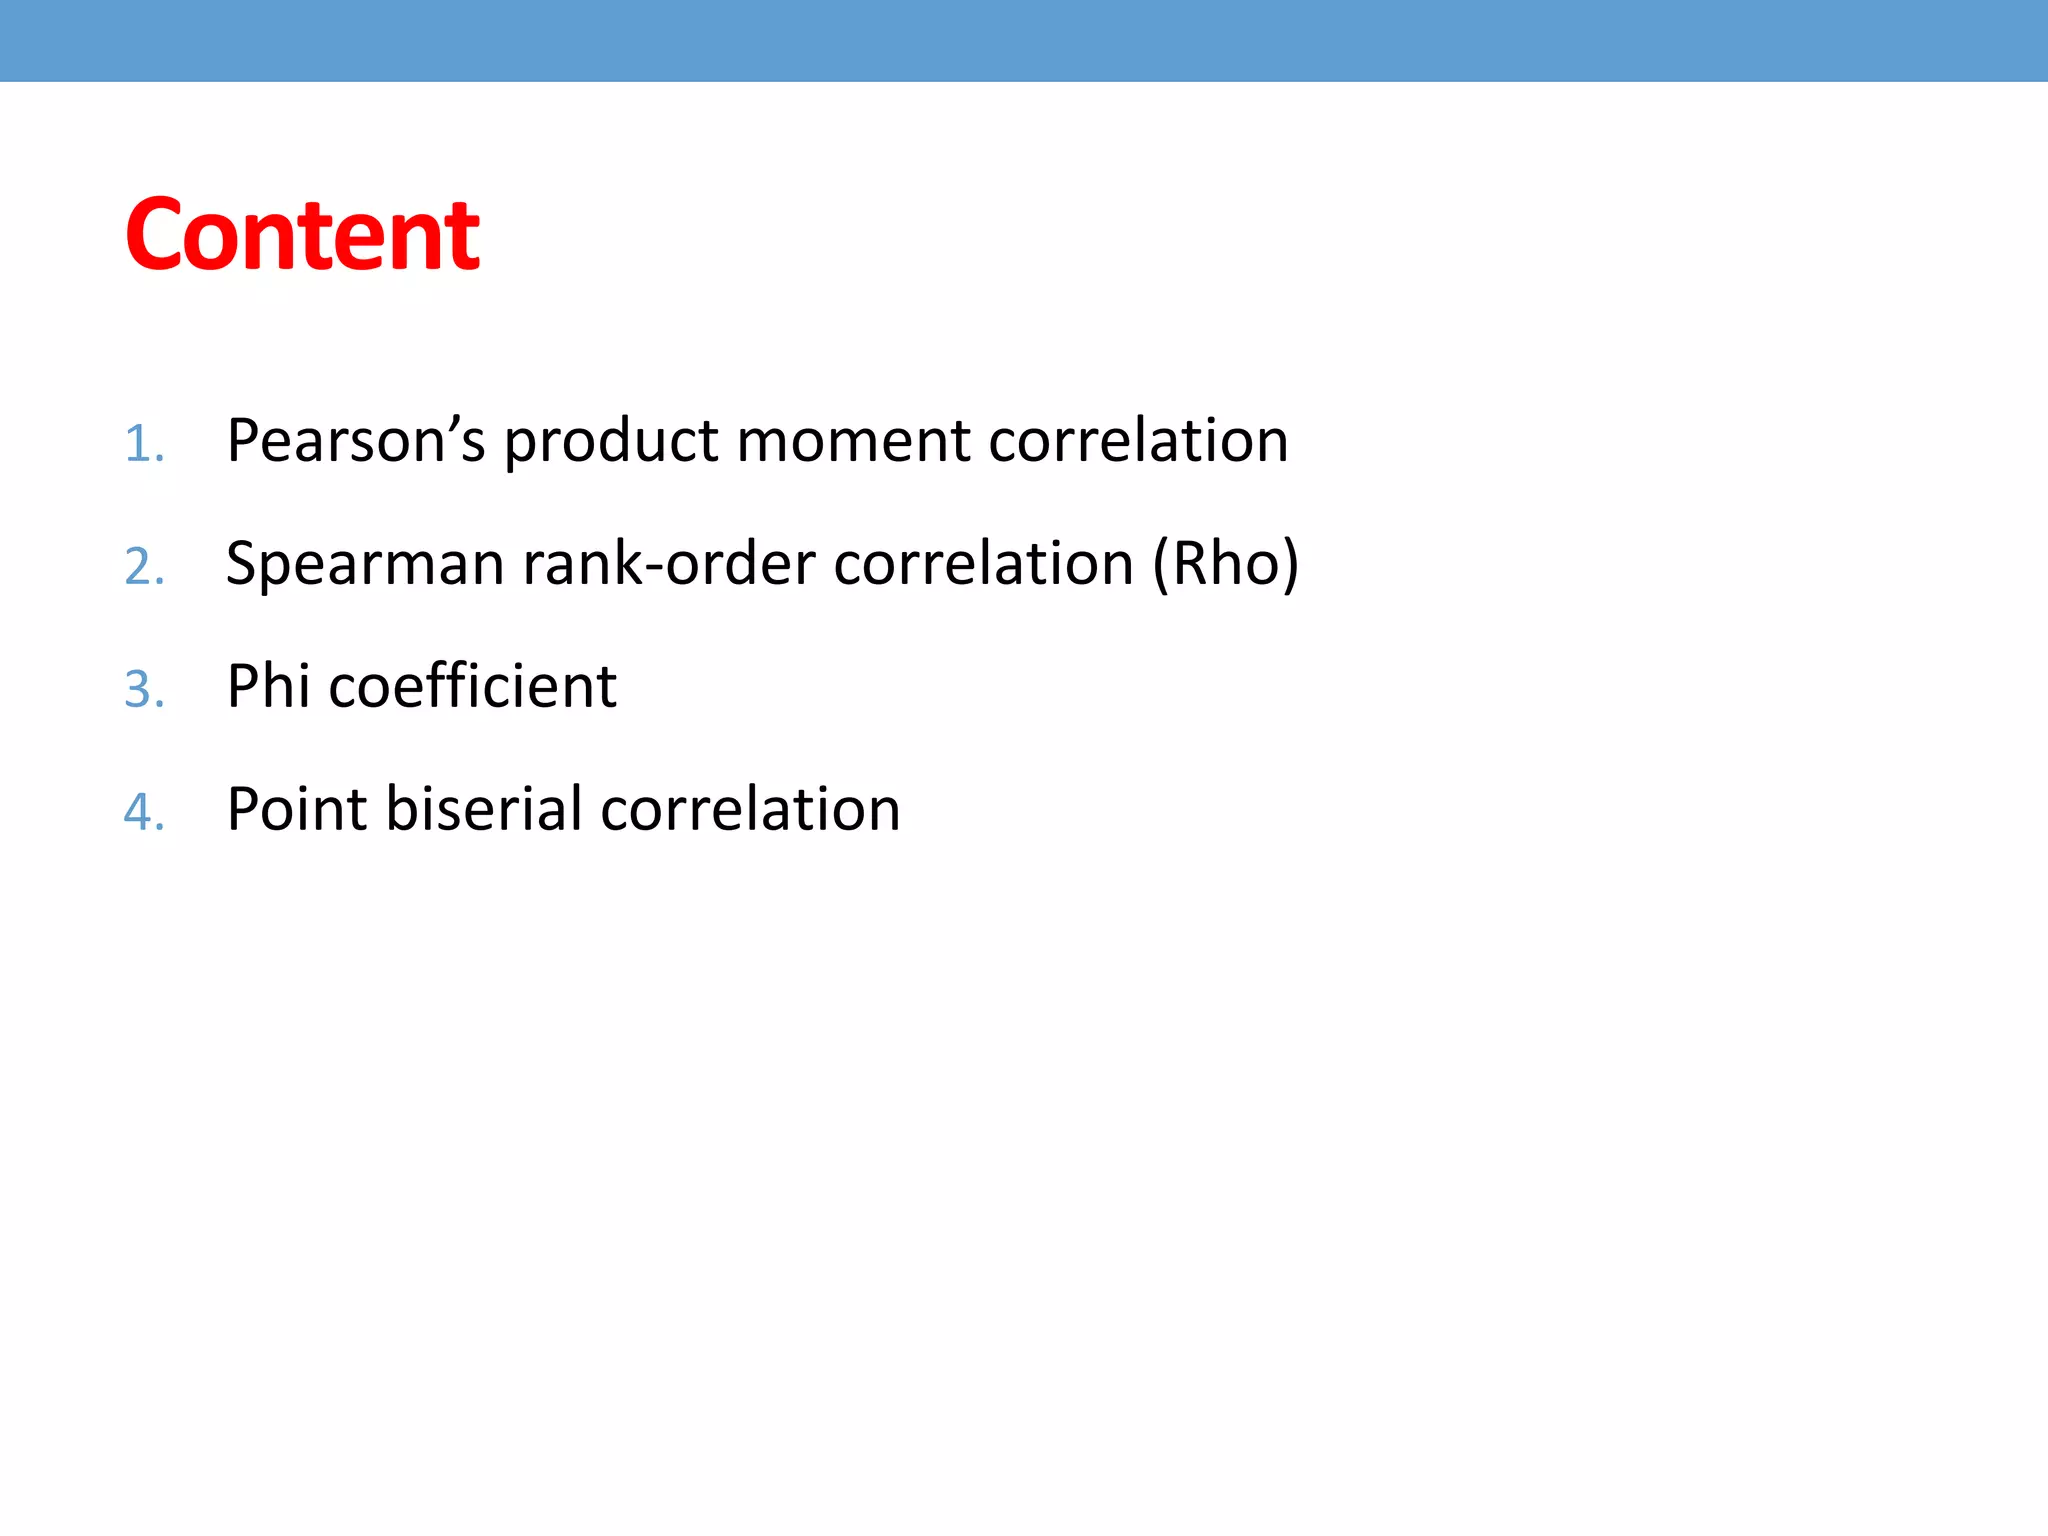
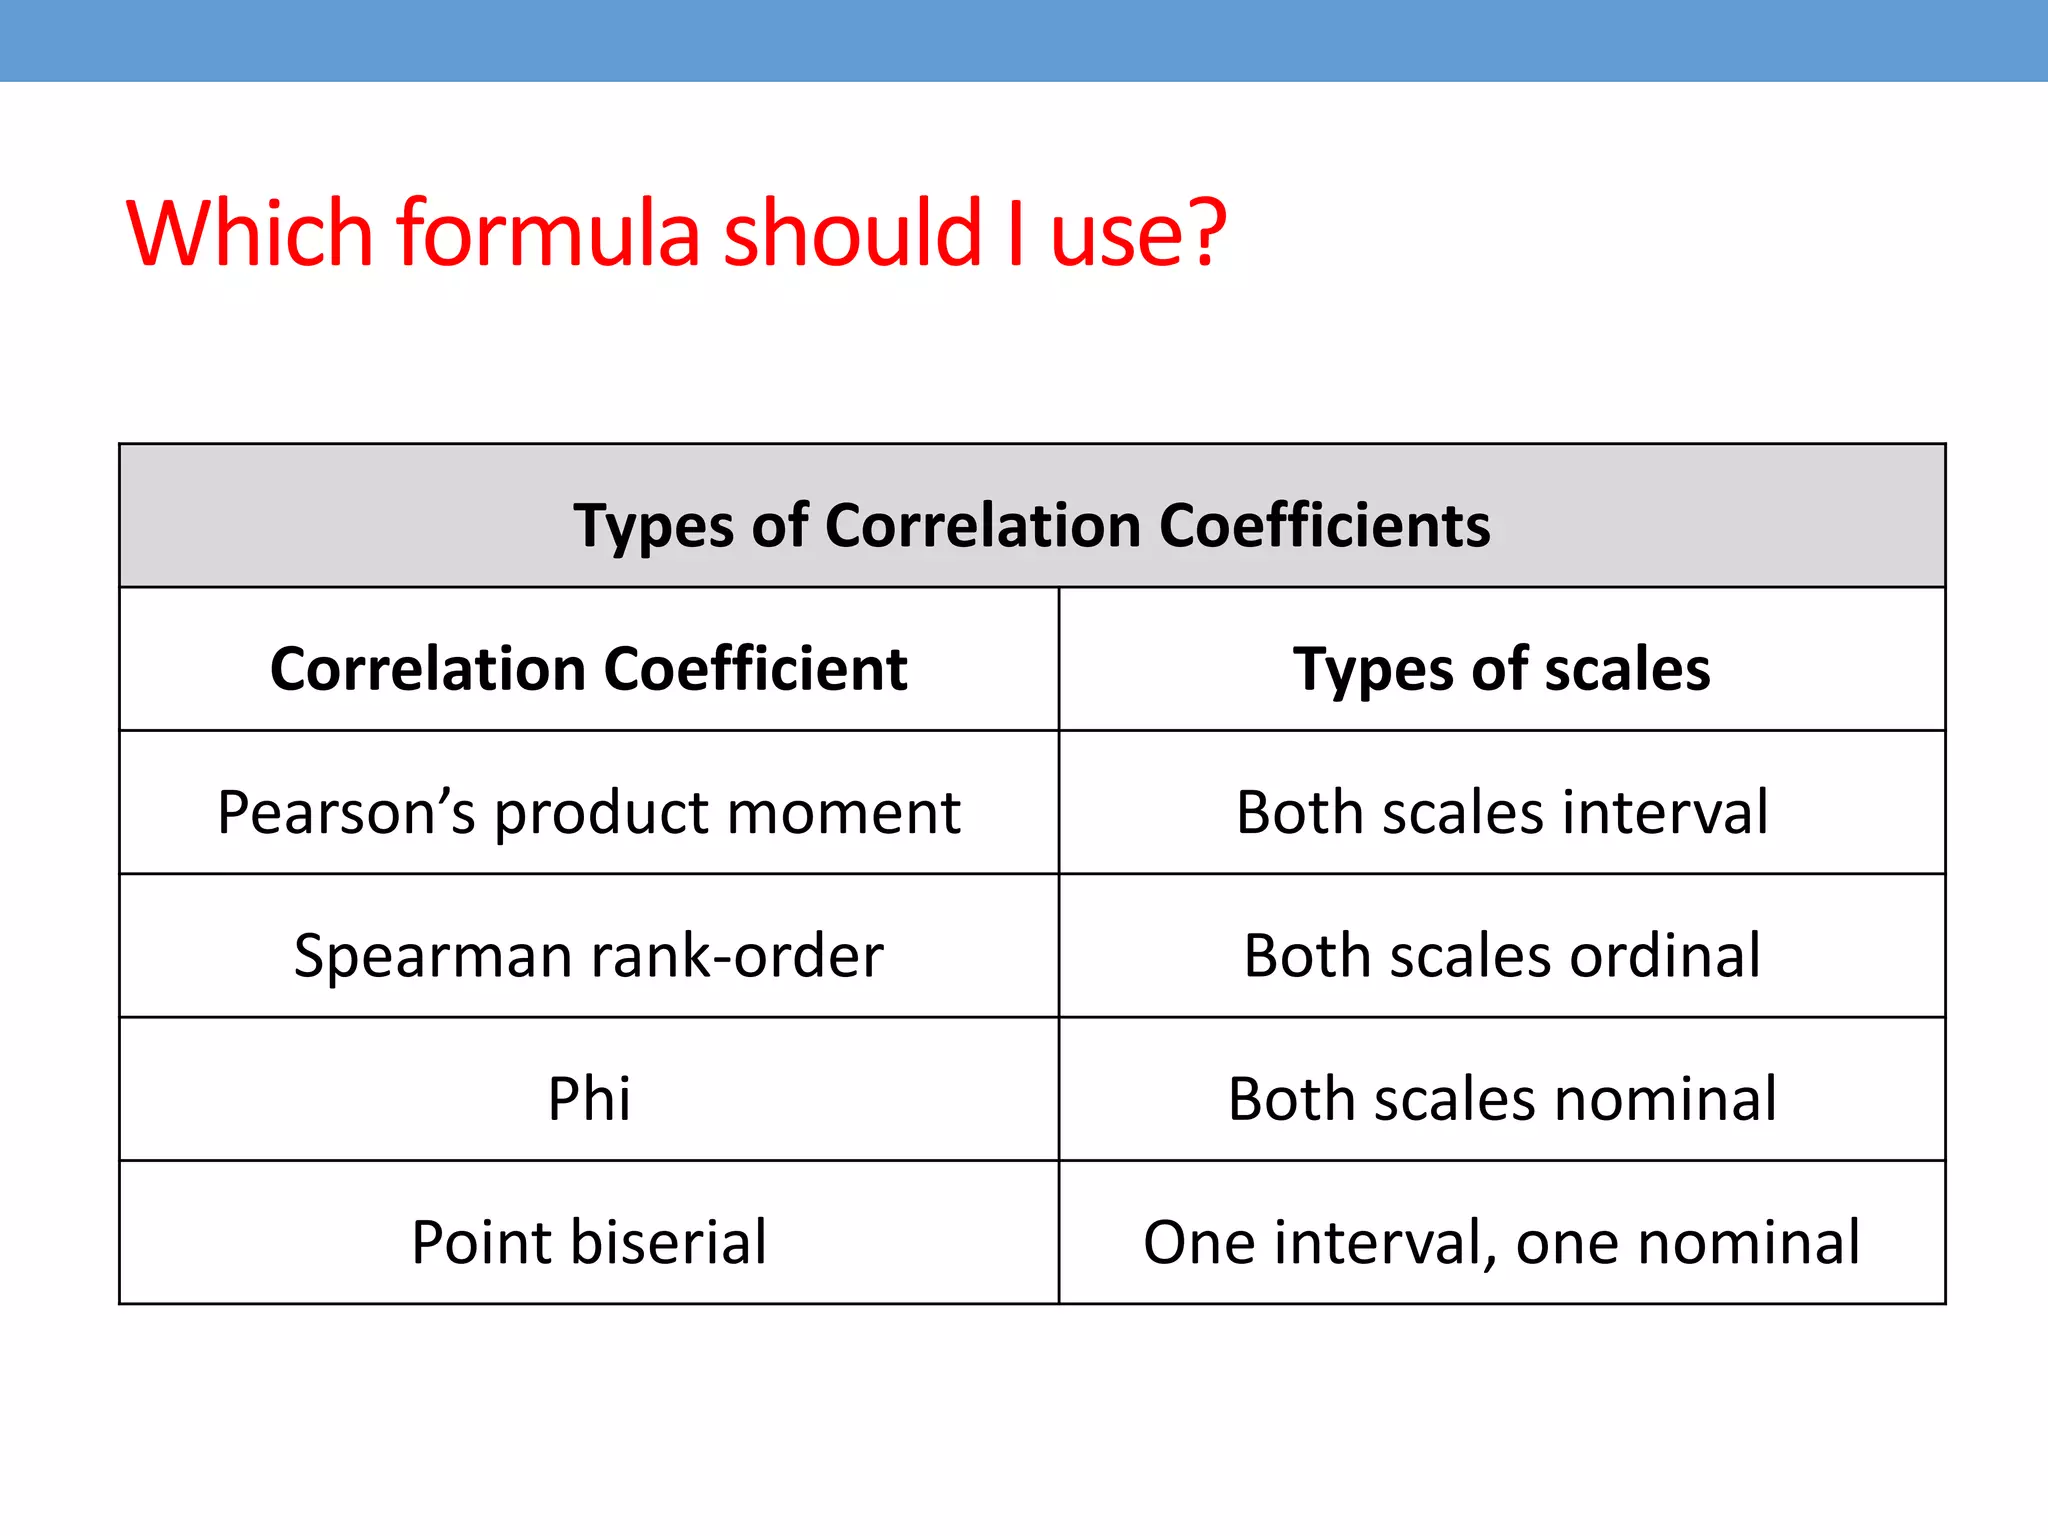
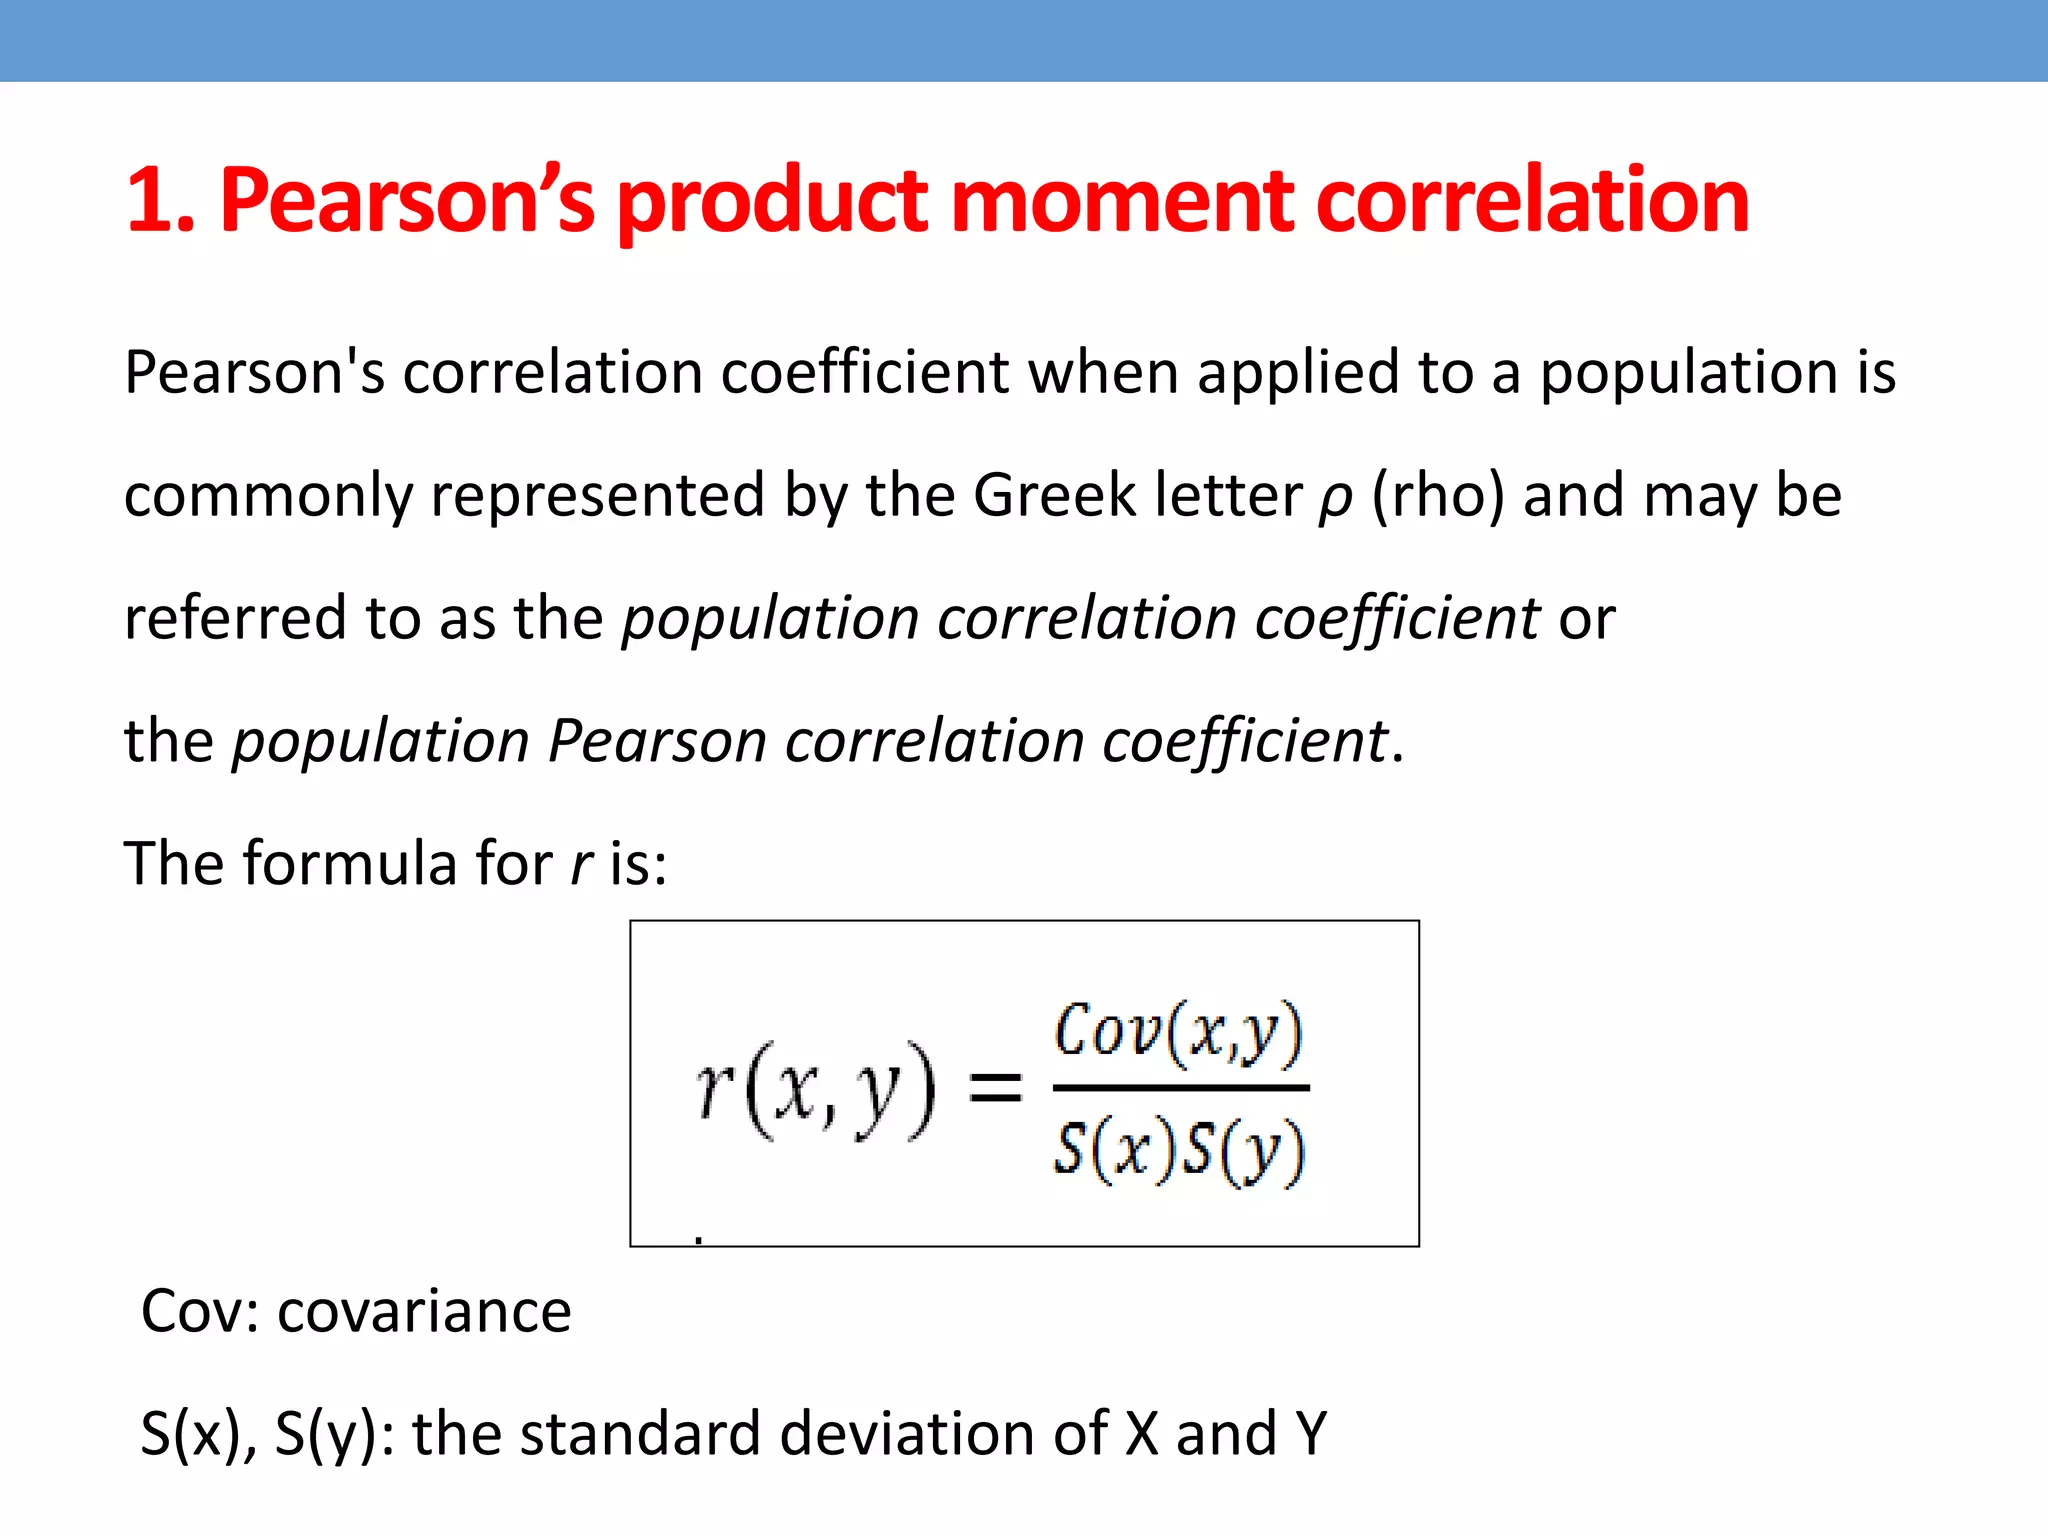
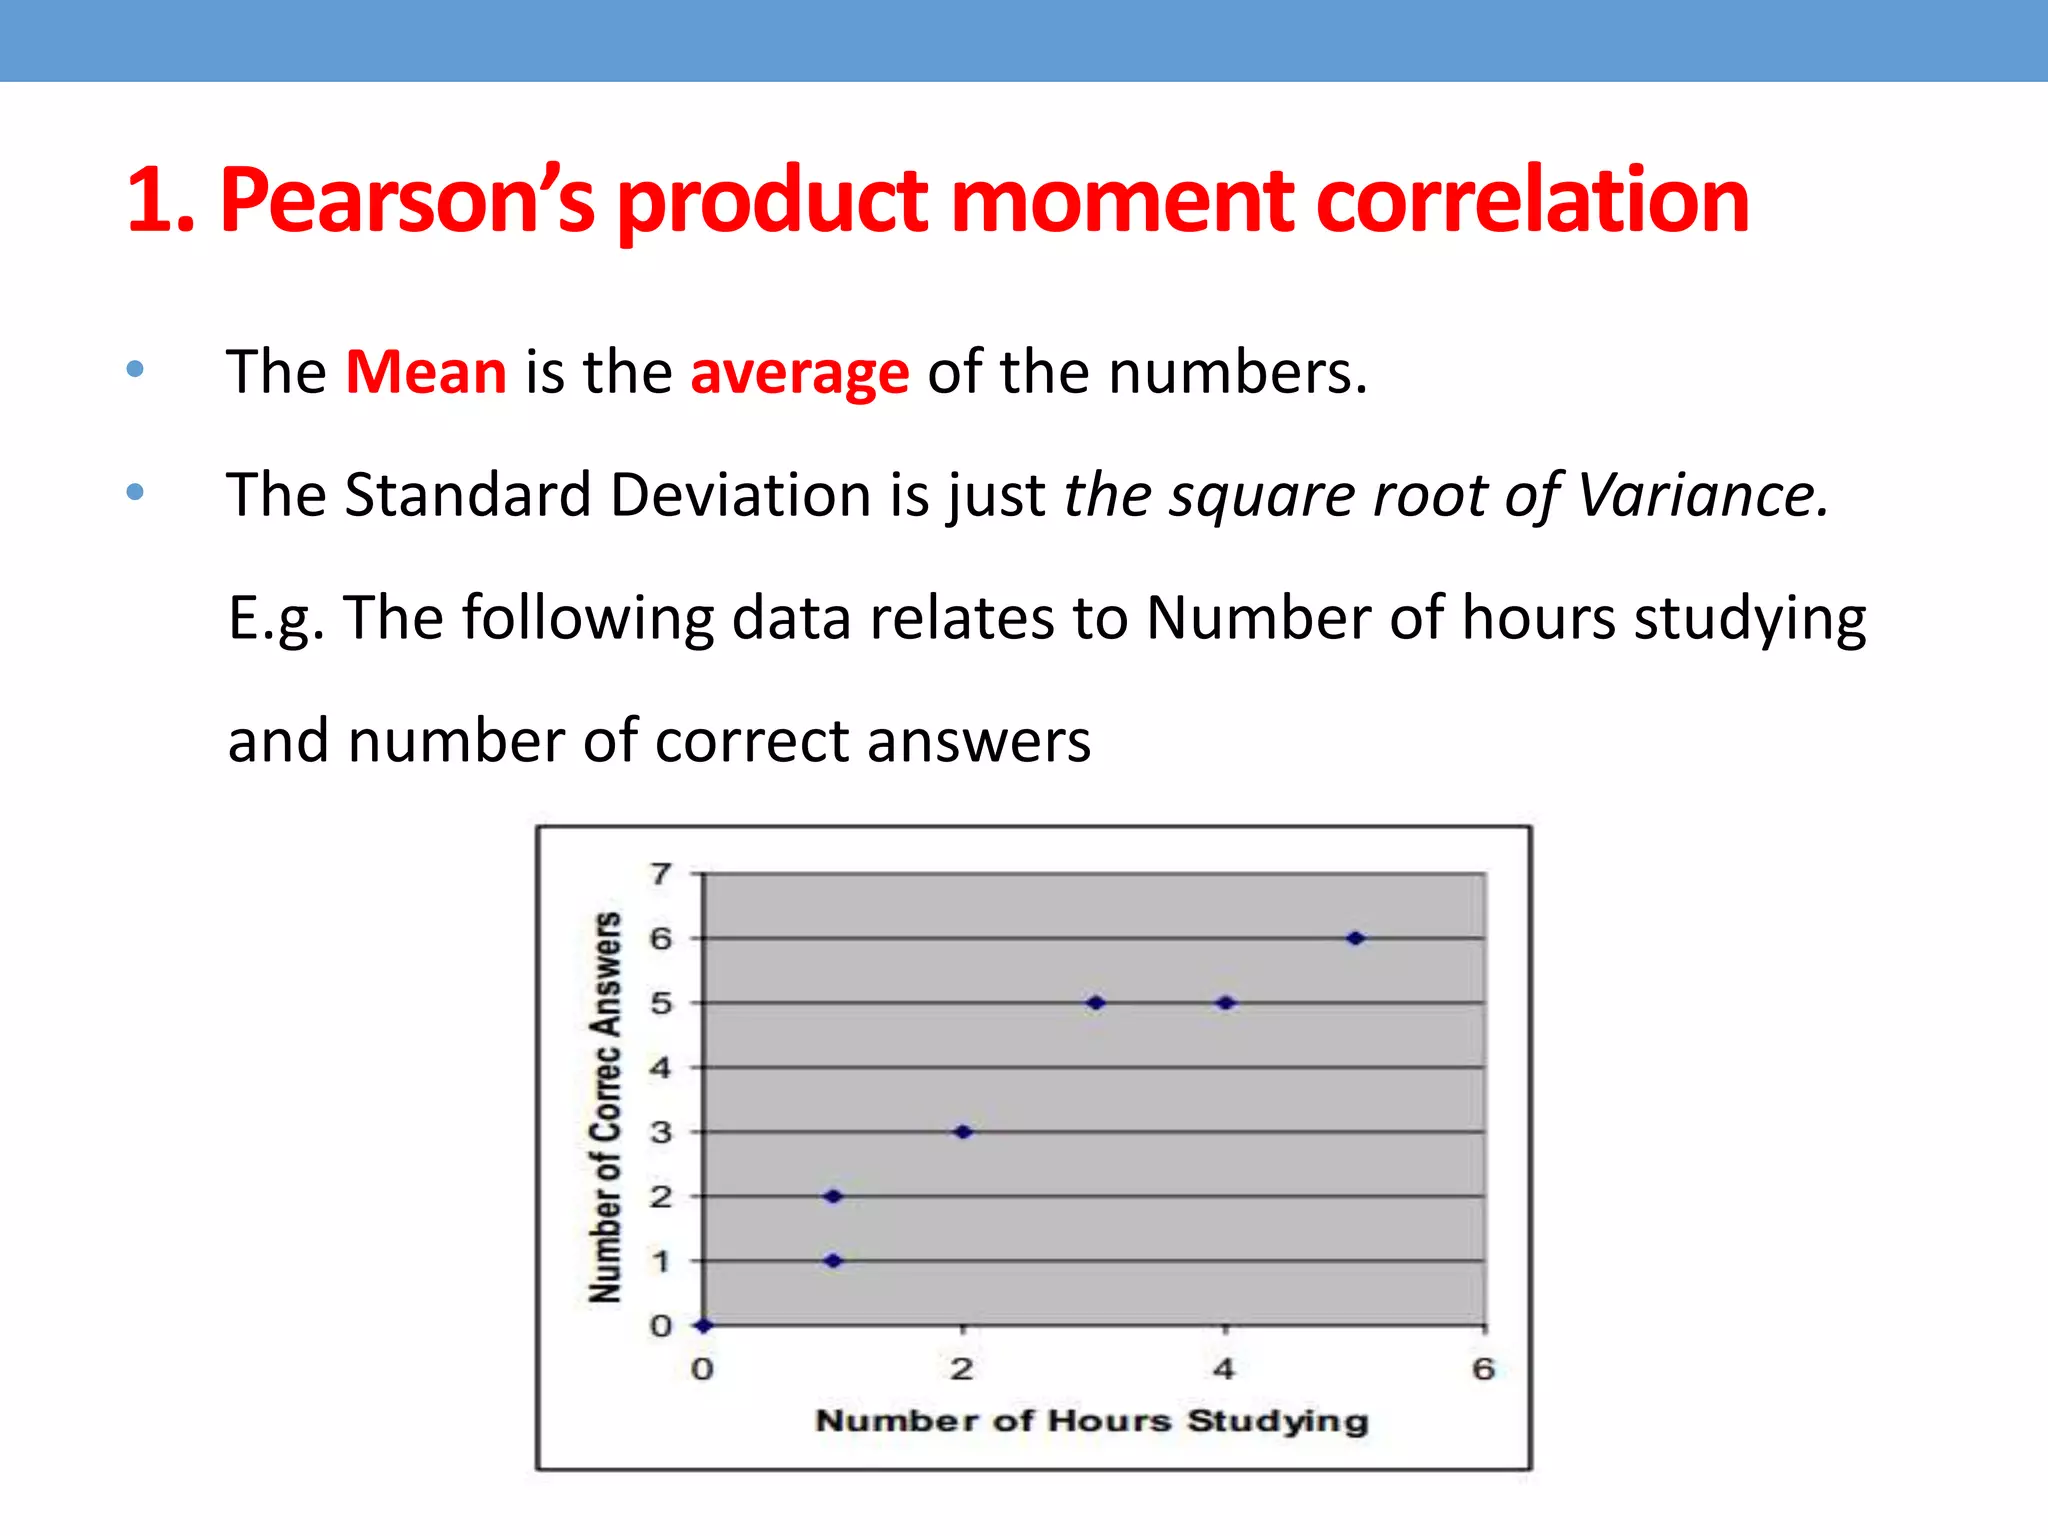
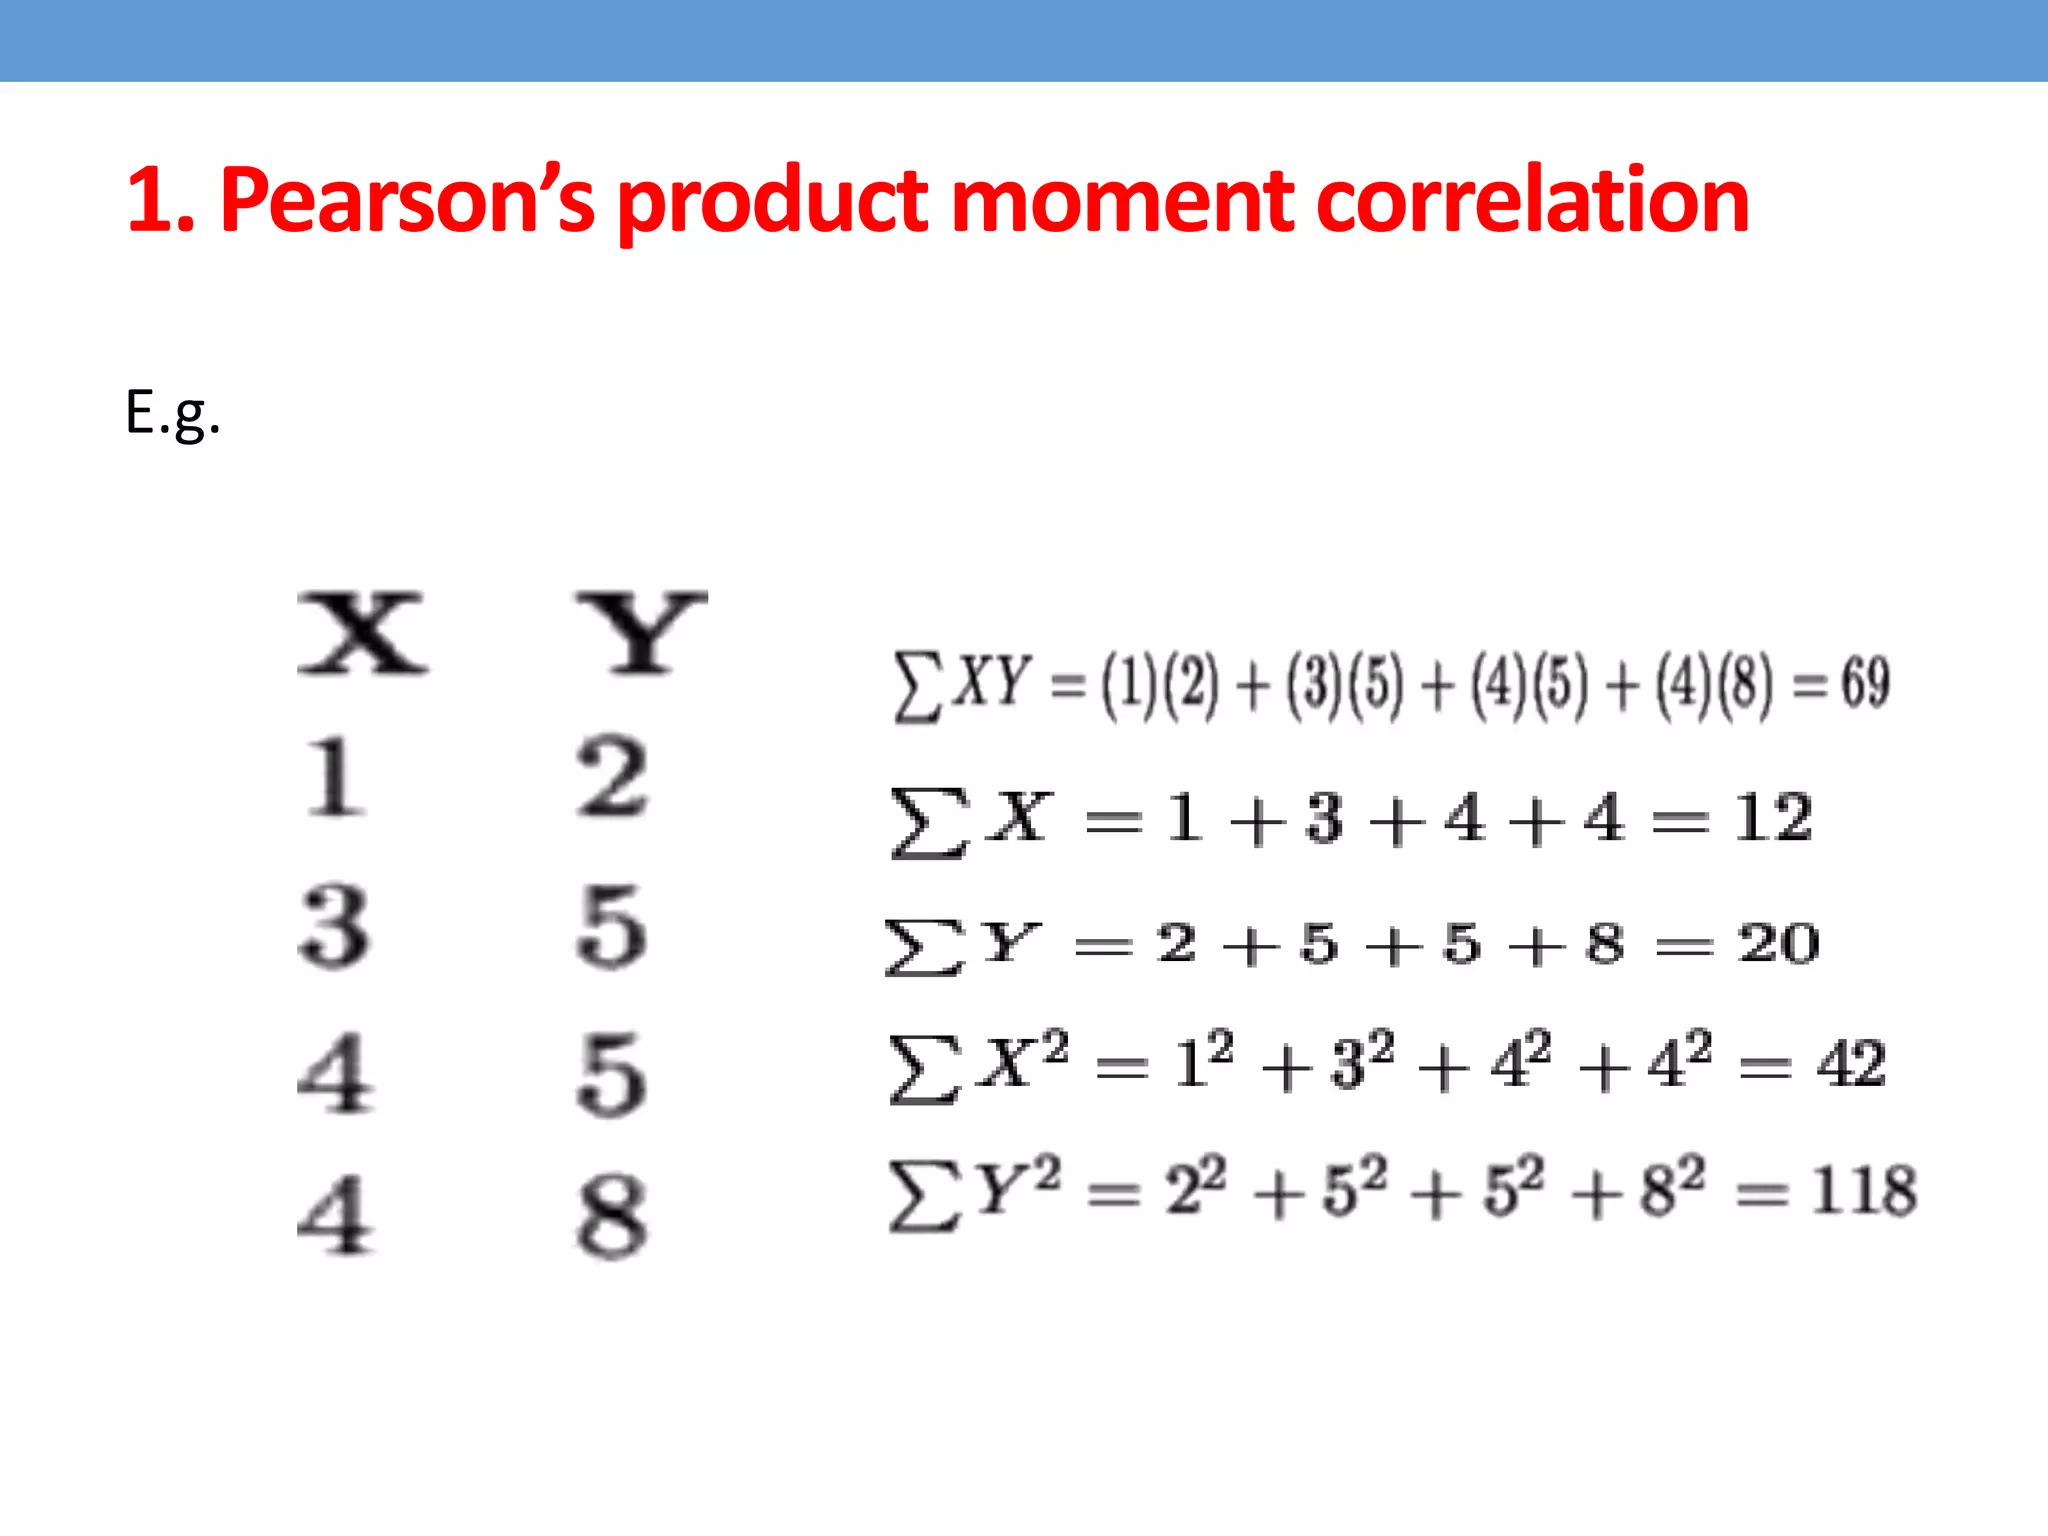
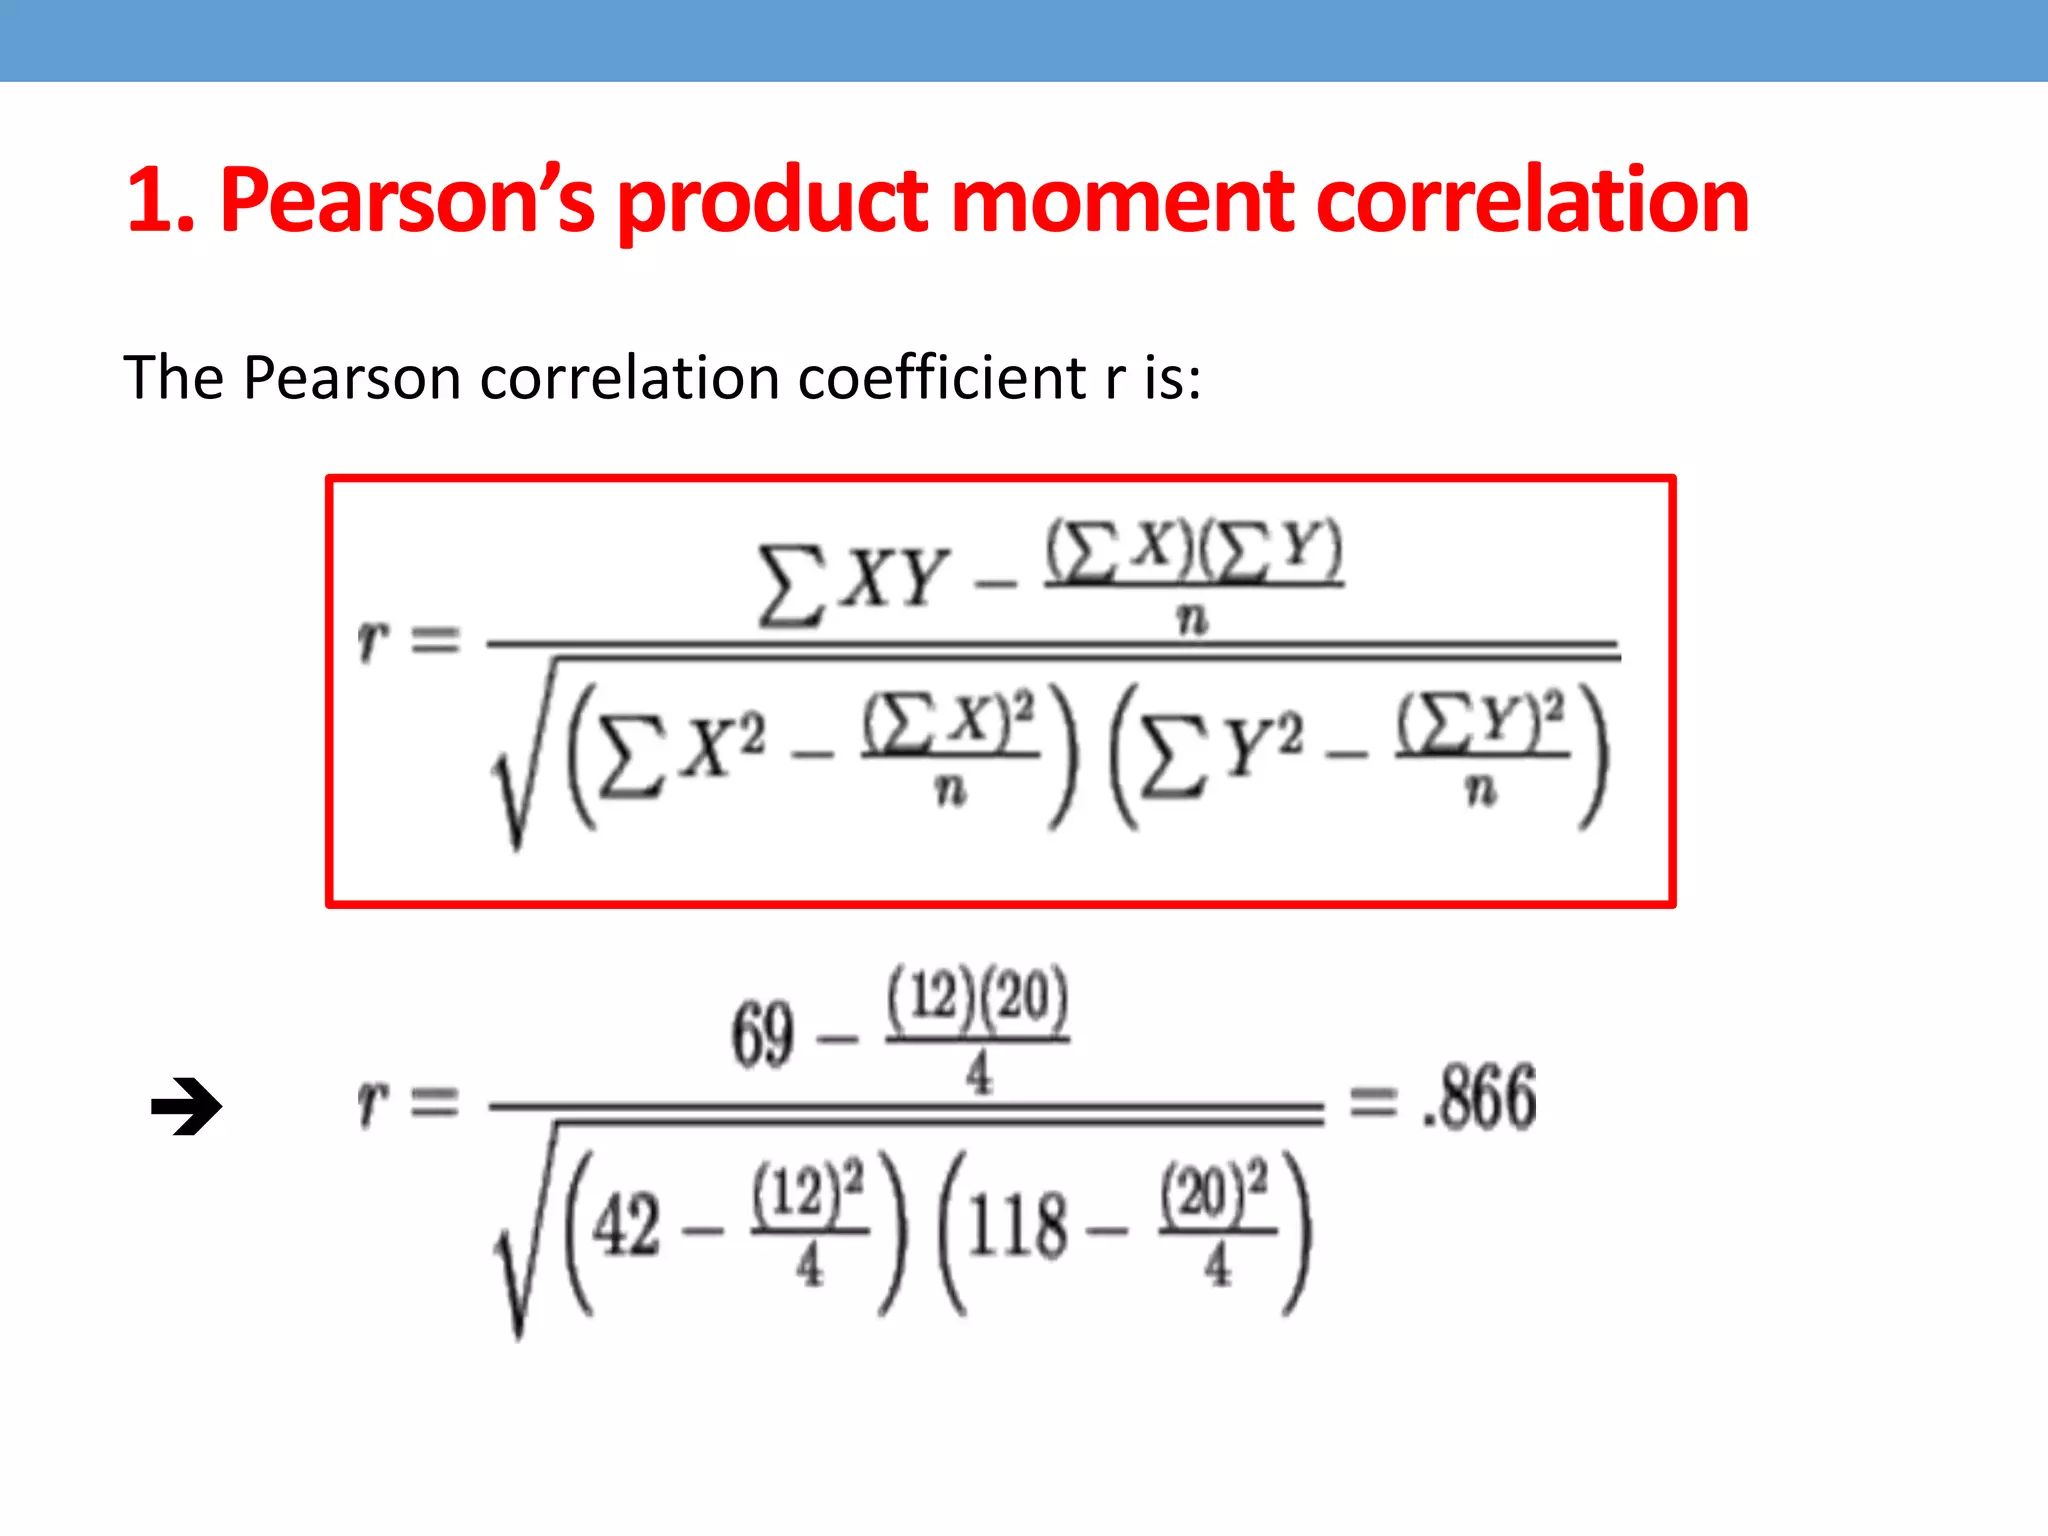
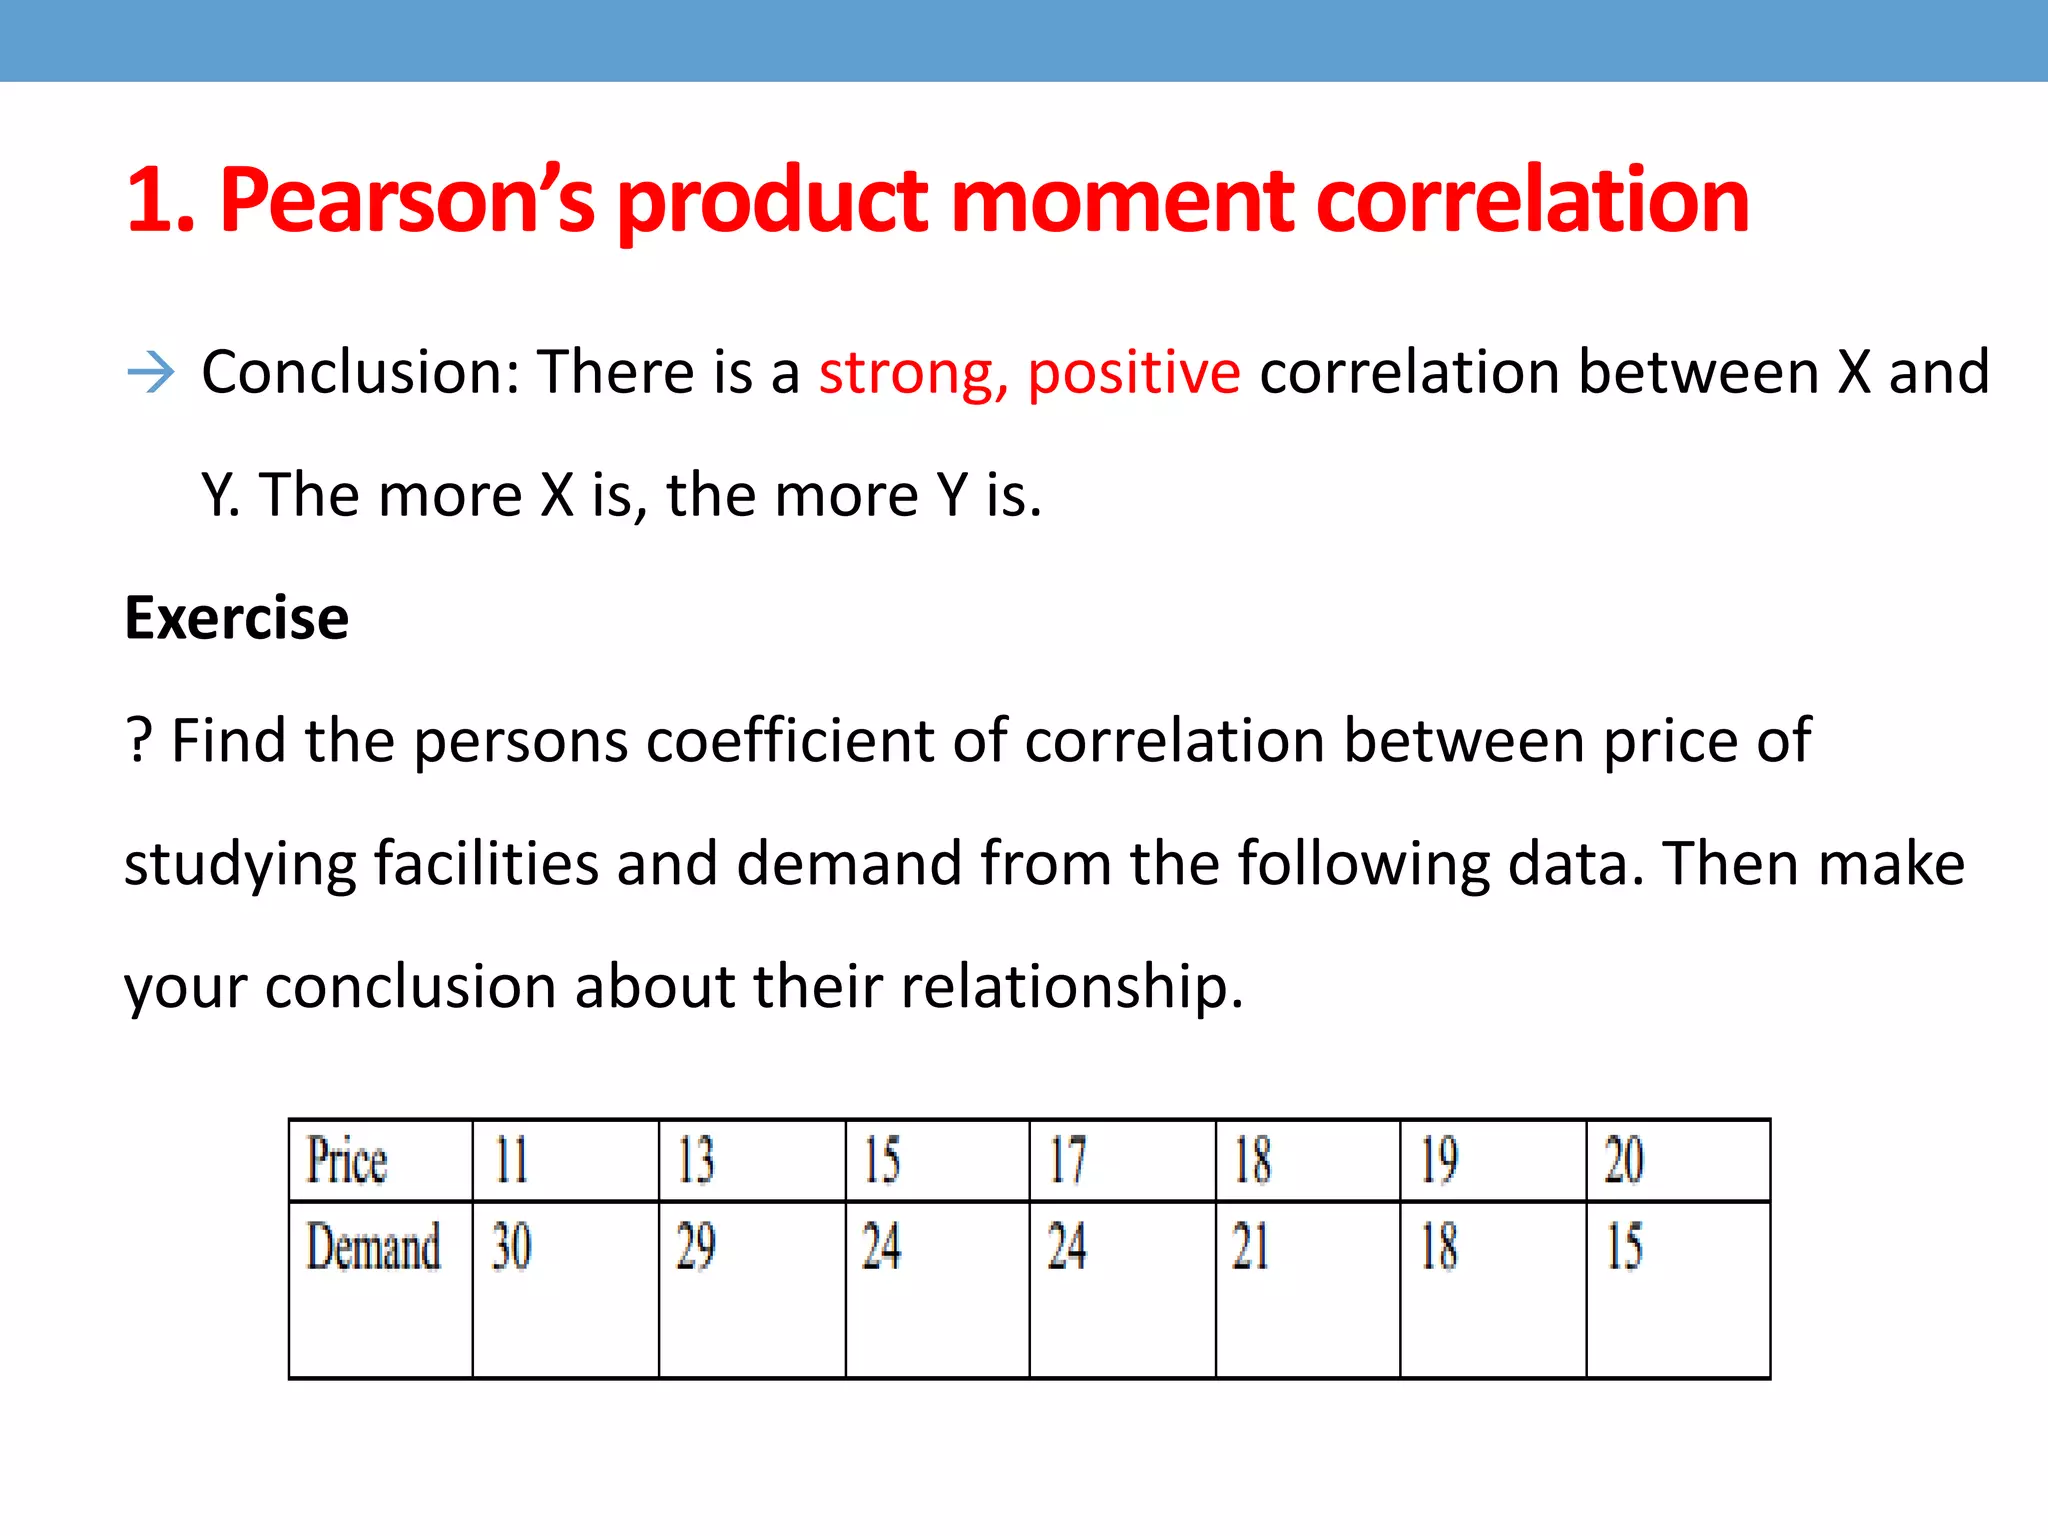
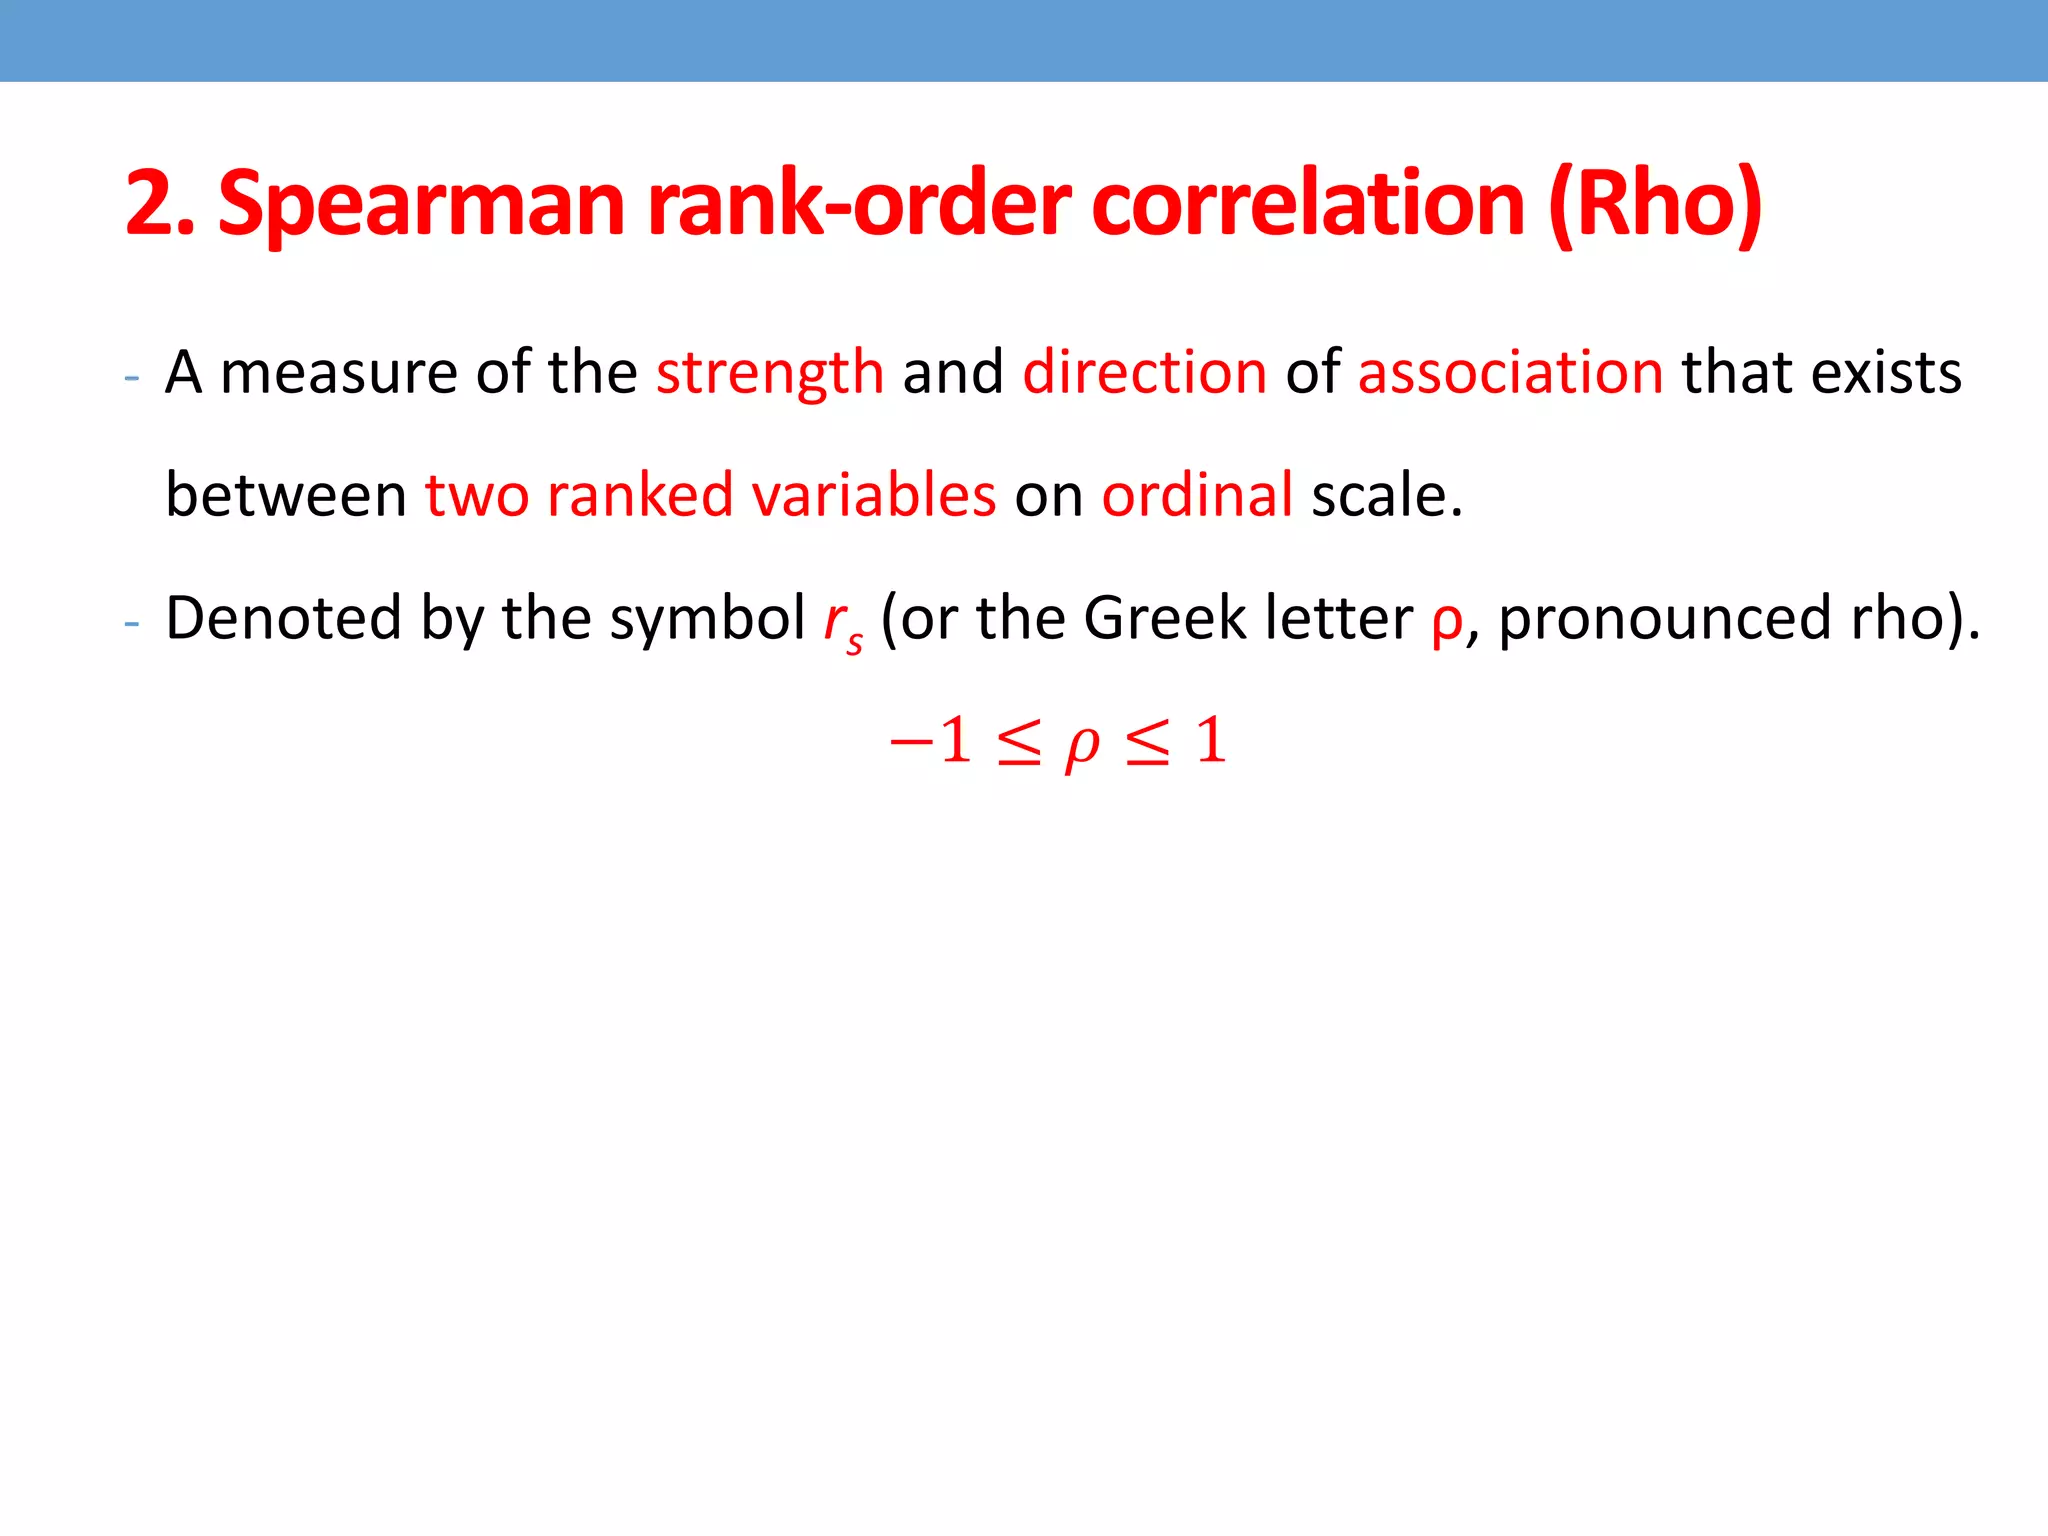
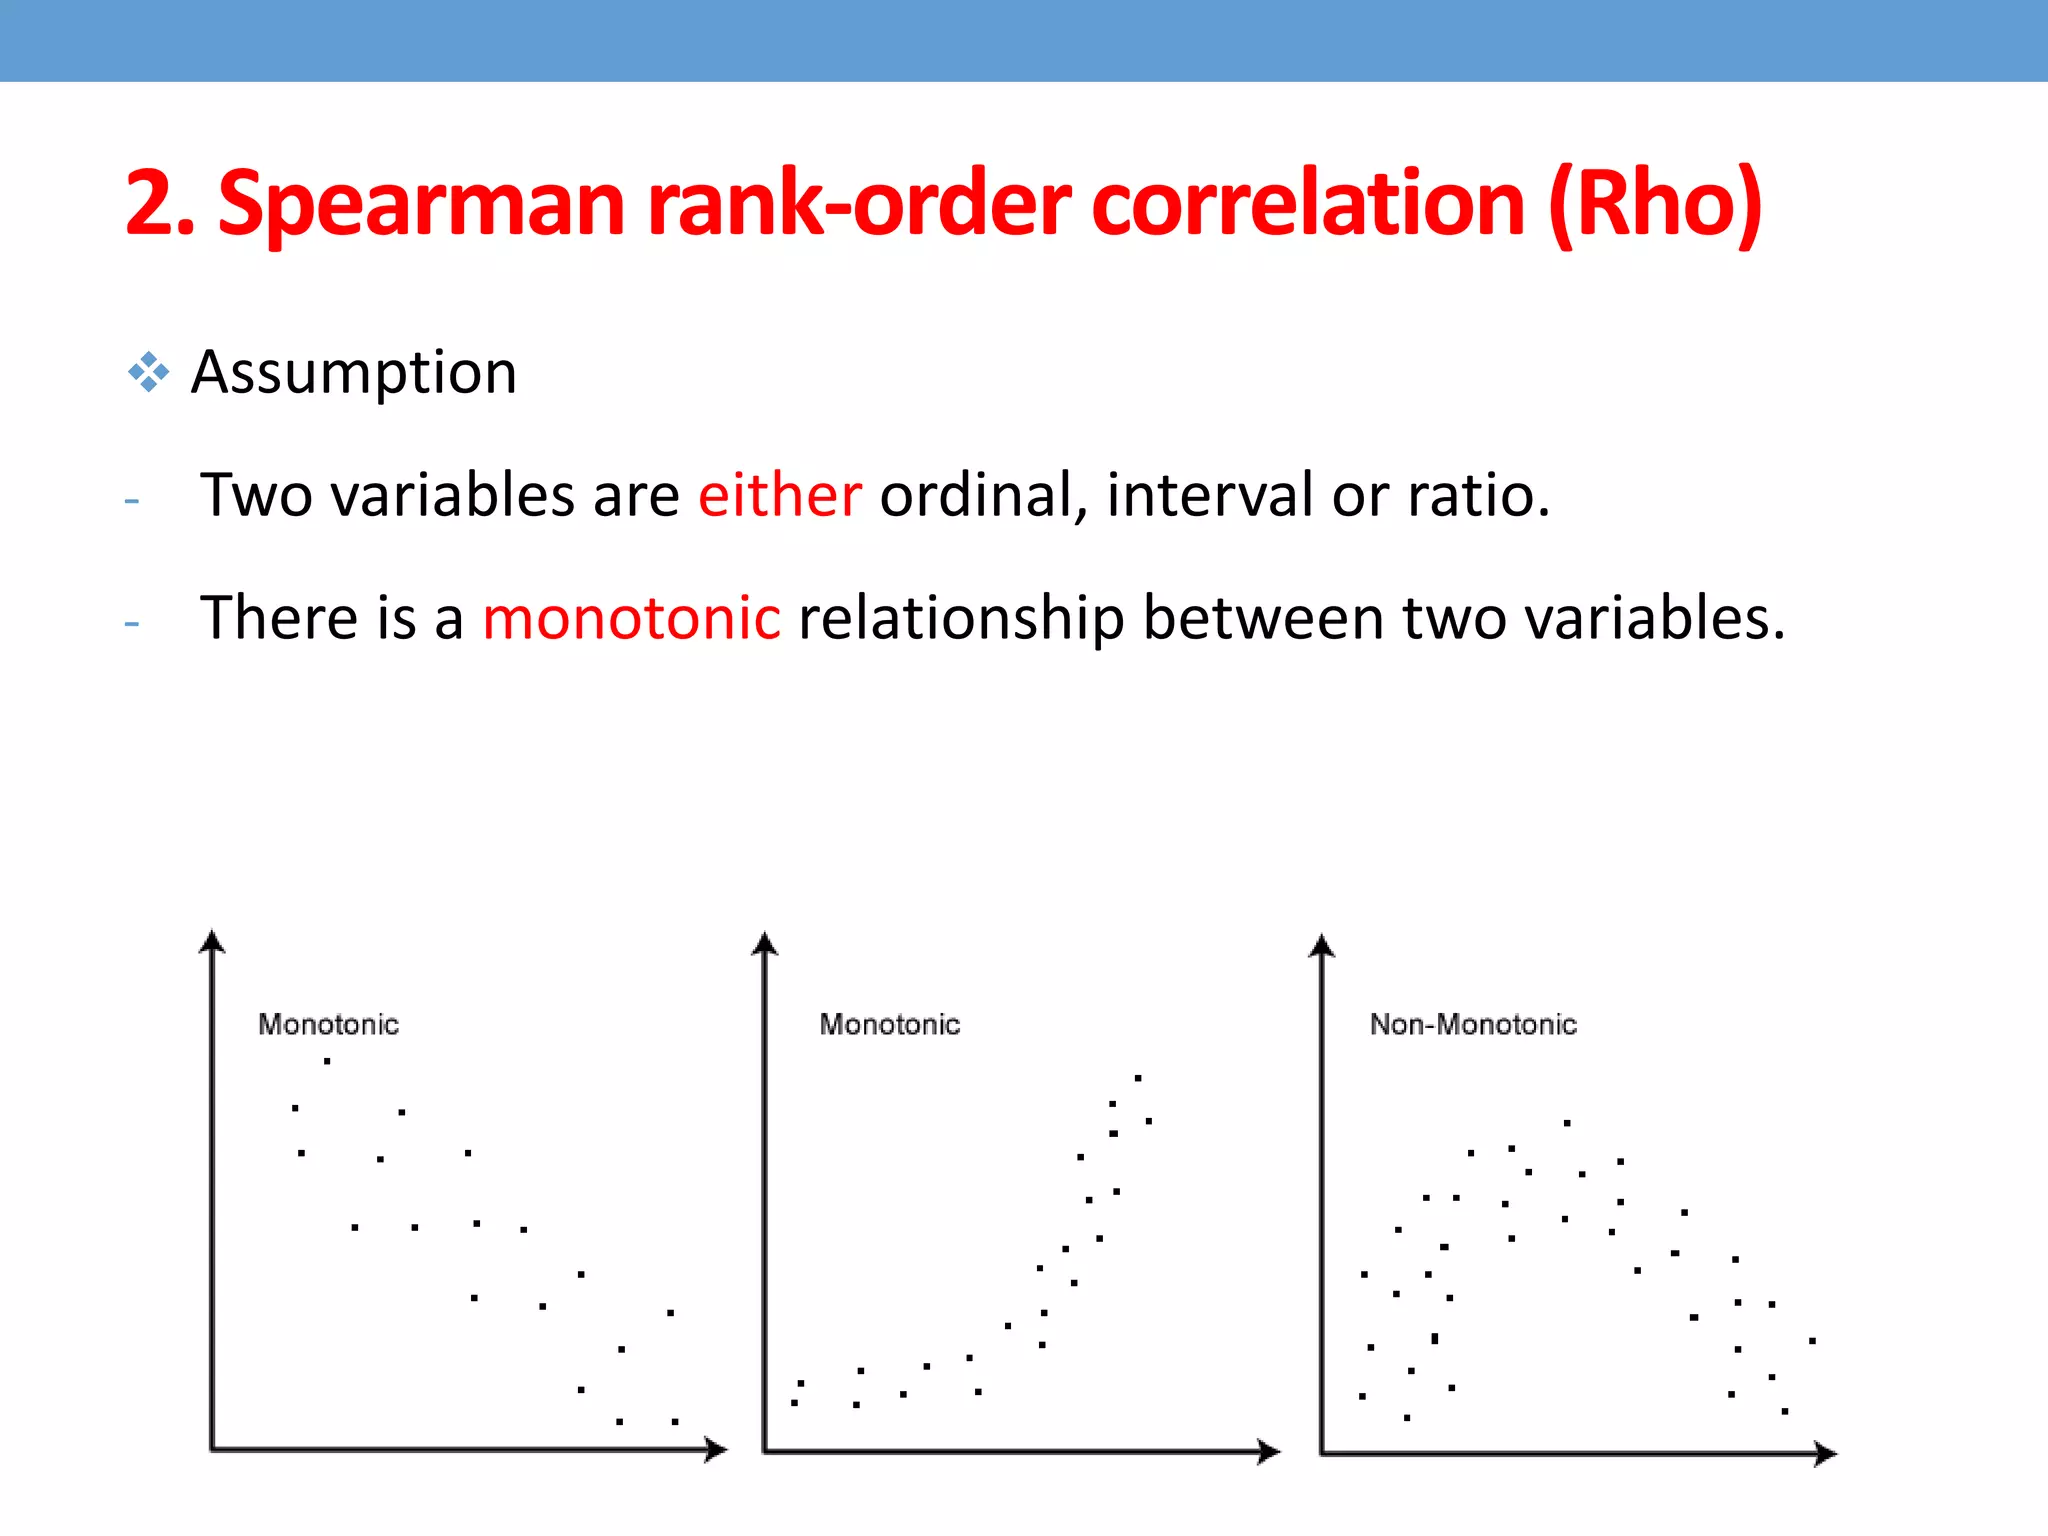
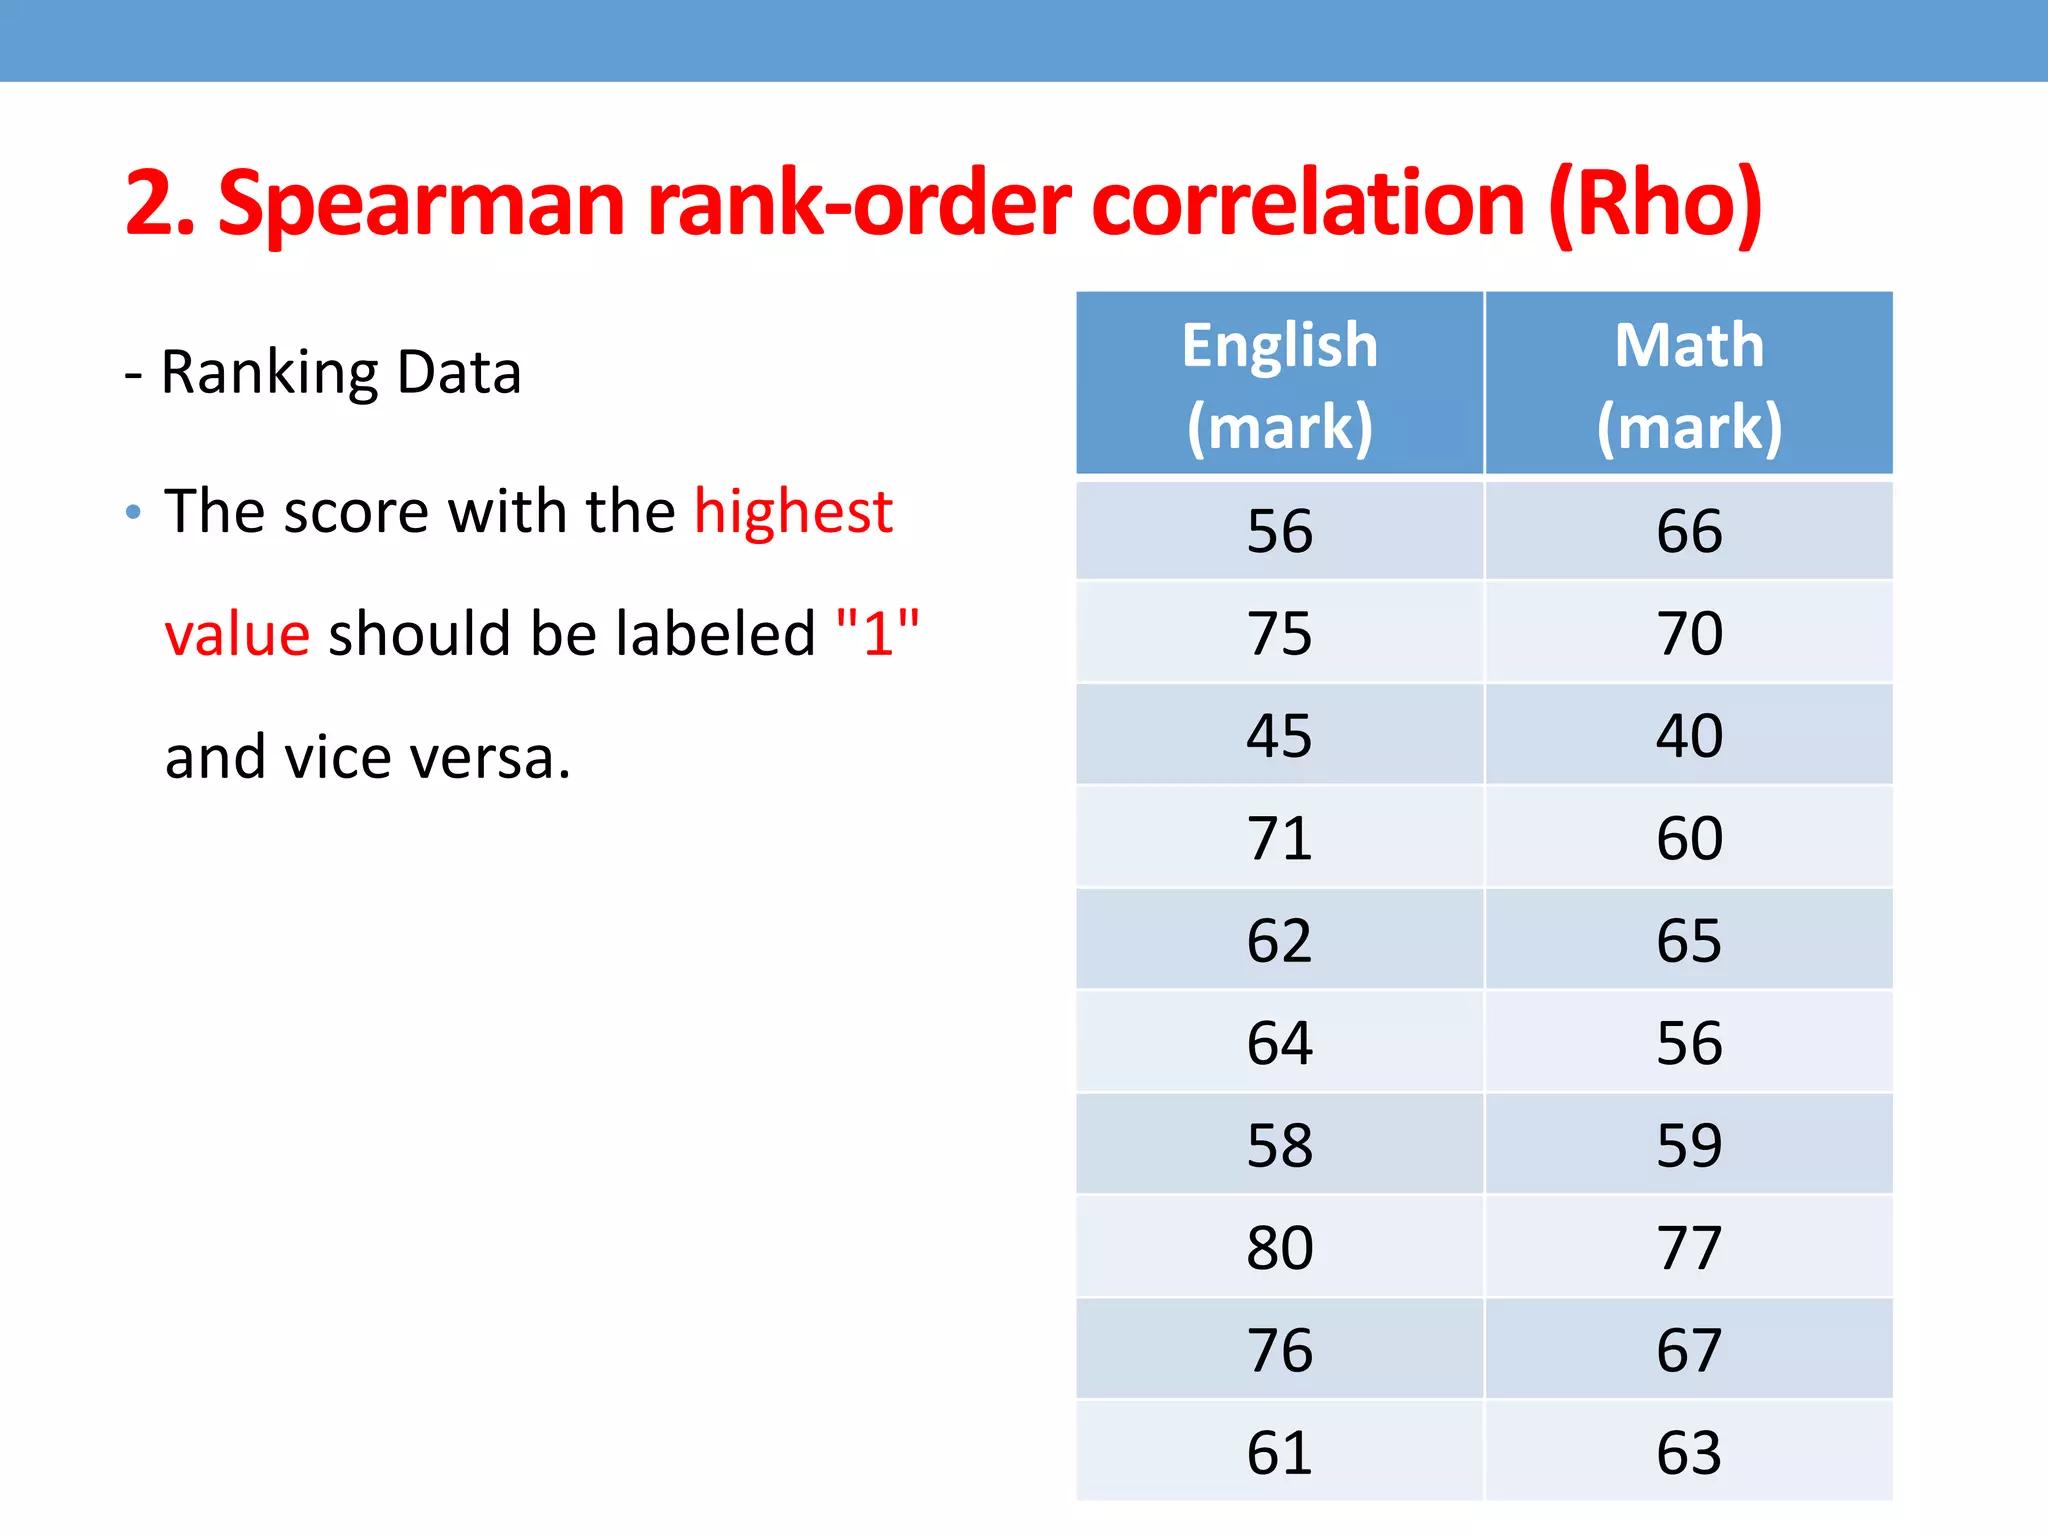
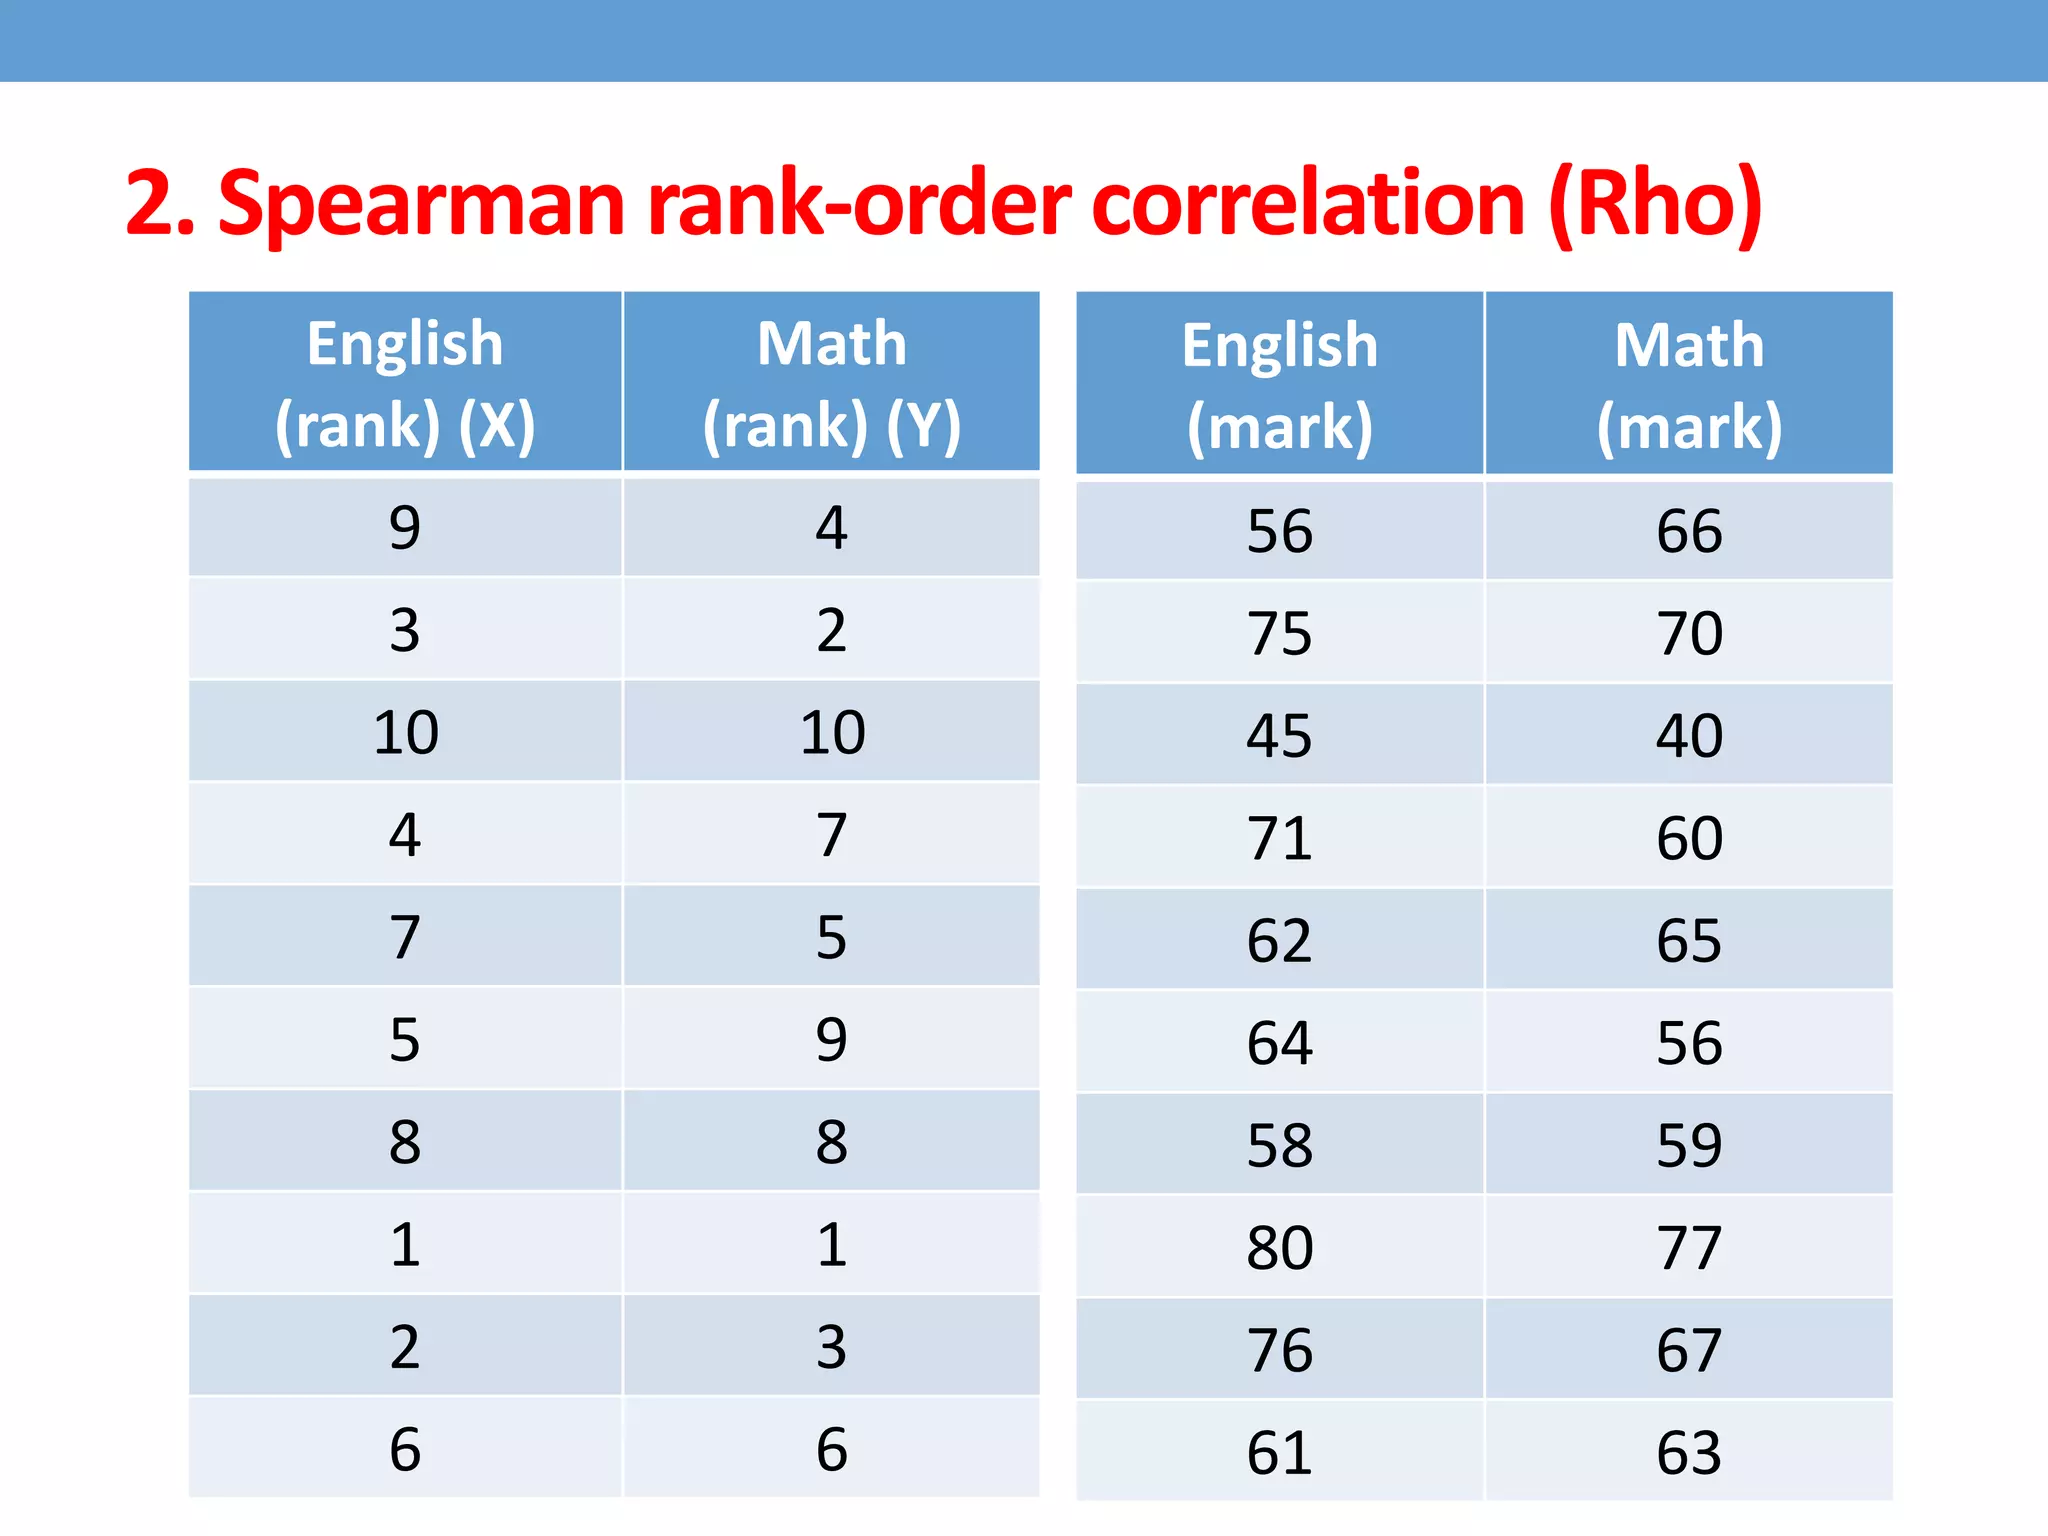
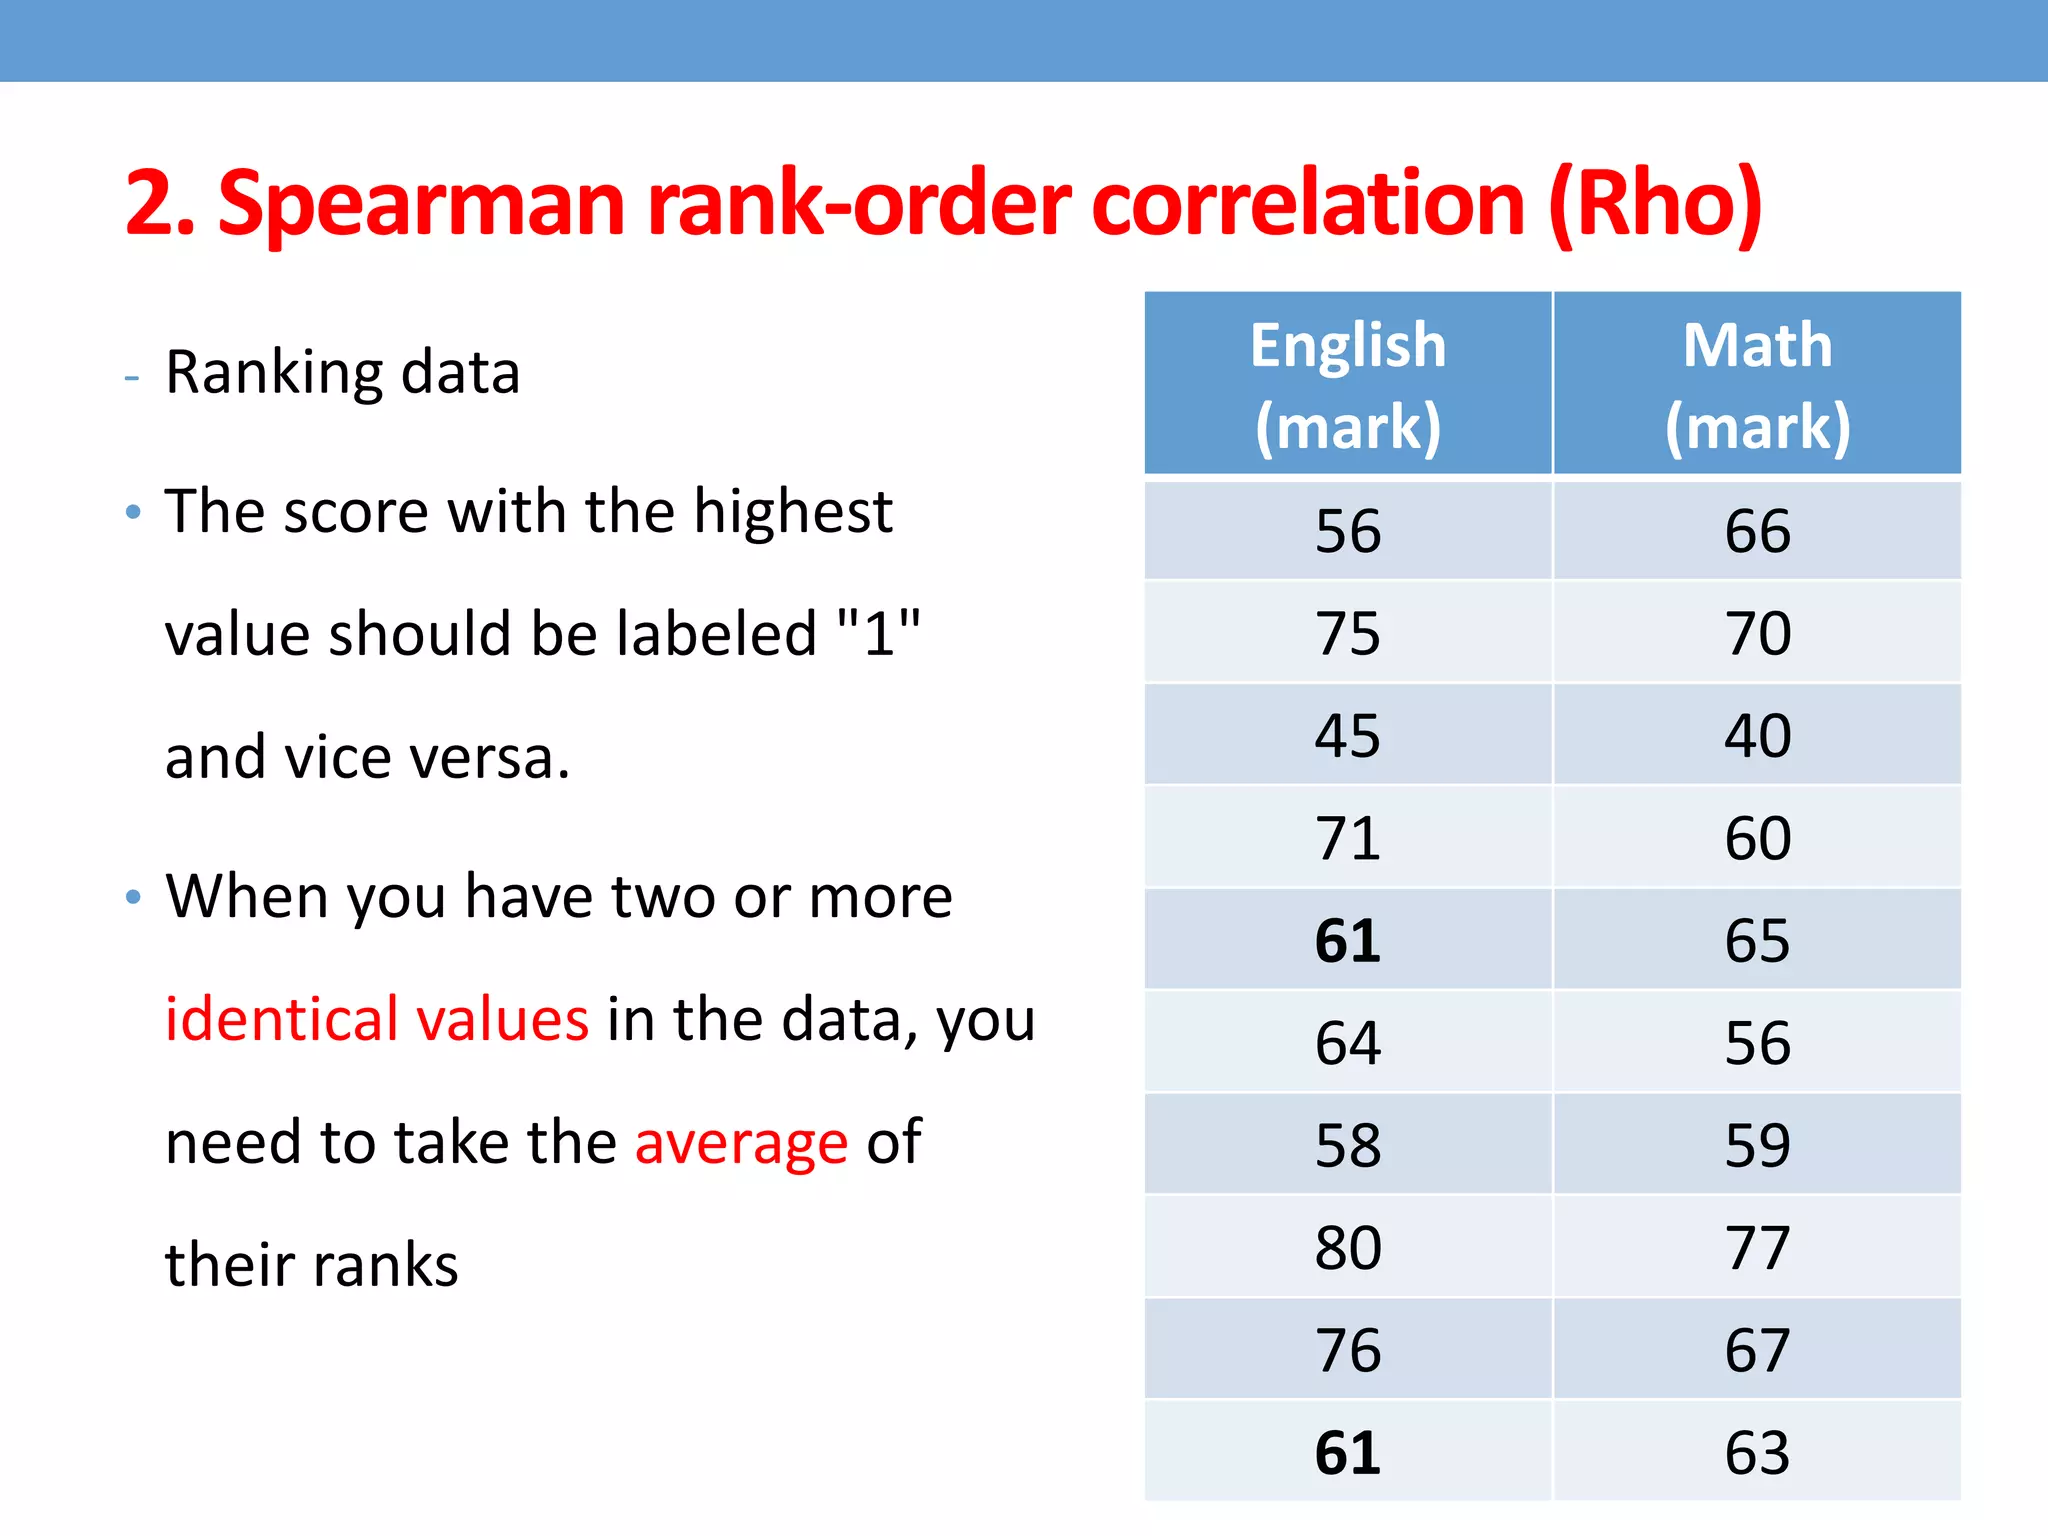
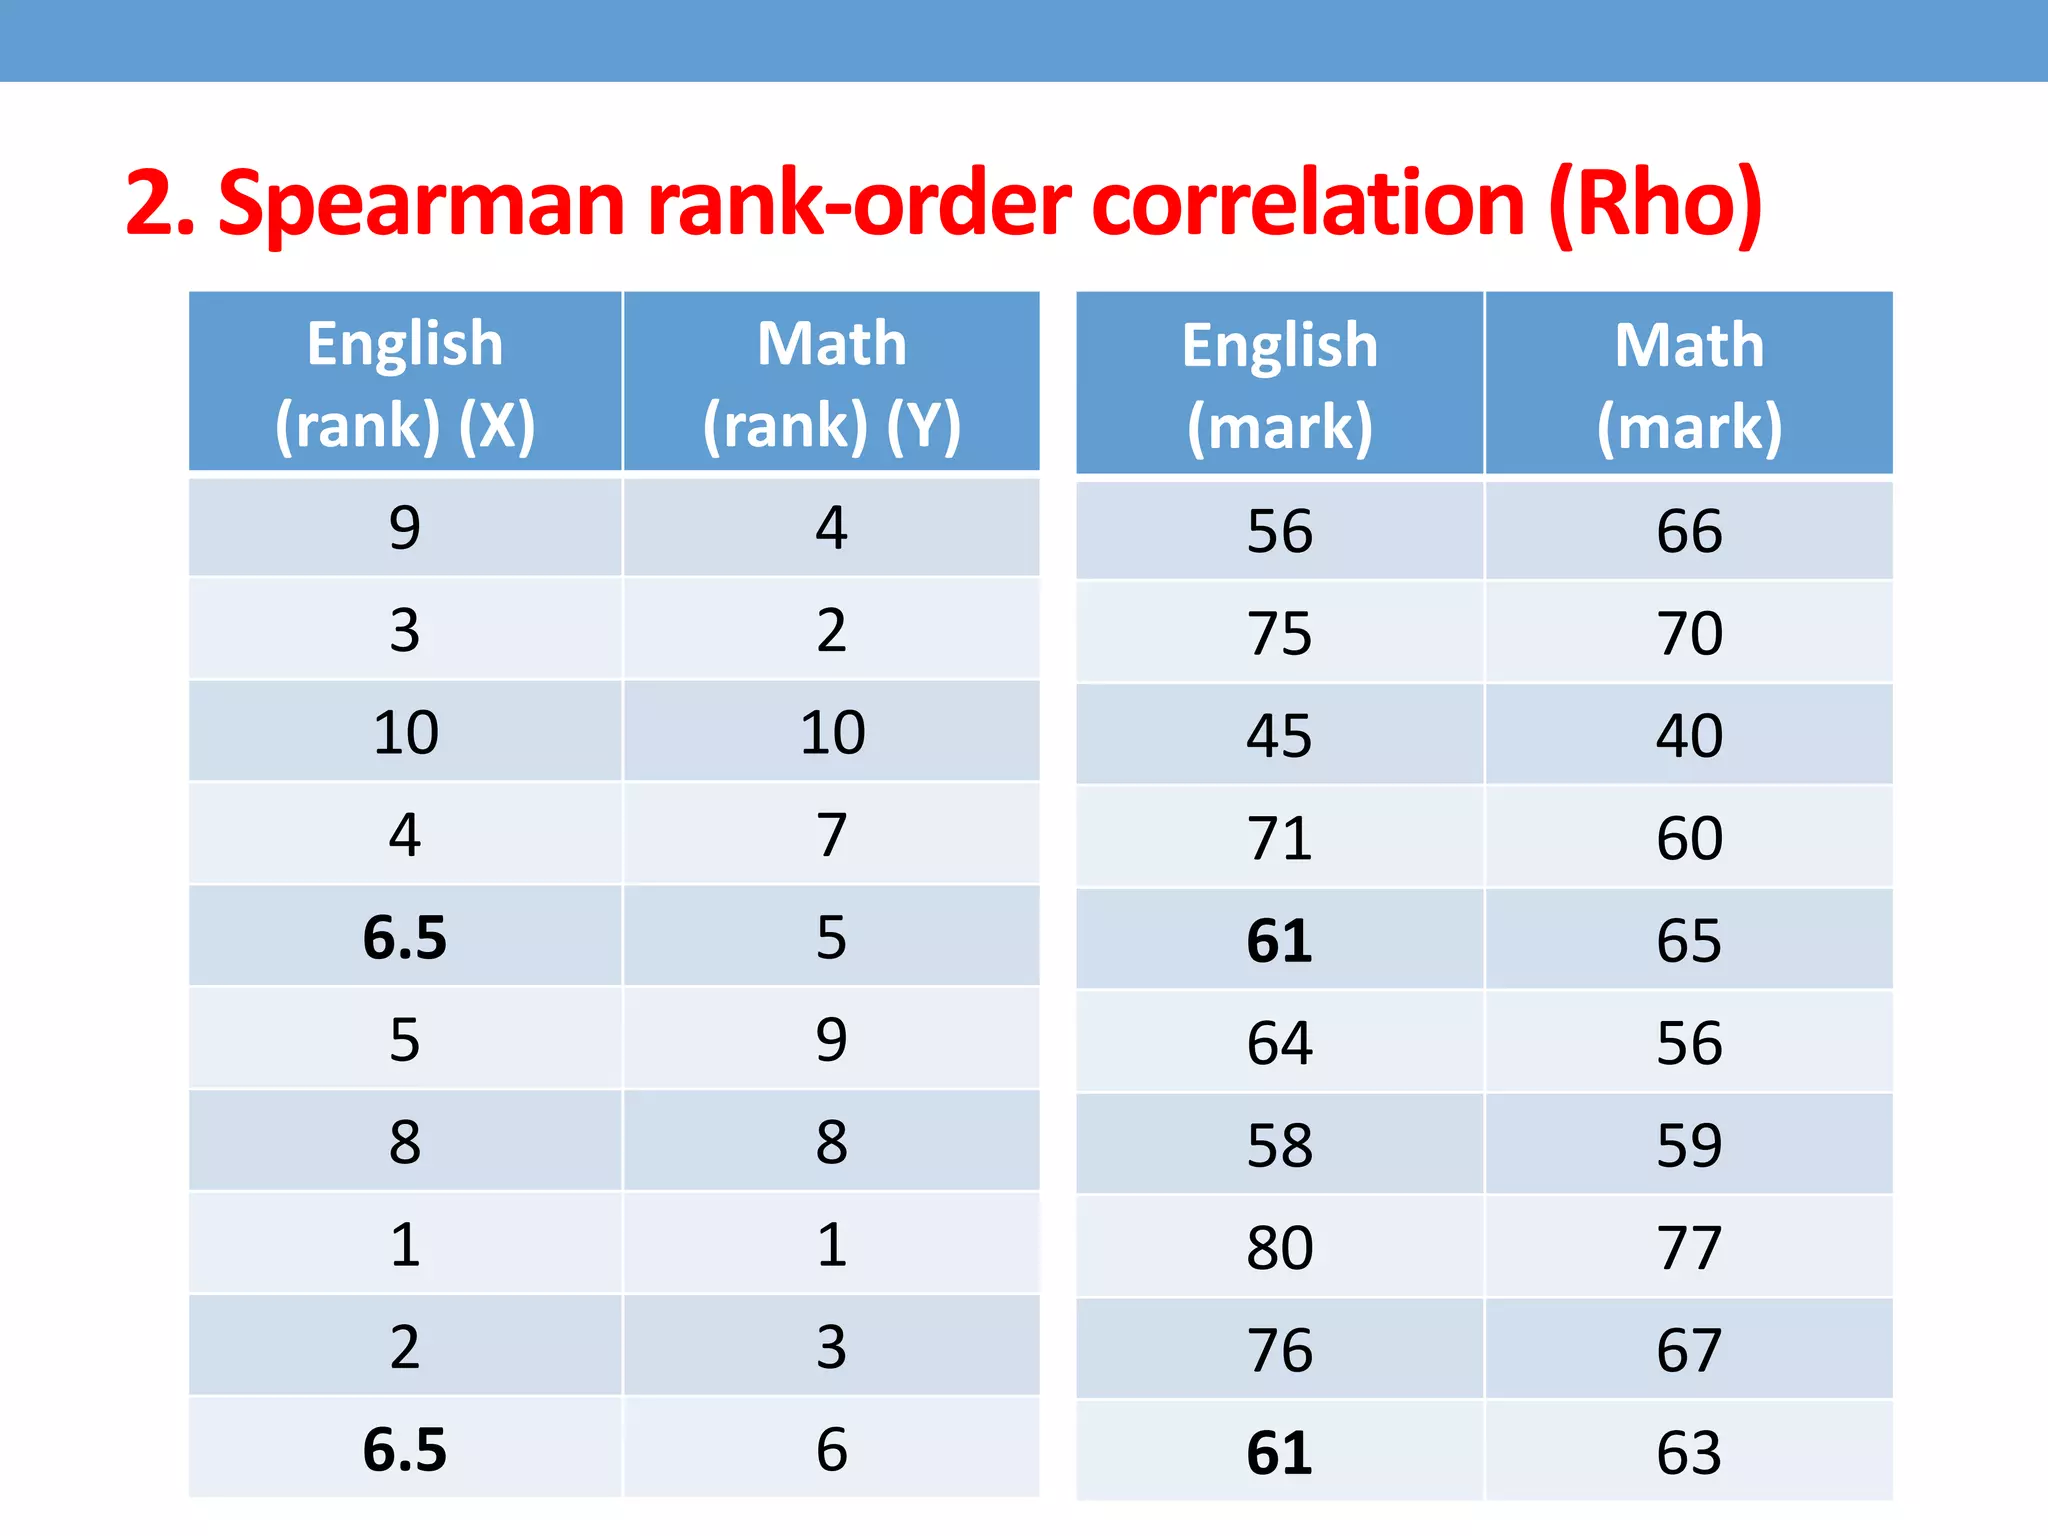
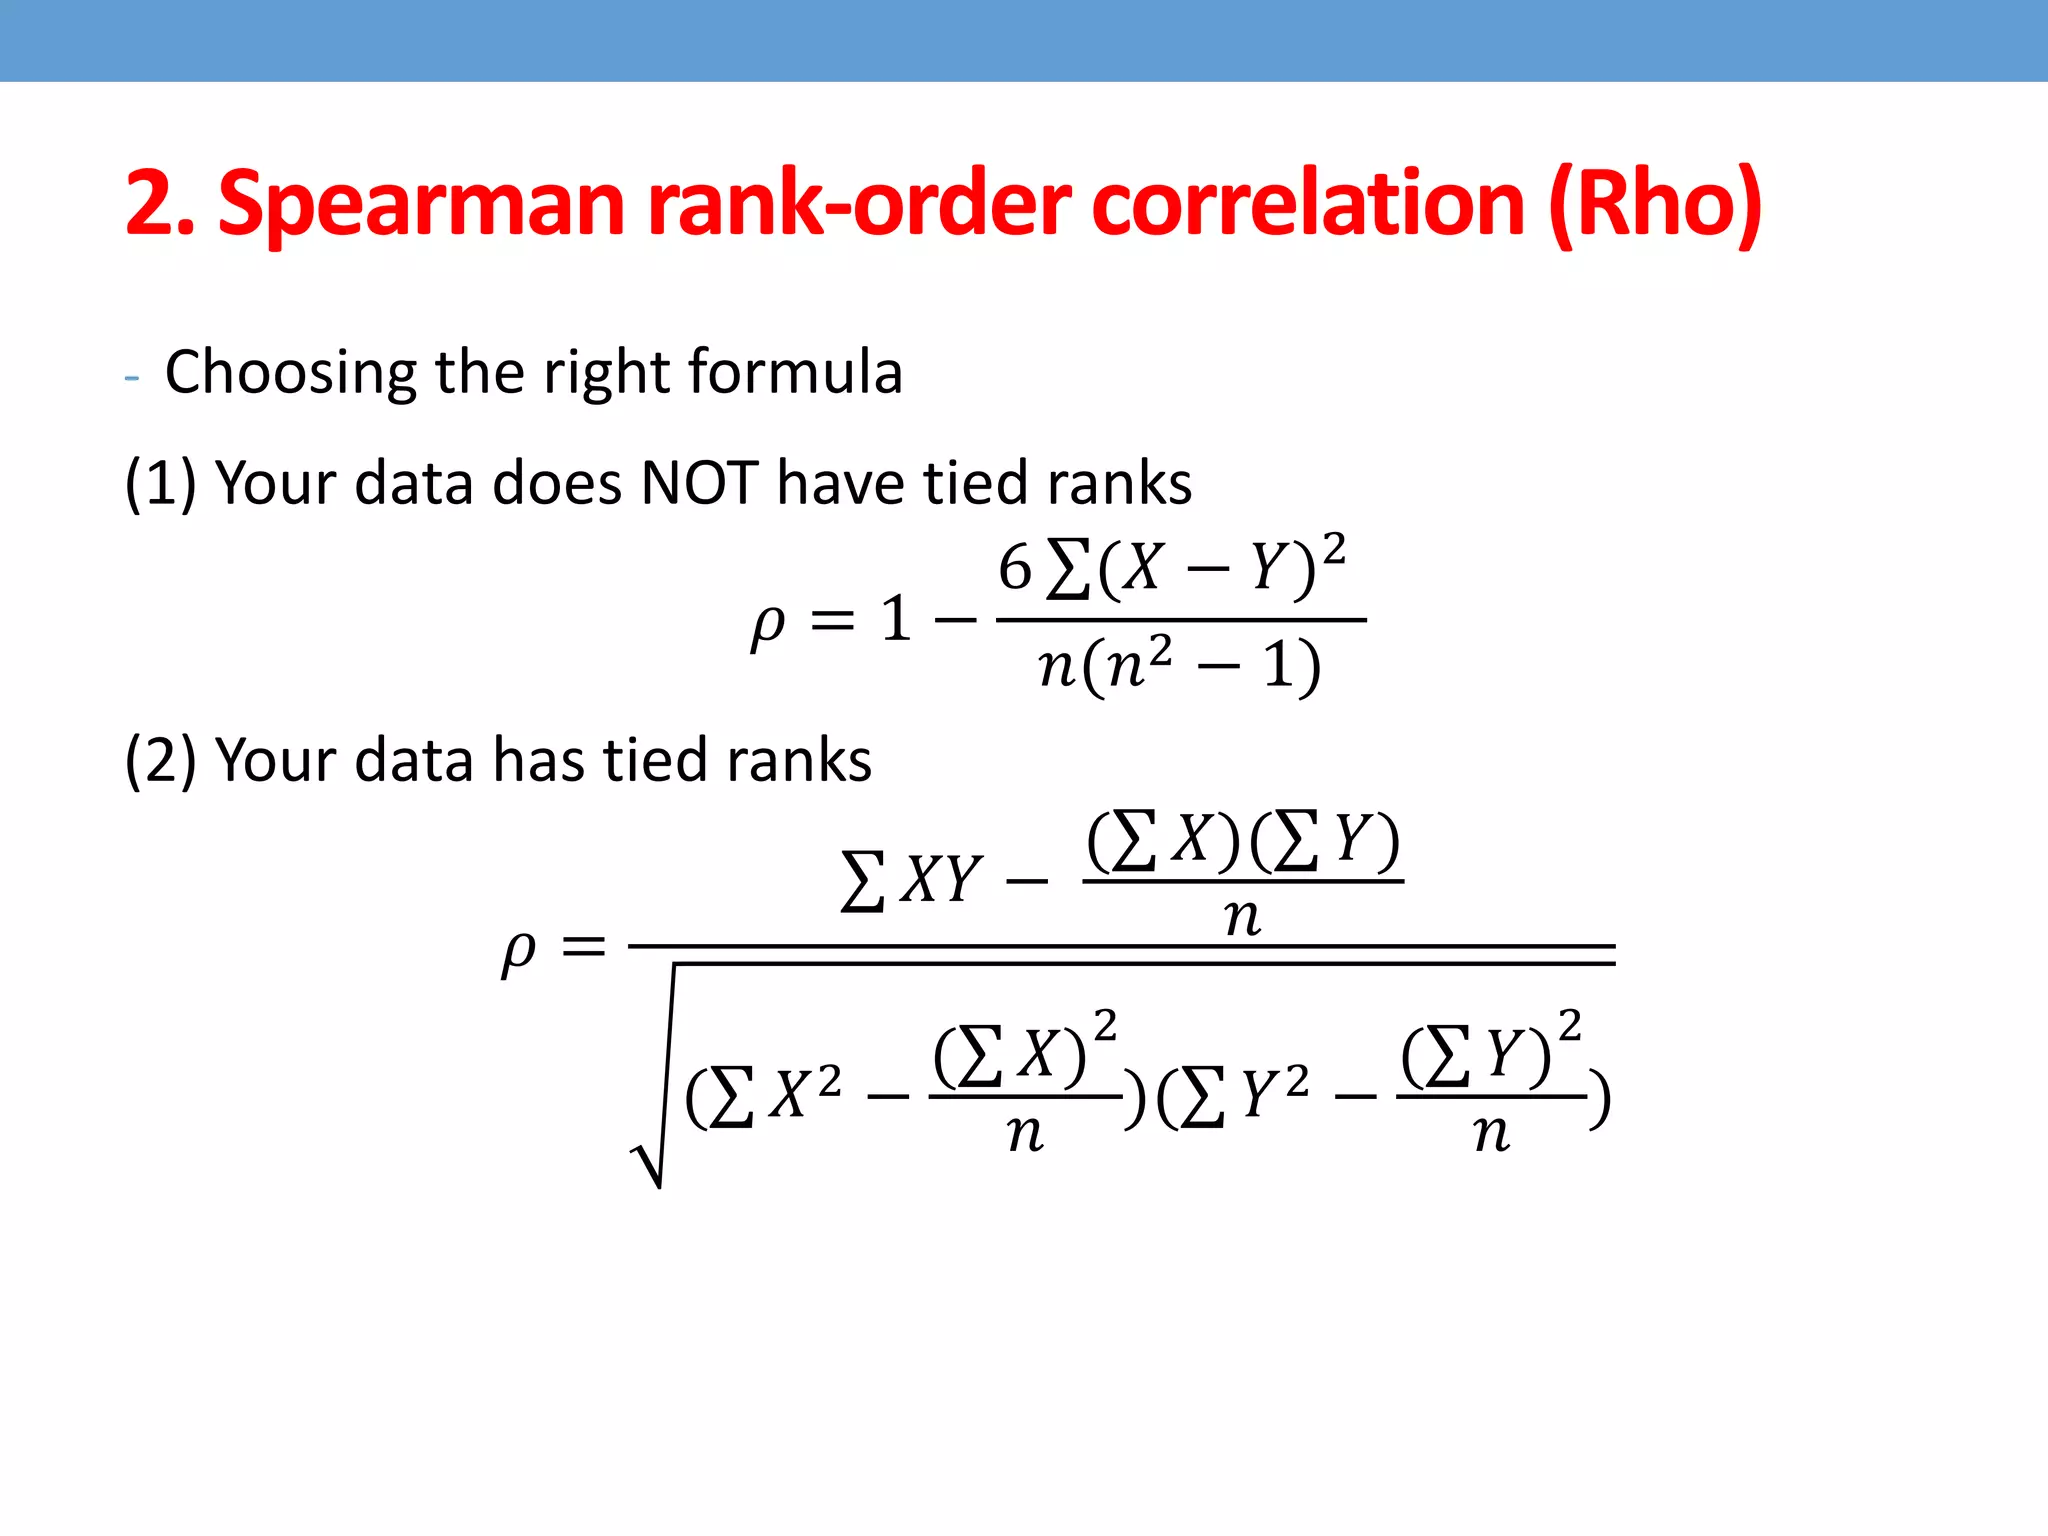
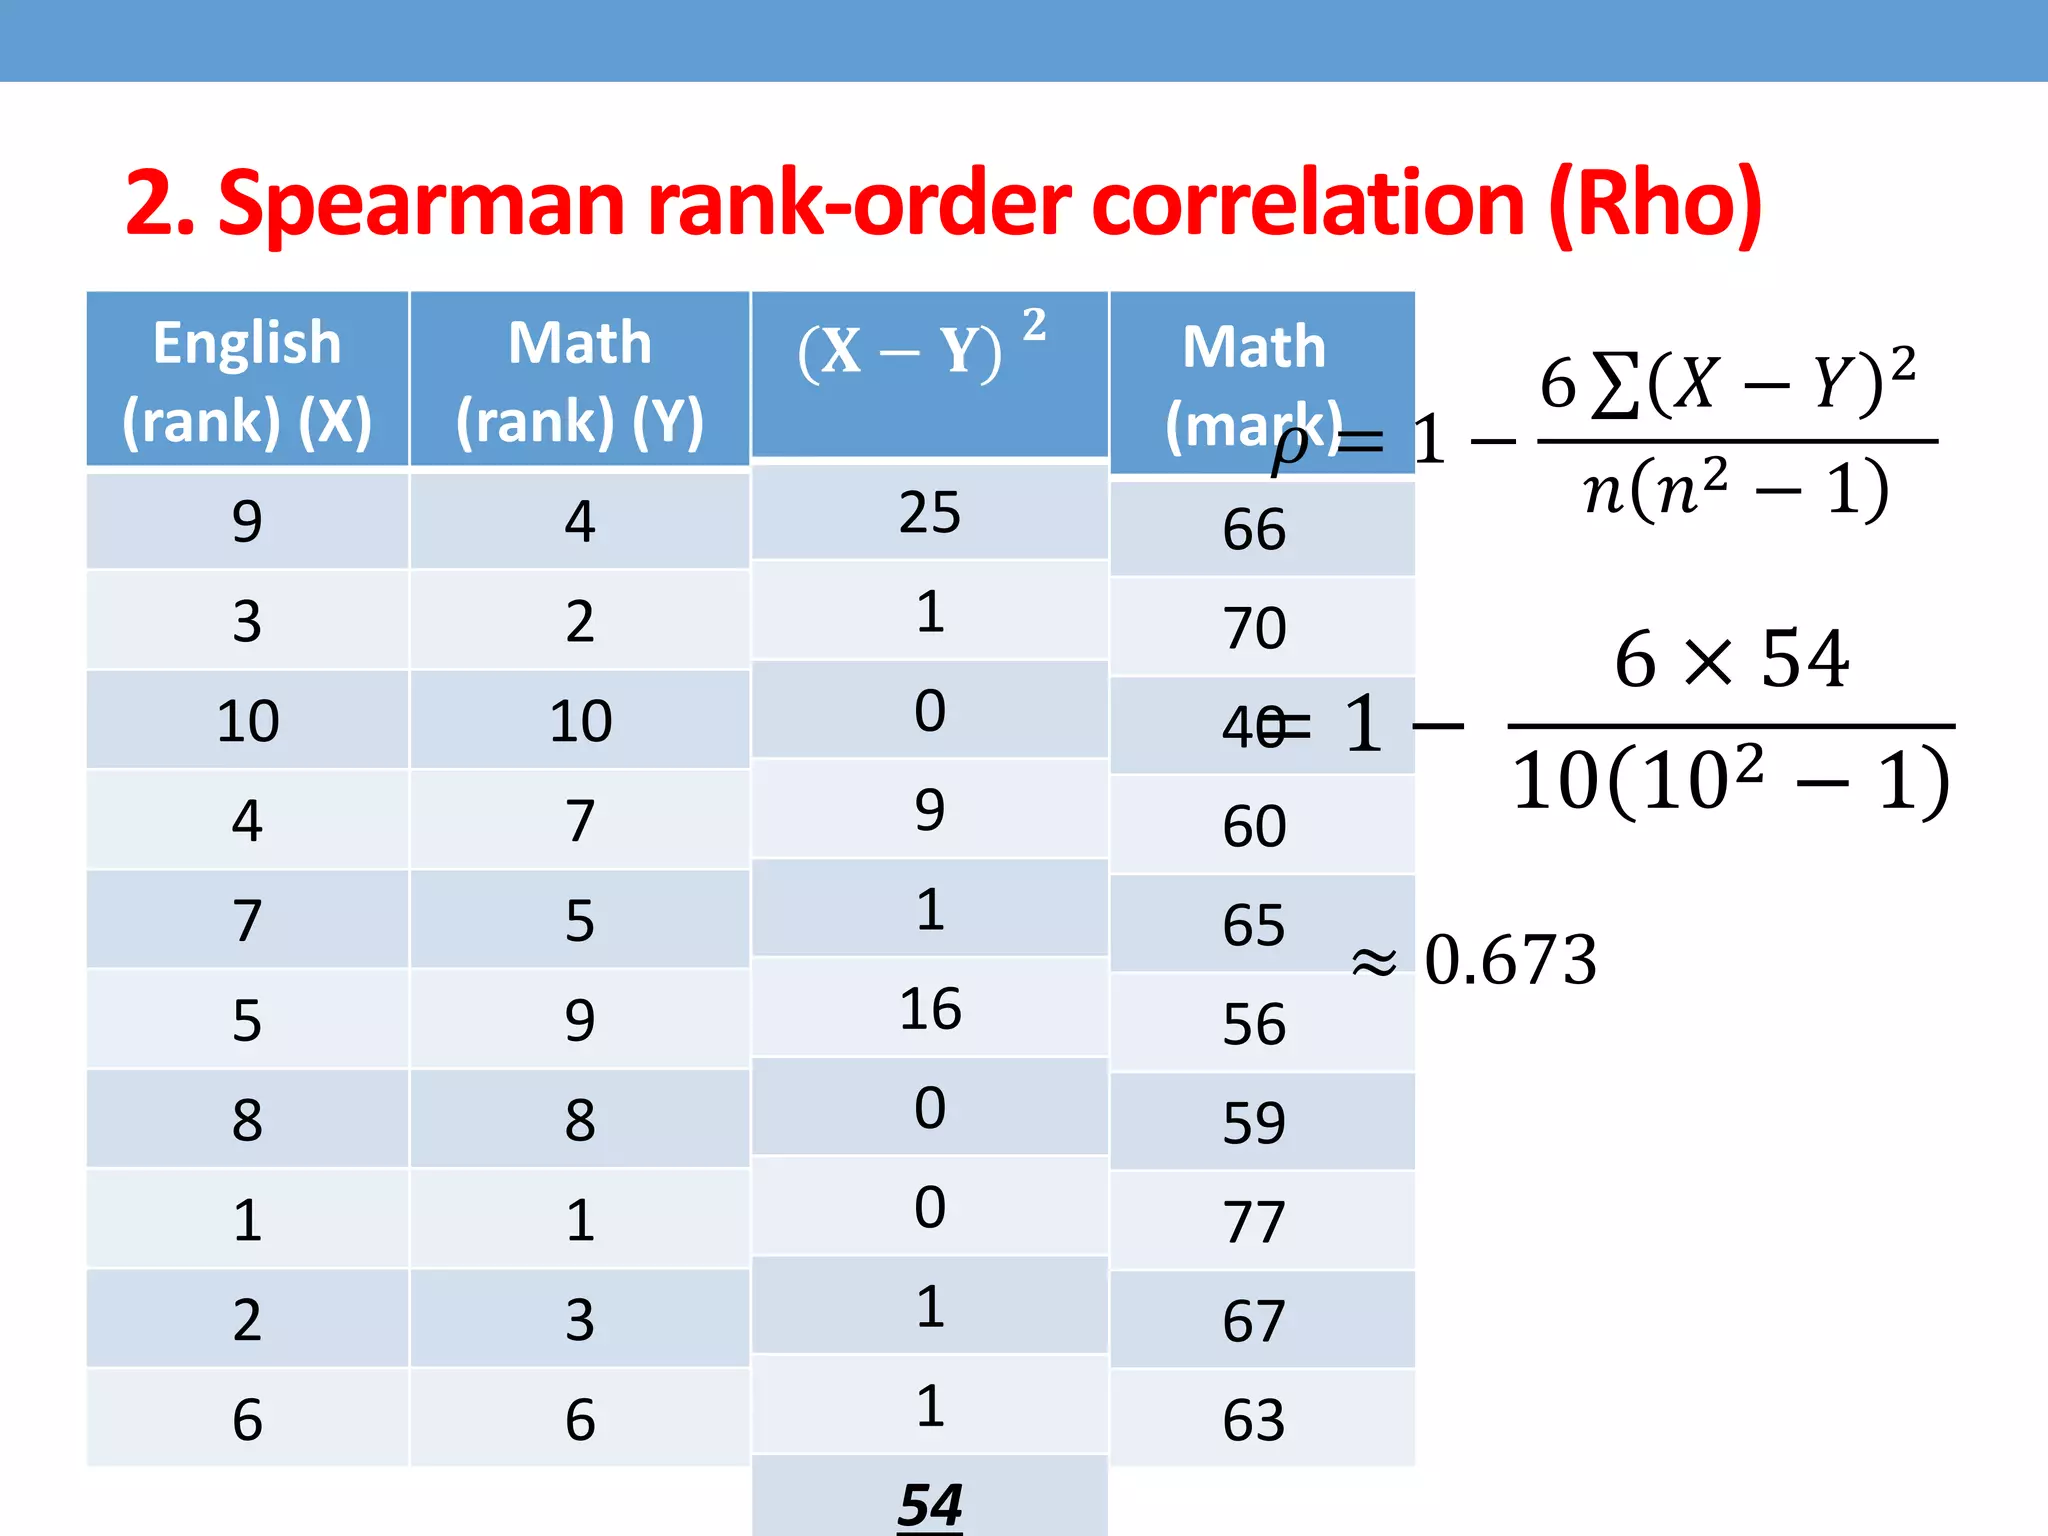
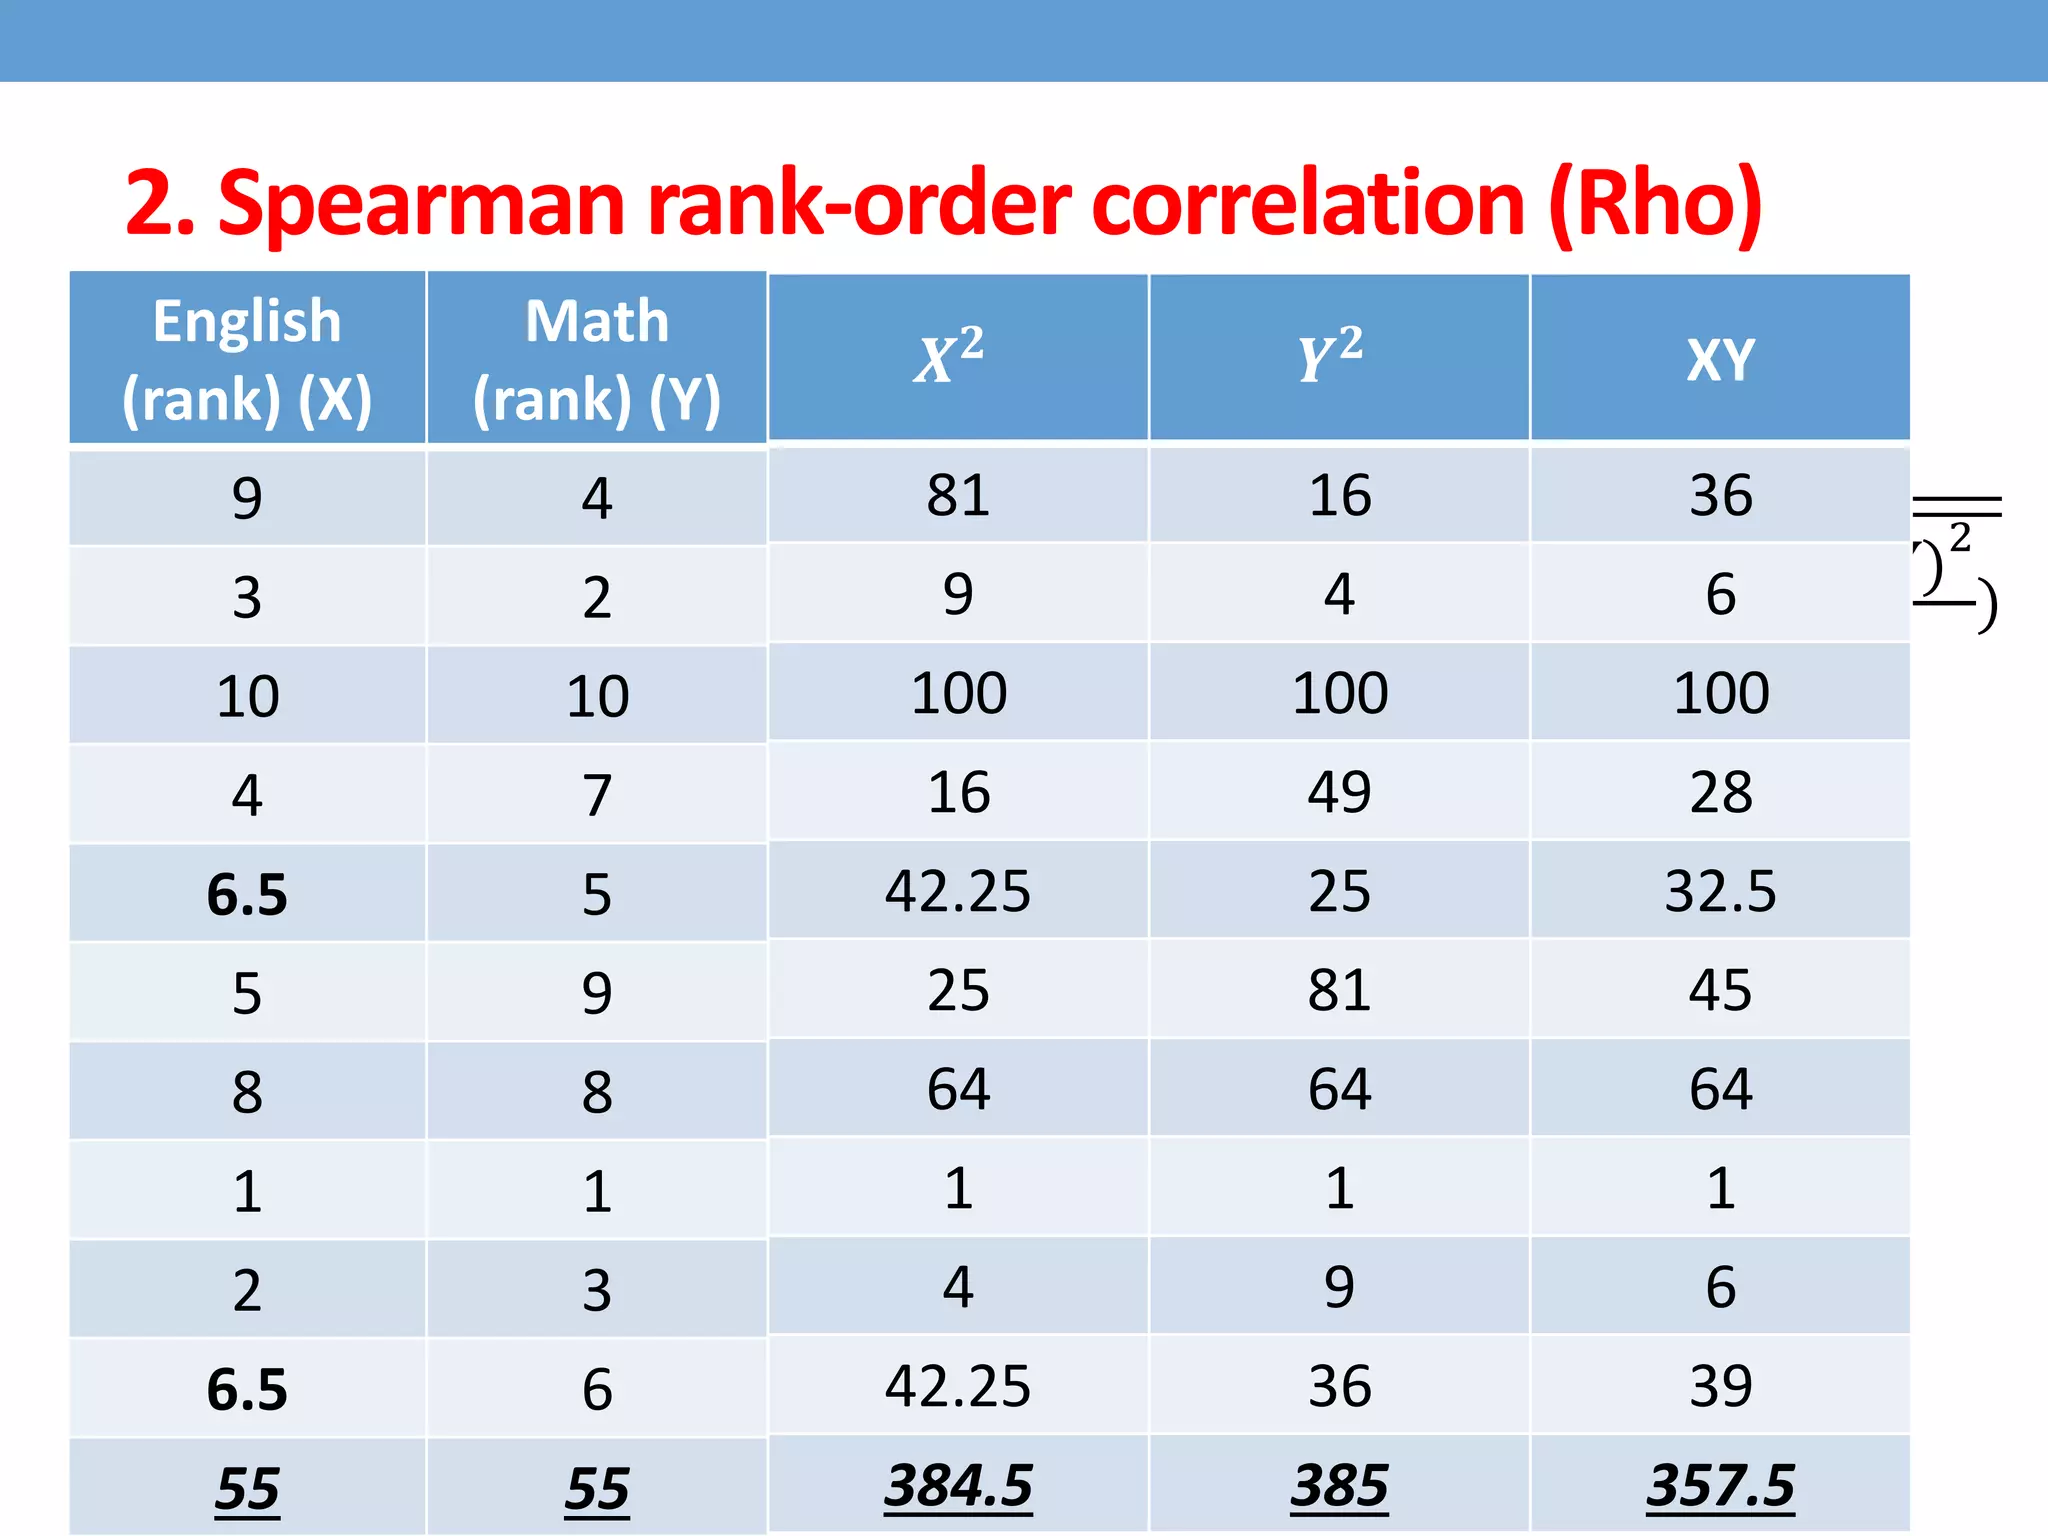
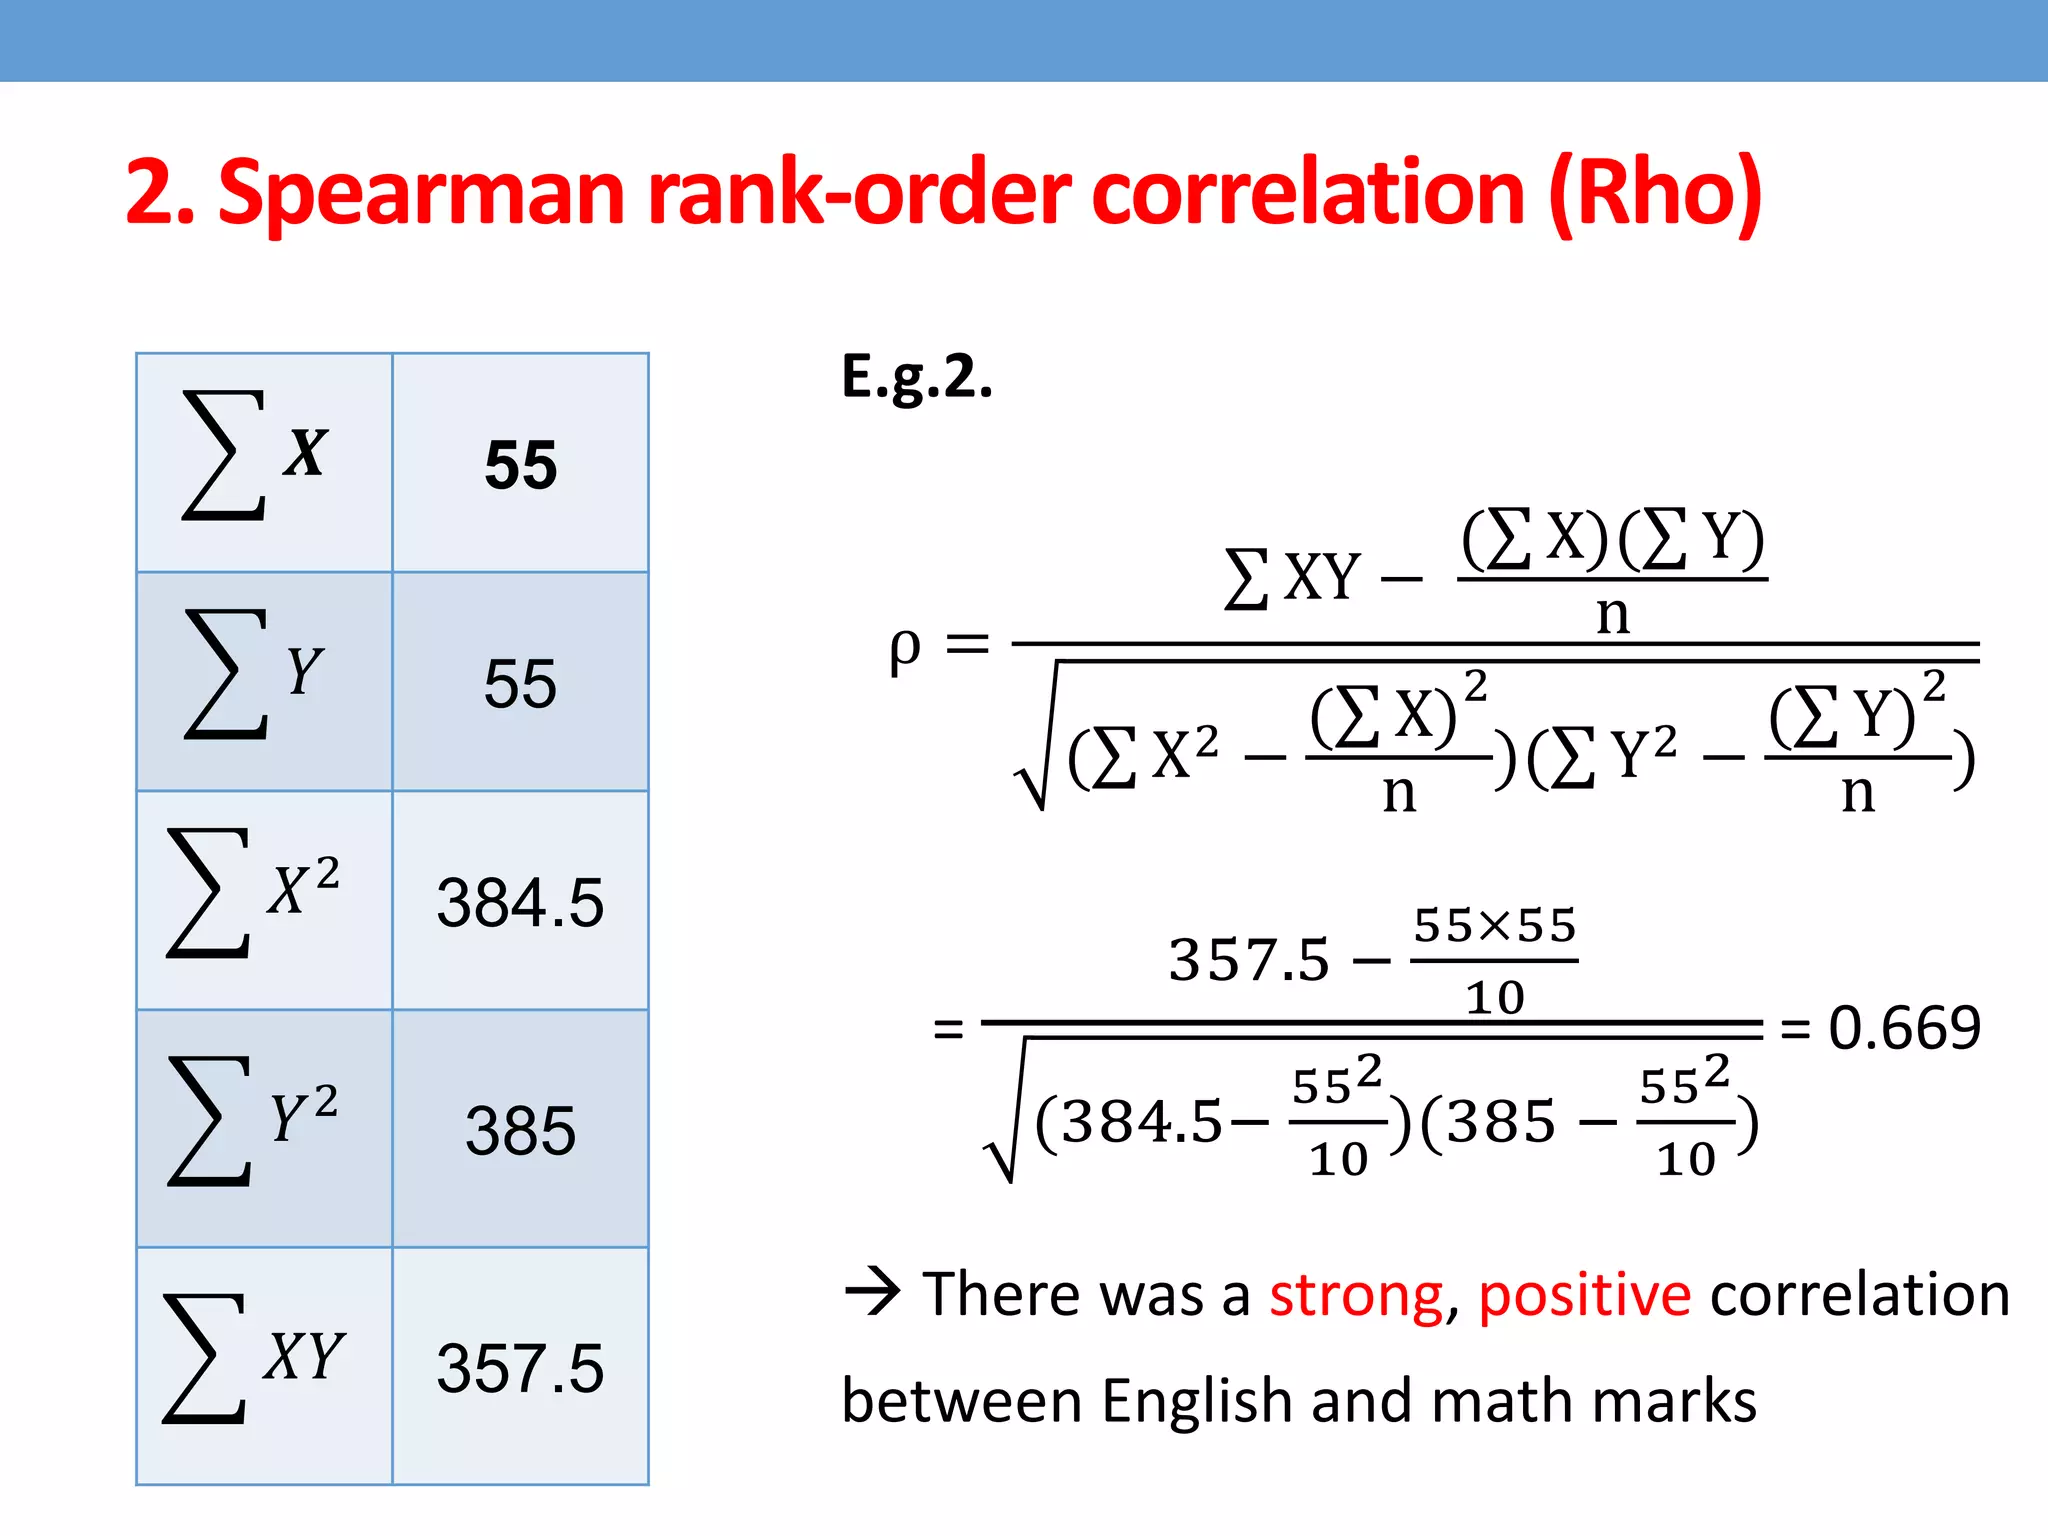
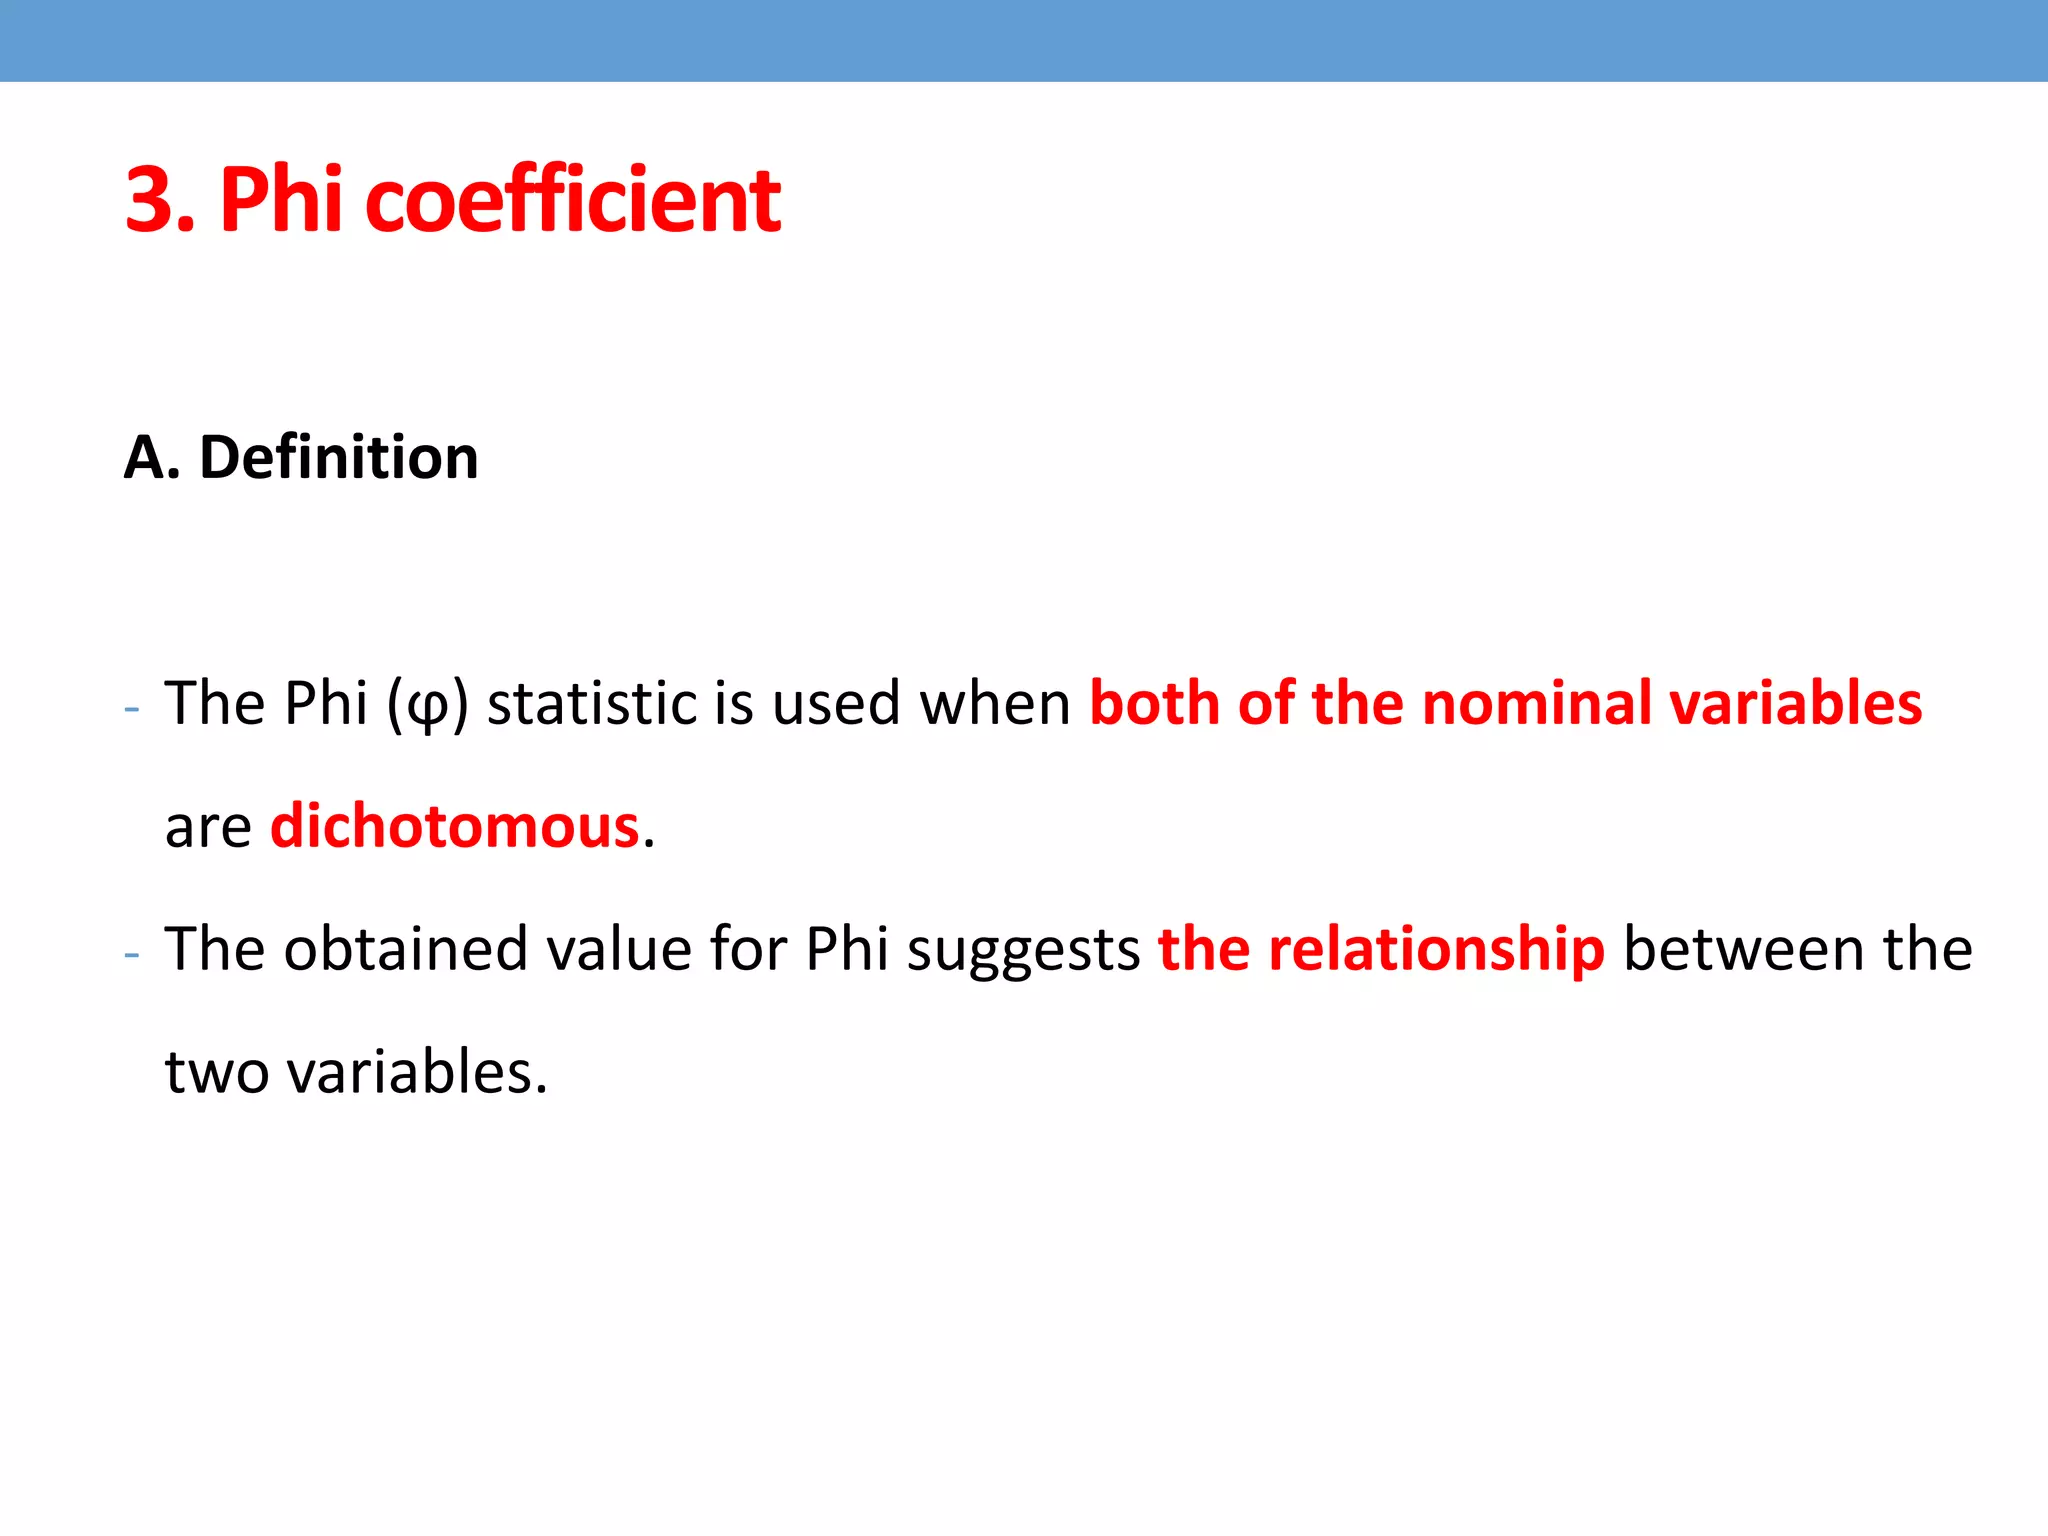
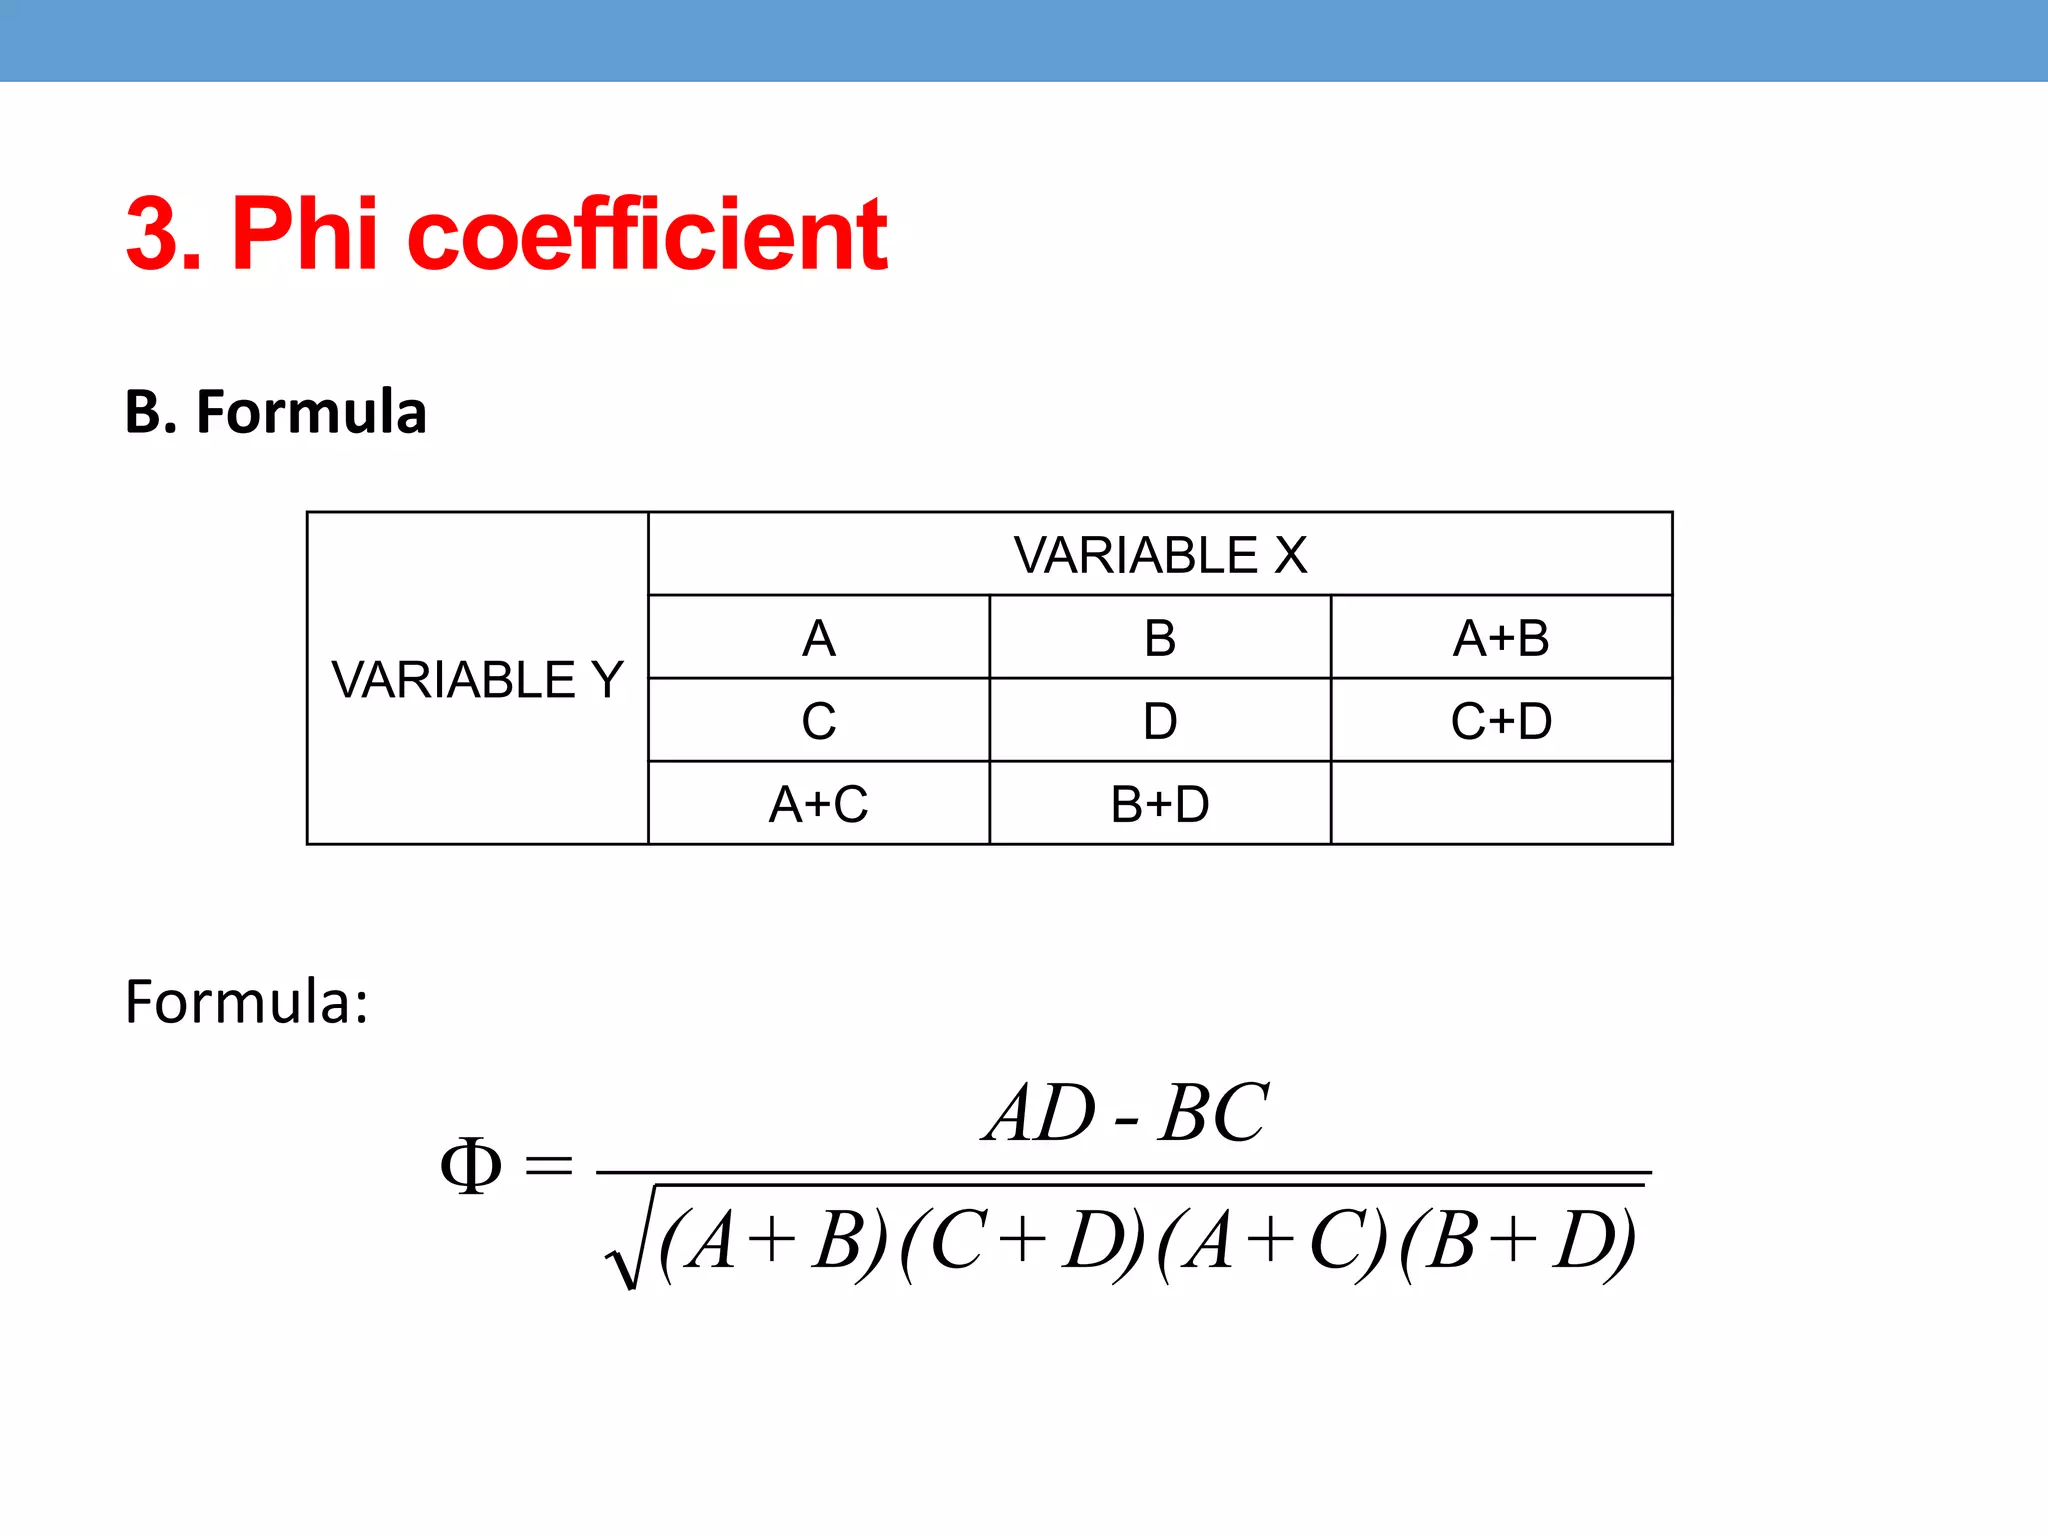
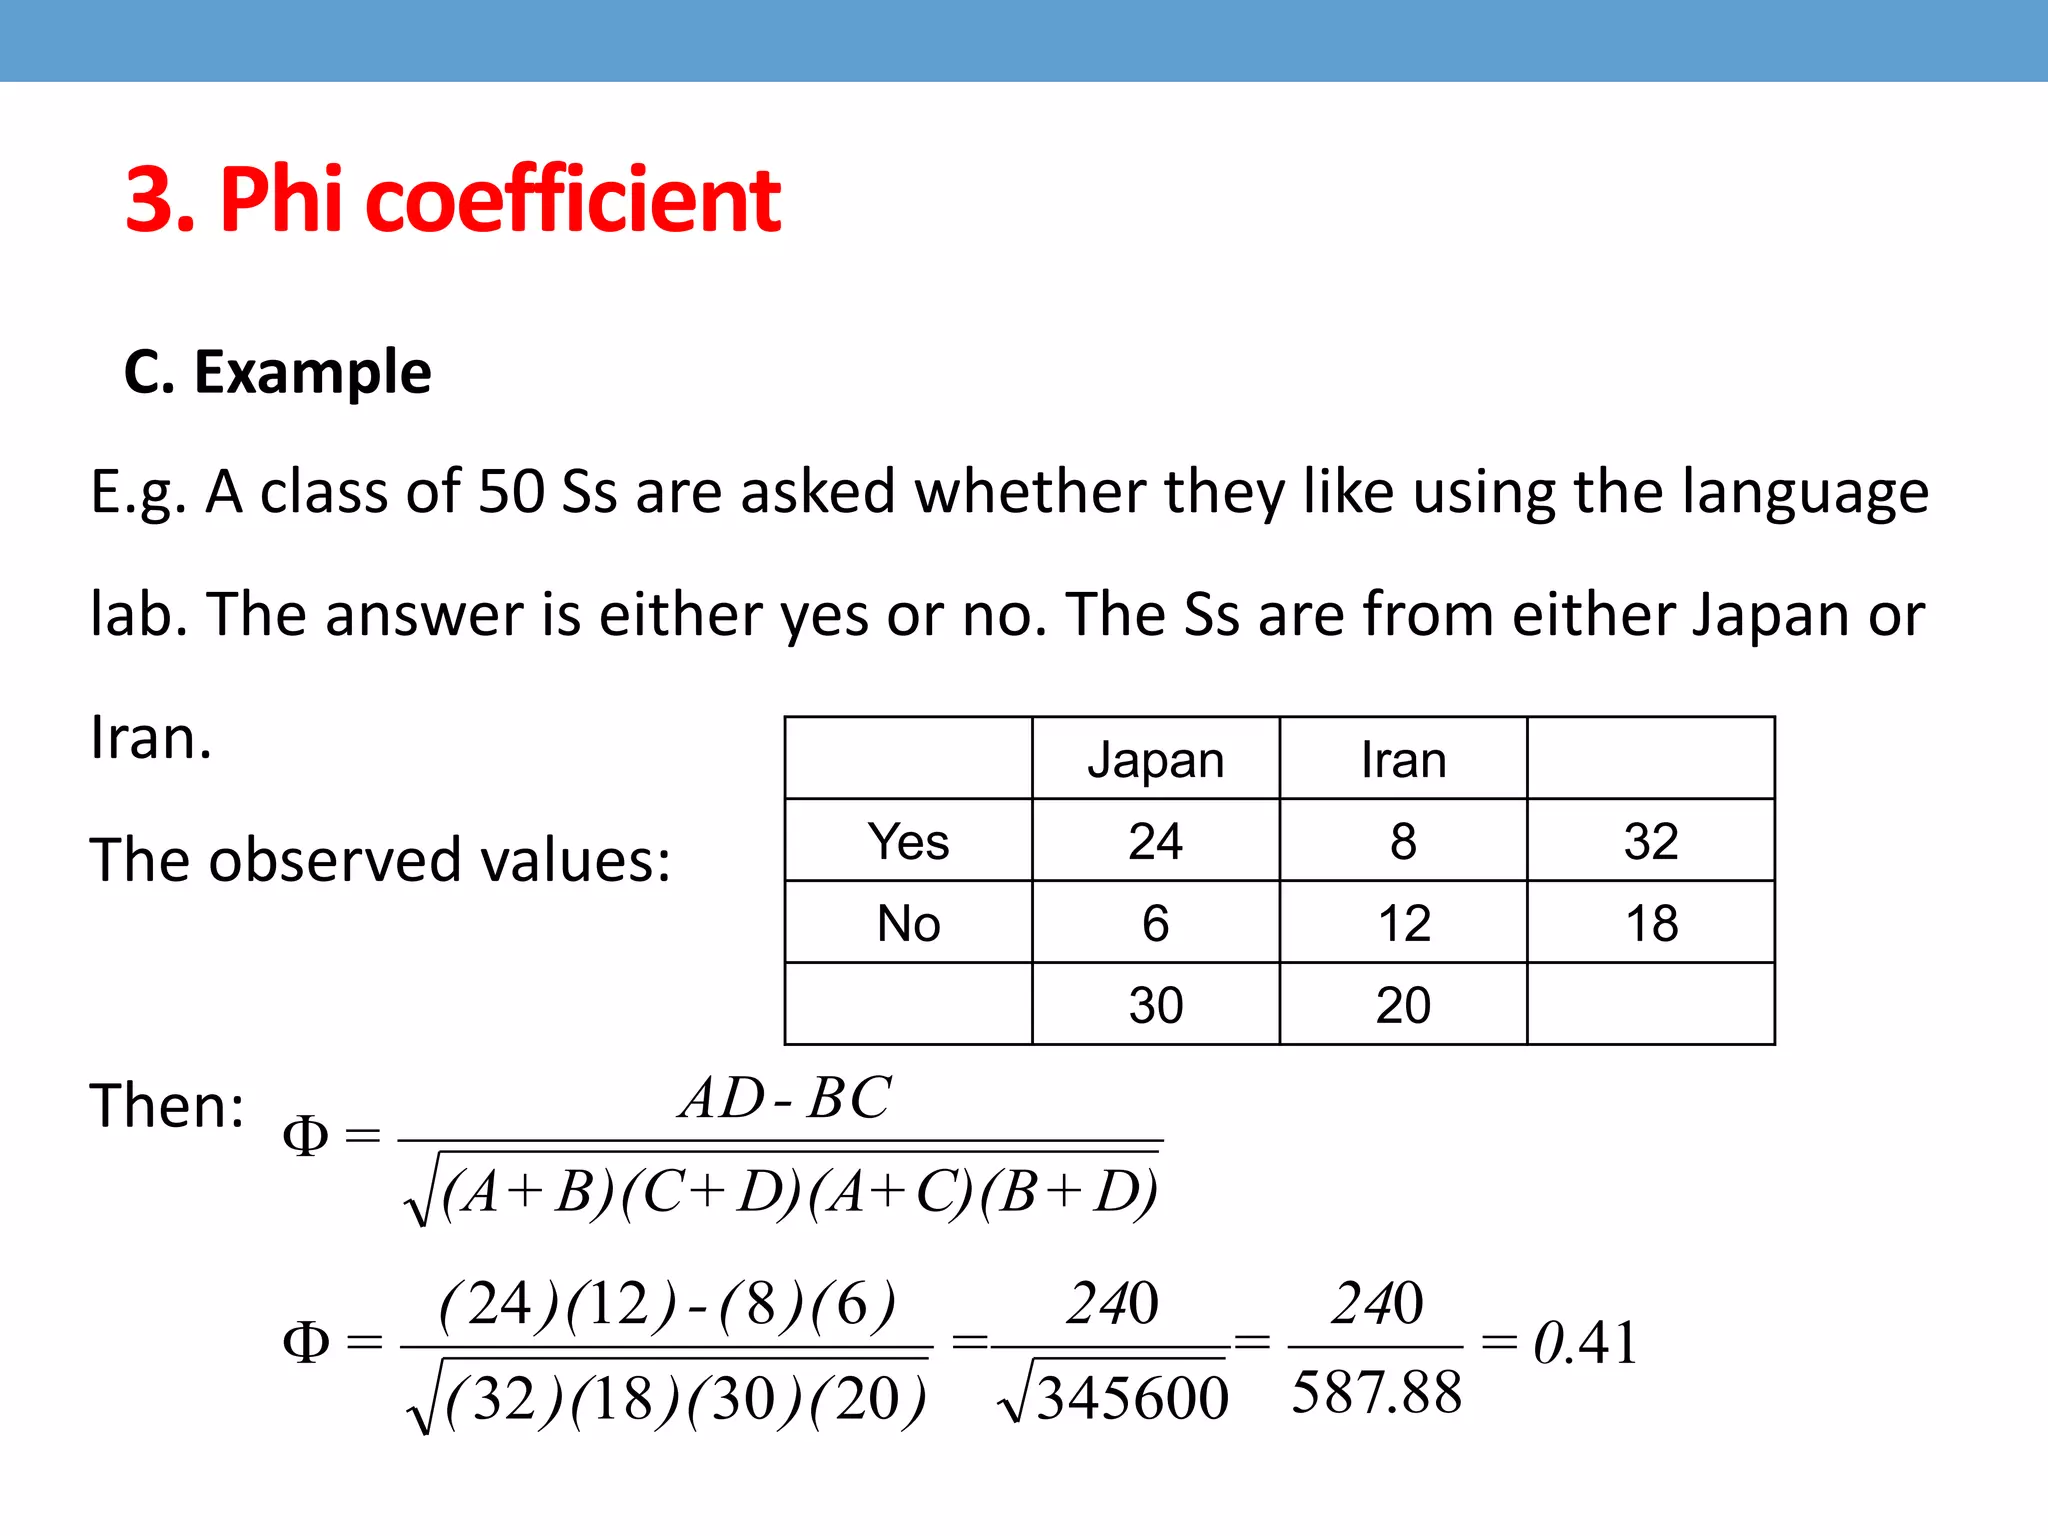
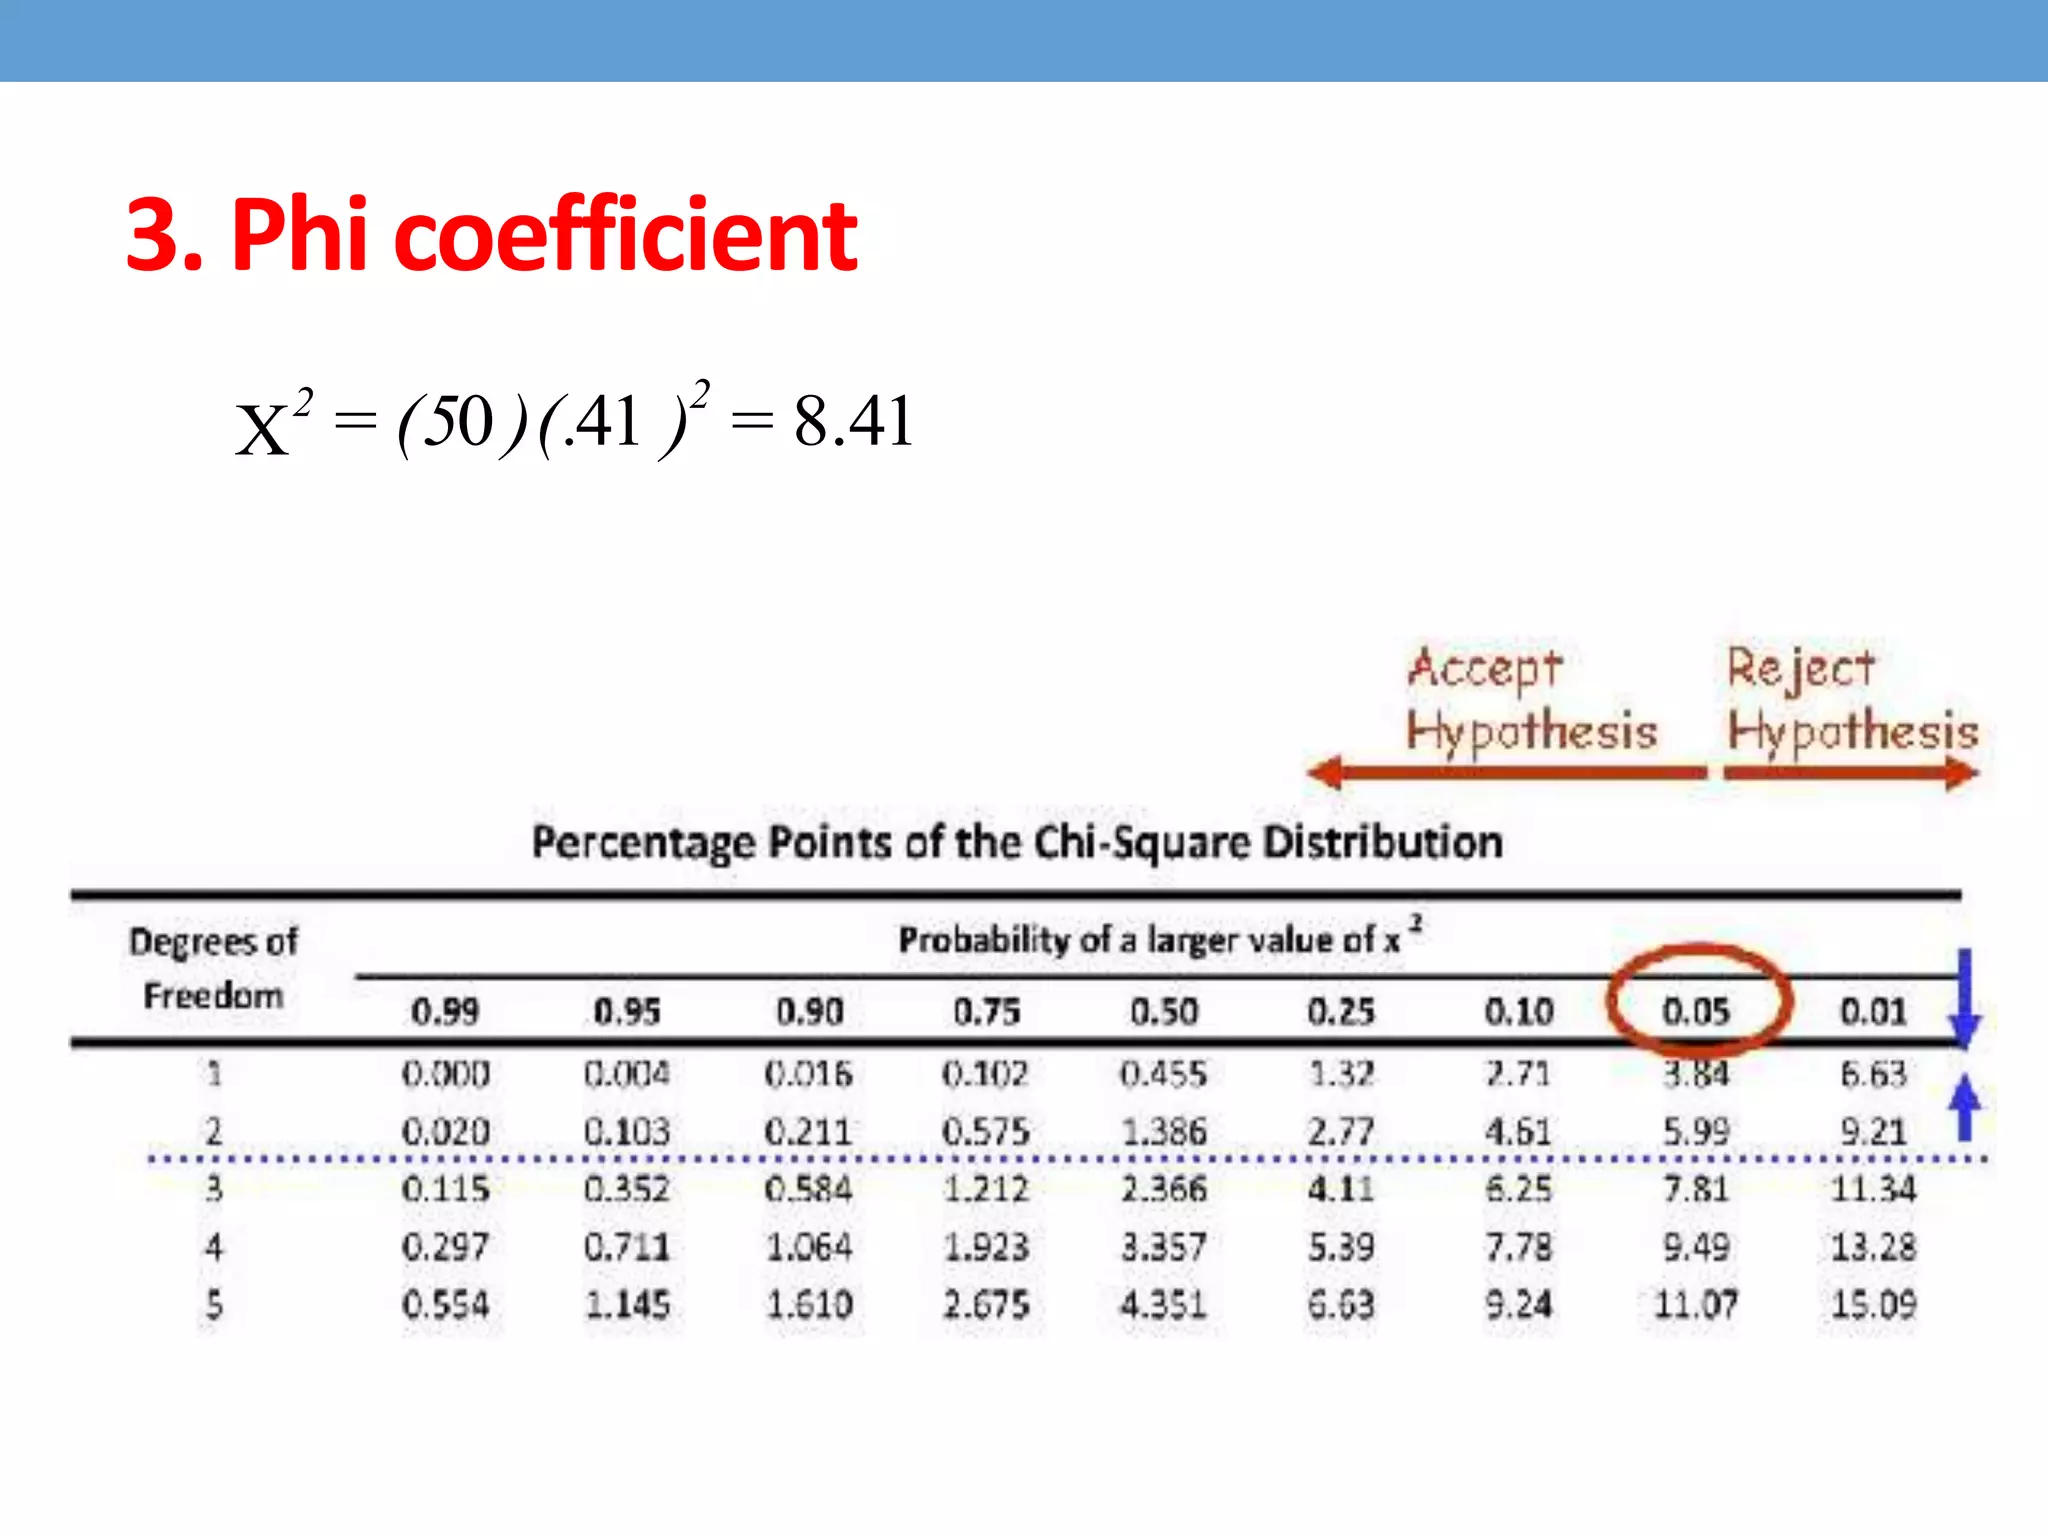
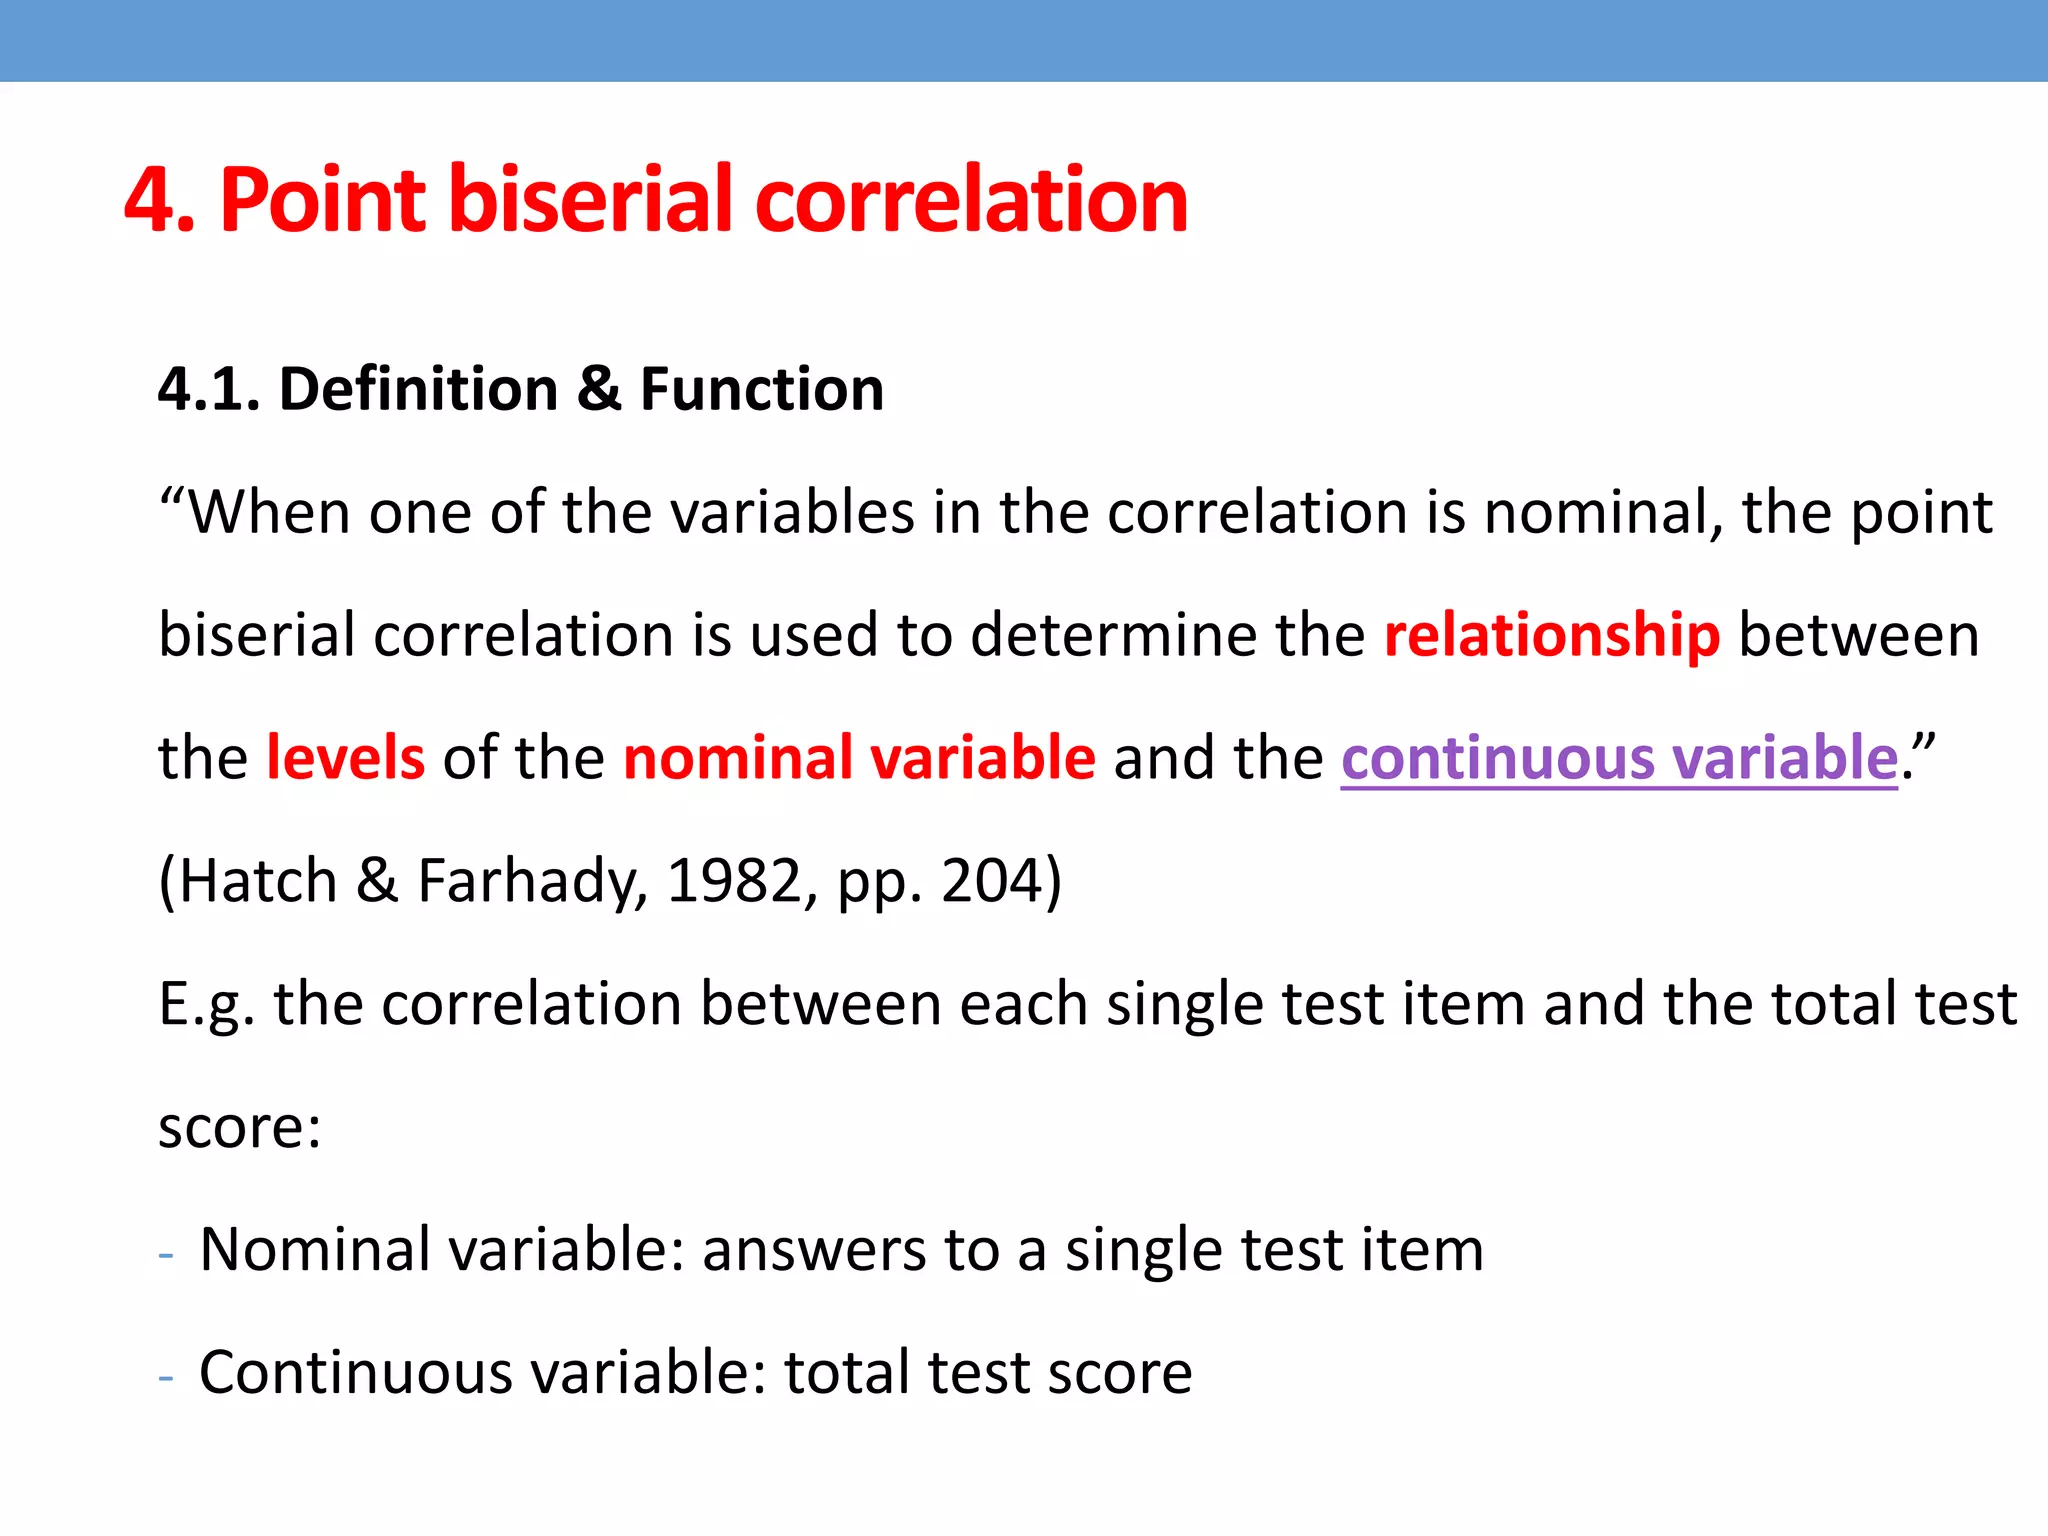
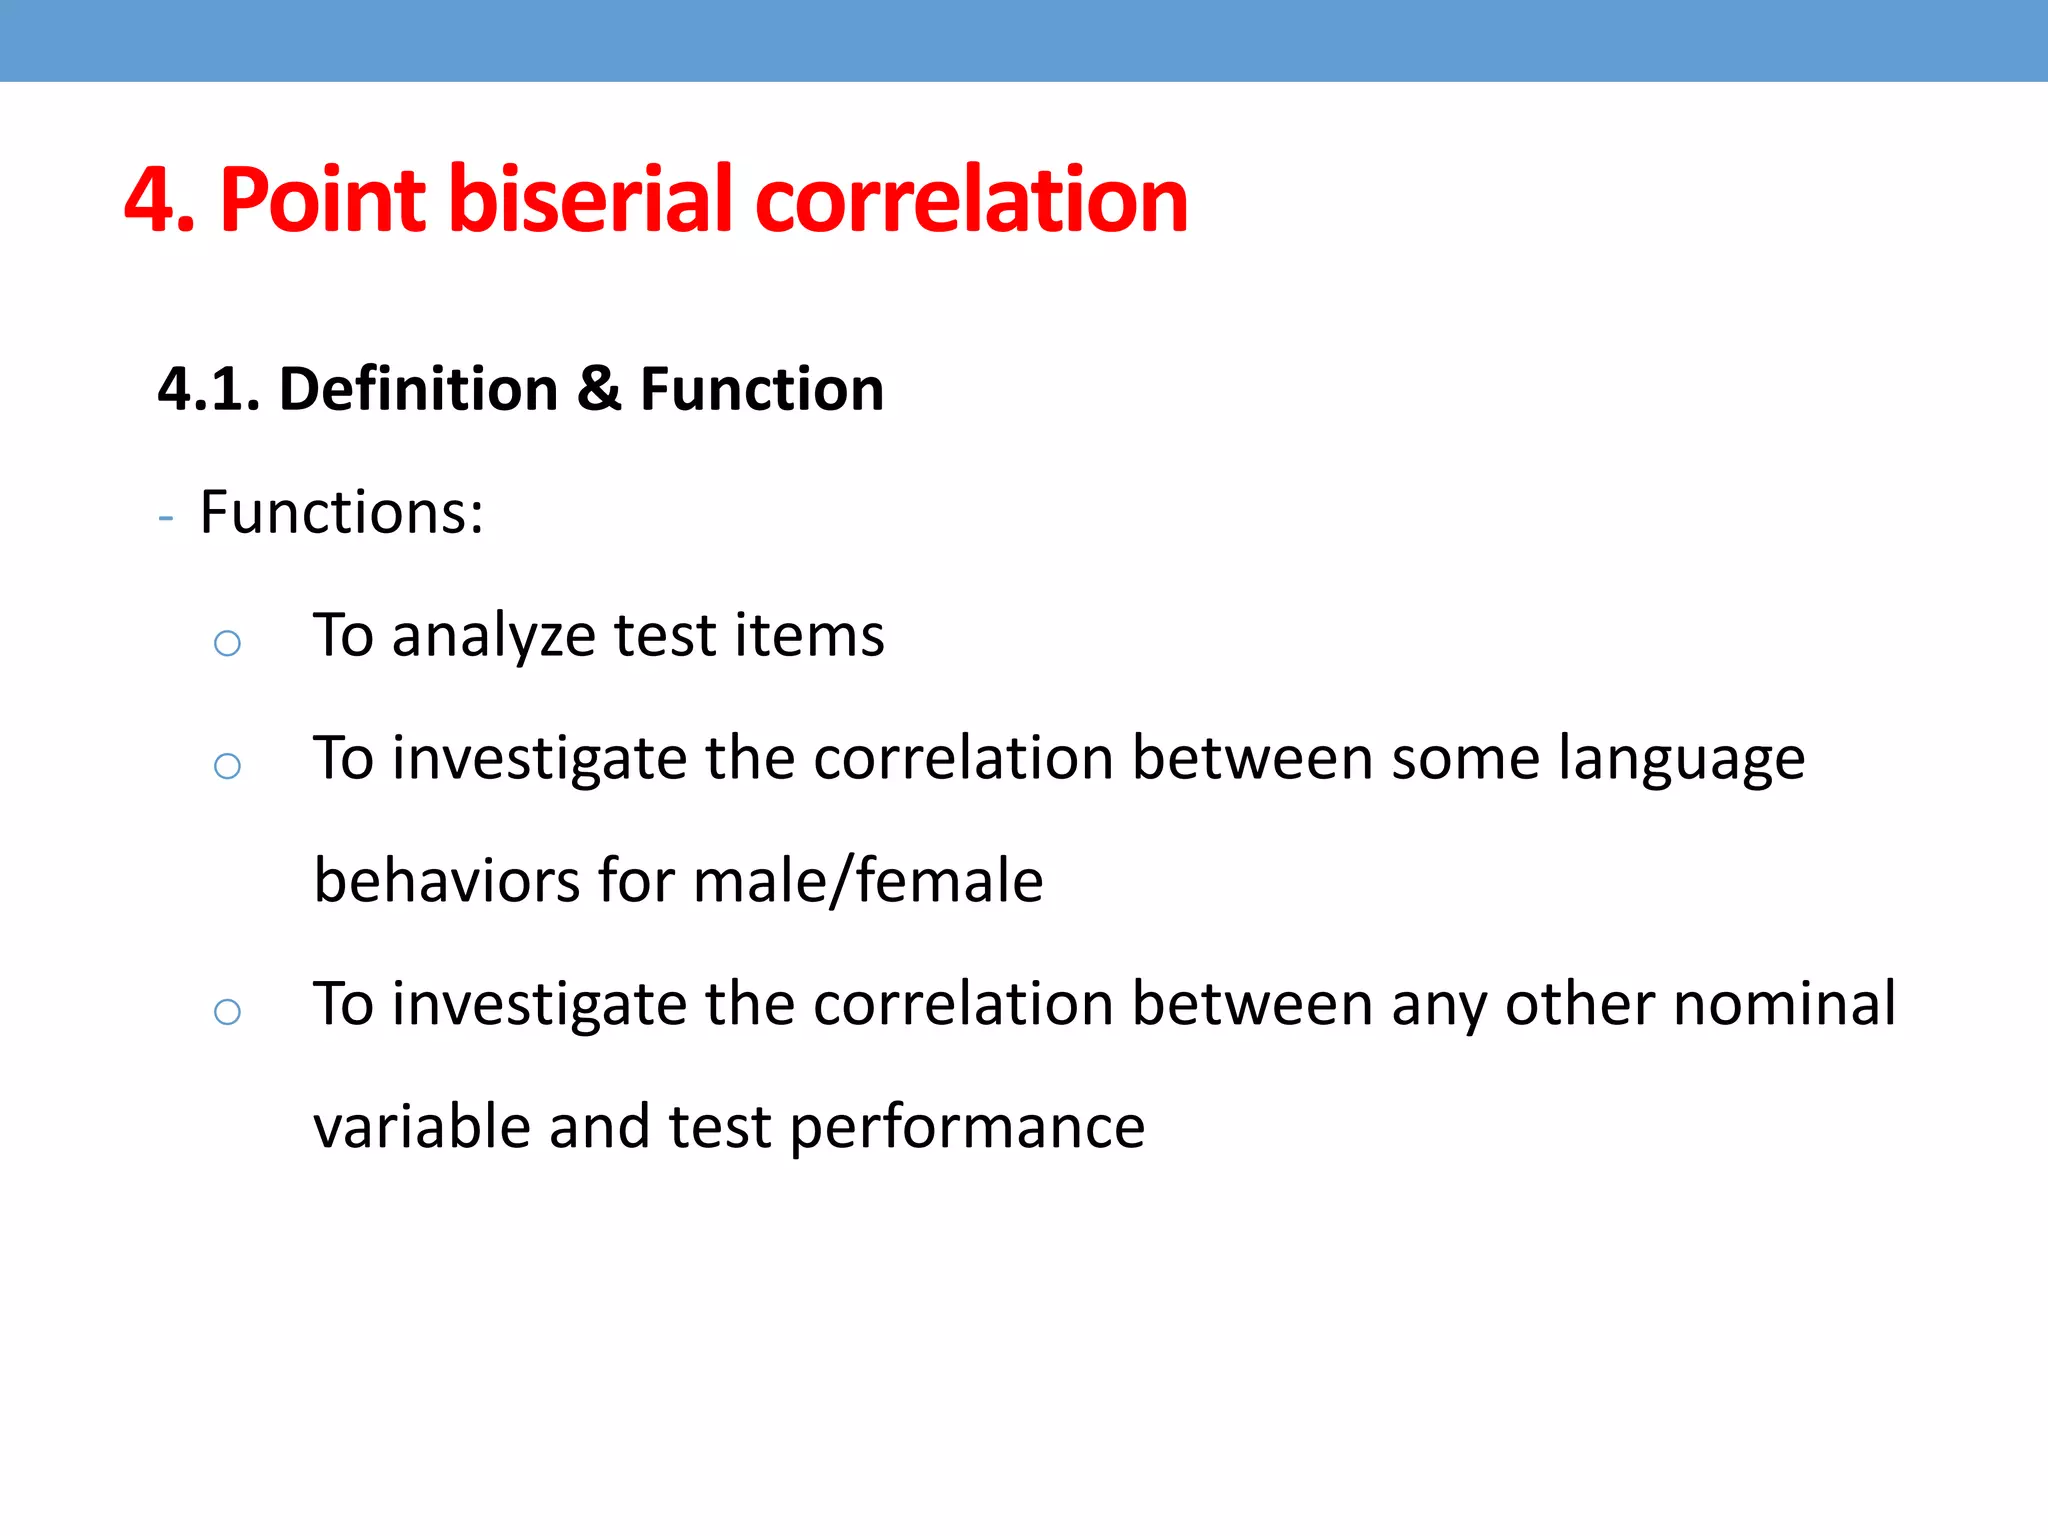
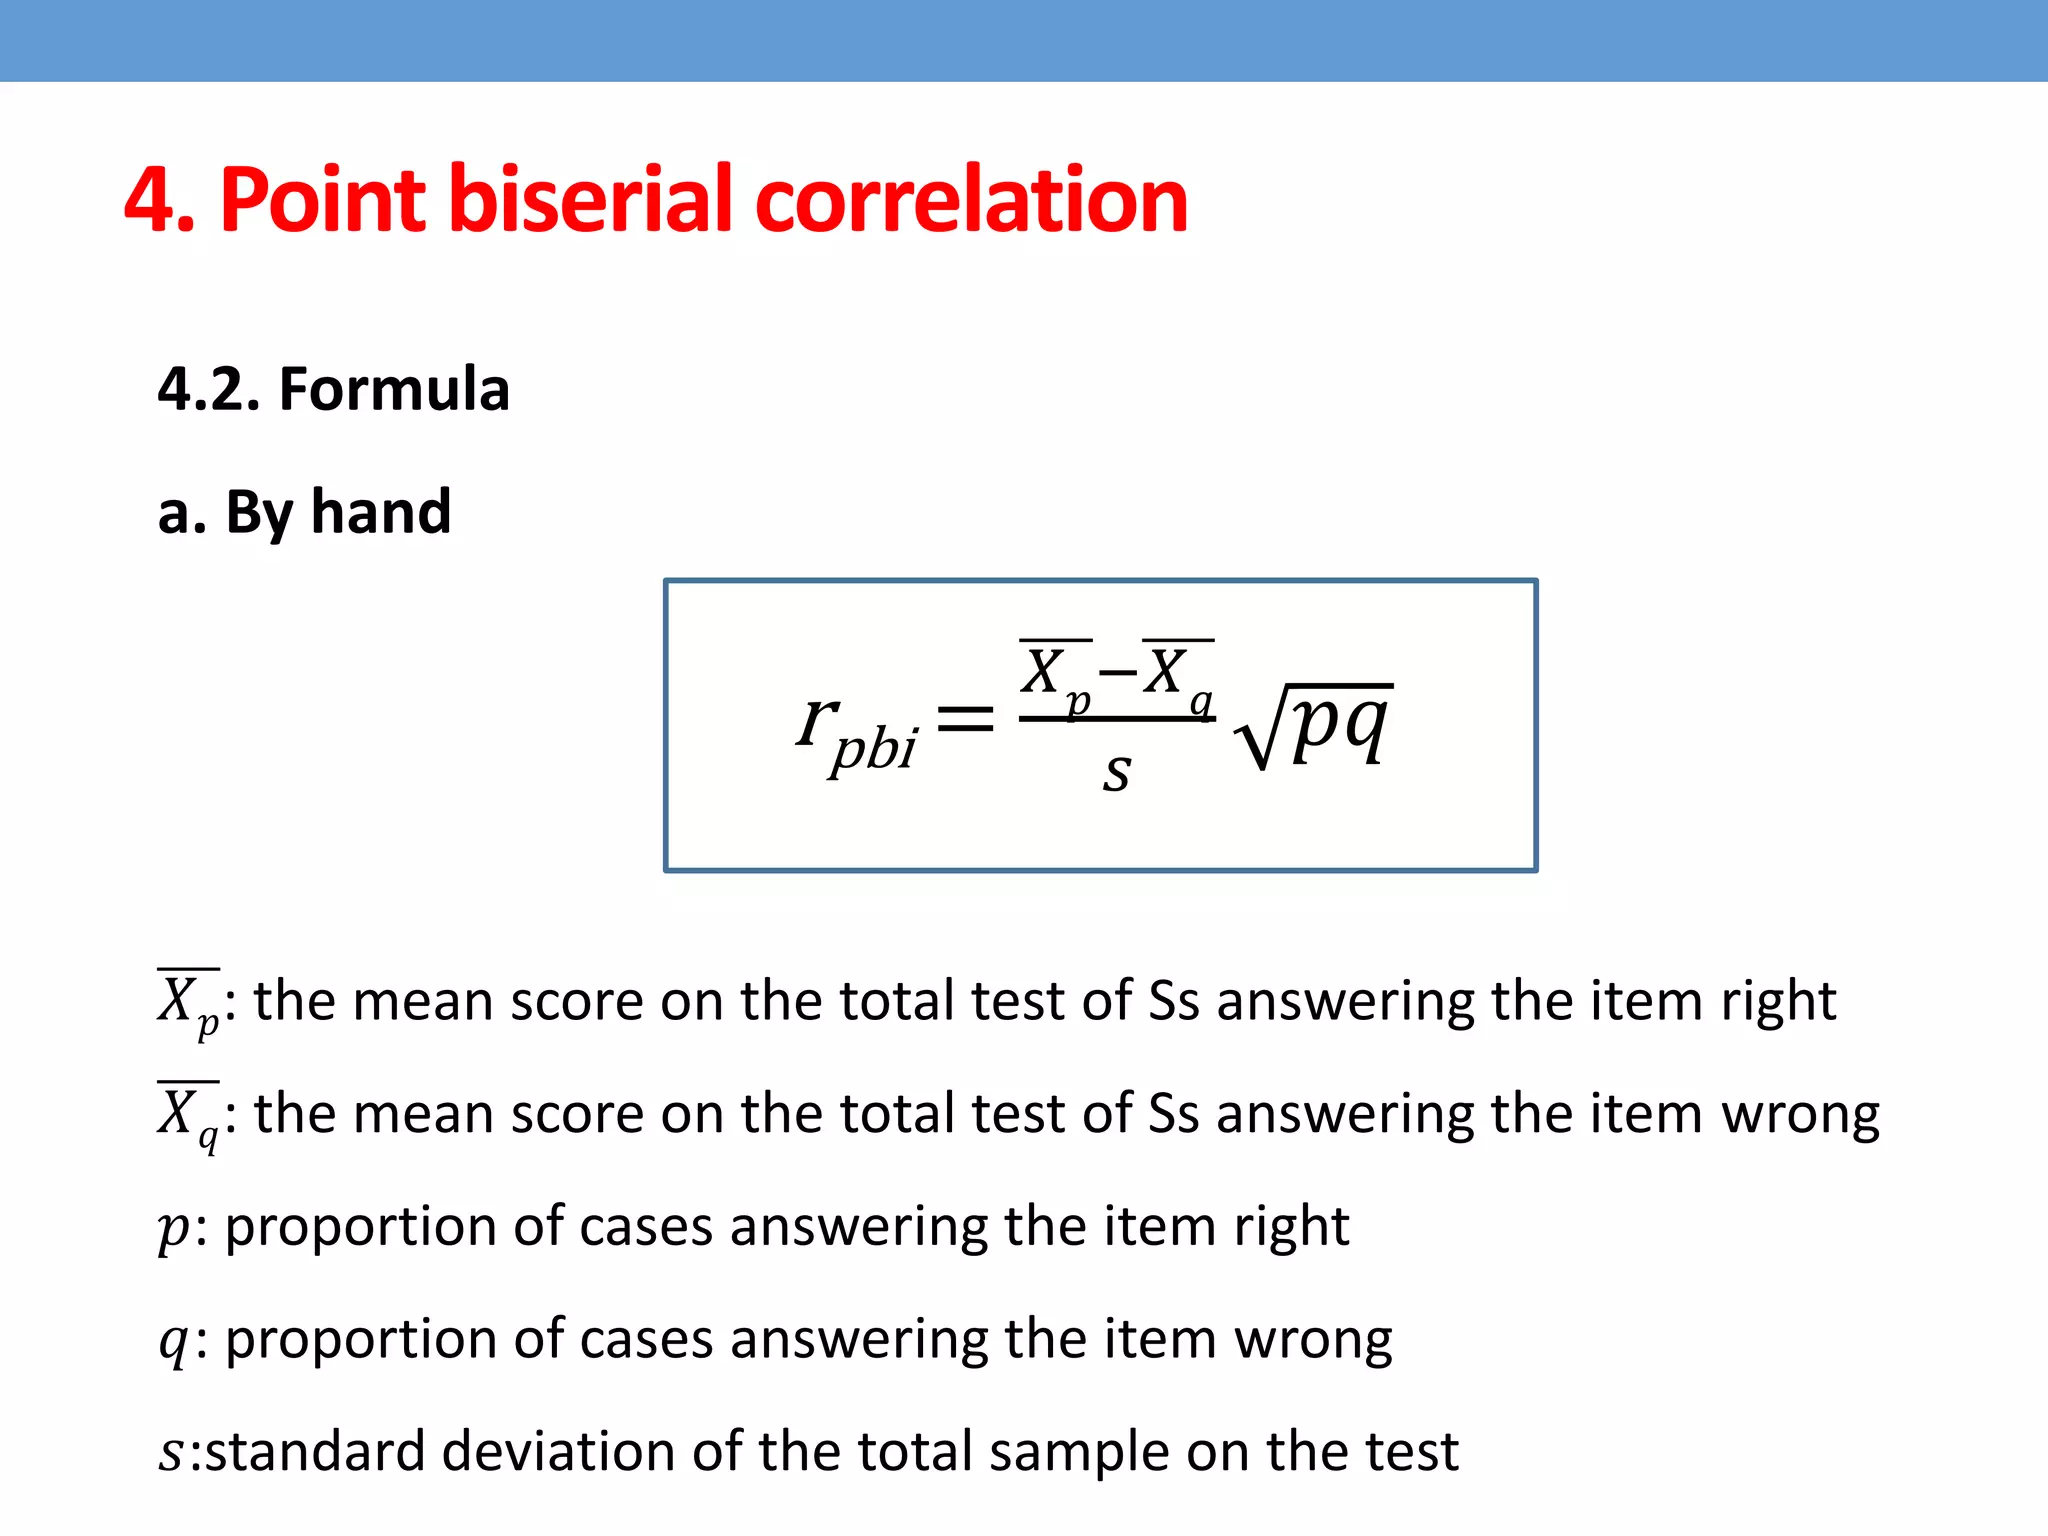
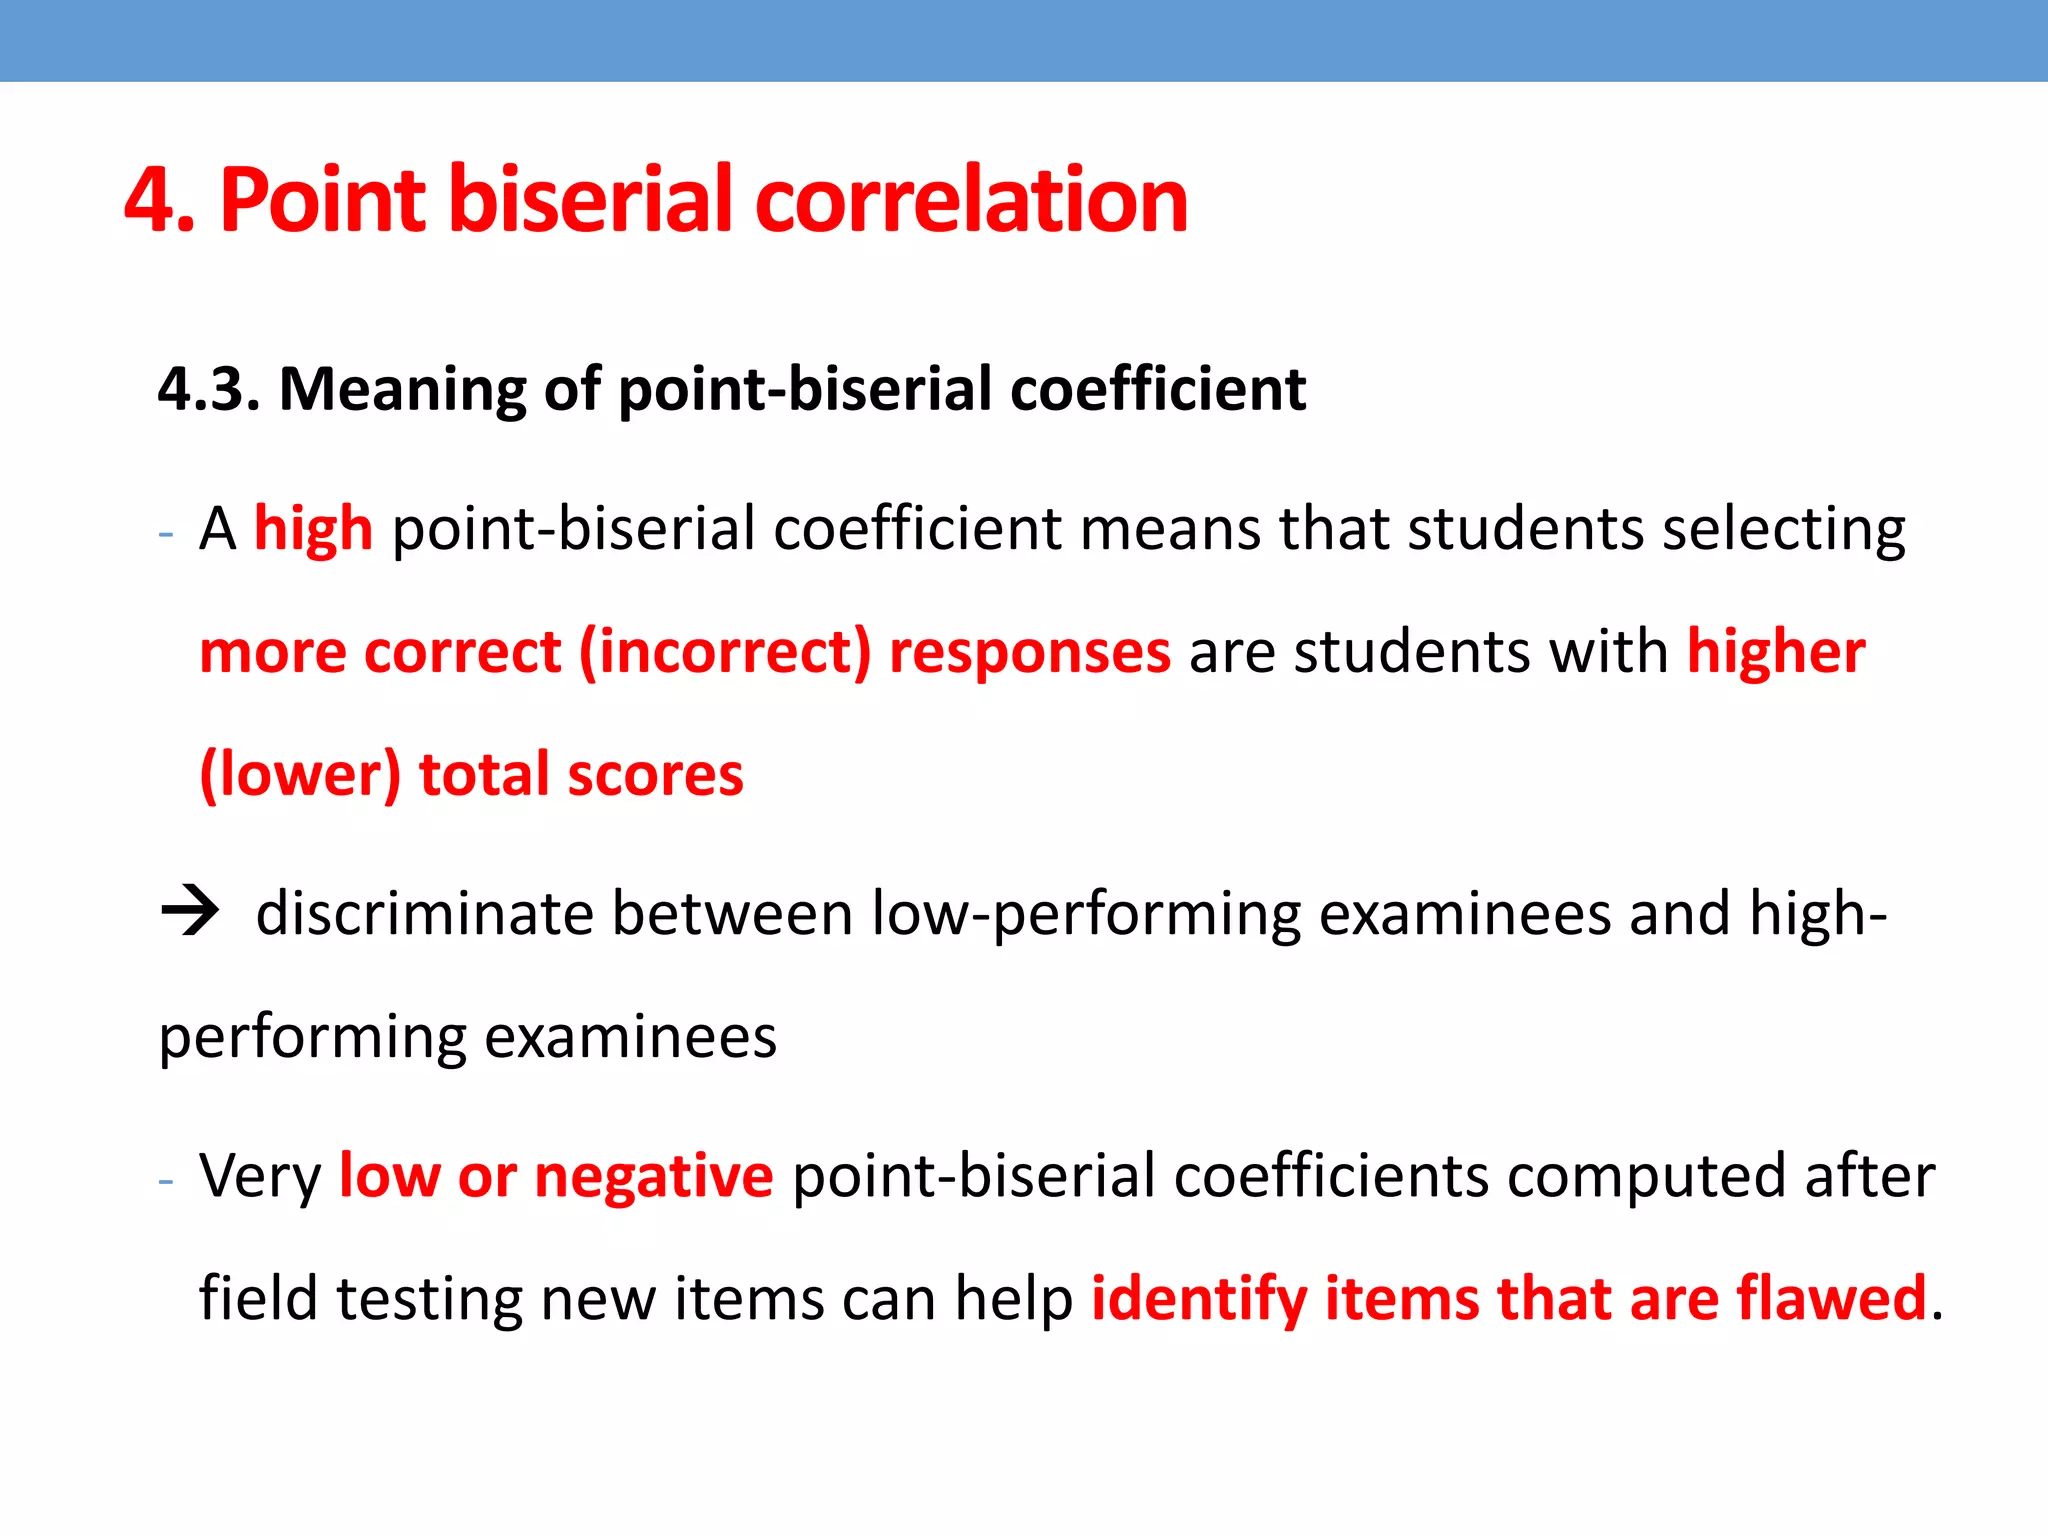
CORRELATION
DATA ANALYSIS
Group 3
Content
1. Pearson’s product moment correlation
2. Spearman rank-order correlation (Rho)
3. Phi coefficient
4. Point biserial correlation
Types of Correlation Coefficients
Correlation Coefficient Types of scales
Pearson’s product moment Both scales interval
Spearman rank-order Both scales ordinal
Phi Both scales nominal
Point biserial One interval, one nominal
Which formula should I use?
Pearson's correlation coefficient when applied to a population is
commonly represented by the Greek letter ρ (rho) and may be
referred to as the population correlation coefficient or
the population Pearson correlation coefficient.
The formula for r is:
Cov: covariance
S(x), S(y): the standard deviation of X and Y
1. Pearson’s product moment correlation
• The Mean is the average of the numbers.
• The Standard Deviation is just the square root of Variance.
E.g. The following data relates to Number of hours studying
and number of correct answers
1. Pearson’s product moment correlation
• The Mean is the average of the numbers.
Mean =
0+1+2+3+5+5+6
7
= 3,142
• Now we calculate each scores differences from the Mean.
+ The Mean is 3.1427.
+ The differences are : - 3.142, -2.142, -1.142, -0.142, 1.858, 1.858,
2.858.
1. Pearson’s product moment correlation
• The Variance is:
σ2
=
(−3.142)2+ (−2.142)2+ (−1.142)2+ (−0.142)2+ 1.8582+ 1.8582+ 2.8582
7
=
30.763384
7
= 4.394
• And the Standard Deviation is just the square root of Variance.
σ = 4.394= 2.096 = 2 (to the nearest score)
1. Pearson’s product moment correlation
• If working with raw data, the Pearson product moment
correlation formula is as follows:
1. Pearson’s product moment correlation
E.g.
The Pearson correlation coefficient r is:

1. Pearson’s product moment correlation
 Conclusion: There is a strong, positive correlation between X and
Y. The more X is, the more Y is.
Exercise
? Find the persons coefficient of correlation between price of
studying facilities and demand from the following data. Then make
your conclusion about their relationship.
1. Pearson’s product moment correlation
2. Spearman rank-order correlation (Rho)
- A measure of the strength and direction of association that exists
between two ranked variables on ordinal scale.
- Denoted by the symbol rs (or the Greek letter ρ, pronounced rho).
−1 ≤ 𝜌 ≤ 1
 Assumption
- Two variables are either ordinal, interval or ratio.
- There is a monotonic relationship between two variables.
2. Spearman rank-order correlation (Rho)
English
(mark)
Math
(mark)
56 66
75 70
45 40
71 60
62 65
64 56
58 59
80 77
76 67
61 63
- Ranking Data
• The score with the highest
value should be labeled "1"
and vice versa.
2. Spearman rank-order correlation (Rho)
English
(mark)
Math
(mark)
56 66
75 70
45 40
71 60
62 65
64 56
58 59
80 77
76 67
61 63
English
(rank) (X)
Math
(rank) (Y)
9 4
3 2
10 10
4 7
7 5
5 9
8 8
1 1
2 3
6 6
2. Spearman rank-order correlation (Rho)
English
(mark)
Math
(mark)
56 66
75 70
45 40
71 60
61 65
64 56
58 59
80 77
76 67
61 63
- Ranking data
• The score with the highest
value should be labeled "1"
and vice versa.
• When you have two or more
identical values in the data, you
need to take the average of
their ranks
2. Spearman rank-order correlation (Rho)
English
(mark)
Math
(mark)
56 66
75 70
45 40
71 60
61 65
64 56
58 59
80 77
76 67
61 63
English
(rank) (X)
Math
(rank) (Y)
9 4
3 2
10 10
4 7
6.5 5
5 9
8 8
1 1
2 3
6.5 6
2. Spearman rank-order correlation (Rho)
- Choosing the right formula
(1) Your data does NOT have tied ranks
𝜌 = 1 −
6 (𝑋 − 𝑌)2
𝑛(𝑛2 − 1)
(2) Your data has tied ranks
𝜌 =
𝑋𝑌 −
( 𝑋)( 𝑌)
𝑛
( 𝑋2 −
( 𝑋)
2
𝑛
)( 𝑌2 −
( 𝑌)
2
𝑛
)
2. Spearman rank-order correlation (Rho)
English
(mark)
Math
(mark)
56 66
75 70
45 40
71 60
62 65
64 56
58 59
80 77
76 67
61 63
English
(rank) (X)
Math
(rank) (Y)
9 4
3 2
10 10
4 7
7 5
5 9
8 8
1 1
2 3
6 6
(𝐗 − 𝐘) 𝟐
25
1
0
9
1
16
0
0
1
1
54
𝜌 = 1 −
6 𝑋 − 𝑌 2
𝑛 𝑛2 − 1
= 1 −
6 × 54
10 102 − 1
≈ 0.673
2. Spearman rank-order correlation (Rho)
ρ =
XY −
( X)( Y)
n
( X2 −
( X)
2
n
)( Y2 −
( Y)
2
n
)
English
(rank) (X)
Math
(rank) (Y)
9 4
3 2
10 10
4 7
6.5 5
5 9
8 8
1 1
2 3
6.5 6
55 55
𝑿 𝟐
𝒀 𝟐 XY
81 16 36
9 4 6
100 100 100
16 49 28
42.25 25 32.5
25 81 45
64 64 64
1 1 1
4 9 6
42.25 36 39
384.5 385 357.5
𝑿 55
𝑌 55
𝑋2
384.5
𝑌2
385
𝑋𝑌 357.5
2. Spearman rank-order correlation (Rho)
E.g.2.
ρ =
XY −
( X)( Y)
n
( X2 −
( X)
2
n
)( Y2 −
( Y)
2
n
)
=
357.5 −
55×55
10
(384.5−
552
10
)(385 −
552
10
)
= 0.669
 There was a strong, positive correlation
between English and math marks
3. Phi coefficient
A. Definition
B. Formula
C. Example
D. Steps
3. Phi coefficient
A. Definition
- The Phi (ϕ) statistic is used when both of the nominal variables
are dichotomous.
- The obtained value for Phi suggests the relationship between the
two variables.
3. Phi coefficient
B. Formula
Formula:
VARIABLE Y
VARIABLE X
A B A+B
C D C+D
A+C B+D
D)+C)(B+D)(A+B)(C+(A
BC-AD
=
3. Phi coefficient
C. Example
E.g. A class of 50 Ss are asked whether they like using the language
lab. The answer is either yes or no. The Ss are from either Japan or
Iran.
The observed values:
Then:
Japan Iran
Yes 24 8 32
No 6 12 18
30 20
D)+C)(B+D)(A+B)(C+(A
BC-AD
=
41
88.587
0
345600
0
20301832
681224
0.=
24
=
24
=
))()()((
))((-))((
=
3. Phi coefficient
D. Steps
D.1. Using the suggested interpretations of Measure
of Association
1. State the Null hypothesis
2. Determine the Phi coefficient
3. Using the suggested table to state the conclusion
3. Phi coefficient
Suggested Interpretations of Measures of Association
Values Appropriate Phrases
+.70 or higher Very strong positive relationship.
+.50 to +.69 Substantial positive relationship.
+.30 to +.49 Moderate positive relationship.
+.10 to +.29 Low positive relationship.
+.01 to +.09 Negligible positive relationship.
0.00 No relationship.
-.01 to -.09 Negligible negative relationship.
-.10 to -.29 Low negative relationship.
-.30 to -.49 Moderate negative relationship.
-.50 to -.69 Substantial negative relationship.
-.70 or lower Very strong negative relationship.
Source: Adapted from James A. Davis, Elementary Survey Analysis. Englewood Cliffs, NJ: Prentice-Hall, 1971, 49.
3. Phi coefficient
D.2. Transform the Phi coefficient into Chi-square
1. State the Null hypothesis.
2. Choose the Alpha level and determine p-value.
3. Apply the formula for Phi coefficient and determine Chi-
square value:
4. Compare Chi-square value and p-value. State the
conclusion.

22
N=
3. Phi coefficient
41.8410 =))(.(5= 22

4. Point biserial correlation
4.1. Definition & Function
4.2. Formula
4.3. Meaning of point-biserial coefficient
4. Point biserial correlation
4.1. Definition & Function
“When one of the variables in the correlation is nominal, the point
biserial correlation is used to determine the relationship between
the levels of the nominal variable and the continuous variable.”
(Hatch & Farhady, 1982, pp. 204)
E.g. the correlation between each single test item and the total test
score:
- Nominal variable: answers to a single test item
- Continuous variable: total test score
4. Point biserial correlation
4.1. Definition & Function
- Functions:
o To analyze test items
o To investigate the correlation between some language
behaviors for male/female
o To investigate the correlation between any other nominal
variable and test performance
4. Point biserial correlation
4.2. Formula
a. By hand
rpbi =
𝑋 𝑝
−𝑋 𝑞
𝑠
𝑝𝑞
𝑋 𝑝: the mean score on the total test of Ss answering the item right
𝑋 𝑞: the mean score on the total test of Ss answering the item wrong
𝑝: proportion of cases answering the item right
𝑞: proportion of cases answering the item wrong
𝑠:standard deviation of the total sample on the test
4. Point biserial correlation
4.2. Formula
E.g. the correlation between each single test item and total test score
Table 2. Sample Student Data Matrix (Varma, n.d., pp. 4)
4. Point biserial correlation
4.2. Formula
E.g. the correlation between test item 1 and total test score
𝑋 𝑝=
9+8+7+7+7+4
6
=7
𝑋 𝑞=
4+3+2
3
= 3
𝑝 =
6
9
= .67 ; 𝑞 =
3
9
= .33
Mean =
9+8+7+7+7+4+4+3+2
9
= 5.67
𝑠 =
(9−5.67)2+ …+ (2−5.67)2
9−1
= 2.45
Items
Students
4 Total test
scores
Kid A 1 9
Kid B 1 8
Kid C 1 7
Kid D 1 7
Kid E 1 7
Kid F 0 4
Kid G 1 4
Kid H 0 3
Kid I 0 2
rpbi =
7−3
2.45
.67 (.33) = .77 .
4. Point biserial correlation
4.2. Formula
Exercise. the correlation between test item 4 and total test score
Answer:
𝑋 𝑝= 7 ; 𝑋 𝑞= 4
𝑝 = .56 ; 𝑞 = .44
𝑠 = 2.8
rpbi= .53
Items
Students
6 Total test
scores
Kid A 1 9
Kid B 1 8
Kid C 1 7
Kid D 0 7
Kid E 1 7
Kid F 0 4
Kid G 1 4
Kid H 0 3
Kid I 0 2
4. Point biserial correlation
4.3. Meaning of point-biserial coefficient
- A high point-biserial coefficient means that students selecting
more correct (incorrect) responses are students with higher
(lower) total scores
 discriminate between low-performing examinees and high-
performing examinees
- Very low or negative point-biserial coefficients computed after
field testing new items can help identify items that are flawed.
Reference
BBC. (n.d.). Variation and classification. Retrieved from
http://www.bbc.co.uk/bitesize/ks3/science/organisms_behaviour_health/
variation_classification/revision/3/
Hatch, E. & Farhady, H. (1982). Research design and statistics for applied
linguistics. Rowley: Newburry.
Lund, A. & Lund, M. (n.d.). Retrieved from https://statistics.laerd.com/statistical-
guides/spearmans-rank-order-correlation-statistical-guide.php
Reference
Nominal measure of correlation (n.d.). Retrieved from
http://www.harding.edu/sbreezeel/460%20files/statbook/chapter15.pdf
Varma, S. (n.d.). Preliminary item statistics using point-biserial correlation and p-
values. Morgan Hill, CA: Educational Data Systems.

Data analysis 1

  • 1.
  • 2.
    Content 1. Pearson’s productmoment correlation 2. Spearman rank-order correlation (Rho) 3. Phi coefficient 4. Point biserial correlation
  • 3.
    Types of CorrelationCoefficients Correlation Coefficient Types of scales Pearson’s product moment Both scales interval Spearman rank-order Both scales ordinal Phi Both scales nominal Point biserial One interval, one nominal Which formula should I use?
  • 4.
    Pearson's correlation coefficientwhen applied to a population is commonly represented by the Greek letter ρ (rho) and may be referred to as the population correlation coefficient or the population Pearson correlation coefficient. The formula for r is: Cov: covariance S(x), S(y): the standard deviation of X and Y 1. Pearson’s product moment correlation
  • 5.
    • The Meanis the average of the numbers. • The Standard Deviation is just the square root of Variance. E.g. The following data relates to Number of hours studying and number of correct answers 1. Pearson’s product moment correlation
  • 6.
    • The Meanis the average of the numbers. Mean = 0+1+2+3+5+5+6 7 = 3,142 • Now we calculate each scores differences from the Mean. + The Mean is 3.1427. + The differences are : - 3.142, -2.142, -1.142, -0.142, 1.858, 1.858, 2.858. 1. Pearson’s product moment correlation
  • 7.
    • The Varianceis: σ2 = (−3.142)2+ (−2.142)2+ (−1.142)2+ (−0.142)2+ 1.8582+ 1.8582+ 2.8582 7 = 30.763384 7 = 4.394 • And the Standard Deviation is just the square root of Variance. σ = 4.394= 2.096 = 2 (to the nearest score) 1. Pearson’s product moment correlation
  • 8.
    • If workingwith raw data, the Pearson product moment correlation formula is as follows: 1. Pearson’s product moment correlation
  • 9.
    1. Pearson’s productmoment correlation E.g.
  • 10.
    The Pearson correlationcoefficient r is:  1. Pearson’s product moment correlation
  • 11.
     Conclusion: Thereis a strong, positive correlation between X and Y. The more X is, the more Y is. Exercise ? Find the persons coefficient of correlation between price of studying facilities and demand from the following data. Then make your conclusion about their relationship. 1. Pearson’s product moment correlation
  • 12.
    2. Spearman rank-ordercorrelation (Rho) - A measure of the strength and direction of association that exists between two ranked variables on ordinal scale. - Denoted by the symbol rs (or the Greek letter ρ, pronounced rho). −1 ≤ 𝜌 ≤ 1
  • 13.
     Assumption - Twovariables are either ordinal, interval or ratio. - There is a monotonic relationship between two variables. 2. Spearman rank-order correlation (Rho)
  • 14.
    2. Spearman rank-ordercorrelation (Rho) English (mark) Math (mark) 56 66 75 70 45 40 71 60 62 65 64 56 58 59 80 77 76 67 61 63 - Ranking Data • The score with the highest value should be labeled "1" and vice versa.
  • 15.
    2. Spearman rank-ordercorrelation (Rho) English (mark) Math (mark) 56 66 75 70 45 40 71 60 62 65 64 56 58 59 80 77 76 67 61 63 English (rank) (X) Math (rank) (Y) 9 4 3 2 10 10 4 7 7 5 5 9 8 8 1 1 2 3 6 6
  • 16.
    2. Spearman rank-ordercorrelation (Rho) English (mark) Math (mark) 56 66 75 70 45 40 71 60 61 65 64 56 58 59 80 77 76 67 61 63 - Ranking data • The score with the highest value should be labeled "1" and vice versa. • When you have two or more identical values in the data, you need to take the average of their ranks
  • 17.
    2. Spearman rank-ordercorrelation (Rho) English (mark) Math (mark) 56 66 75 70 45 40 71 60 61 65 64 56 58 59 80 77 76 67 61 63 English (rank) (X) Math (rank) (Y) 9 4 3 2 10 10 4 7 6.5 5 5 9 8 8 1 1 2 3 6.5 6
  • 18.
    2. Spearman rank-ordercorrelation (Rho) - Choosing the right formula (1) Your data does NOT have tied ranks 𝜌 = 1 − 6 (𝑋 − 𝑌)2 𝑛(𝑛2 − 1) (2) Your data has tied ranks 𝜌 = 𝑋𝑌 − ( 𝑋)( 𝑌) 𝑛 ( 𝑋2 − ( 𝑋) 2 𝑛 )( 𝑌2 − ( 𝑌) 2 𝑛 )
  • 19.
    2. Spearman rank-ordercorrelation (Rho) English (mark) Math (mark) 56 66 75 70 45 40 71 60 62 65 64 56 58 59 80 77 76 67 61 63 English (rank) (X) Math (rank) (Y) 9 4 3 2 10 10 4 7 7 5 5 9 8 8 1 1 2 3 6 6 (𝐗 − 𝐘) 𝟐 25 1 0 9 1 16 0 0 1 1 54 𝜌 = 1 − 6 𝑋 − 𝑌 2 𝑛 𝑛2 − 1 = 1 − 6 × 54 10 102 − 1 ≈ 0.673
  • 20.
    2. Spearman rank-ordercorrelation (Rho) ρ = XY − ( X)( Y) n ( X2 − ( X) 2 n )( Y2 − ( Y) 2 n ) English (rank) (X) Math (rank) (Y) 9 4 3 2 10 10 4 7 6.5 5 5 9 8 8 1 1 2 3 6.5 6 55 55 𝑿 𝟐 𝒀 𝟐 XY 81 16 36 9 4 6 100 100 100 16 49 28 42.25 25 32.5 25 81 45 64 64 64 1 1 1 4 9 6 42.25 36 39 384.5 385 357.5
  • 21.
    𝑿 55 𝑌 55 𝑋2 384.5 𝑌2 385 𝑋𝑌357.5 2. Spearman rank-order correlation (Rho) E.g.2. ρ = XY − ( X)( Y) n ( X2 − ( X) 2 n )( Y2 − ( Y) 2 n ) = 357.5 − 55×55 10 (384.5− 552 10 )(385 − 552 10 ) = 0.669  There was a strong, positive correlation between English and math marks
  • 22.
    3. Phi coefficient A.Definition B. Formula C. Example D. Steps
  • 23.
    3. Phi coefficient A.Definition - The Phi (ϕ) statistic is used when both of the nominal variables are dichotomous. - The obtained value for Phi suggests the relationship between the two variables.
  • 24.
    3. Phi coefficient B.Formula Formula: VARIABLE Y VARIABLE X A B A+B C D C+D A+C B+D D)+C)(B+D)(A+B)(C+(A BC-AD =
  • 25.
    3. Phi coefficient C.Example E.g. A class of 50 Ss are asked whether they like using the language lab. The answer is either yes or no. The Ss are from either Japan or Iran. The observed values: Then: Japan Iran Yes 24 8 32 No 6 12 18 30 20 D)+C)(B+D)(A+B)(C+(A BC-AD = 41 88.587 0 345600 0 20301832 681224 0.= 24 = 24 = ))()()(( ))((-))(( =
  • 26.
    3. Phi coefficient D.Steps D.1. Using the suggested interpretations of Measure of Association 1. State the Null hypothesis 2. Determine the Phi coefficient 3. Using the suggested table to state the conclusion
  • 27.
    3. Phi coefficient SuggestedInterpretations of Measures of Association Values Appropriate Phrases +.70 or higher Very strong positive relationship. +.50 to +.69 Substantial positive relationship. +.30 to +.49 Moderate positive relationship. +.10 to +.29 Low positive relationship. +.01 to +.09 Negligible positive relationship. 0.00 No relationship. -.01 to -.09 Negligible negative relationship. -.10 to -.29 Low negative relationship. -.30 to -.49 Moderate negative relationship. -.50 to -.69 Substantial negative relationship. -.70 or lower Very strong negative relationship. Source: Adapted from James A. Davis, Elementary Survey Analysis. Englewood Cliffs, NJ: Prentice-Hall, 1971, 49.
  • 28.
    3. Phi coefficient D.2.Transform the Phi coefficient into Chi-square 1. State the Null hypothesis. 2. Choose the Alpha level and determine p-value. 3. Apply the formula for Phi coefficient and determine Chi- square value: 4. Compare Chi-square value and p-value. State the conclusion.  22 N=
  • 29.
  • 30.
    4. Point biserialcorrelation 4.1. Definition & Function 4.2. Formula 4.3. Meaning of point-biserial coefficient
  • 31.
    4. Point biserialcorrelation 4.1. Definition & Function “When one of the variables in the correlation is nominal, the point biserial correlation is used to determine the relationship between the levels of the nominal variable and the continuous variable.” (Hatch & Farhady, 1982, pp. 204) E.g. the correlation between each single test item and the total test score: - Nominal variable: answers to a single test item - Continuous variable: total test score
  • 32.
    4. Point biserialcorrelation 4.1. Definition & Function - Functions: o To analyze test items o To investigate the correlation between some language behaviors for male/female o To investigate the correlation between any other nominal variable and test performance
  • 33.
    4. Point biserialcorrelation 4.2. Formula a. By hand rpbi = 𝑋 𝑝 −𝑋 𝑞 𝑠 𝑝𝑞 𝑋 𝑝: the mean score on the total test of Ss answering the item right 𝑋 𝑞: the mean score on the total test of Ss answering the item wrong 𝑝: proportion of cases answering the item right 𝑞: proportion of cases answering the item wrong 𝑠:standard deviation of the total sample on the test
  • 34.
    4. Point biserialcorrelation 4.2. Formula E.g. the correlation between each single test item and total test score Table 2. Sample Student Data Matrix (Varma, n.d., pp. 4)
  • 35.
    4. Point biserialcorrelation 4.2. Formula E.g. the correlation between test item 1 and total test score 𝑋 𝑝= 9+8+7+7+7+4 6 =7 𝑋 𝑞= 4+3+2 3 = 3 𝑝 = 6 9 = .67 ; 𝑞 = 3 9 = .33 Mean = 9+8+7+7+7+4+4+3+2 9 = 5.67 𝑠 = (9−5.67)2+ …+ (2−5.67)2 9−1 = 2.45 Items Students 4 Total test scores Kid A 1 9 Kid B 1 8 Kid C 1 7 Kid D 1 7 Kid E 1 7 Kid F 0 4 Kid G 1 4 Kid H 0 3 Kid I 0 2 rpbi = 7−3 2.45 .67 (.33) = .77 .
  • 36.
    4. Point biserialcorrelation 4.2. Formula Exercise. the correlation between test item 4 and total test score Answer: 𝑋 𝑝= 7 ; 𝑋 𝑞= 4 𝑝 = .56 ; 𝑞 = .44 𝑠 = 2.8 rpbi= .53 Items Students 6 Total test scores Kid A 1 9 Kid B 1 8 Kid C 1 7 Kid D 0 7 Kid E 1 7 Kid F 0 4 Kid G 1 4 Kid H 0 3 Kid I 0 2
  • 37.
    4. Point biserialcorrelation 4.3. Meaning of point-biserial coefficient - A high point-biserial coefficient means that students selecting more correct (incorrect) responses are students with higher (lower) total scores  discriminate between low-performing examinees and high- performing examinees - Very low or negative point-biserial coefficients computed after field testing new items can help identify items that are flawed.
  • 38.
    Reference BBC. (n.d.). Variationand classification. Retrieved from http://www.bbc.co.uk/bitesize/ks3/science/organisms_behaviour_health/ variation_classification/revision/3/ Hatch, E. & Farhady, H. (1982). Research design and statistics for applied linguistics. Rowley: Newburry. Lund, A. & Lund, M. (n.d.). Retrieved from https://statistics.laerd.com/statistical- guides/spearmans-rank-order-correlation-statistical-guide.php
  • 39.
    Reference Nominal measure ofcorrelation (n.d.). Retrieved from http://www.harding.edu/sbreezeel/460%20files/statbook/chapter15.pdf Varma, S. (n.d.). Preliminary item statistics using point-biserial correlation and p- values. Morgan Hill, CA: Educational Data Systems.

Editor's Notes

  • #35 Mean: average; standard deviation: the amount by which a measurement is different from standard