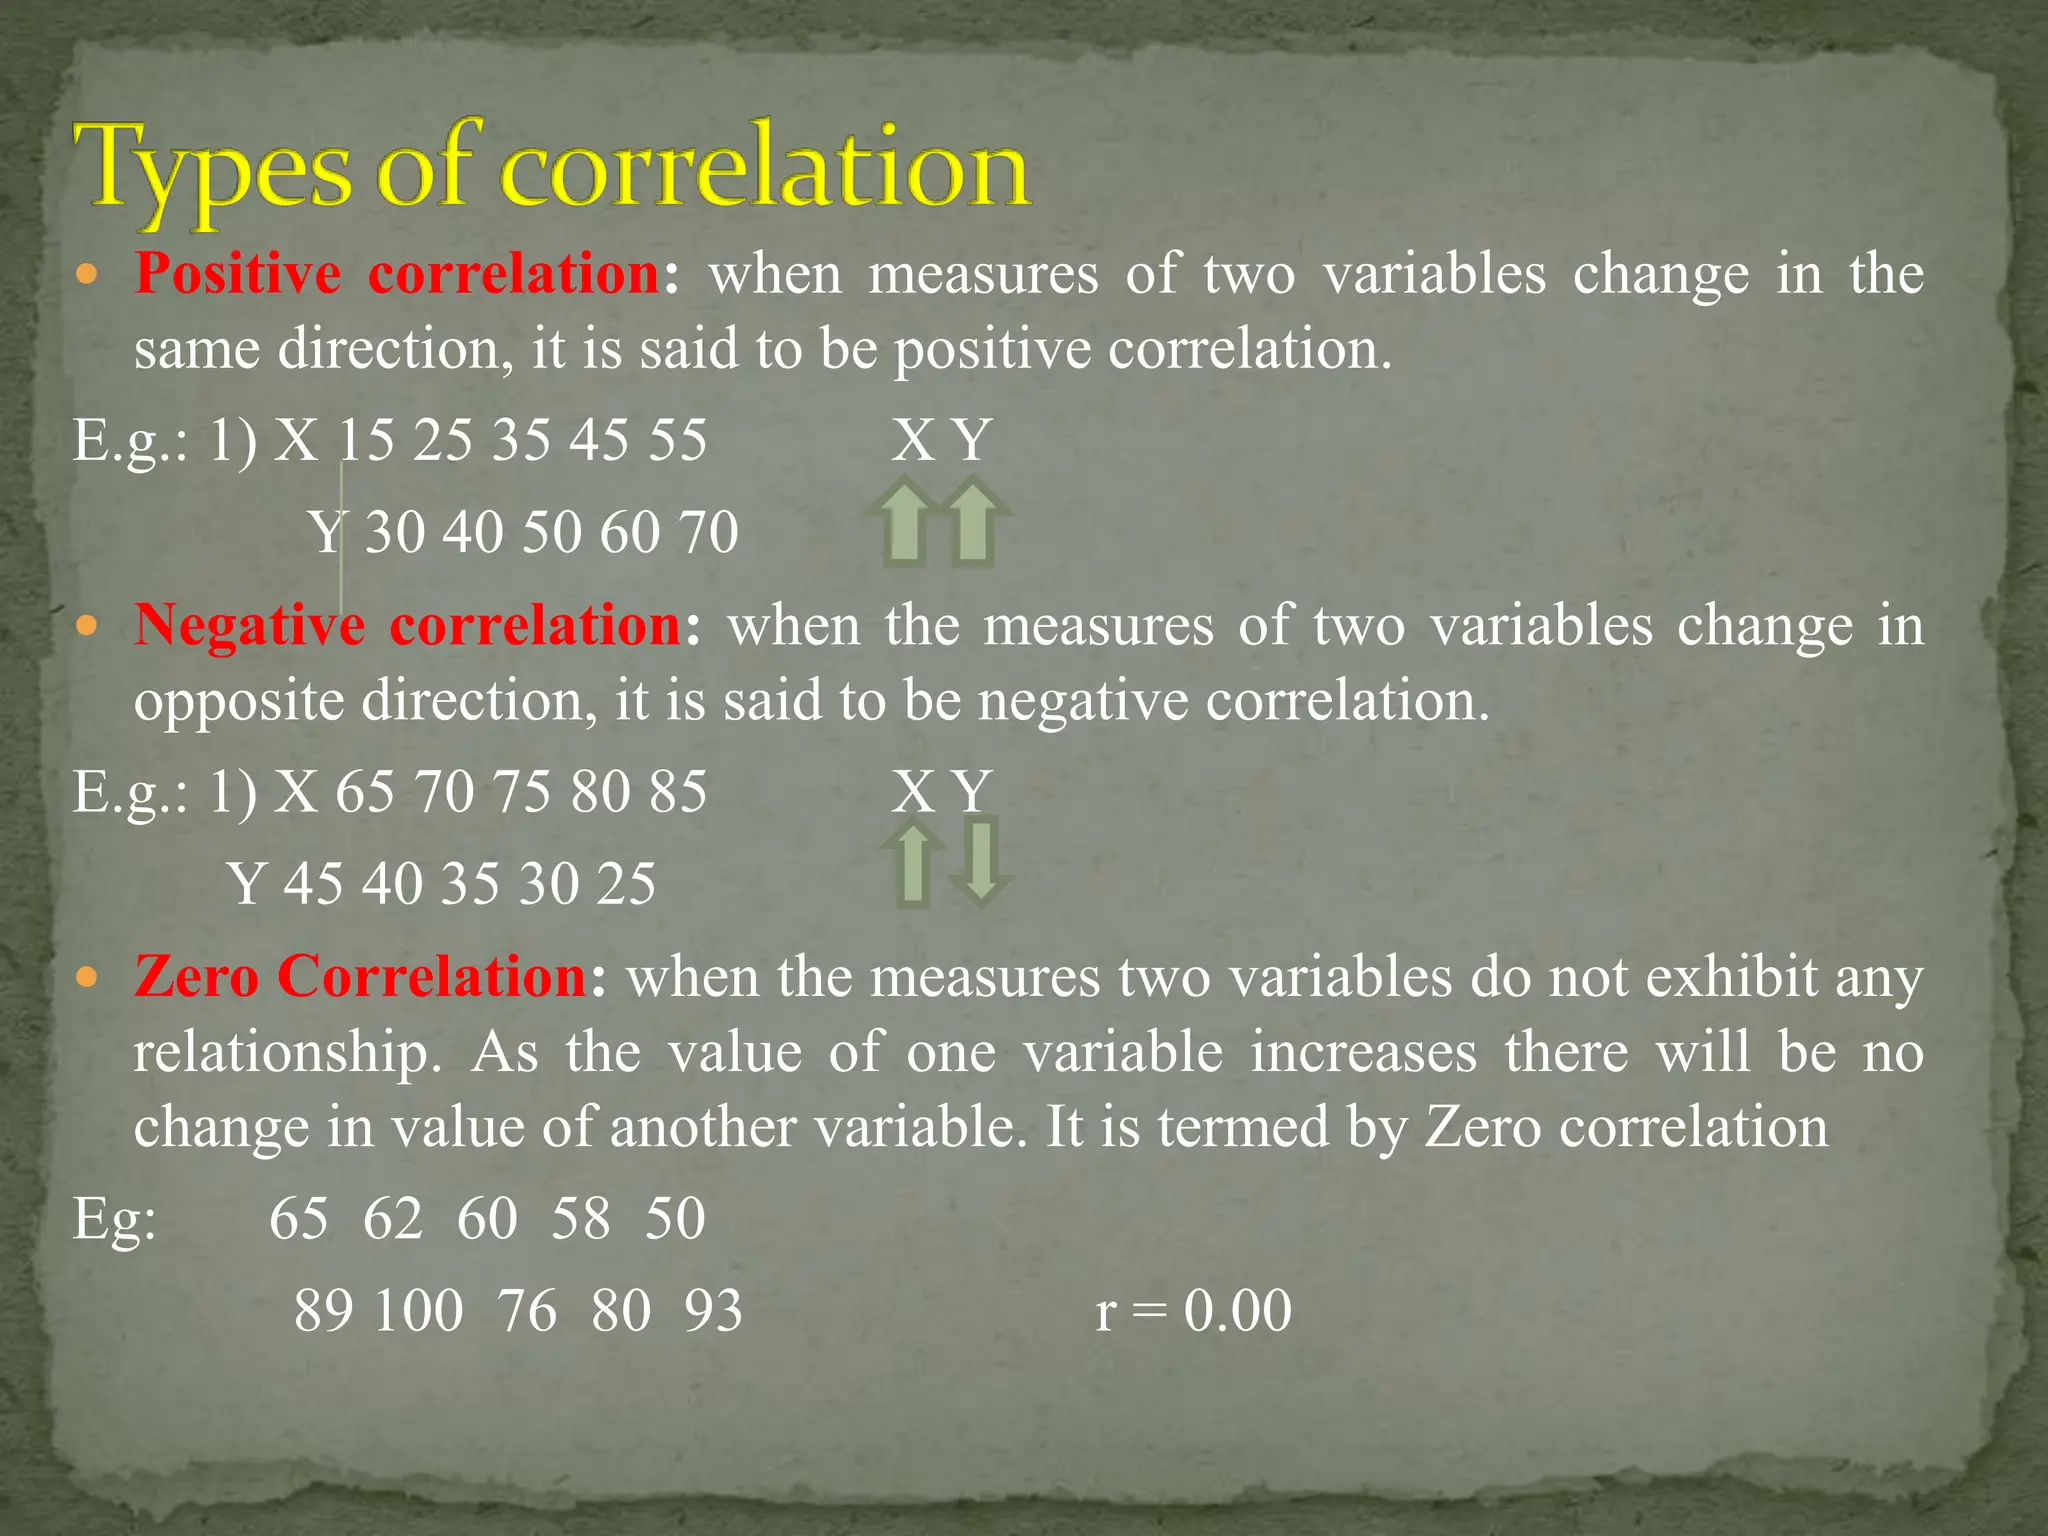
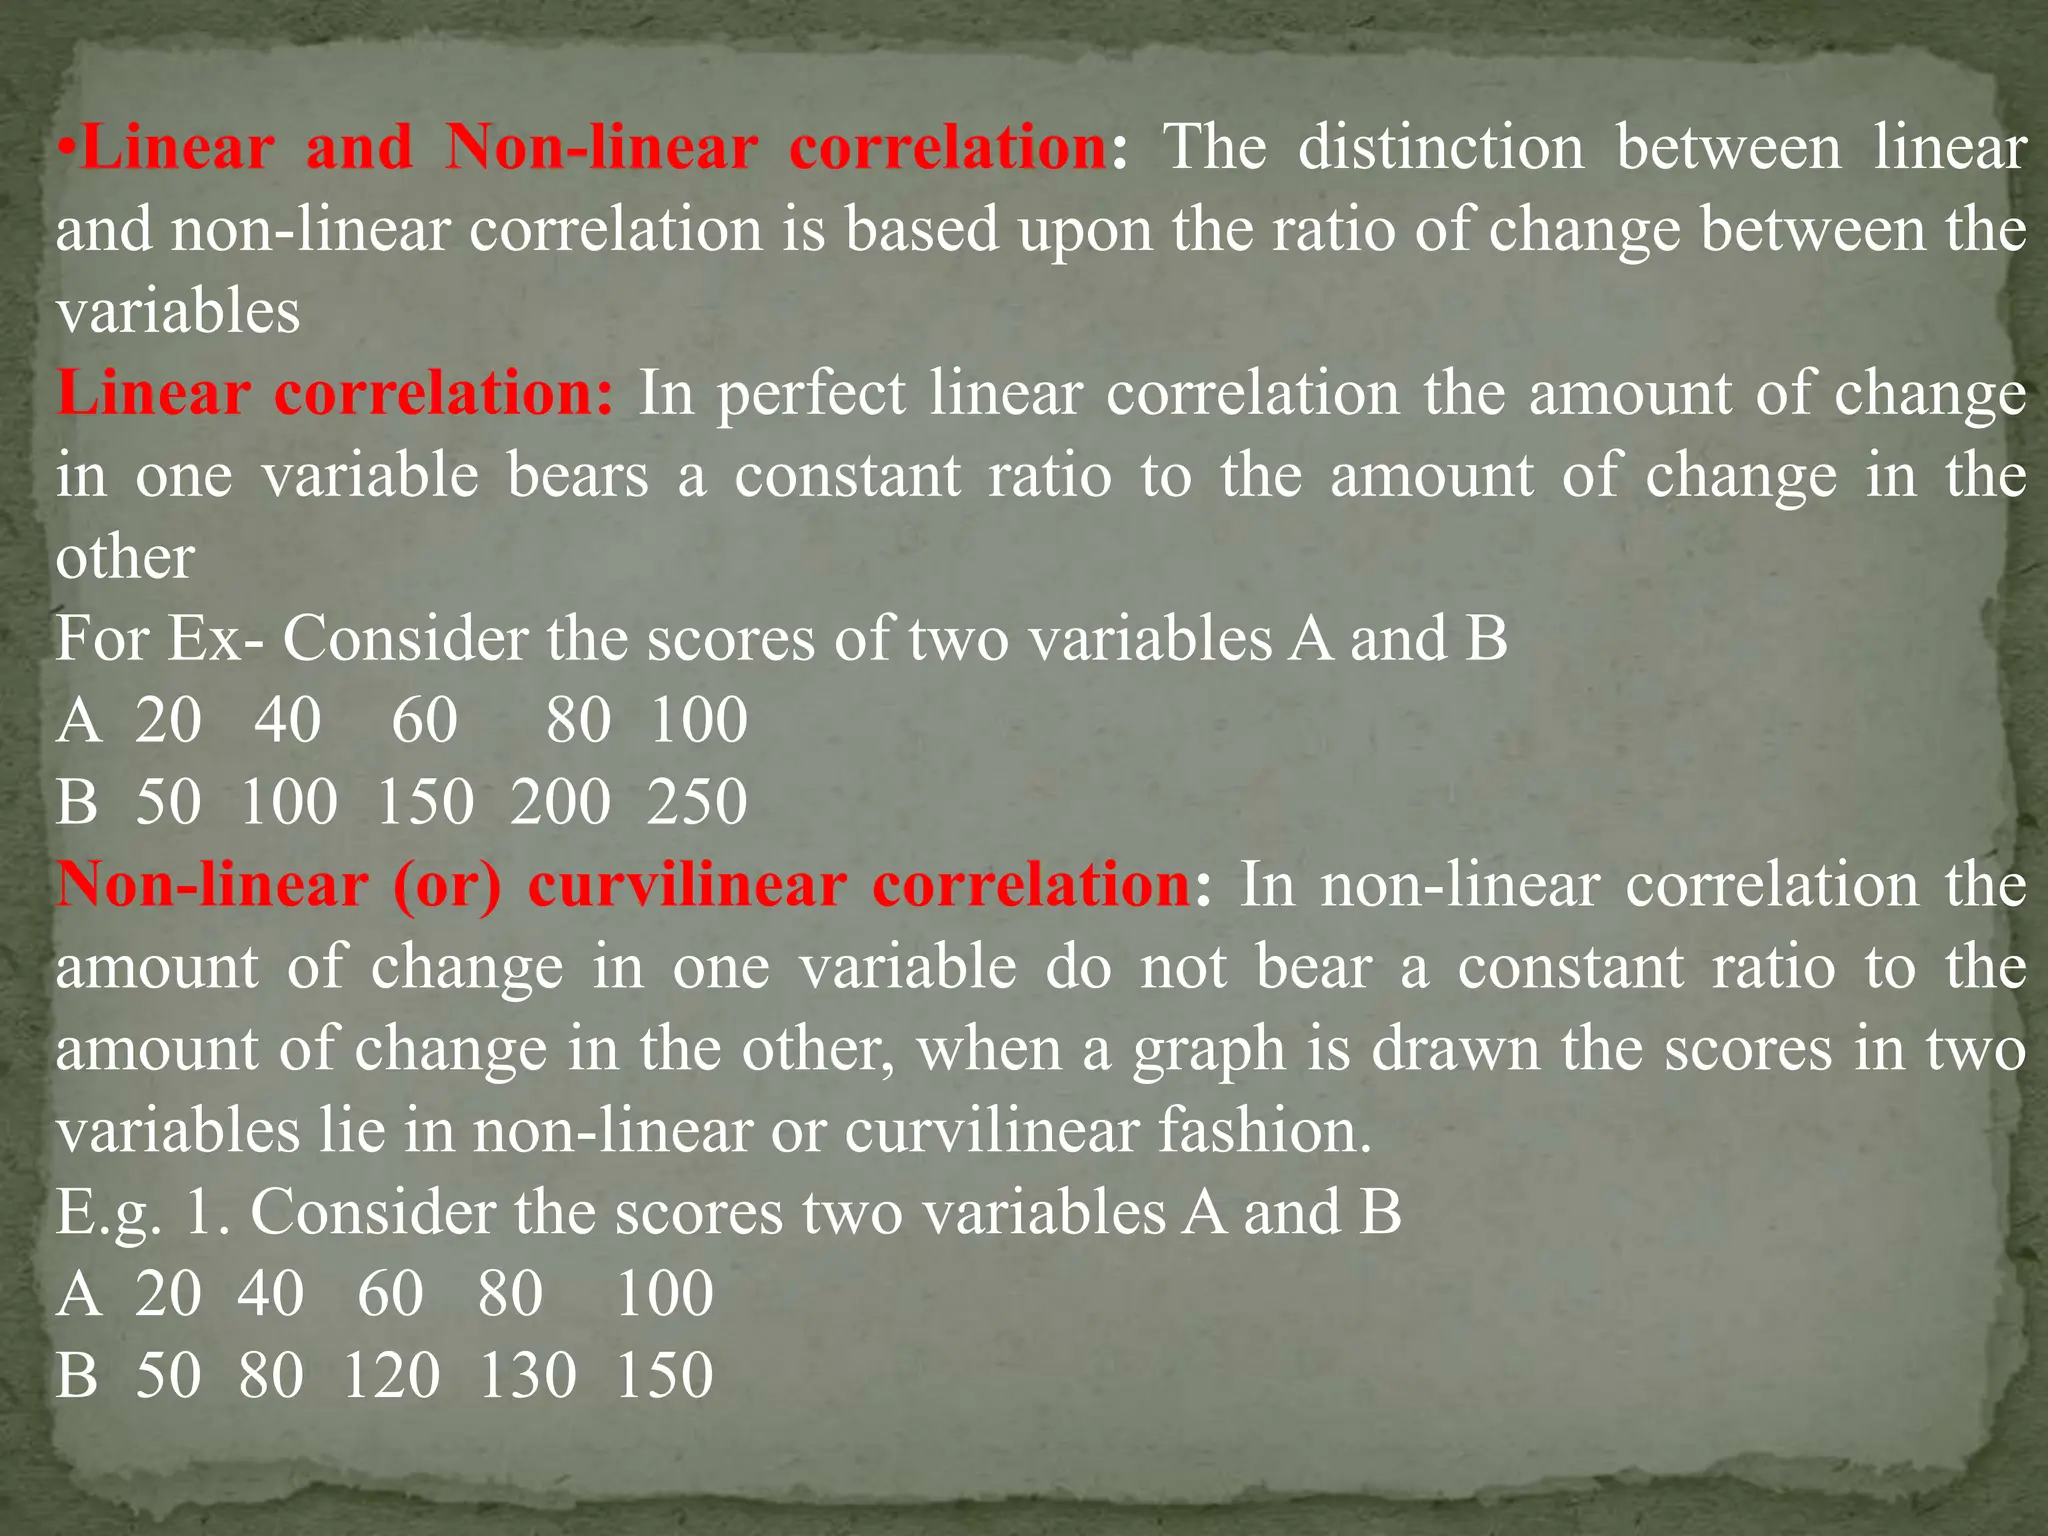
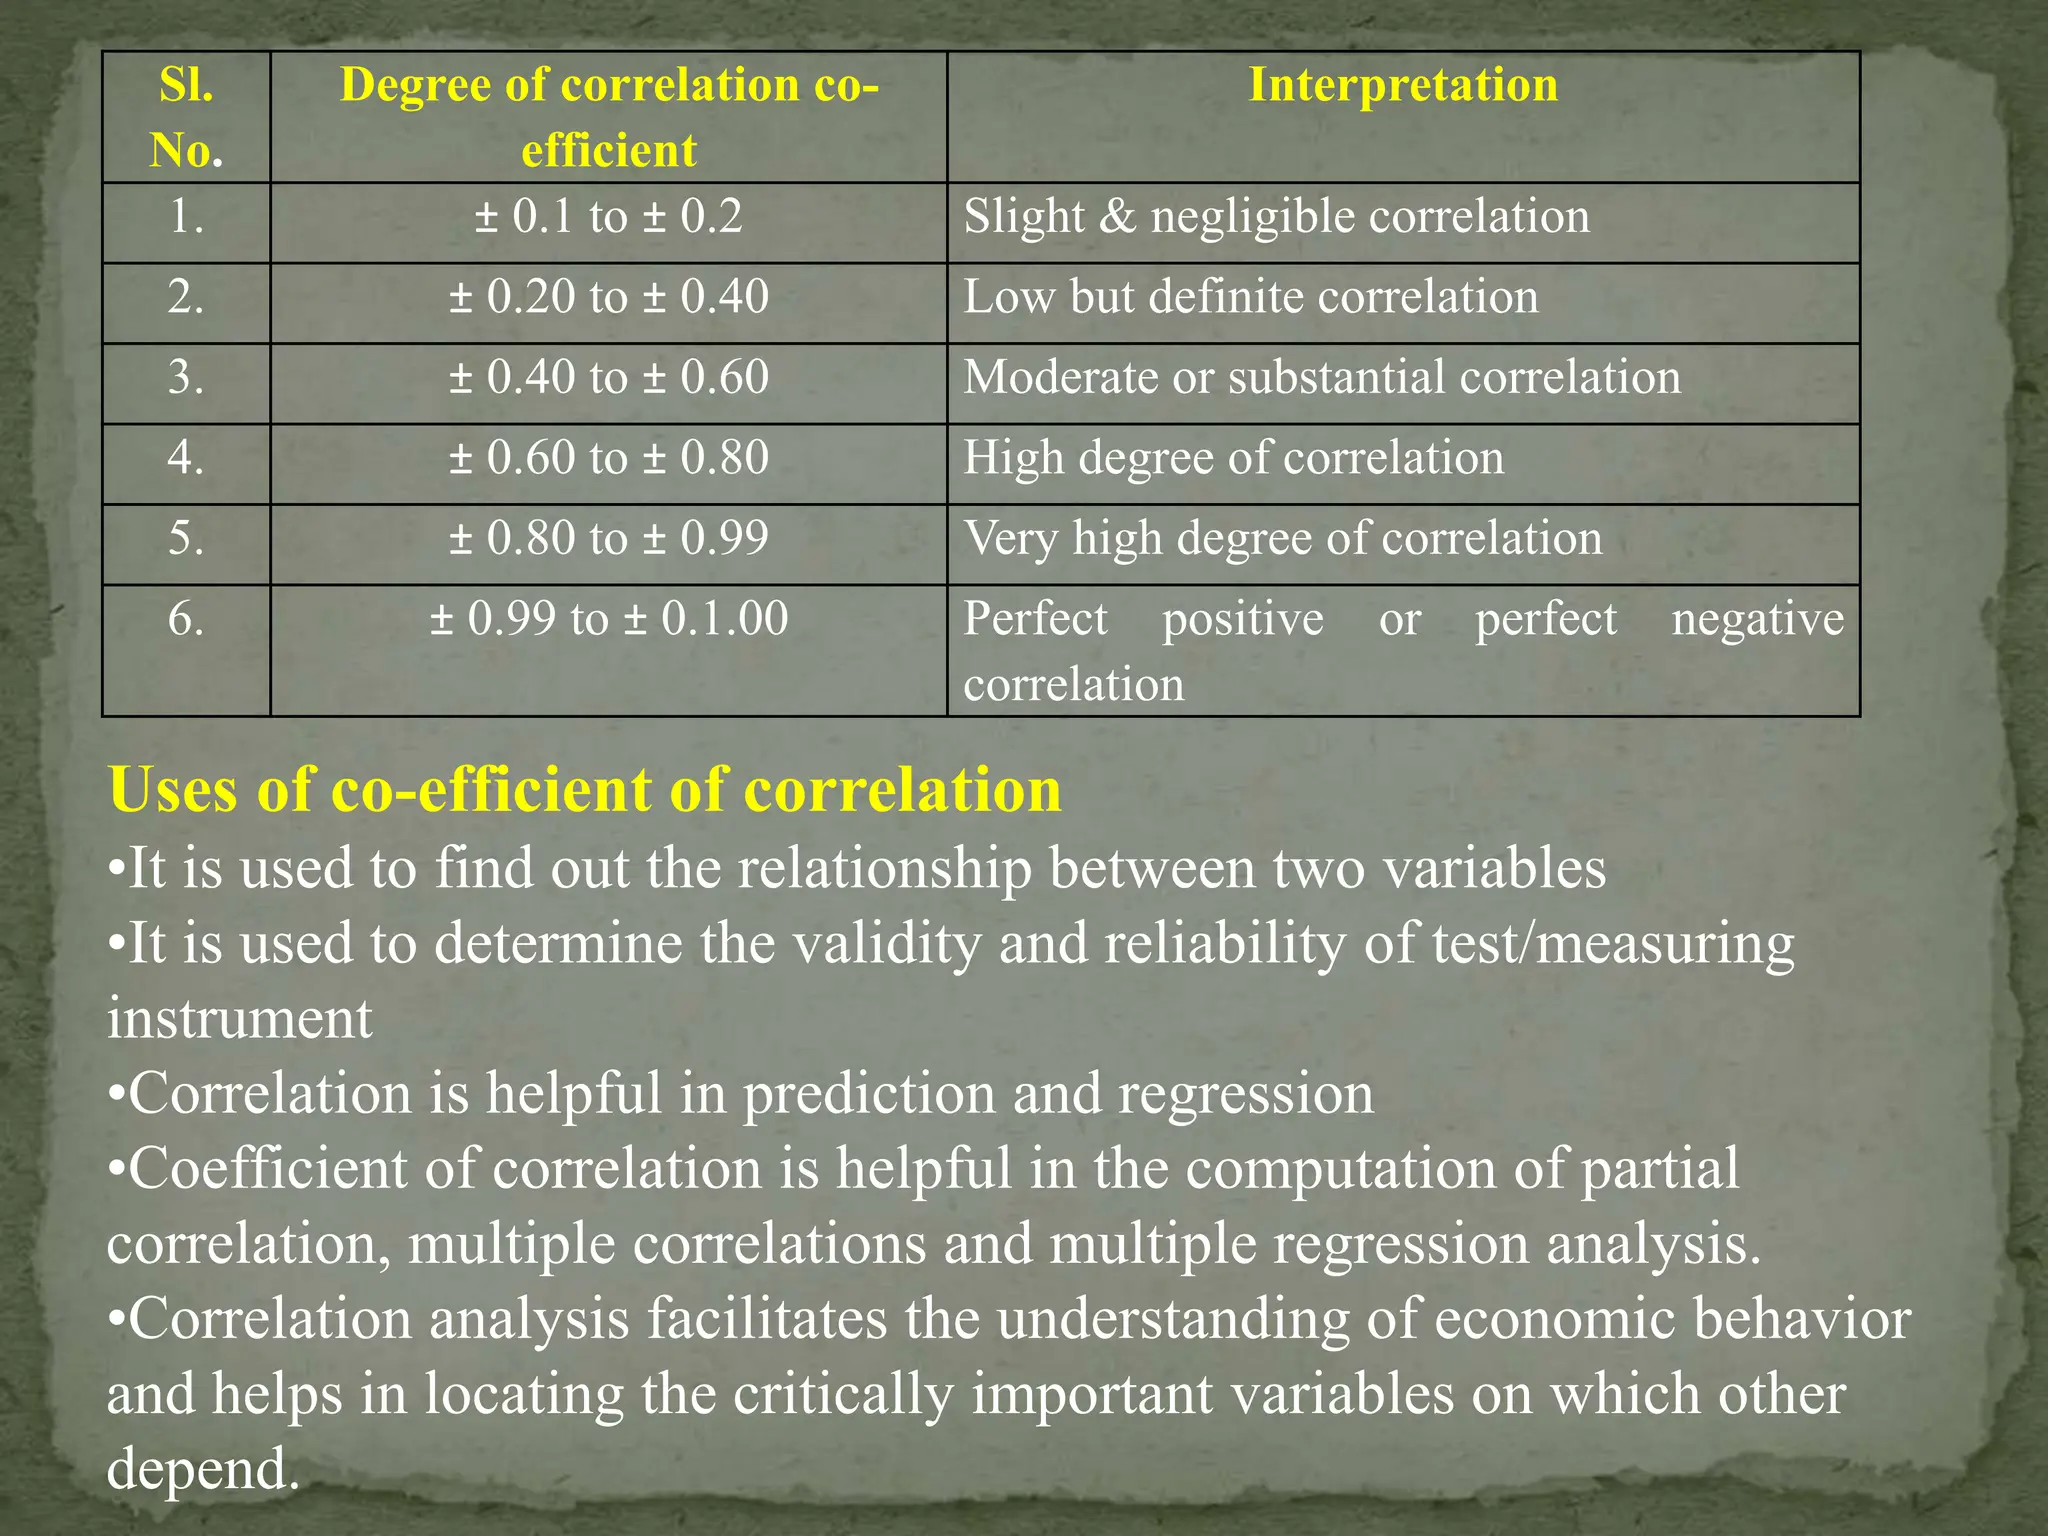
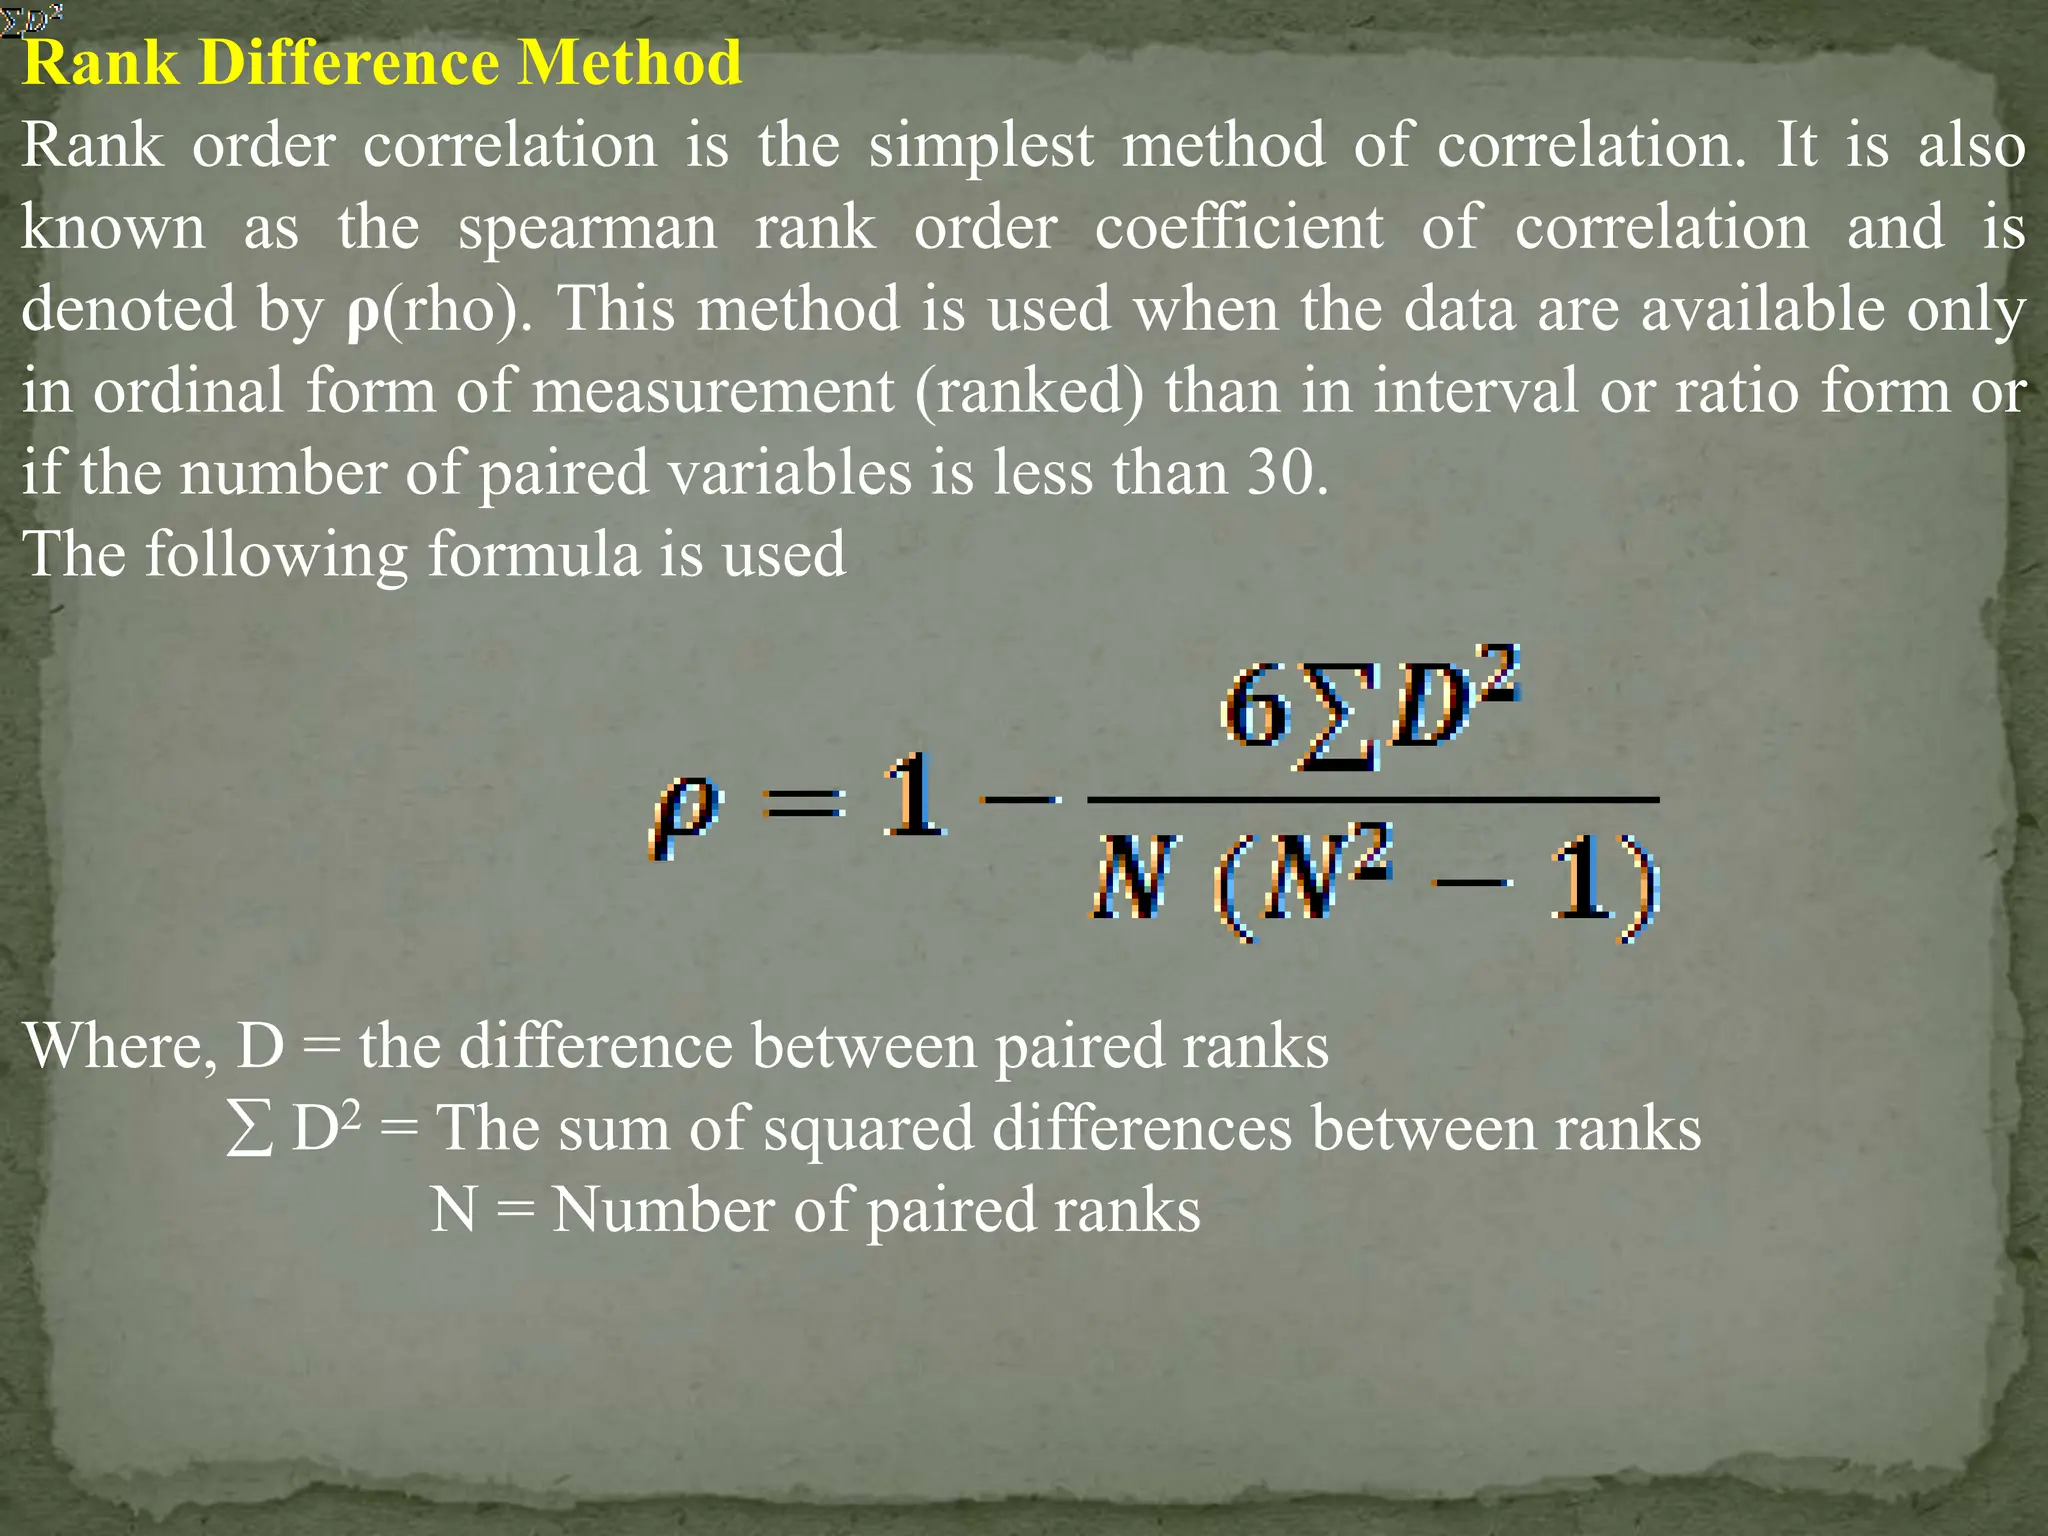
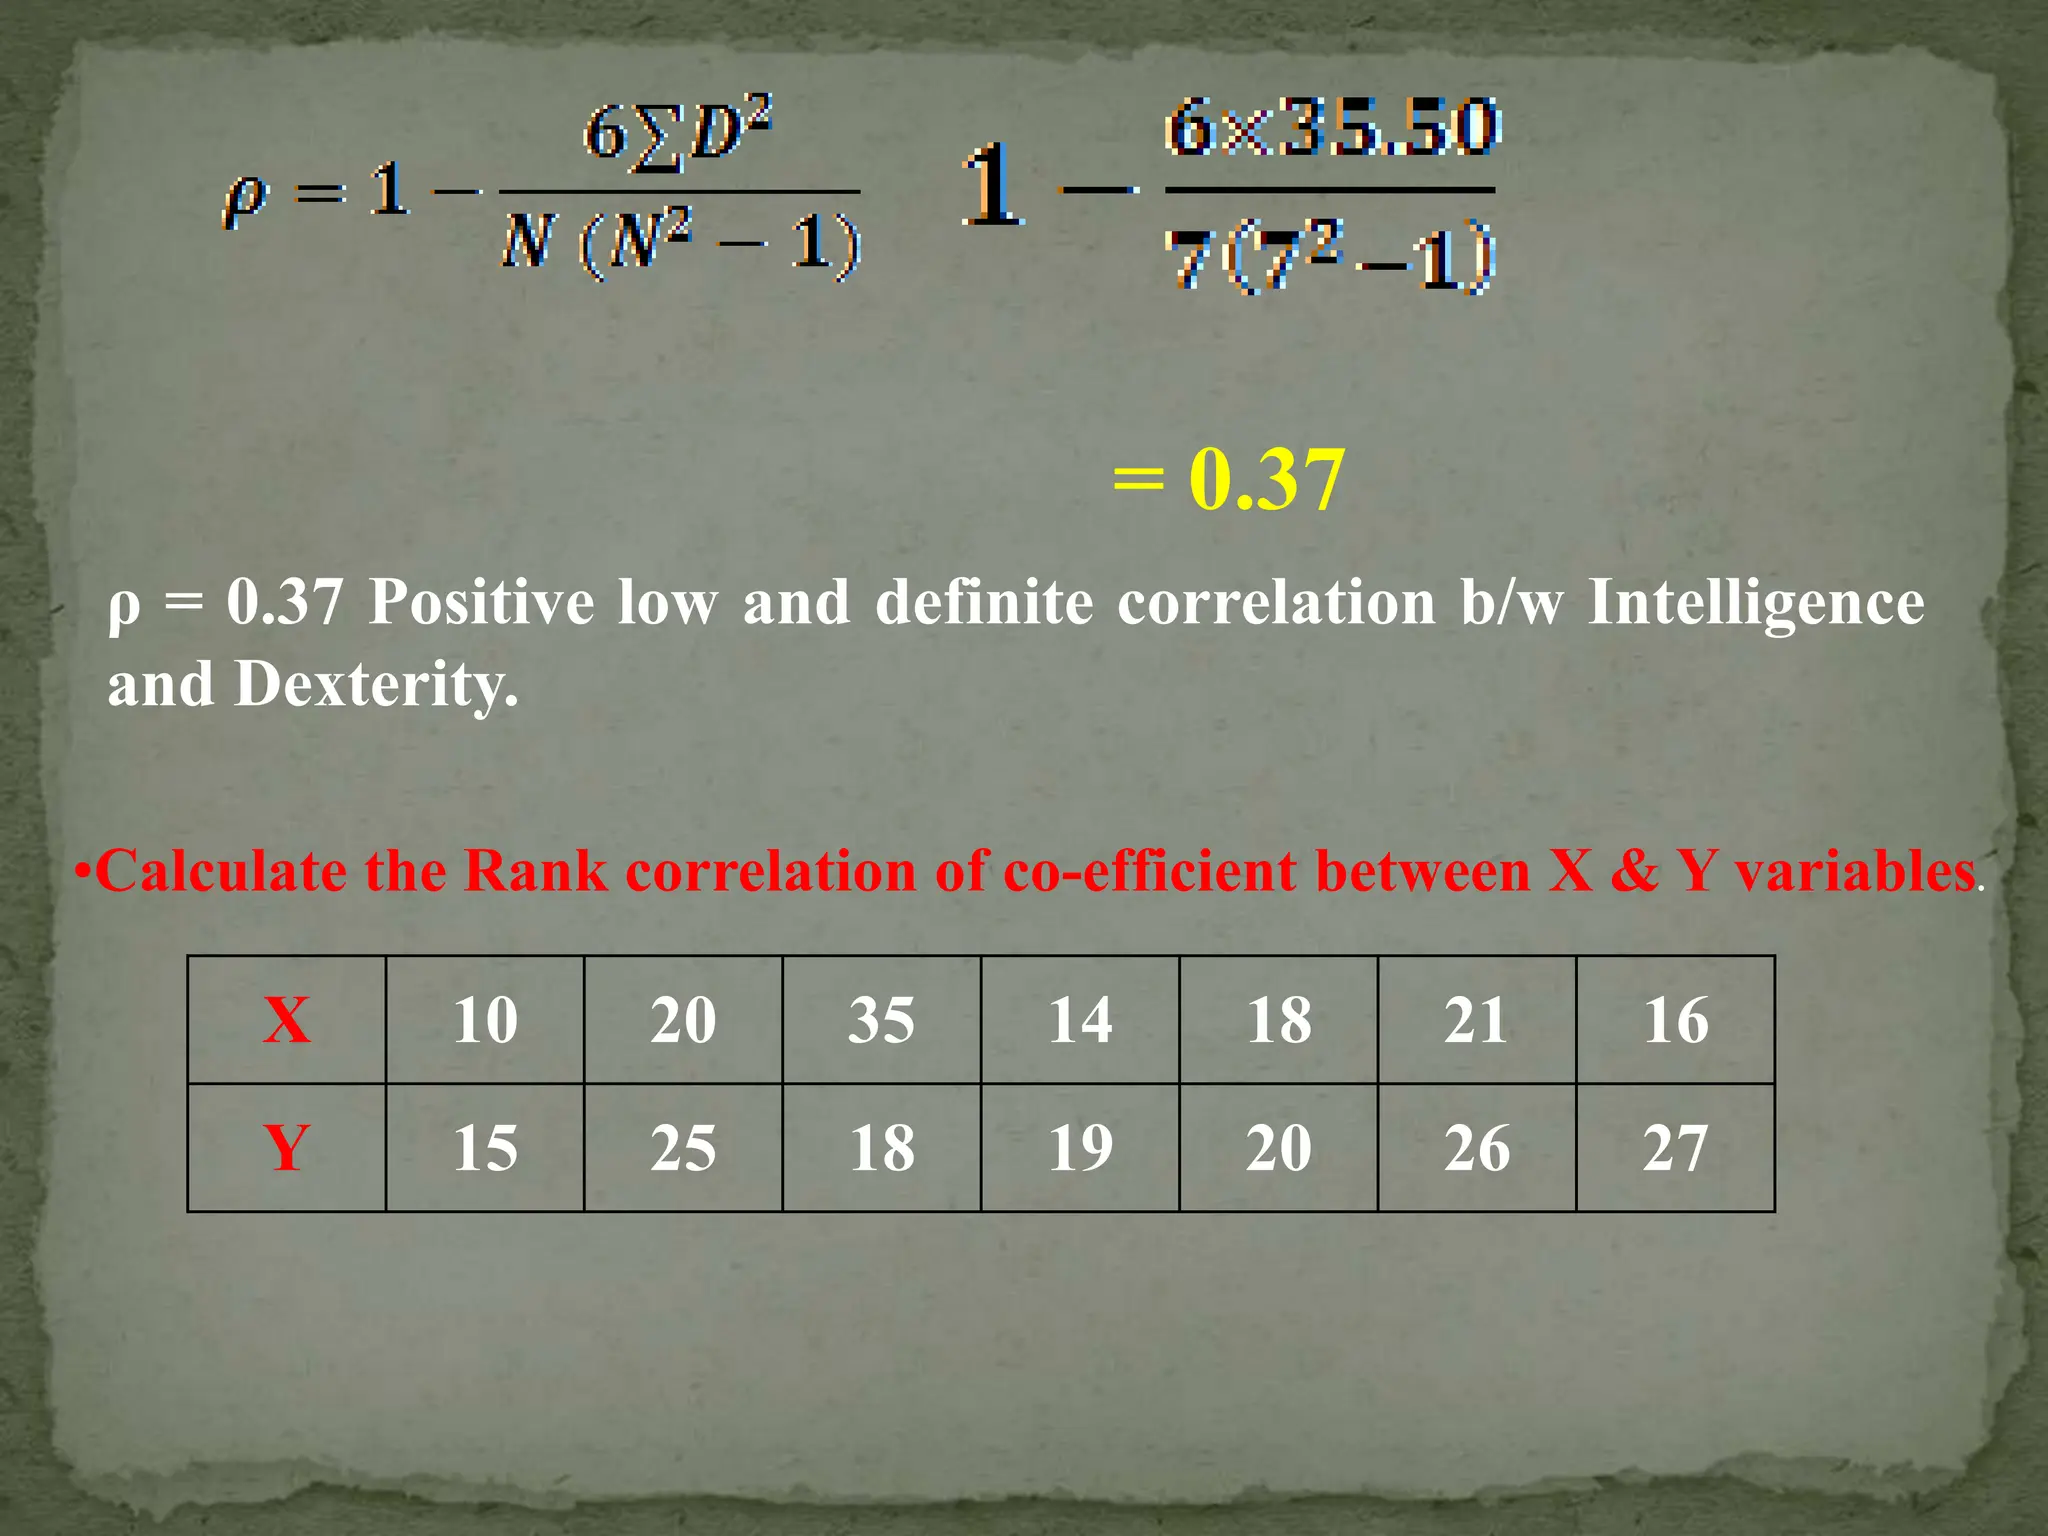
Kuvempu University
Subject: Statistics in Educational Research
Topic: correlation Types and Uses , Rank Difference Correlation
Presented to,
Dr. S.S.Patil Sir
Professor
Department of Education
Kuvempu University
Presented By
Shruthi B.R.
2ND semester .
Department of Education
Kuvempu University
Wel come
 statistics is a branch of science which deals with the
collection, analysis and interpretation of data obtained by
conducting a survey or an experimental study.
 In the previous study we have discussed with Univariate
distribution i.e. the distributions relating to one quantitative
variable only. In practice we come across a number situations
involving the study two or more variable
 For example: consider the scores of five students in science
and math tests.
 Correlation is a measure of degree and direction of
relationship between two variables.
 Correlation is a statistical technique that is used to
measure and describe a relationship between two
variables. Usually the two variables are simply observed,
not manipulated.
 The correlation requires two scores from the same
individuals. These scores were normally identified as x
and y. The pairs of scores can be listed in a table or
presented in a scatter plot.
 “Correlation indicates a joint relationship between two variables”
- Latrop and Richard G
 “Correlation is concerned with describing the degree of relation
between variables”
-Ferguson G. A
 “Relationship between two sets of measures is known as
correlation”.
-Garret H. E.
 According to English and English:
“Correlation is a relationship or dependence. It is the fact that two
things or variables are so related that change in one is accompanied
by a corresponding or parallel change in the other”.
 Positive correlation: when measures of two variables change in the
same direction, it is said to be positive correlation.
E.g.: 1) X 15 25 35 45 55 X Y
Y 30 40 50 60 70
 Negative correlation: when the measures of two variables change in
opposite direction, it is said to be negative correlation.
E.g.: 1) X 65 70 75 80 85 X Y
Y 45 40 35 30 25
 Zero Correlation: when the measures two variables do not exhibit any
relationship. As the value of one variable increases there will be no
change in value of another variable. It is termed by Zero correlation
Eg: 65 62 60 58 50
89 100 76 80 93 r = 0.00
•Linear and Non-linear correlation: The distinction between linear
and non-linear correlation is based upon the ratio of change between the
variables
Linear correlation: In perfect linear correlation the amount of change
in one variable bears a constant ratio to the amount of change in the
other
For Ex- Consider the scores of two variables A and B
A 20 40 60 80 100
B 50 100 150 200 250
Non-linear (or) curvilinear correlation: In non-linear correlation the
amount of change in one variable do not bear a constant ratio to the
amount of change in the other, when a graph is drawn the scores in two
variables lie in non-linear or curvilinear fashion.
E.g. 1. Consider the scores two variables A and B
A 20 40 60 80 100
B 50 80 120 130 150
A co-efficient of correlation indicates the degree to which two
variables are related to each other. They do not necessarily show a
cause and effect relationship
According of Garret H. E.
“Co-efficient of correlation may be thought of essentially as the
ratio which expresses the extent to which changes in one variable are
accompanied by or are dependent upon changes in the Second
Variable”.
The co-efficient correlation is designated by the letter ‘r’. The
method of calculating correlation coefficient (r) was invented by Carl
pearson in 1896. The value of co-efficient of correlation varies from -
1 to +1.
Sl.
No.
Degree of correlation co-
efficient
Interpretation
1. ± 0.1 to ± 0.2 Slight & negligible correlation
2. ± 0.20 to ± 0.40 Low but definite correlation
3. ± 0.40 to ± 0.60 Moderate or substantial correlation
4. ± 0.60 to ± 0.80 High degree of correlation
5. ± 0.80 to ± 0.99 Very high degree of correlation
6. ± 0.99 to ± 0.1.00 Perfect positive or perfect negative
correlation
Uses of co-efficient of correlation
•It is used to find out the relationship between two variables
•It is used to determine the validity and reliability of test/measuring
instrument
•Correlation is helpful in prediction and regression
•Coefficient of correlation is helpful in the computation of partial
correlation, multiple correlations and multiple regression analysis.
•Correlation analysis facilitates the understanding of economic behavior
and helps in locating the critically important variables on which other
depend.
Rank Difference Method
Rank order correlation is the simplest method of correlation. It is also
known as the spearman rank order coefficient of correlation and is
denoted by ρ(rho). This method is used when the data are available only
in ordinal form of measurement (ranked) than in interval or ratio form or
if the number of paired variables is less than 30.
The following formula is used
Where, D = the difference between paired ranks
 D2 = The sum of squared differences between ranks
N = Number of paired ranks
Steps involved in computing Rank order co-efficient of
correlation
•Assign ranks for the scores obtained by the students on text X as
R1 and on test Y as R2
•First rank should be assigned to a highest score in a series and it
has to be continued serially in an order
•Find the difference between the ranks (R1 – R2 =D)
•Square the difference in the ranks D2
•Find the sum of squared difference in rank ( D2 ).
•Calculate coefficient of correlation by using the formula
•
Students Math’s
test
score
Science
test score
Rank order
of Math’s
score R1
Rank order
of Science
score R2
Difference
b/w ranks
D= R1-R2
Square of
differences
D2
A 75 74 3.00 1.00 2.00 4.00
B 80 68 1.00 3.00 -2.00 4.00
C 77 70 2.00 2.00 0.00 0.00
D 62 65 4.50 4.00 0.50 0.25
E 56 58 6.00 5.00 1.00 1.00
F 62 49 4.50 8.50 -4.00 16.00
G 41 51 10.00 7.00 3.00 9.00
H 52 49 7.00 8.50 -1.50 2.25
I 48 52 8.00 6.00 2.00 4.00
J 45 47 9.00 10.00 -1.00 1.00
N=10  D2
=41.50
Problems on Rank Difference method
•Calculation of co-efficient of correlation of math’s and science test scores of 10
students by RD method
= 0.75
=
The obtained co-efficient of correlation can be interpreted with the
help of already known degree of correlation values. As the
obtained ρ value is 0.75. Positive & High degree P Value
correlation is there between math’s and science test scores of 10
students. This method is used usually when N is less than 30.
•Calculate the co-efficient of correlation for the given data
Intelligence 60 110 70 65 30 40 100
Dexterity 10 15 20 10 20 10 30
SL.
No.
Intelligence Dexterity Rank order of
Intelligence
R1
Rank
order of
Dexterity
R2
Difference
b/w ranks
D= R1-R2
Square of
differences
D2
1 60 10 5.00 6.00 -1.00 1.00
2 110 15 1.00 4.00 -3.00 9.00
3 70 20 3.00 2.50 0.50 0.25
4 65 10 4.00 6.00 -2.00 4.00
5 30 20 7.00 2.50 4.50 20.25
6 40 10 6.00 6.00 0.00 0.00
7 100 30 2.00 1.00 1.00 1.00
N=7  D2
=35.50
= 0.37
ρ = 0.37 Positive low and definite correlation b/w Intelligence
and Dexterity.
•Calculate the Rank correlation of co-efficient between X & Y variables.
X 10 20 35 14 18 21 16
Y 15 25 18 19 20 26 27
Limitations of rank order correlation
•In the calculation of rank order co-efficient of correlation only ranks are
considered but not the original scores,
•Assignment of ranks becomes very difficult when there are repeated scores.
•This method is used when the data consists of less than 30 scores (N < 30).
When to use this rank difference correlation
•When working with ranked data
An example could be a dataset that contains the rank of a student's
math exam score along with the rank of their science exam score in a class.
•When one or more extreme outliers are present
When extreme outliers are present in a dataset, Pearson's correlation
coefficient is highly affected.
Conclusion
So far we studied about the correlation, types and co-
efficient of correlation and also how to calculate the coefficient
of correlation using Rank difference method. This method is
used to find out the relationship between two variables less than
30. It is not possible when the scores are more than 30, it is the
main drawback of this method.
References
1. Dr. H .V. Vamadevappa, Psychology of Learning and
Instruction, Shreyas Publications, Davangere 2013.
2. https:/www.statology.org.
correlation Types in statistical Education

correlation Types in statistical Education

  • 1.
    Kuvempu University Subject: Statisticsin Educational Research Topic: correlation Types and Uses , Rank Difference Correlation Presented to, Dr. S.S.Patil Sir Professor Department of Education Kuvempu University Presented By Shruthi B.R. 2ND semester . Department of Education Kuvempu University Wel come
  • 2.
     statistics isa branch of science which deals with the collection, analysis and interpretation of data obtained by conducting a survey or an experimental study.  In the previous study we have discussed with Univariate distribution i.e. the distributions relating to one quantitative variable only. In practice we come across a number situations involving the study two or more variable  For example: consider the scores of five students in science and math tests.  Correlation is a measure of degree and direction of relationship between two variables.
  • 3.
     Correlation isa statistical technique that is used to measure and describe a relationship between two variables. Usually the two variables are simply observed, not manipulated.  The correlation requires two scores from the same individuals. These scores were normally identified as x and y. The pairs of scores can be listed in a table or presented in a scatter plot.
  • 4.
     “Correlation indicatesa joint relationship between two variables” - Latrop and Richard G  “Correlation is concerned with describing the degree of relation between variables” -Ferguson G. A  “Relationship between two sets of measures is known as correlation”. -Garret H. E.  According to English and English: “Correlation is a relationship or dependence. It is the fact that two things or variables are so related that change in one is accompanied by a corresponding or parallel change in the other”.
  • 5.
     Positive correlation:when measures of two variables change in the same direction, it is said to be positive correlation. E.g.: 1) X 15 25 35 45 55 X Y Y 30 40 50 60 70  Negative correlation: when the measures of two variables change in opposite direction, it is said to be negative correlation. E.g.: 1) X 65 70 75 80 85 X Y Y 45 40 35 30 25  Zero Correlation: when the measures two variables do not exhibit any relationship. As the value of one variable increases there will be no change in value of another variable. It is termed by Zero correlation Eg: 65 62 60 58 50 89 100 76 80 93 r = 0.00
  • 6.
    •Linear and Non-linearcorrelation: The distinction between linear and non-linear correlation is based upon the ratio of change between the variables Linear correlation: In perfect linear correlation the amount of change in one variable bears a constant ratio to the amount of change in the other For Ex- Consider the scores of two variables A and B A 20 40 60 80 100 B 50 100 150 200 250 Non-linear (or) curvilinear correlation: In non-linear correlation the amount of change in one variable do not bear a constant ratio to the amount of change in the other, when a graph is drawn the scores in two variables lie in non-linear or curvilinear fashion. E.g. 1. Consider the scores two variables A and B A 20 40 60 80 100 B 50 80 120 130 150
  • 7.
    A co-efficient ofcorrelation indicates the degree to which two variables are related to each other. They do not necessarily show a cause and effect relationship According of Garret H. E. “Co-efficient of correlation may be thought of essentially as the ratio which expresses the extent to which changes in one variable are accompanied by or are dependent upon changes in the Second Variable”. The co-efficient correlation is designated by the letter ‘r’. The method of calculating correlation coefficient (r) was invented by Carl pearson in 1896. The value of co-efficient of correlation varies from - 1 to +1.
  • 8.
    Sl. No. Degree of correlationco- efficient Interpretation 1. ± 0.1 to ± 0.2 Slight & negligible correlation 2. ± 0.20 to ± 0.40 Low but definite correlation 3. ± 0.40 to ± 0.60 Moderate or substantial correlation 4. ± 0.60 to ± 0.80 High degree of correlation 5. ± 0.80 to ± 0.99 Very high degree of correlation 6. ± 0.99 to ± 0.1.00 Perfect positive or perfect negative correlation Uses of co-efficient of correlation •It is used to find out the relationship between two variables •It is used to determine the validity and reliability of test/measuring instrument •Correlation is helpful in prediction and regression •Coefficient of correlation is helpful in the computation of partial correlation, multiple correlations and multiple regression analysis. •Correlation analysis facilitates the understanding of economic behavior and helps in locating the critically important variables on which other depend.
  • 9.
    Rank Difference Method Rankorder correlation is the simplest method of correlation. It is also known as the spearman rank order coefficient of correlation and is denoted by ρ(rho). This method is used when the data are available only in ordinal form of measurement (ranked) than in interval or ratio form or if the number of paired variables is less than 30. The following formula is used Where, D = the difference between paired ranks  D2 = The sum of squared differences between ranks N = Number of paired ranks
  • 10.
    Steps involved incomputing Rank order co-efficient of correlation •Assign ranks for the scores obtained by the students on text X as R1 and on test Y as R2 •First rank should be assigned to a highest score in a series and it has to be continued serially in an order •Find the difference between the ranks (R1 – R2 =D) •Square the difference in the ranks D2 •Find the sum of squared difference in rank ( D2 ). •Calculate coefficient of correlation by using the formula •
  • 11.
    Students Math’s test score Science test score Rankorder of Math’s score R1 Rank order of Science score R2 Difference b/w ranks D= R1-R2 Square of differences D2 A 75 74 3.00 1.00 2.00 4.00 B 80 68 1.00 3.00 -2.00 4.00 C 77 70 2.00 2.00 0.00 0.00 D 62 65 4.50 4.00 0.50 0.25 E 56 58 6.00 5.00 1.00 1.00 F 62 49 4.50 8.50 -4.00 16.00 G 41 51 10.00 7.00 3.00 9.00 H 52 49 7.00 8.50 -1.50 2.25 I 48 52 8.00 6.00 2.00 4.00 J 45 47 9.00 10.00 -1.00 1.00 N=10  D2 =41.50 Problems on Rank Difference method •Calculation of co-efficient of correlation of math’s and science test scores of 10 students by RD method
  • 12.
    = 0.75 = The obtainedco-efficient of correlation can be interpreted with the help of already known degree of correlation values. As the obtained ρ value is 0.75. Positive & High degree P Value correlation is there between math’s and science test scores of 10 students. This method is used usually when N is less than 30.
  • 13.
    •Calculate the co-efficientof correlation for the given data Intelligence 60 110 70 65 30 40 100 Dexterity 10 15 20 10 20 10 30 SL. No. Intelligence Dexterity Rank order of Intelligence R1 Rank order of Dexterity R2 Difference b/w ranks D= R1-R2 Square of differences D2 1 60 10 5.00 6.00 -1.00 1.00 2 110 15 1.00 4.00 -3.00 9.00 3 70 20 3.00 2.50 0.50 0.25 4 65 10 4.00 6.00 -2.00 4.00 5 30 20 7.00 2.50 4.50 20.25 6 40 10 6.00 6.00 0.00 0.00 7 100 30 2.00 1.00 1.00 1.00 N=7  D2 =35.50
  • 14.
    = 0.37 ρ =0.37 Positive low and definite correlation b/w Intelligence and Dexterity. •Calculate the Rank correlation of co-efficient between X & Y variables. X 10 20 35 14 18 21 16 Y 15 25 18 19 20 26 27
  • 15.
    Limitations of rankorder correlation •In the calculation of rank order co-efficient of correlation only ranks are considered but not the original scores, •Assignment of ranks becomes very difficult when there are repeated scores. •This method is used when the data consists of less than 30 scores (N < 30). When to use this rank difference correlation •When working with ranked data An example could be a dataset that contains the rank of a student's math exam score along with the rank of their science exam score in a class. •When one or more extreme outliers are present When extreme outliers are present in a dataset, Pearson's correlation coefficient is highly affected.
  • 16.
    Conclusion So far westudied about the correlation, types and co- efficient of correlation and also how to calculate the coefficient of correlation using Rank difference method. This method is used to find out the relationship between two variables less than 30. It is not possible when the scores are more than 30, it is the main drawback of this method.
  • 17.
    References 1. Dr. H.V. Vamadevappa, Psychology of Learning and Instruction, Shreyas Publications, Davangere 2013. 2. https:/www.statology.org.