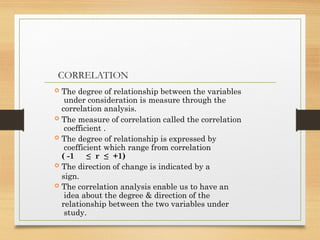
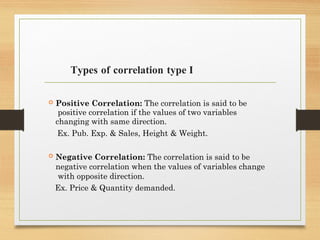
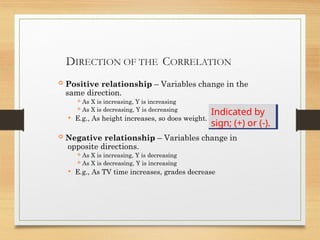
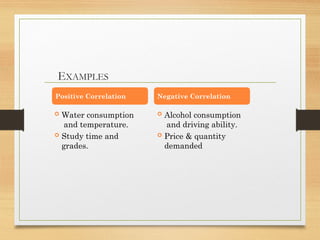
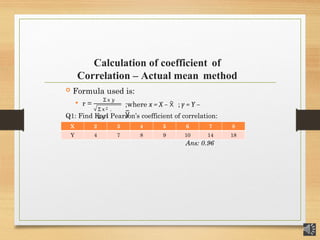
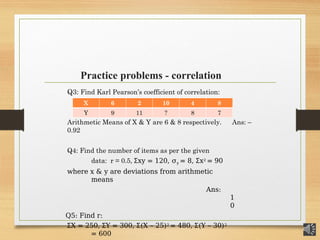
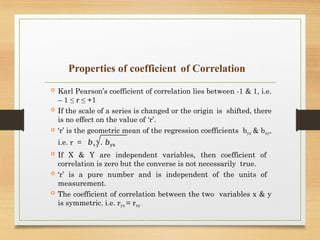
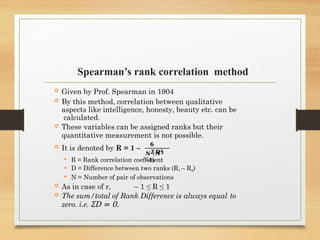
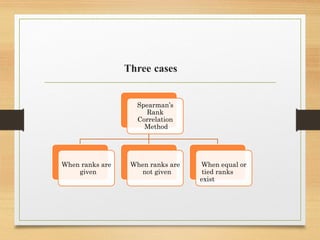
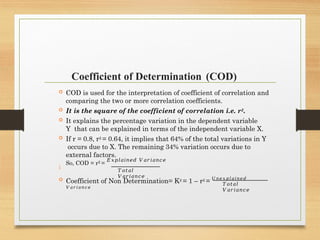
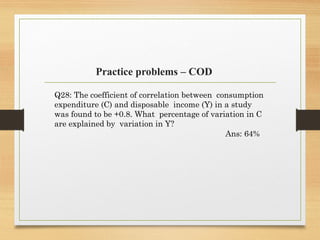
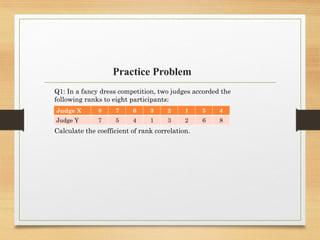
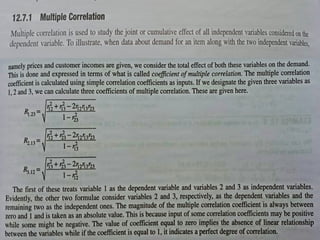
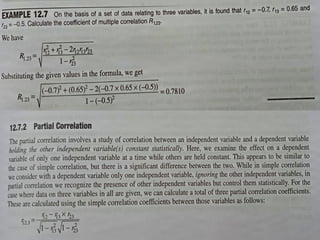
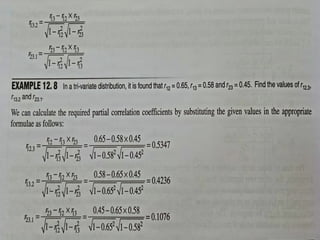
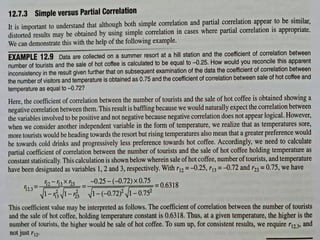
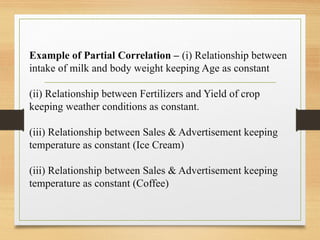
CORRELATION ANALYSIS
By
Ashutosh Sharma
I.T.S Mohan Nagar, Ghaziabad
CORRELATION
 The degree of relationship between the variables
under consideration is measure through the
correlation analysis.
 The measure of correlation called the correlation
coefficient .
 The degree of relationship is expressed by
coefficient which range from correlation
( -1 ≤ r ≤ +1)
 The direction of change is indicated by a
sign.
 The correlation analysis enable us to have an
idea about the degree & direction of the
relationship between the two variables under
study.
Types of correlation type I
 Positive Correlation: The correlation is said to be
positive correlation if the values of two variables
changing with same direction.
Ex. Pub. Exp. & Sales, Height & Weight.
 Negative Correlation: The correlation is said to be
negative correlation when the values of variables change
with opposite direction.
Ex. Price & Quantity demanded.
DIRECTION OF THE CORRELATION
 Positive relationship – Variables change in the
same direction.
 As X is increasing, Y is increasing
 As X is decreasing, Y is decreasing
 E.g., As height increases, so does weight.
 Negative relationship – Variables change in
opposite directions.
 As X is increasing, Y is decreasing
 As X is decreasing, Y is increasing
 E.g., As TV time increases, grades decrease
Indicated by
sign; (+) or (-).
EXAMPLES
Positive Correlation
 Water consumption
and temperature.
 Study time and
grades.
Negative Correlation
 Alcohol consumption
and driving ability.
 Price & quantity
demanded
Karl Pearson’s coefficient of
Correlation
 It is quantitative method of measuring
correlation
 This method has been given by Karl
Pearson
 It’s the best method
Calculation of coefficient of
Correlation – Actual mean method
 Formula used is:
 r =
Σ𝑥𝑦
Σ𝑥2 .
Σ𝑦2
;where x = X – x
̄ ; y = Y –
y
̅
Q1: Find Karl Pearson’s coefficient of correlation:
Ans: 0.96
X 2 3 4 5 6 7 8
Y 4 7 8 9 10 14 18
Practice problems - correlation
Q3: Find Karl Pearson’s coefficient of correlation:
Arithmetic Means of X & Y are 6 & 8 respectively. Ans: –
0.92
Q4: Find the number of items as per the given
data: r = 0.5, xy
Ʃ = 120, σy = 8, x
Ʃ 2 = 90
where x & y are deviations from arithmetic
means
Ans:
1
0
Q5: Find r:
X
Ʃ = 250, Y
Ʃ = 300, (X
Ʃ – 25)2 = 480, (Y
Ʃ – 30)2
= 600
X 6 2 10 4 8
Y 9 11 ? 8 7
Q6:Find r:
X 10 12 18 16 15 19 18 17
Y 30 35 45 44 42 48 47 46
Q7:Find r:
X 10 12 18 16 15 19 18 17
Y 30 35 45 44 42 48 47 46
X -5 -10 -15 -20 -25 -30
Y 50 40 30 20 10 5
Q8:Find r:
Properties of coefficient of Correlation
 Karl Pearson’s coefficient of correlation lies between -1 & 1, i.e.
– 1 ≤ r ≤ +1
 If the scale of a series is changed or the origin is shifted, there
is no effect on the value of ‘r’.
 ‘r’ is the geometric mean of the regression coefficients byx & bxy,
i.e. r = 𝑏𝑥𝑦 . 𝑏yx
 If X & Y are independent variables, then coefficient of
correlation is zero but the converse is not necessarily true.
 ‘r’ is a pure number and is independent of the units of
measurement.
 The coefficient of correlation between the two variables x & y
is symmetric. i.e. ryx = rxy
Spearman’s rank correlation method
 Given by Prof. Spearman in 1904
 By this method, correlation between qualitative
aspects like intelligence, honesty, beauty etc. can be
calculated.
 These variables can be assigned ranks but their
quantitative measurement is not possible.
 It is denoted by R = 1 –
𝟔
𝜮𝑫𝟐
𝑵 (𝑵𝟐
−𝟏)
 R = Rank correlation coefficient
 D = Difference between two ranks (R1 – R2)
 N = Number of pair of observations
 As in case of r, – 1 ≤ R ≤ 1
 The sum/total of Rank Difference is always equal to
zero. i.e. D
Ʃ = 0.
Three cases
Spearman’s
Rank
Correlation
Method
When ranks are
given
When ranks are
not given
When equal or
tied ranks
exist
Practice problems – rank correlation
(when ranks are given)
Q18: In a fancy dress competition, two judges accorded the
following ranks to eight participants:
Calculate the coefficient of rank correlation. Ans: .62
Q19: Ten competitors in a beauty contest are ranked by
three judges X, Y, Z:
Use the rank correlation coefficient to determine which pair
of
judges has the nearest approach to common tastes in beauty.
Ans: X & Z
Judge X 8 7 6 3 2 1 5 4
Judge Y 7 5 4 1 3 2 6 8
X 1 6 5 10 3 2 4 9 7 8
Y 3 5 8 4 7 10 2 1 6 9
Z 6 4 9 8 1 2 3 10 5 7
Practice problems – rank correlation (when ranks are
not given)
Q20: Find out the coefficient of Rank Correlation
between X & Y:
Ans: 0.48
X 15 17 14 13 11 12 16 18 10 9
Y 18 12 4 6 7 9 3 10 2 5
Practice problems – rank correlation (when
ranks are equal or tied)
 When two or more items have equal values in a
series, so common ranks i.e. average of the ranks
are assigned to equal values.
 Here R = 1 –
�
�
𝟔 𝜮𝑫
+
�
� +
𝒎 −𝒎 𝒎𝟑
−𝒎
𝟏𝟐
𝟏𝟐
+
…………..
𝑵 (𝑵𝟐
−𝟏)
 m = No. of items of equal ranks
 The correction factor of 𝒎𝟑
−𝒎
𝟏
𝟐
�
�
is added to 𝜮𝑫 for such
number of times as the cases of equal ranks in the
question
Practice problems – rank correlation (when
ranks are equal or tied)
Q21: Calculate R:
Ans: – 0.37
Q22: Calculate Rank Correlation:
Ans: 0.43
X 15 10 20 28 12 10 16 18
Y 16 14 10 12 11 15 18 10
X 40 50 60 60 80 50 70 60
Y 80 120 160 170 130 200 210 130
Coefficient of Determination (COD)

 COD is used for the interpretation of coefficient of correlation and
comparing the two or more correlation coefficients.
 It is the square of the coefficient of correlation i.e. r2.
 It explains the percentage variation in the dependent variable
Y that can be explained in terms of the independent variable X.
 If r = 0.8, r2 = 0.64, it implies that 64% of the total variations in Y
occurs due to X. The remaining 34% variation occurs due to
external factors.
So, COD = r2 =
𝐸𝑥𝑝𝑙𝑎𝑖𝑛𝑒𝑑 𝑉𝑎𝑟𝑖𝑎𝑛𝑐𝑒
𝑇𝑜𝑡𝑎𝑙
𝑉𝑎𝑟𝑖𝑎𝑛𝑐𝑒
 Coefficient of Non Determination= K2 = 1 – r2 = 𝑈𝑛𝑒𝑥𝑝𝑙𝑎𝑖𝑛𝑒𝑑
𝑉𝑎𝑟𝑖𝑎𝑛𝑐𝑒
𝑇𝑜𝑡𝑎𝑙
𝑉𝑎𝑟𝑖𝑎𝑛𝑐𝑒
Practice problems – COD
Q28: The coefficient of correlation between consumption
expenditure (C) and disposable income (Y) in a study
was found to be +0.8. What percentage of variation in C
are explained by variation in Y?
Ans: 64%
Practice Problem
Q1: In a fancy dress competition, two judges accorded the
following ranks to eight participants:
Calculate the coefficient of rank correlation.
Judge X 8 7 6 3 2 1 5 4
Judge Y 7 5 4 1 3 2 6 8
Example of Partial Correlation – (i) Relationship between
intake of milk and body weight keeping Age as constant
(ii) Relationship between Fertilizers and Yield of crop
keeping weather conditions as constant.
(iii) Relationship between Sales & Advertisement keeping
temperature as constant (Ice Cream)
(iii) Relationship between Sales & Advertisement keeping
temperature as constant (Coffee)

To do mail Correlation Analysis - Copy.pptx

  • 1.
  • 2.
    CORRELATION  The degreeof relationship between the variables under consideration is measure through the correlation analysis.  The measure of correlation called the correlation coefficient .  The degree of relationship is expressed by coefficient which range from correlation ( -1 ≤ r ≤ +1)  The direction of change is indicated by a sign.  The correlation analysis enable us to have an idea about the degree & direction of the relationship between the two variables under study.
  • 3.
    Types of correlationtype I  Positive Correlation: The correlation is said to be positive correlation if the values of two variables changing with same direction. Ex. Pub. Exp. & Sales, Height & Weight.  Negative Correlation: The correlation is said to be negative correlation when the values of variables change with opposite direction. Ex. Price & Quantity demanded.
  • 4.
    DIRECTION OF THECORRELATION  Positive relationship – Variables change in the same direction.  As X is increasing, Y is increasing  As X is decreasing, Y is decreasing  E.g., As height increases, so does weight.  Negative relationship – Variables change in opposite directions.  As X is increasing, Y is decreasing  As X is decreasing, Y is increasing  E.g., As TV time increases, grades decrease Indicated by sign; (+) or (-).
  • 5.
    EXAMPLES Positive Correlation  Waterconsumption and temperature.  Study time and grades. Negative Correlation  Alcohol consumption and driving ability.  Price & quantity demanded
  • 6.
    Karl Pearson’s coefficientof Correlation  It is quantitative method of measuring correlation  This method has been given by Karl Pearson  It’s the best method
  • 7.
    Calculation of coefficientof Correlation – Actual mean method  Formula used is:  r = Σ𝑥𝑦 Σ𝑥2 . Σ𝑦2 ;where x = X – x ̄ ; y = Y – y ̅ Q1: Find Karl Pearson’s coefficient of correlation: Ans: 0.96 X 2 3 4 5 6 7 8 Y 4 7 8 9 10 14 18
  • 8.
    Practice problems -correlation Q3: Find Karl Pearson’s coefficient of correlation: Arithmetic Means of X & Y are 6 & 8 respectively. Ans: – 0.92 Q4: Find the number of items as per the given data: r = 0.5, xy Ʃ = 120, σy = 8, x Ʃ 2 = 90 where x & y are deviations from arithmetic means Ans: 1 0 Q5: Find r: X Ʃ = 250, Y Ʃ = 300, (X Ʃ – 25)2 = 480, (Y Ʃ – 30)2 = 600 X 6 2 10 4 8 Y 9 11 ? 8 7
  • 9.
    Q6:Find r: X 1012 18 16 15 19 18 17 Y 30 35 45 44 42 48 47 46 Q7:Find r: X 10 12 18 16 15 19 18 17 Y 30 35 45 44 42 48 47 46 X -5 -10 -15 -20 -25 -30 Y 50 40 30 20 10 5 Q8:Find r:
  • 10.
    Properties of coefficientof Correlation  Karl Pearson’s coefficient of correlation lies between -1 & 1, i.e. – 1 ≤ r ≤ +1  If the scale of a series is changed or the origin is shifted, there is no effect on the value of ‘r’.  ‘r’ is the geometric mean of the regression coefficients byx & bxy, i.e. r = 𝑏𝑥𝑦 . 𝑏yx  If X & Y are independent variables, then coefficient of correlation is zero but the converse is not necessarily true.  ‘r’ is a pure number and is independent of the units of measurement.  The coefficient of correlation between the two variables x & y is symmetric. i.e. ryx = rxy
  • 11.
    Spearman’s rank correlationmethod  Given by Prof. Spearman in 1904  By this method, correlation between qualitative aspects like intelligence, honesty, beauty etc. can be calculated.  These variables can be assigned ranks but their quantitative measurement is not possible.  It is denoted by R = 1 – 𝟔 𝜮𝑫𝟐 𝑵 (𝑵𝟐 −𝟏)  R = Rank correlation coefficient  D = Difference between two ranks (R1 – R2)  N = Number of pair of observations  As in case of r, – 1 ≤ R ≤ 1  The sum/total of Rank Difference is always equal to zero. i.e. D Ʃ = 0.
  • 12.
    Three cases Spearman’s Rank Correlation Method When ranksare given When ranks are not given When equal or tied ranks exist
  • 13.
    Practice problems –rank correlation (when ranks are given) Q18: In a fancy dress competition, two judges accorded the following ranks to eight participants: Calculate the coefficient of rank correlation. Ans: .62 Q19: Ten competitors in a beauty contest are ranked by three judges X, Y, Z: Use the rank correlation coefficient to determine which pair of judges has the nearest approach to common tastes in beauty. Ans: X & Z Judge X 8 7 6 3 2 1 5 4 Judge Y 7 5 4 1 3 2 6 8 X 1 6 5 10 3 2 4 9 7 8 Y 3 5 8 4 7 10 2 1 6 9 Z 6 4 9 8 1 2 3 10 5 7
  • 14.
    Practice problems –rank correlation (when ranks are not given) Q20: Find out the coefficient of Rank Correlation between X & Y: Ans: 0.48 X 15 17 14 13 11 12 16 18 10 9 Y 18 12 4 6 7 9 3 10 2 5
  • 15.
    Practice problems –rank correlation (when ranks are equal or tied)  When two or more items have equal values in a series, so common ranks i.e. average of the ranks are assigned to equal values.  Here R = 1 – � � 𝟔 𝜮𝑫 + � � + 𝒎 −𝒎 𝒎𝟑 −𝒎 𝟏𝟐 𝟏𝟐 + ………….. 𝑵 (𝑵𝟐 −𝟏)  m = No. of items of equal ranks  The correction factor of 𝒎𝟑 −𝒎 𝟏 𝟐 � � is added to 𝜮𝑫 for such number of times as the cases of equal ranks in the question
  • 16.
    Practice problems –rank correlation (when ranks are equal or tied) Q21: Calculate R: Ans: – 0.37 Q22: Calculate Rank Correlation: Ans: 0.43 X 15 10 20 28 12 10 16 18 Y 16 14 10 12 11 15 18 10 X 40 50 60 60 80 50 70 60 Y 80 120 160 170 130 200 210 130
  • 17.
    Coefficient of Determination(COD)   COD is used for the interpretation of coefficient of correlation and comparing the two or more correlation coefficients.  It is the square of the coefficient of correlation i.e. r2.  It explains the percentage variation in the dependent variable Y that can be explained in terms of the independent variable X.  If r = 0.8, r2 = 0.64, it implies that 64% of the total variations in Y occurs due to X. The remaining 34% variation occurs due to external factors. So, COD = r2 = 𝐸𝑥𝑝𝑙𝑎𝑖𝑛𝑒𝑑 𝑉𝑎𝑟𝑖𝑎𝑛𝑐𝑒 𝑇𝑜𝑡𝑎𝑙 𝑉𝑎𝑟𝑖𝑎𝑛𝑐𝑒  Coefficient of Non Determination= K2 = 1 – r2 = 𝑈𝑛𝑒𝑥𝑝𝑙𝑎𝑖𝑛𝑒𝑑 𝑉𝑎𝑟𝑖𝑎𝑛𝑐𝑒 𝑇𝑜𝑡𝑎𝑙 𝑉𝑎𝑟𝑖𝑎𝑛𝑐𝑒
  • 18.
    Practice problems –COD Q28: The coefficient of correlation between consumption expenditure (C) and disposable income (Y) in a study was found to be +0.8. What percentage of variation in C are explained by variation in Y? Ans: 64%
  • 19.
    Practice Problem Q1: Ina fancy dress competition, two judges accorded the following ranks to eight participants: Calculate the coefficient of rank correlation. Judge X 8 7 6 3 2 1 5 4 Judge Y 7 5 4 1 3 2 6 8
  • 24.
    Example of PartialCorrelation – (i) Relationship between intake of milk and body weight keeping Age as constant (ii) Relationship between Fertilizers and Yield of crop keeping weather conditions as constant. (iii) Relationship between Sales & Advertisement keeping temperature as constant (Ice Cream) (iii) Relationship between Sales & Advertisement keeping temperature as constant (Coffee)