Download as PDF, PPTX


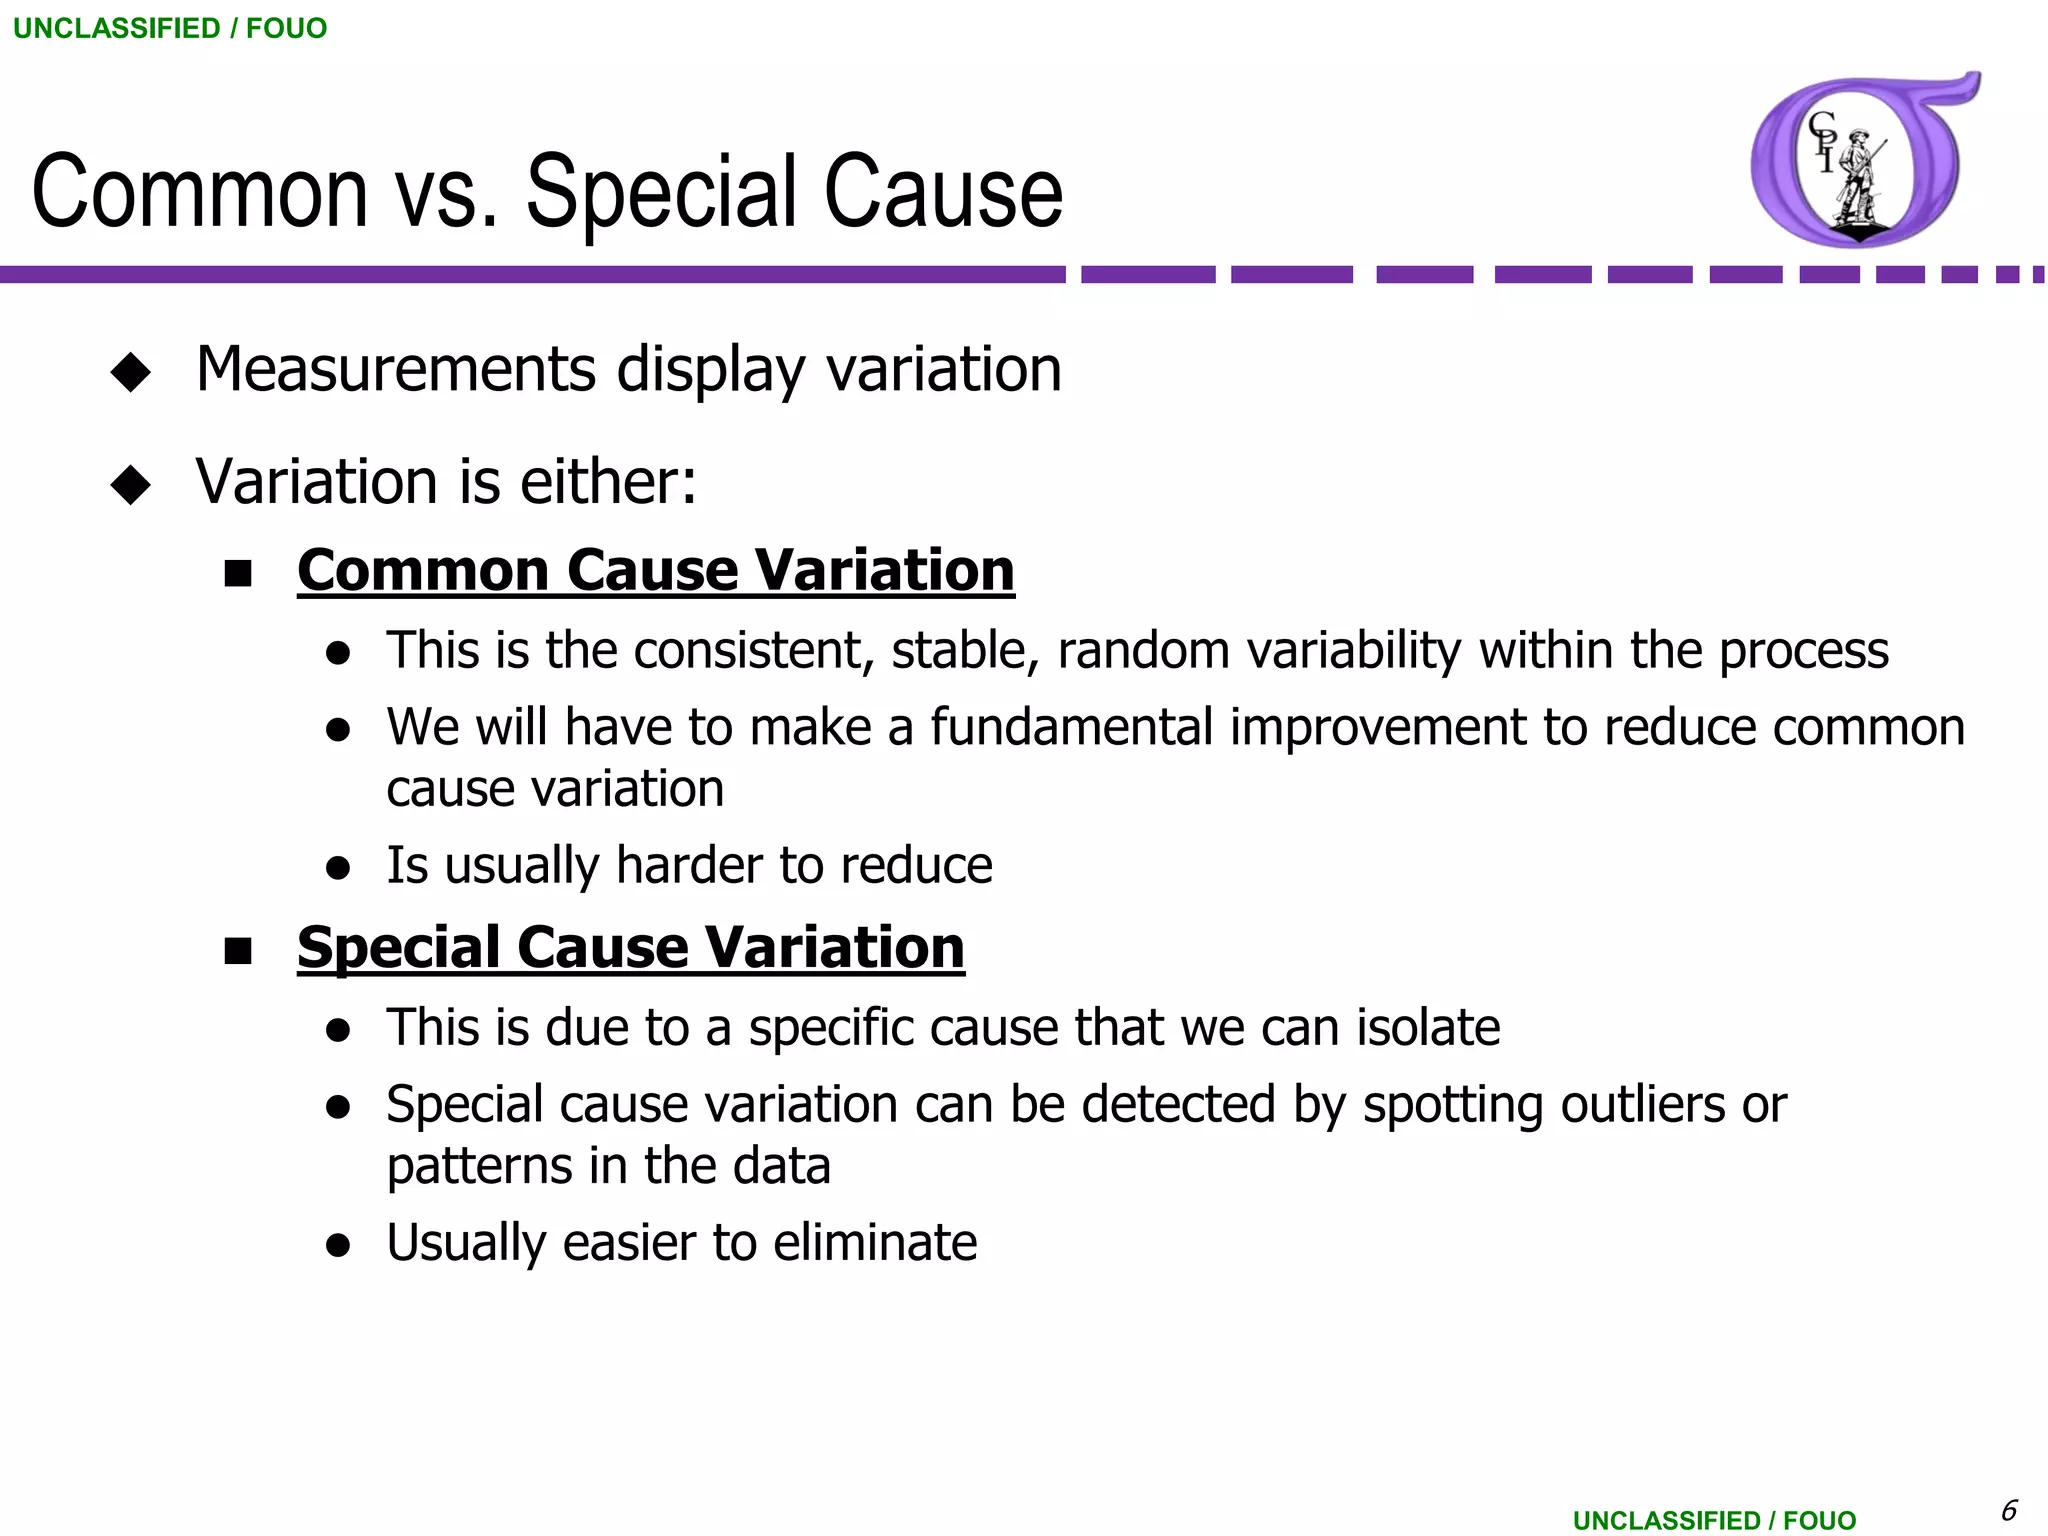


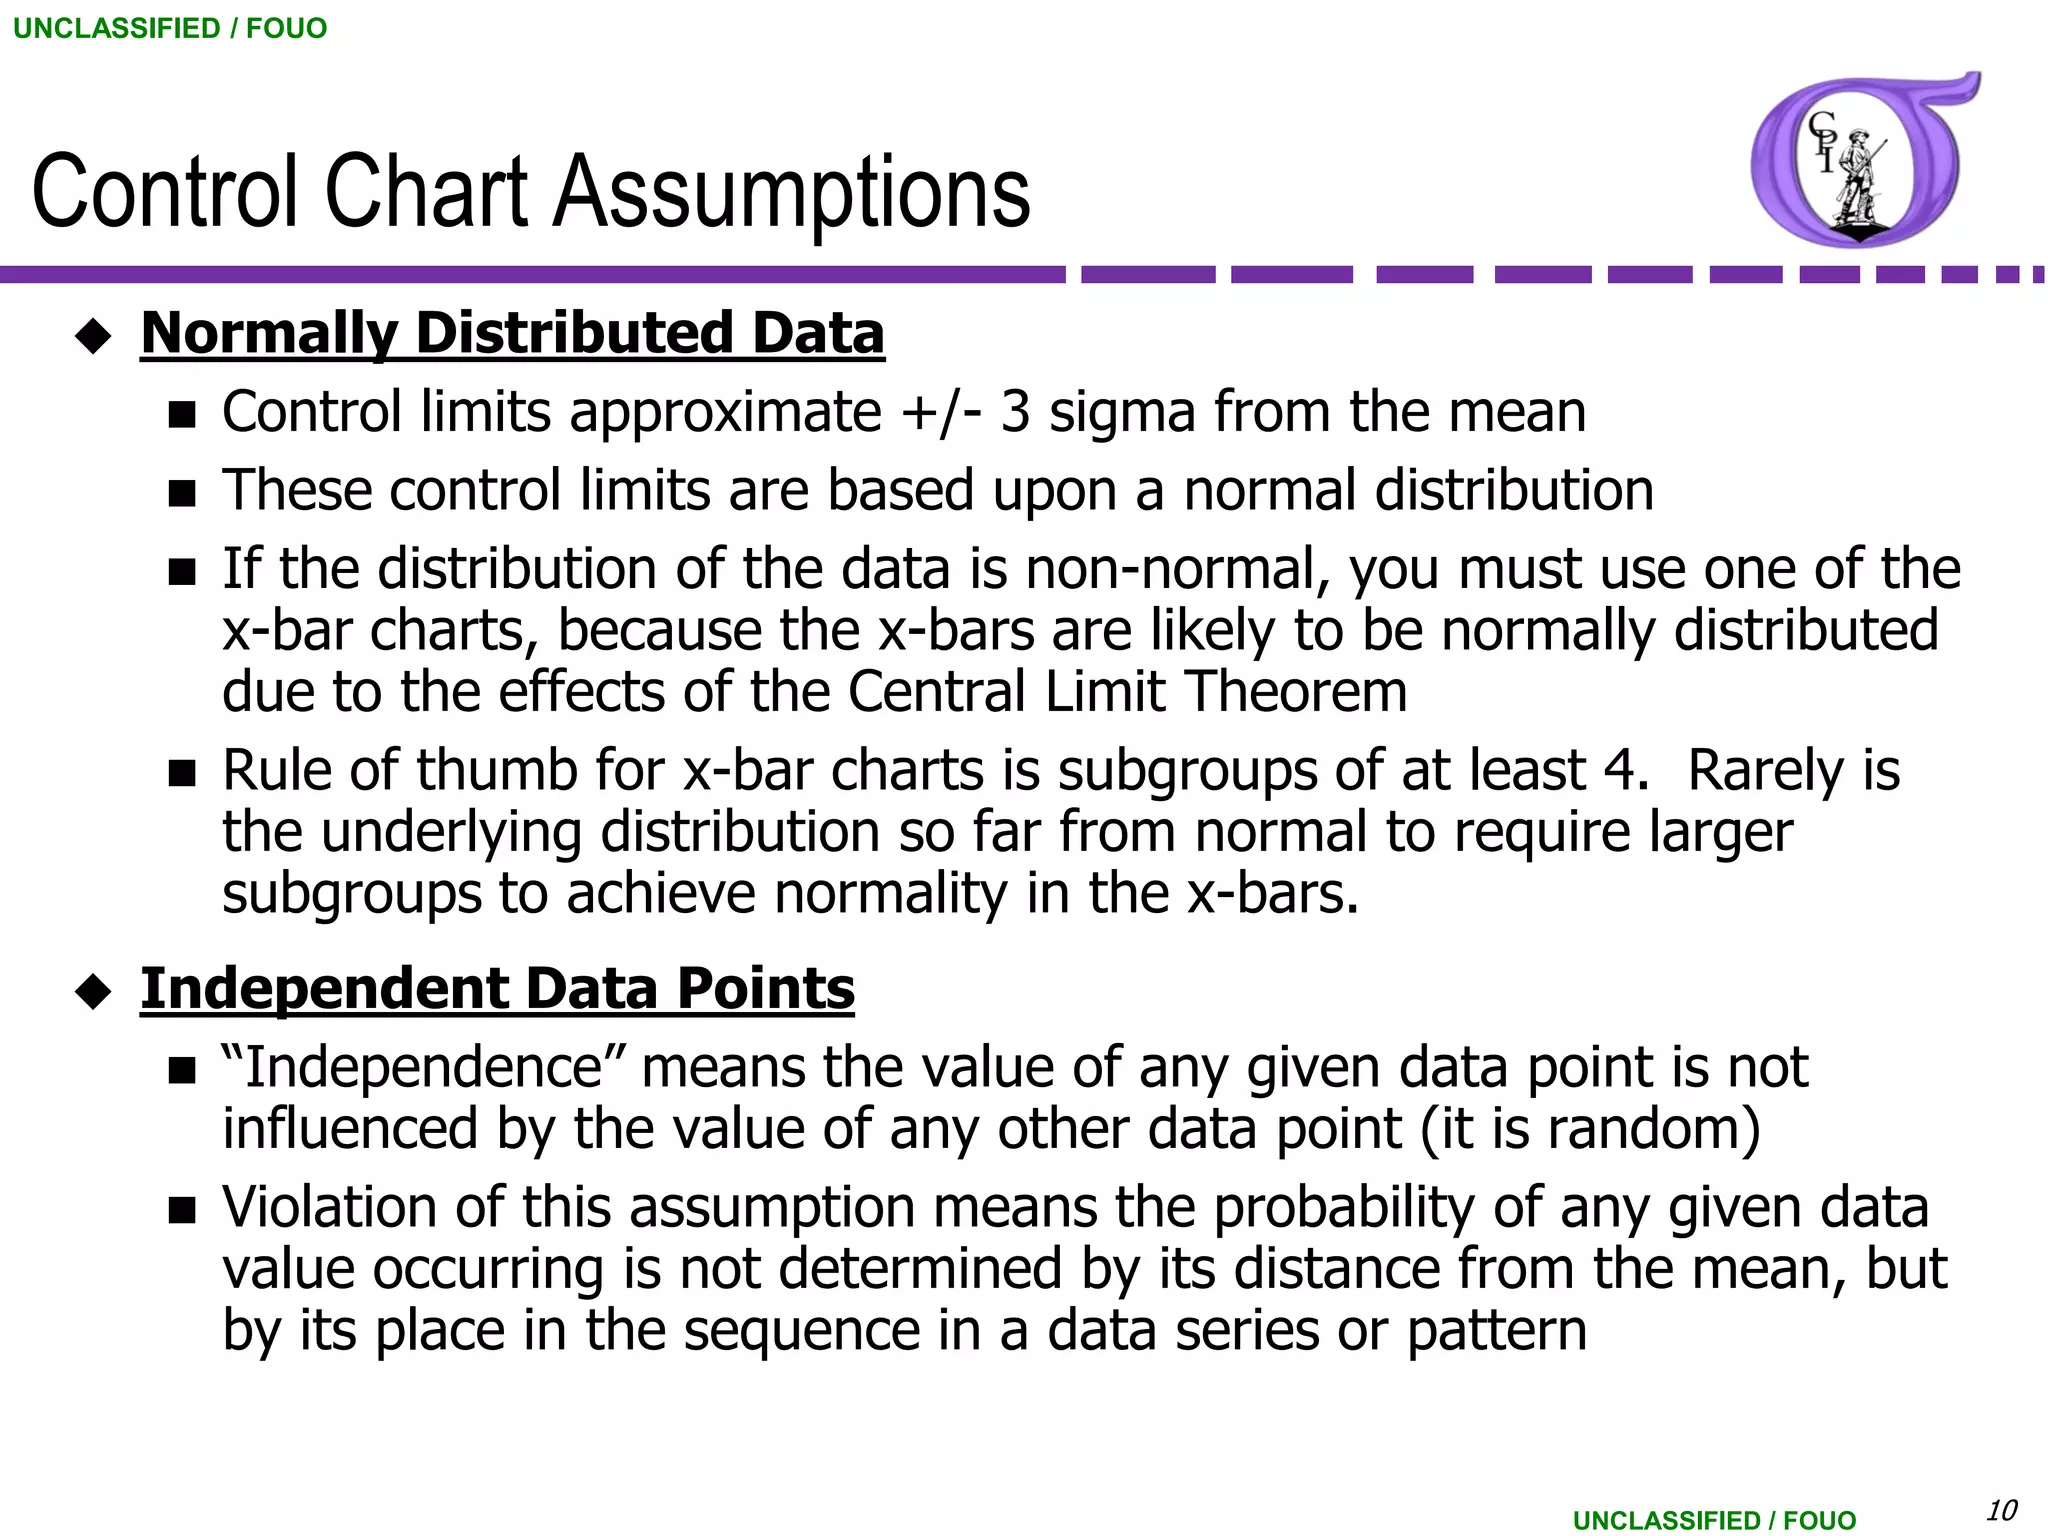


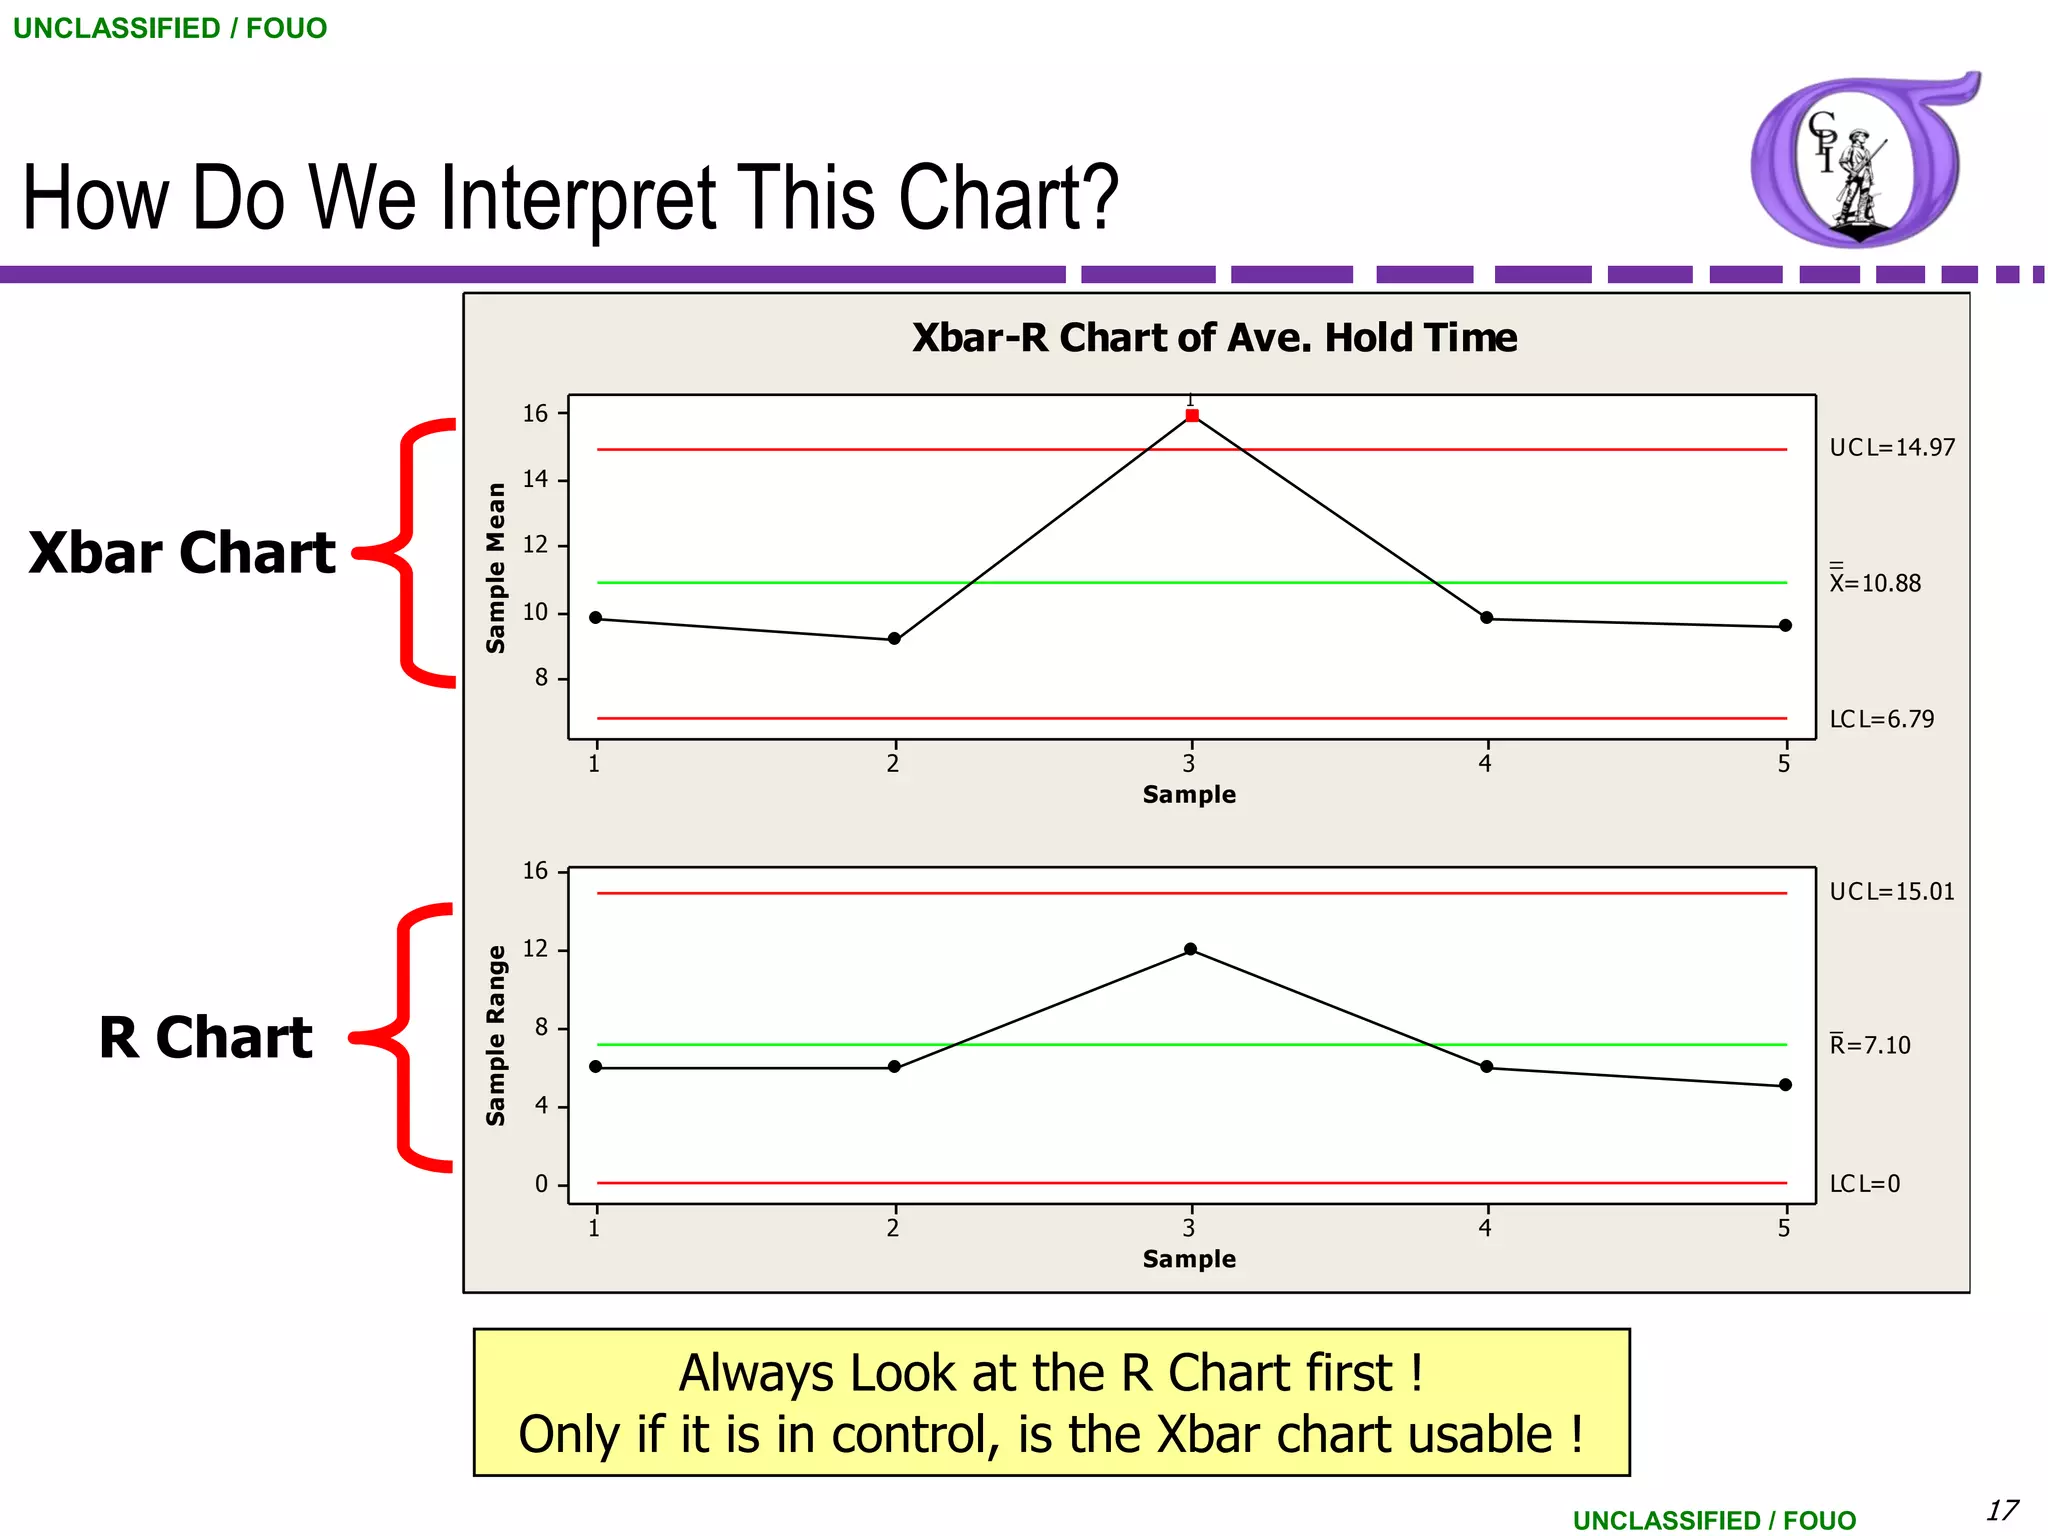


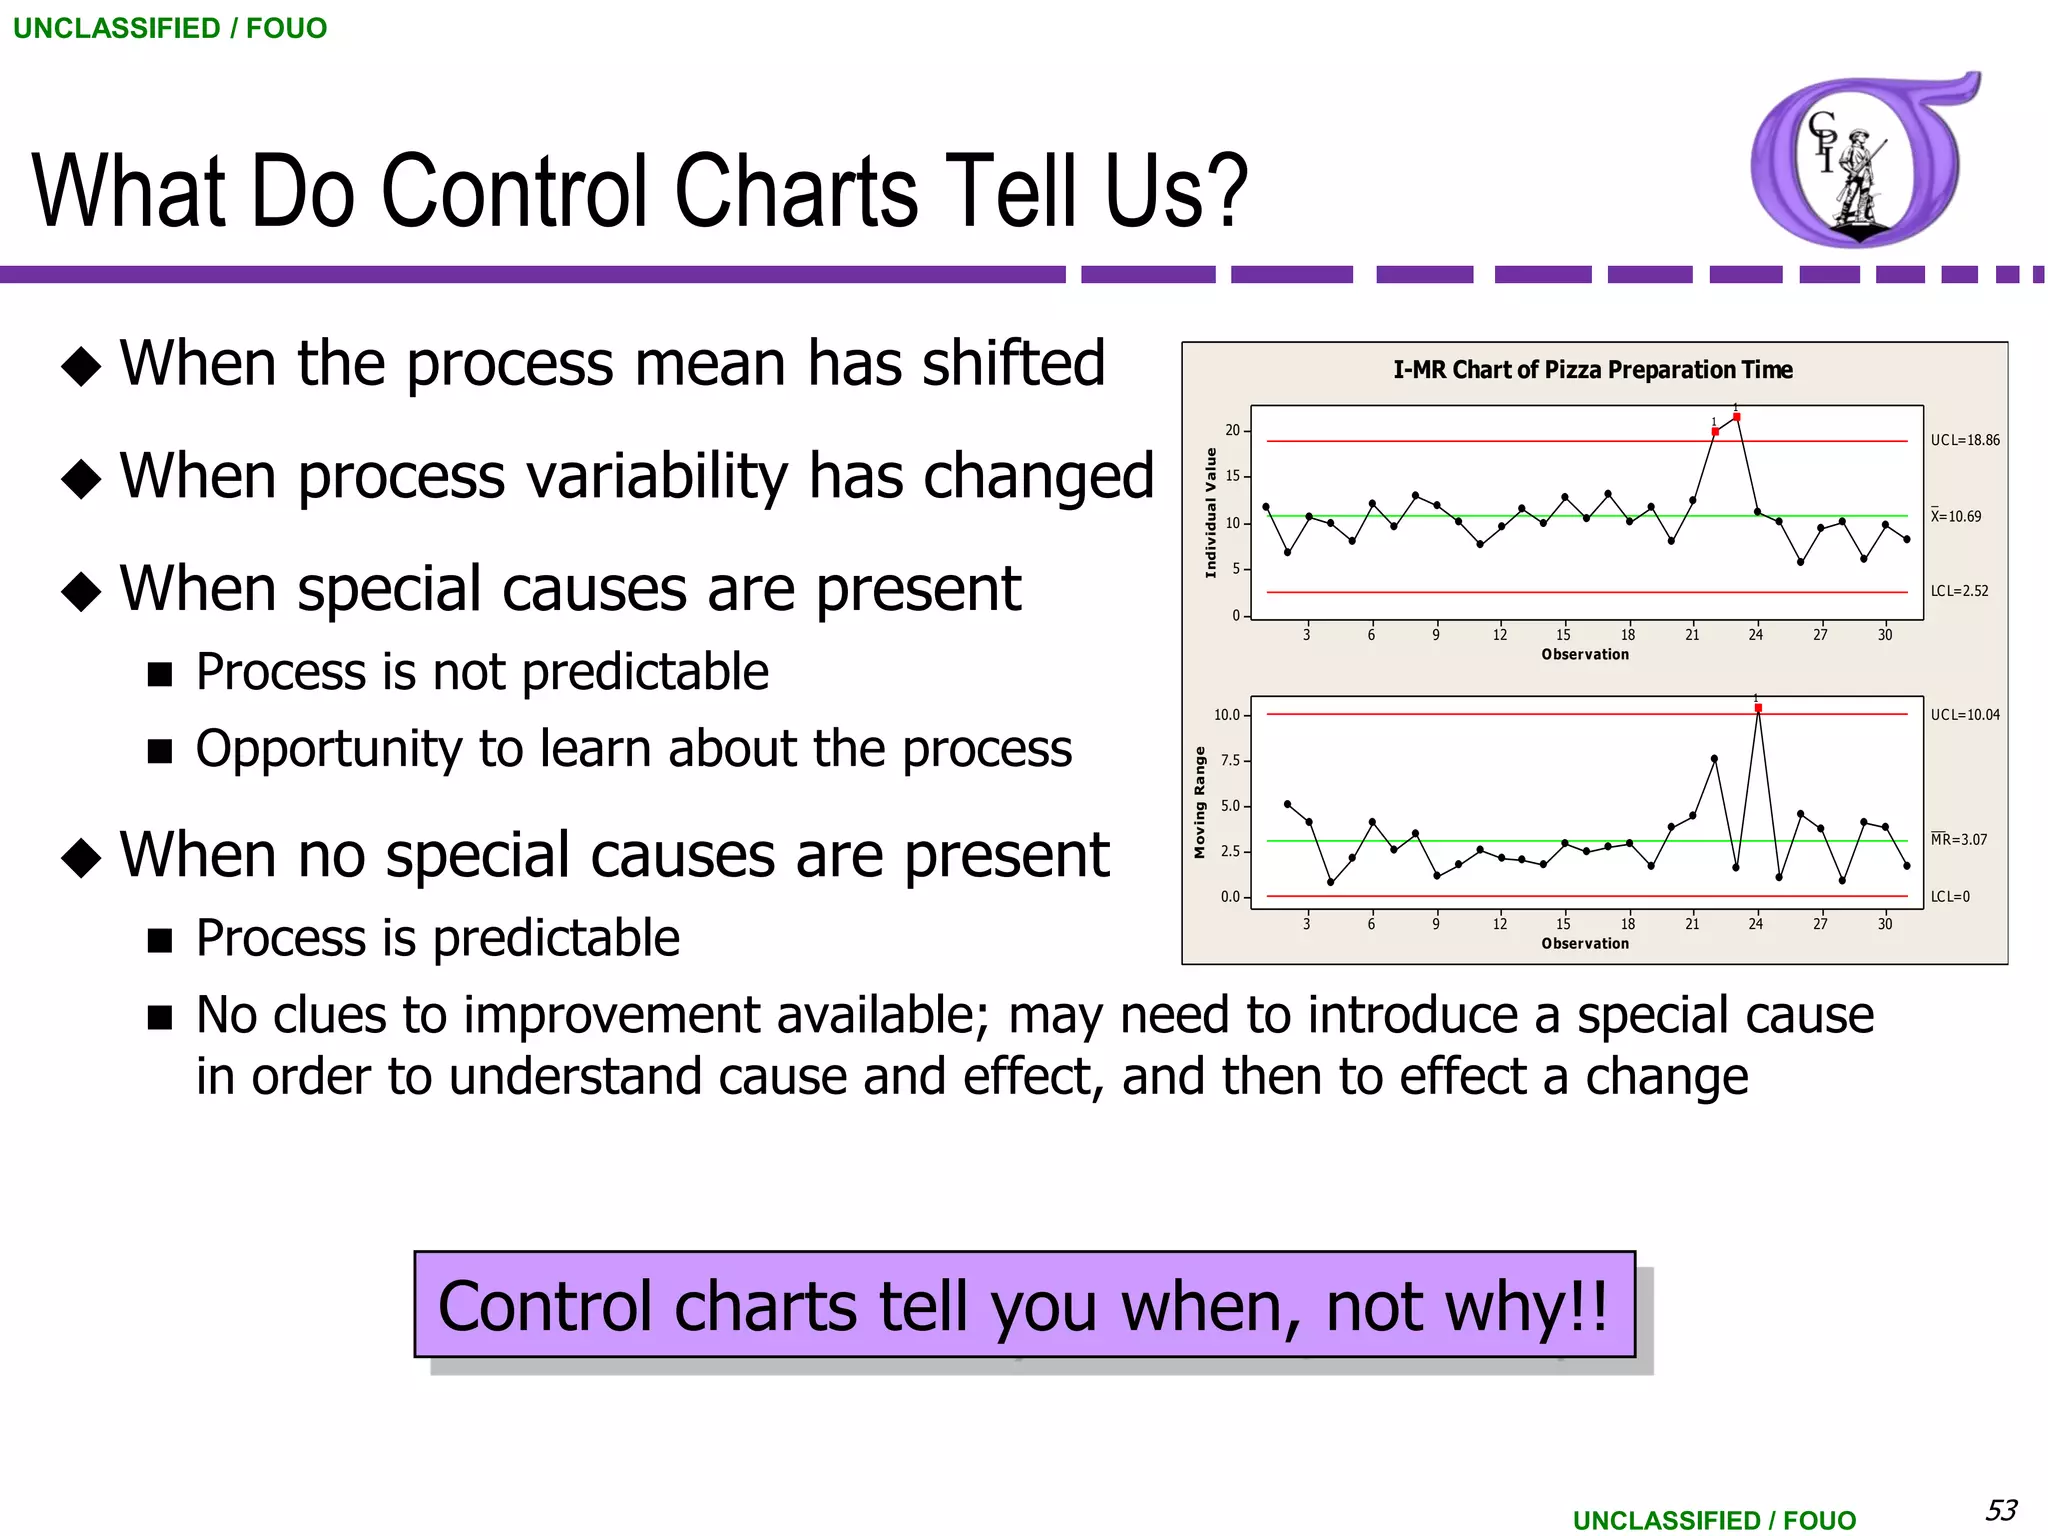


This document provides an overview of control charts for continuous data. It discusses control chart fundamentals like control limits and distinguishing between common and special cause variation. It introduces the X-bar and R chart used for variable data with subgroup sizes of 3-9. An example X-bar and R chart is presented using data on customer hold times. The document also covers the Individuals and Moving Range chart which can be used when the subgroup size is 1. Control chart assumptions and interpretation of control limits are explained.


![NG BB 53 Process Control [Compatibility Mode]](https://cdn.slidesharecdn.com/ss_thumbnails/6906860-thumbnail.jpg?width=640&height=640&fit=bounds)


