This document provides an overview of the I-MR control chart, including how to read it, its requirements, and how to access it in Minitab. The I-MR chart plots individual data points and their moving ranges on separate charts to detect special causes of variation. An example chart is shown to illustrate failures detected by points outside the control limits. Practitioners are prompted to apply the technique to critical metrics and interpret any failures to determine their causes and necessary actions.
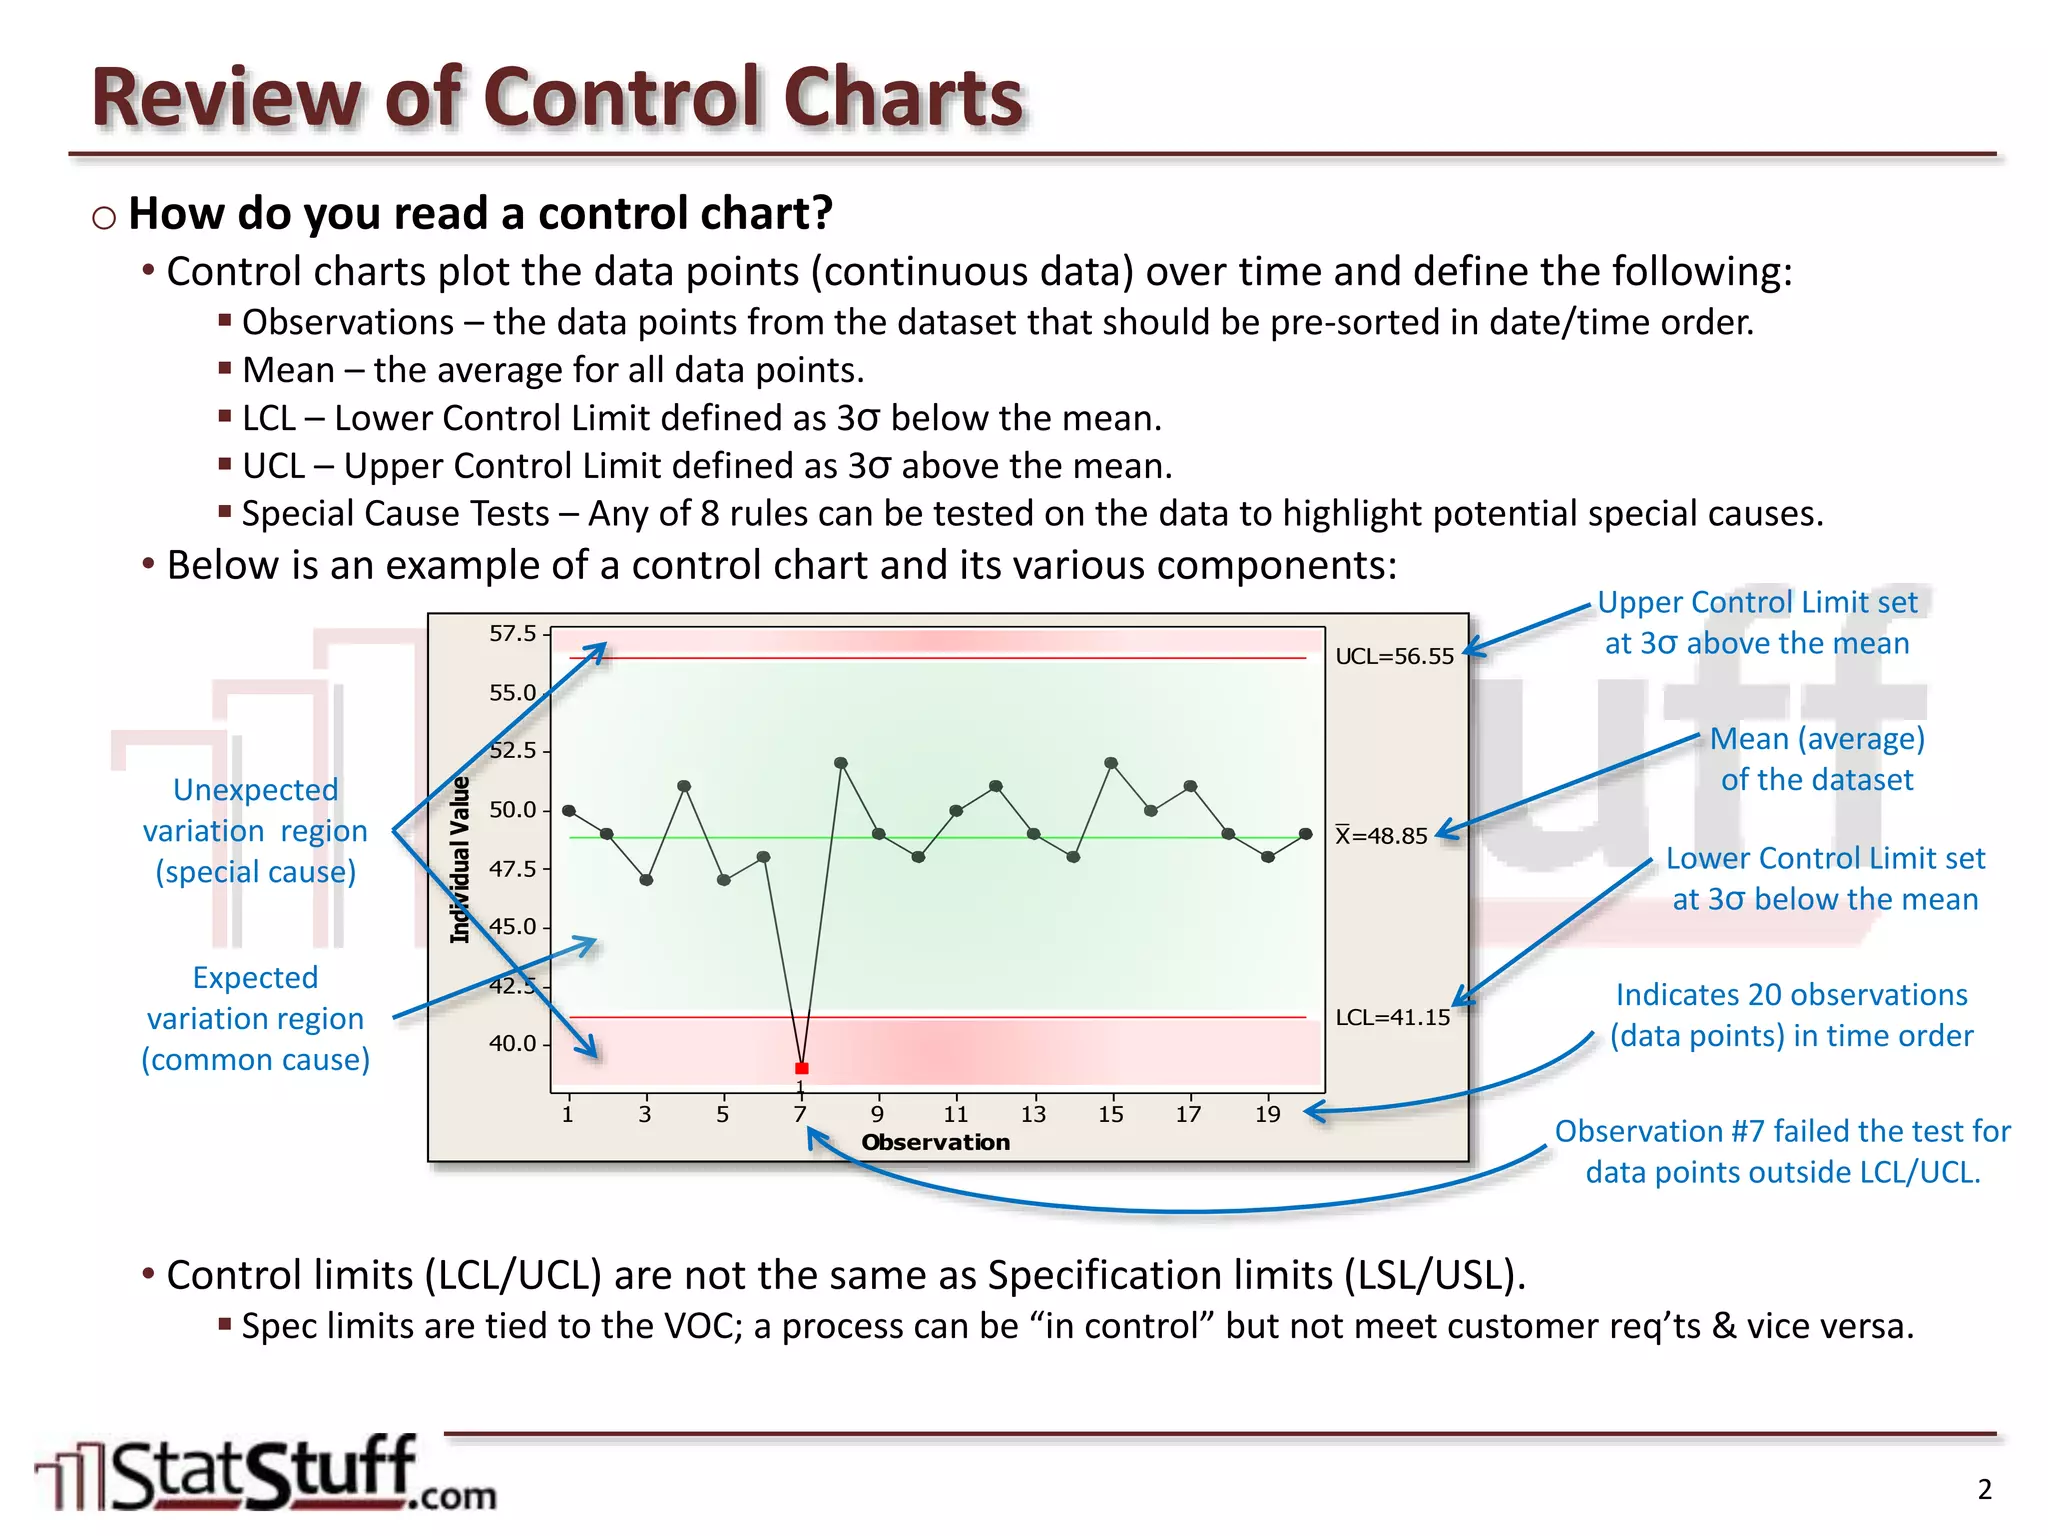
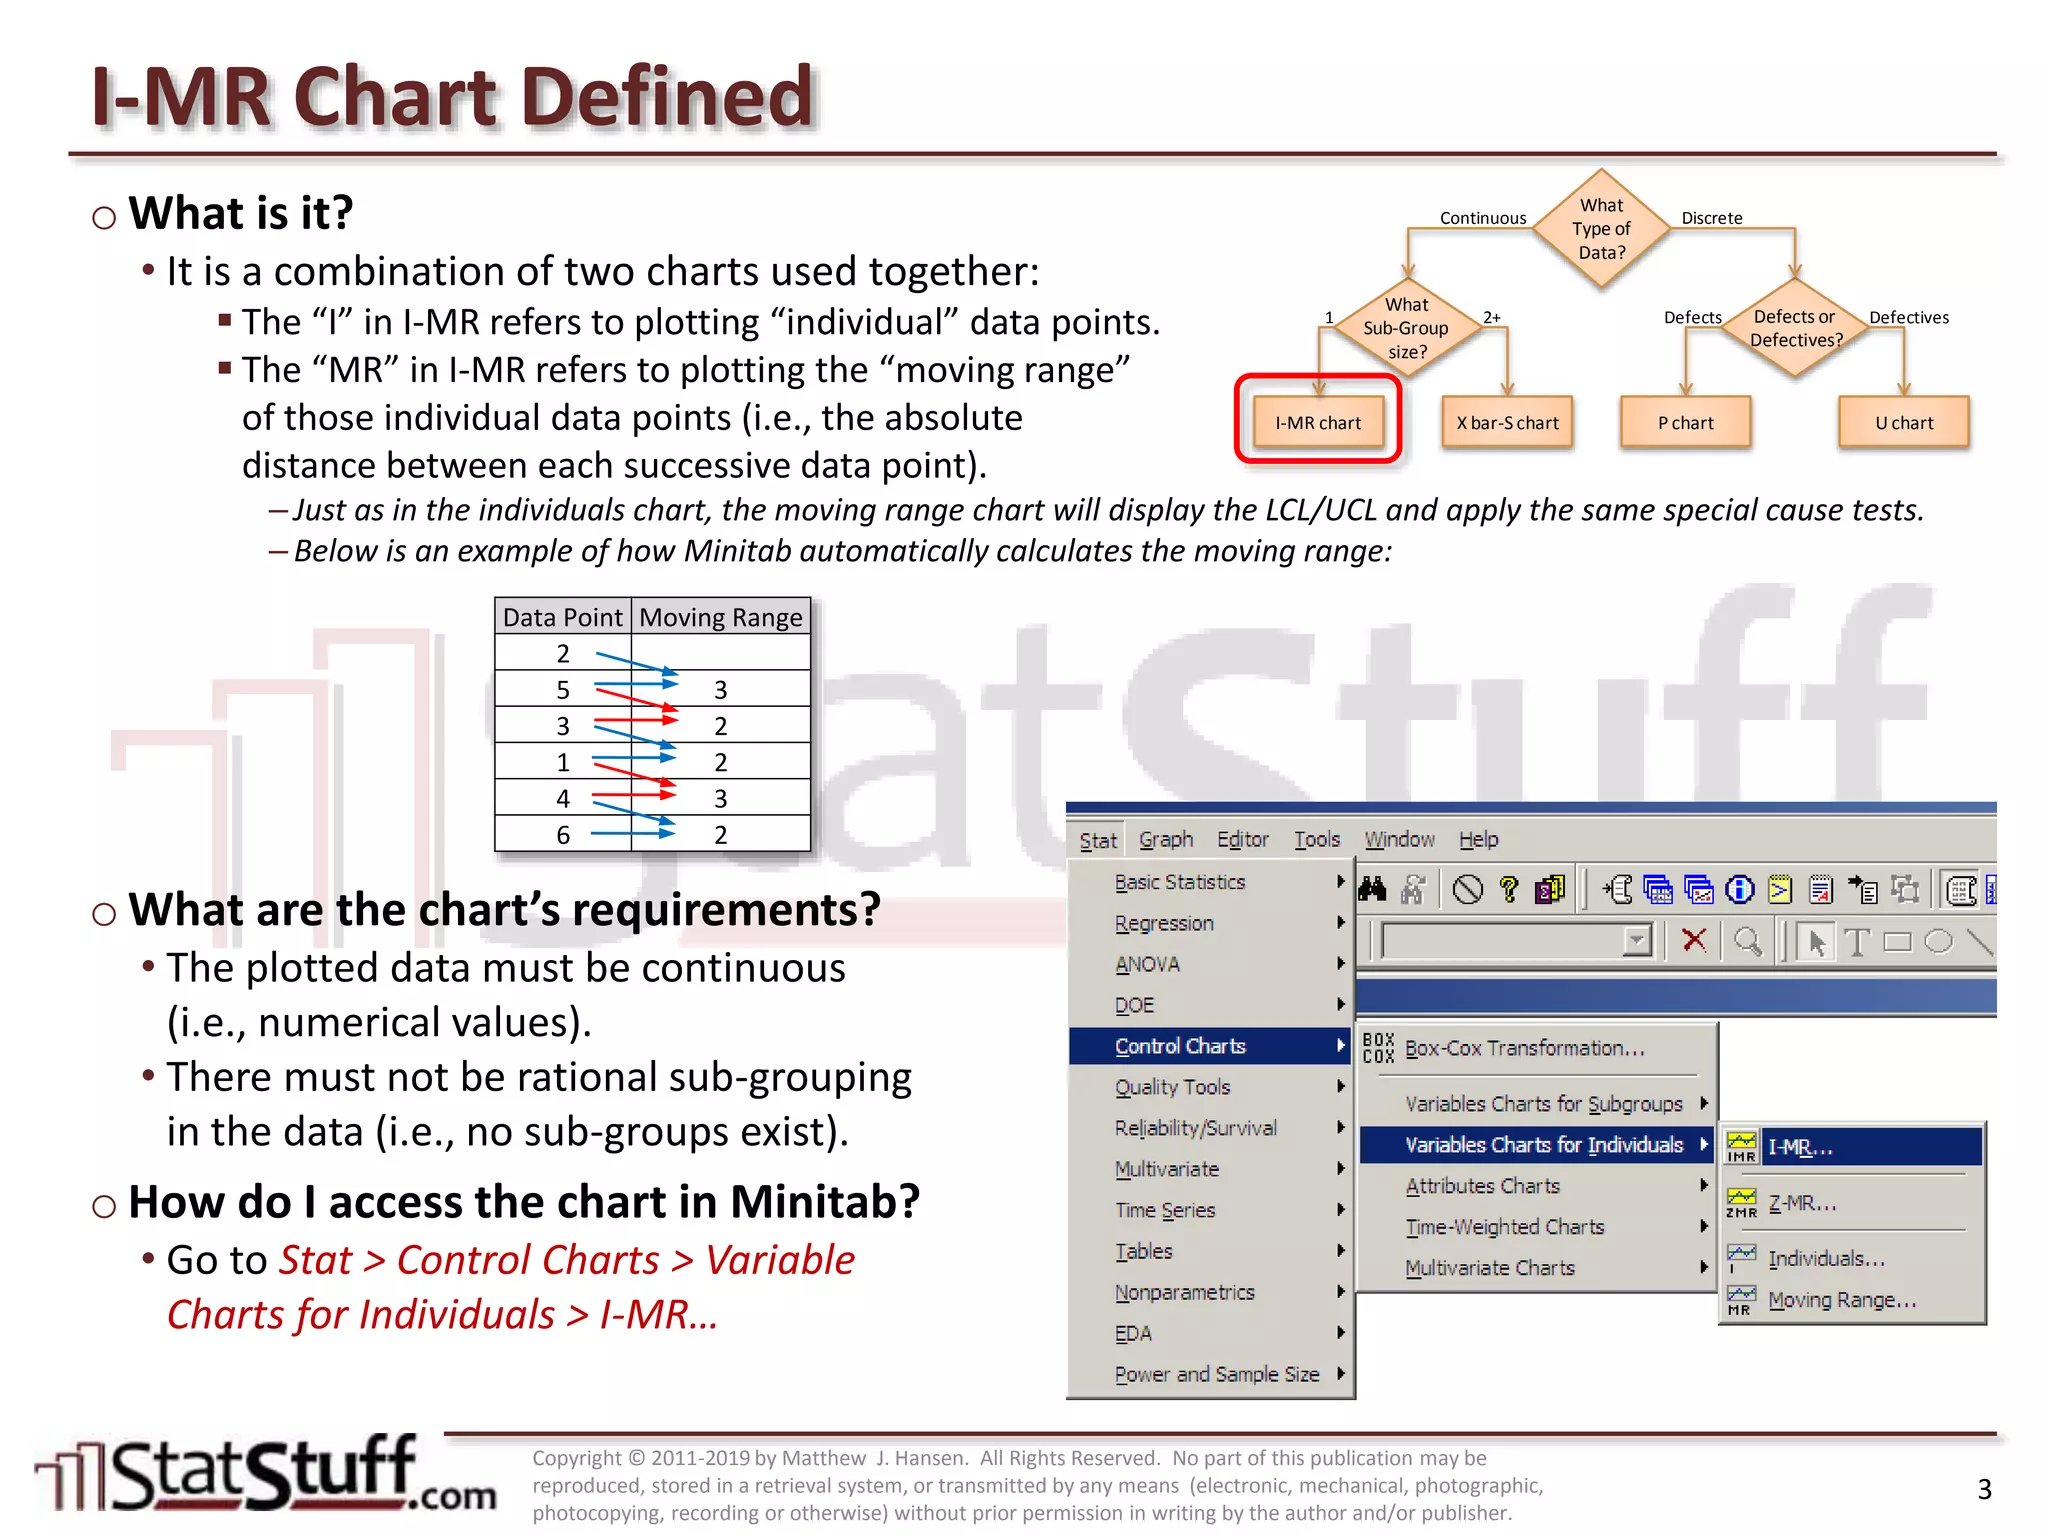
Introduction to I-MR control charts, their components (mean, LCL, UCL), and practical use cases.
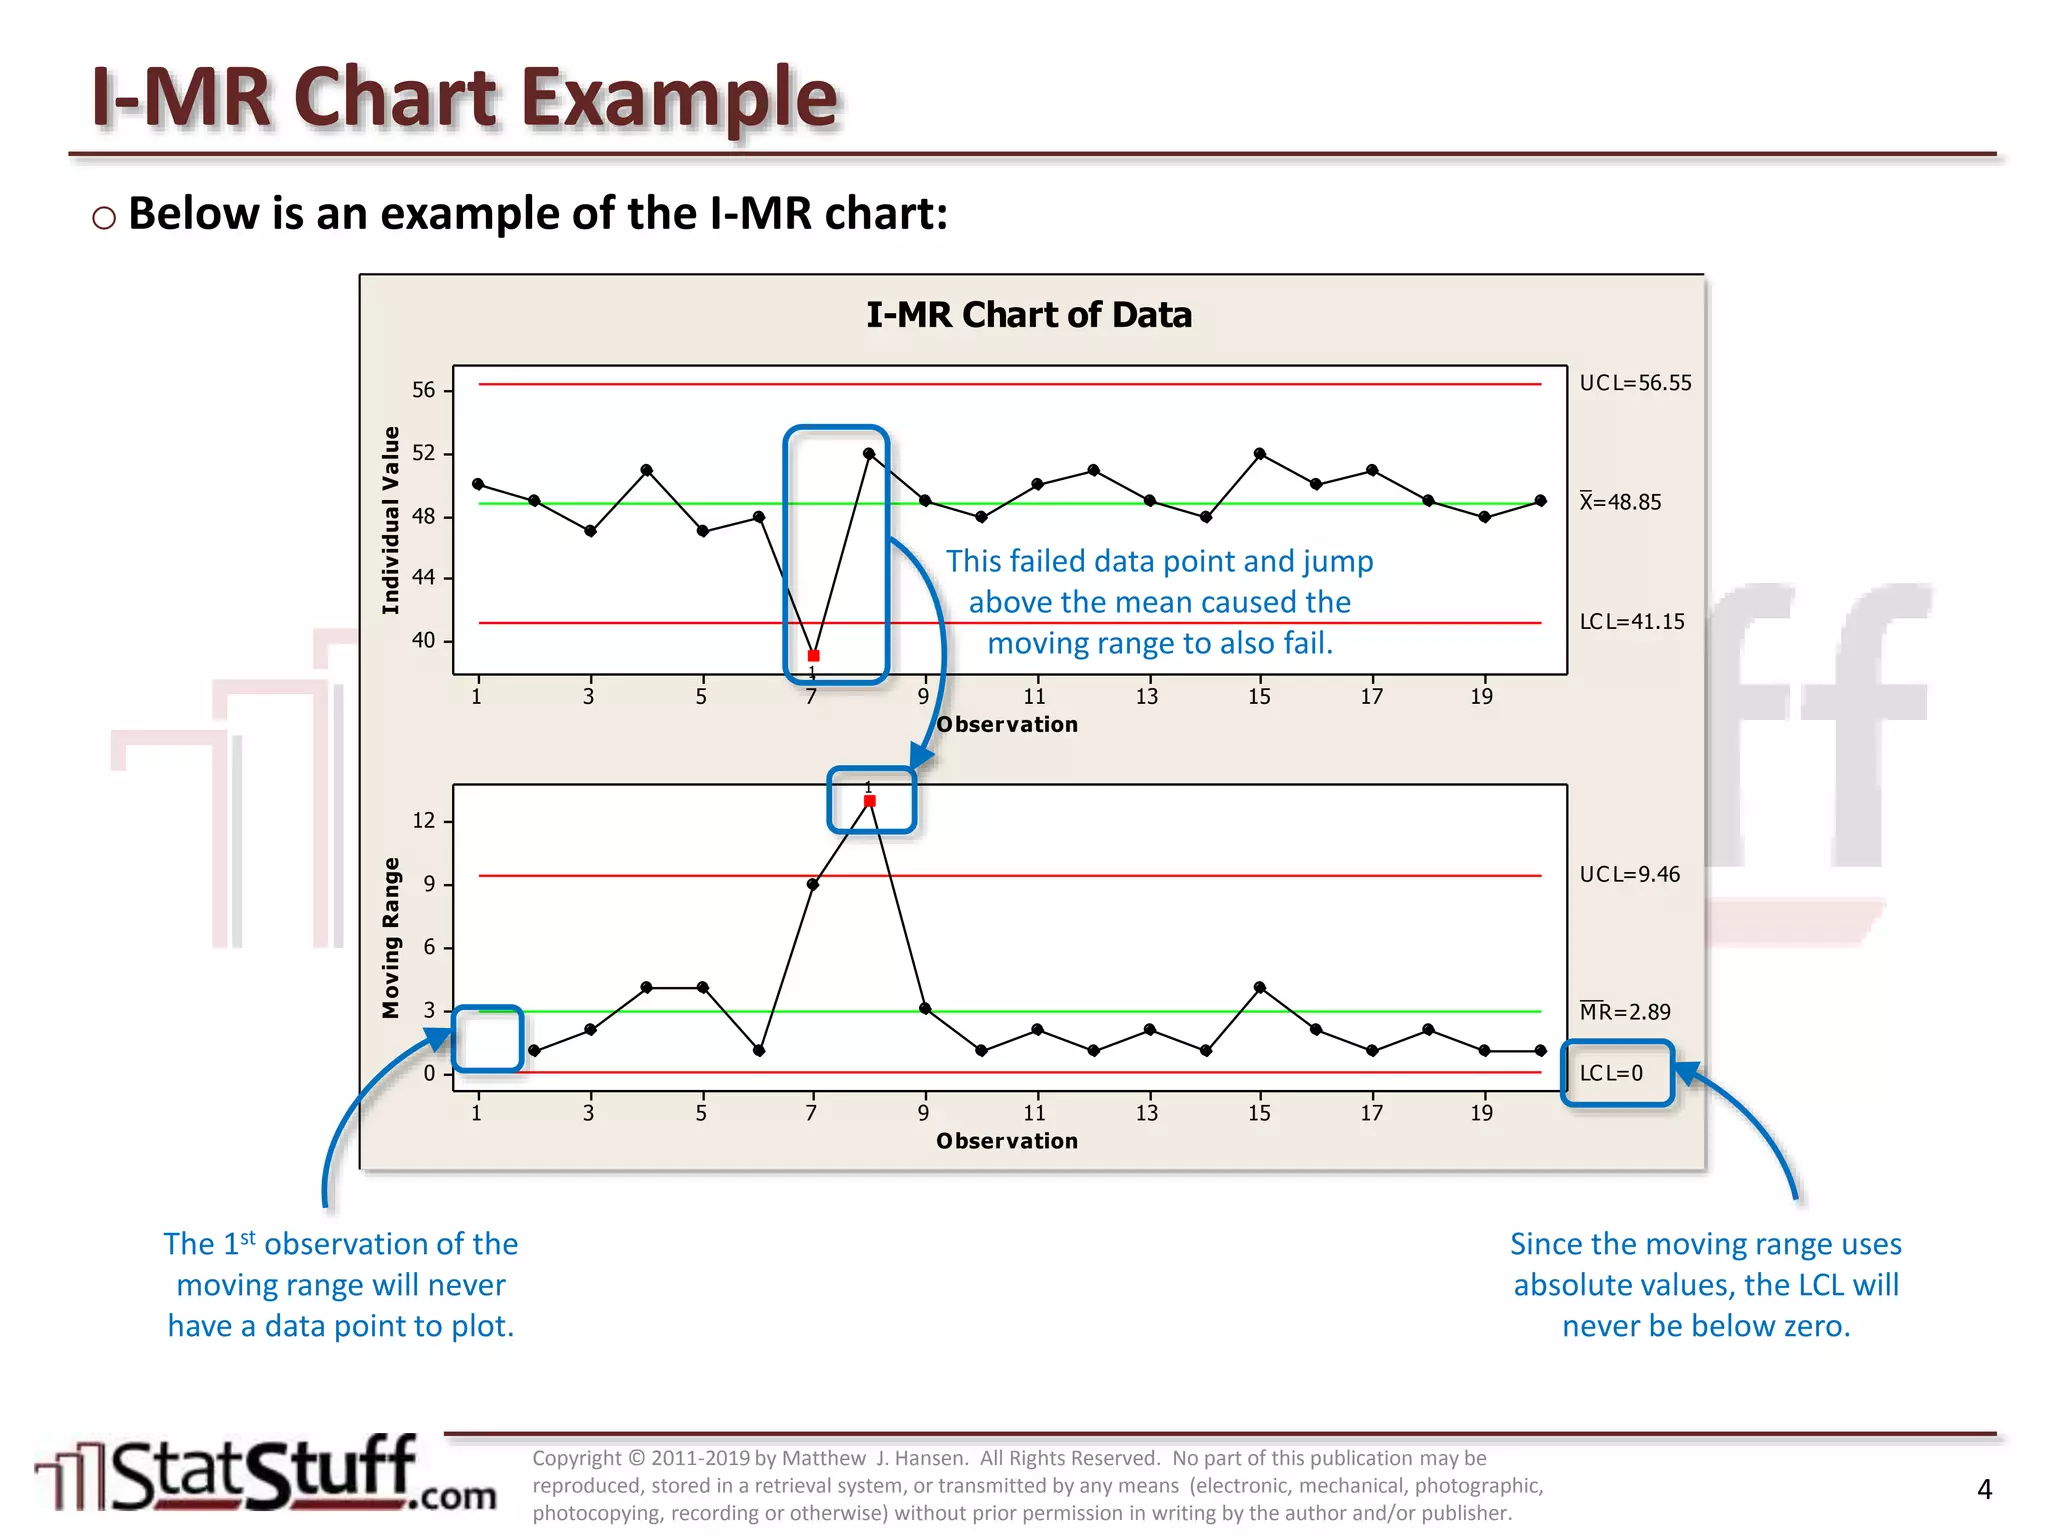
Guidelines for applying I-MR charts using historical data, addressing failures and variations.


![Control Charts[1]](https://cdn.slidesharecdn.com/ss_thumbnails/controlcharts1-1226081330857138-9-thumbnail.jpg?width=640&height=640&fit=bounds)


