Download as PDF, PPTX


1) The document outlines requirements and templates for black belt tollgate briefings for a project control review. 2) It includes templates for defining the project charter, timeline, measuring baseline performance, analyzing causes of issues, and improving the process. 3) A Failure Modes and Effects Analysis template is provided to identify risks and prioritize improvements.


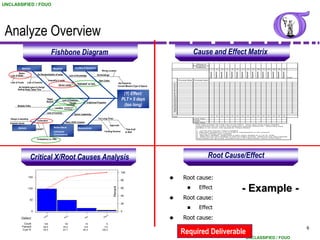
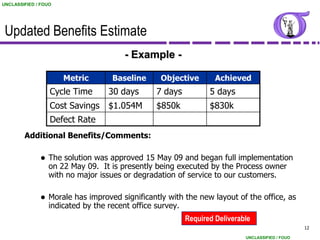
![NG BB 53 Process Control [Compatibility Mode]](https://cdn.slidesharecdn.com/ss_thumbnails/6906860-thumbnail.jpg?width=640&height=640&fit=bounds)


