Download as PDF, PPTX


![UNCLASSIFIED / FOUO
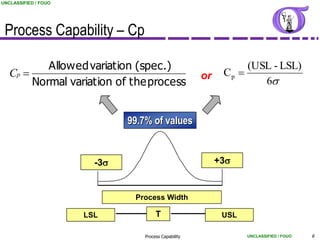
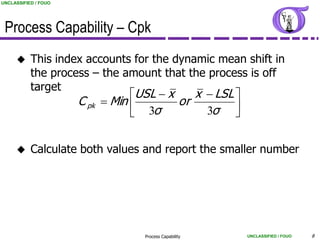
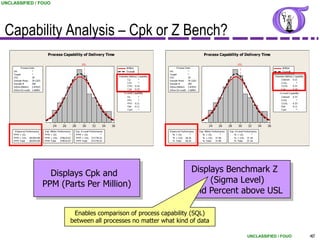
Process Capability – Cpk, CPU, CPL
Most common calculation of Process Capability
Ratio of the range between the sample mean and the
nearest specification to 3 standard deviations.
Use when the mean cannot be easily adjusted (i.e., Cycle
times, customer satisfaction indices, etc.)
Typical goals for Cpk are greater than 1.33 (or 1.67 if
safety related)
For Cpk Std. Deviation estimates use:
Rbar/d2 [short term] (calculated from Xbar-R chart)
Process Capability UNCLASSIFIED / FOUO 9](https://image.slidesharecdn.com/6906811/85/NG-BB-27-Process-Capability-9-320.jpg)
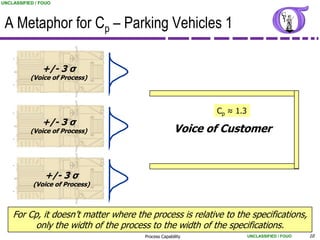

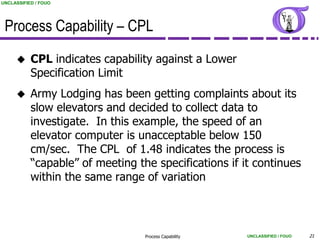


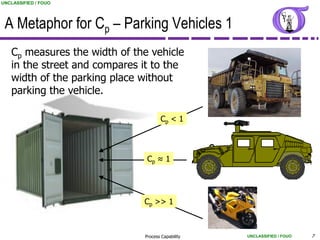
This document provides an overview of process capability analysis. It defines key terms like Cp, Cpk, CPU and CPL. Cp measures the width of the process relative to specifications. Cpk accounts for dynamic shifts in the process mean. The document uses examples and metaphors to illustrate the concepts and provides guidance on interpreting process capability output. It also outlines how to conduct process capability studies in Minitab and how to develop an action plan to improve incapable processes.


![NG BB 53 Process Control [Compatibility Mode]](https://cdn.slidesharecdn.com/ss_thumbnails/6906860-thumbnail.jpg?width=640&height=640&fit=bounds)


