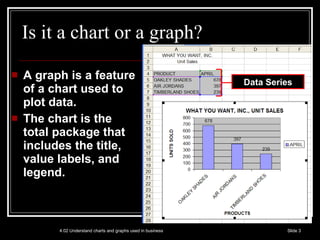
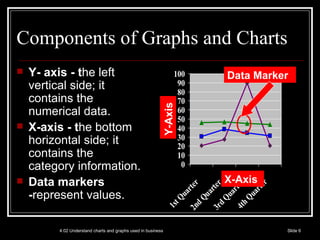
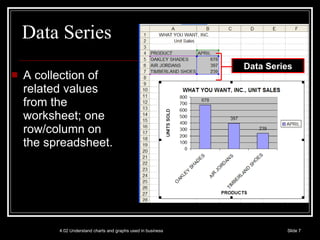
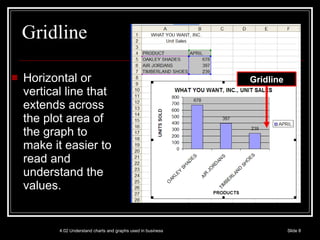
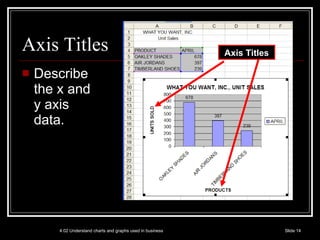
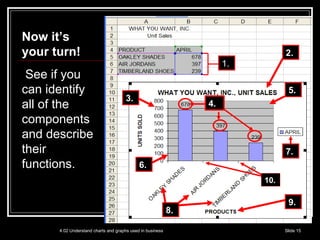
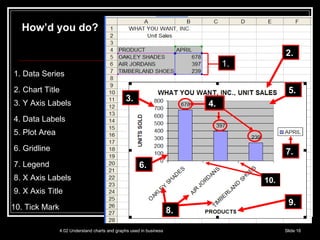
Chart Components 4.02 Understand charts and graphs used in business.
Why do you need to learn about charts? Why might you use a chart to present spreadsheet information? What does a chart do that a spreadsheet does not? 4.02 Understand charts and graphs used in business Slide
Is it a chart or a graph? A graph is a feature of a chart used to plot data. The chart is the total package that includes the title, value labels, and legend.  4.02 Understand charts and graphs used in business Slide  Data Series
Examples of business uses of charts To represent sales trends within the different departments of a store. To represent the contribution of individual employee sales to the total sales for a company. To represent the percent of each expense to total expenses. To explain stock price fluctuations to stock holders. 4.02 Understand charts and graphs used in business Slide
Graph and Chart Parts
4.02 Understand charts and graphs used in business Slide  Components of Graphs and Charts Y- axis - t he left vertical side; it contains the numerical data. X-axis - t he bottom horizontal side; it contains the category information. Data markers - represent values. Y-Axis X-Axis Data Marker
Data Series A collection of related values from the worksheet; one row/column on the spreadsheet. 4.02 Understand charts and graphs used in business Slide  Data Series
Gridline Horizontal or vertical line that extends across the plot area of the graph to make it easier to read and understand the values. 4.02 Understand charts and graphs used in business Slide  Gridline
Plot Area The rectangular area bound by the category and values axes. 4.02 Understand charts and graphs used in business Slide  Plot Area
Tick Mark Used to add clarification to the data categories. 4.02 Understand charts and graphs used in business Slide  Tick Marks
Legend The object that explains the symbols, colors, or patterns used to differentiate the data. 4.02 Understand charts and graphs used in business Slide  Legend
Data Label Single value or piece of data from the data series. 4.02 Understand charts and graphs used in business Slide  Data Labels
Chart Title Describes the purpose and content. 4.02 Understand charts and graphs used in business Slide  Title
Axis Titles Describe the x and y axis data. 4.02 Understand charts and graphs used in business Slide  Axis Titles
4.02 Understand charts and graphs used in business Slide  Now it’s your turn!  See if you can identify all of the components and describe their functions. 7. 4. 1. 6. 5. 8. 3. 2. 9. 10.
4.02 Understand charts and graphs used in business Slide  How’d you do? 1. Data Series 2. Chart Title 3. Y Axis Labels 4. Data Labels 5. Plot Area 6. Gridline 7. Legend 8. X Axis Labels 9. X Axis Title 10. Tick Mark 7. 1. 6. 8. 5. 3. 2. 9. 4. 10.
Embedded vs. Separate An embedded chart is one that appears on the same sheet as the worksheet it represents. A separate chart is one that does not appear on the same sheet as the worksheet it represents. 4.02 Understand charts and graphs used in business Slide
Linked Chart A linked chart is one that will change to reflect changes made to the spreadsheet it represents. 4.02 Understand charts and graphs used in business Slide

Chart Components

  • 1.
    Chart Components 4.02Understand charts and graphs used in business.
  • 2.
    Why do youneed to learn about charts? Why might you use a chart to present spreadsheet information? What does a chart do that a spreadsheet does not? 4.02 Understand charts and graphs used in business Slide
  • 3.
    Is it achart or a graph? A graph is a feature of a chart used to plot data. The chart is the total package that includes the title, value labels, and legend. 4.02 Understand charts and graphs used in business Slide Data Series
  • 4.
    Examples of businessuses of charts To represent sales trends within the different departments of a store. To represent the contribution of individual employee sales to the total sales for a company. To represent the percent of each expense to total expenses. To explain stock price fluctuations to stock holders. 4.02 Understand charts and graphs used in business Slide
  • 5.
  • 6.
    4.02 Understand chartsand graphs used in business Slide Components of Graphs and Charts Y- axis - t he left vertical side; it contains the numerical data. X-axis - t he bottom horizontal side; it contains the category information. Data markers - represent values. Y-Axis X-Axis Data Marker
  • 7.
    Data Series Acollection of related values from the worksheet; one row/column on the spreadsheet. 4.02 Understand charts and graphs used in business Slide Data Series
  • 8.
    Gridline Horizontal orvertical line that extends across the plot area of the graph to make it easier to read and understand the values. 4.02 Understand charts and graphs used in business Slide Gridline
  • 9.
    Plot Area Therectangular area bound by the category and values axes. 4.02 Understand charts and graphs used in business Slide Plot Area
  • 10.
    Tick Mark Usedto add clarification to the data categories. 4.02 Understand charts and graphs used in business Slide Tick Marks
  • 11.
    Legend The objectthat explains the symbols, colors, or patterns used to differentiate the data. 4.02 Understand charts and graphs used in business Slide Legend
  • 12.
    Data Label Singlevalue or piece of data from the data series. 4.02 Understand charts and graphs used in business Slide Data Labels
  • 13.
    Chart Title Describesthe purpose and content. 4.02 Understand charts and graphs used in business Slide Title
  • 14.
    Axis Titles Describethe x and y axis data. 4.02 Understand charts and graphs used in business Slide Axis Titles
  • 15.
    4.02 Understand chartsand graphs used in business Slide Now it’s your turn! See if you can identify all of the components and describe their functions. 7. 4. 1. 6. 5. 8. 3. 2. 9. 10.
  • 16.
    4.02 Understand chartsand graphs used in business Slide How’d you do? 1. Data Series 2. Chart Title 3. Y Axis Labels 4. Data Labels 5. Plot Area 6. Gridline 7. Legend 8. X Axis Labels 9. X Axis Title 10. Tick Mark 7. 1. 6. 8. 5. 3. 2. 9. 4. 10.
  • 17.
    Embedded vs. SeparateAn embedded chart is one that appears on the same sheet as the worksheet it represents. A separate chart is one that does not appear on the same sheet as the worksheet it represents. 4.02 Understand charts and graphs used in business Slide
  • 18.
    Linked Chart Alinked chart is one that will change to reflect changes made to the spreadsheet it represents. 4.02 Understand charts and graphs used in business Slide

Editor's Notes

  • #2 4.02 Chart Components
  • #3 4.02 Chart Components
  • #4 4.02 Chart Components
  • #5 4.02 Chart Components
  • #6 4.02 Chart Components
  • #7 4.02 Chart Components
  • #8 4.02 Chart Components
  • #9 4.02 Chart Components
  • #10 4.02 Chart Components
  • #11 4.02 Chart Components
  • #12 4.02 Chart Components
  • #13 4.02 Chart Components
  • #14 4.02 Chart Components
  • #15 4.02 Chart Components
  • #16 4.02 Chart Components
  • #17 4.02 Chart Components
  • #18 4.02 Chart Components
  • #19 4.02 Chart Components