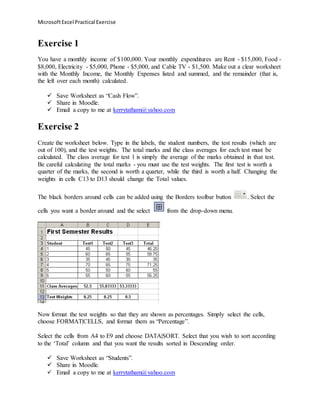
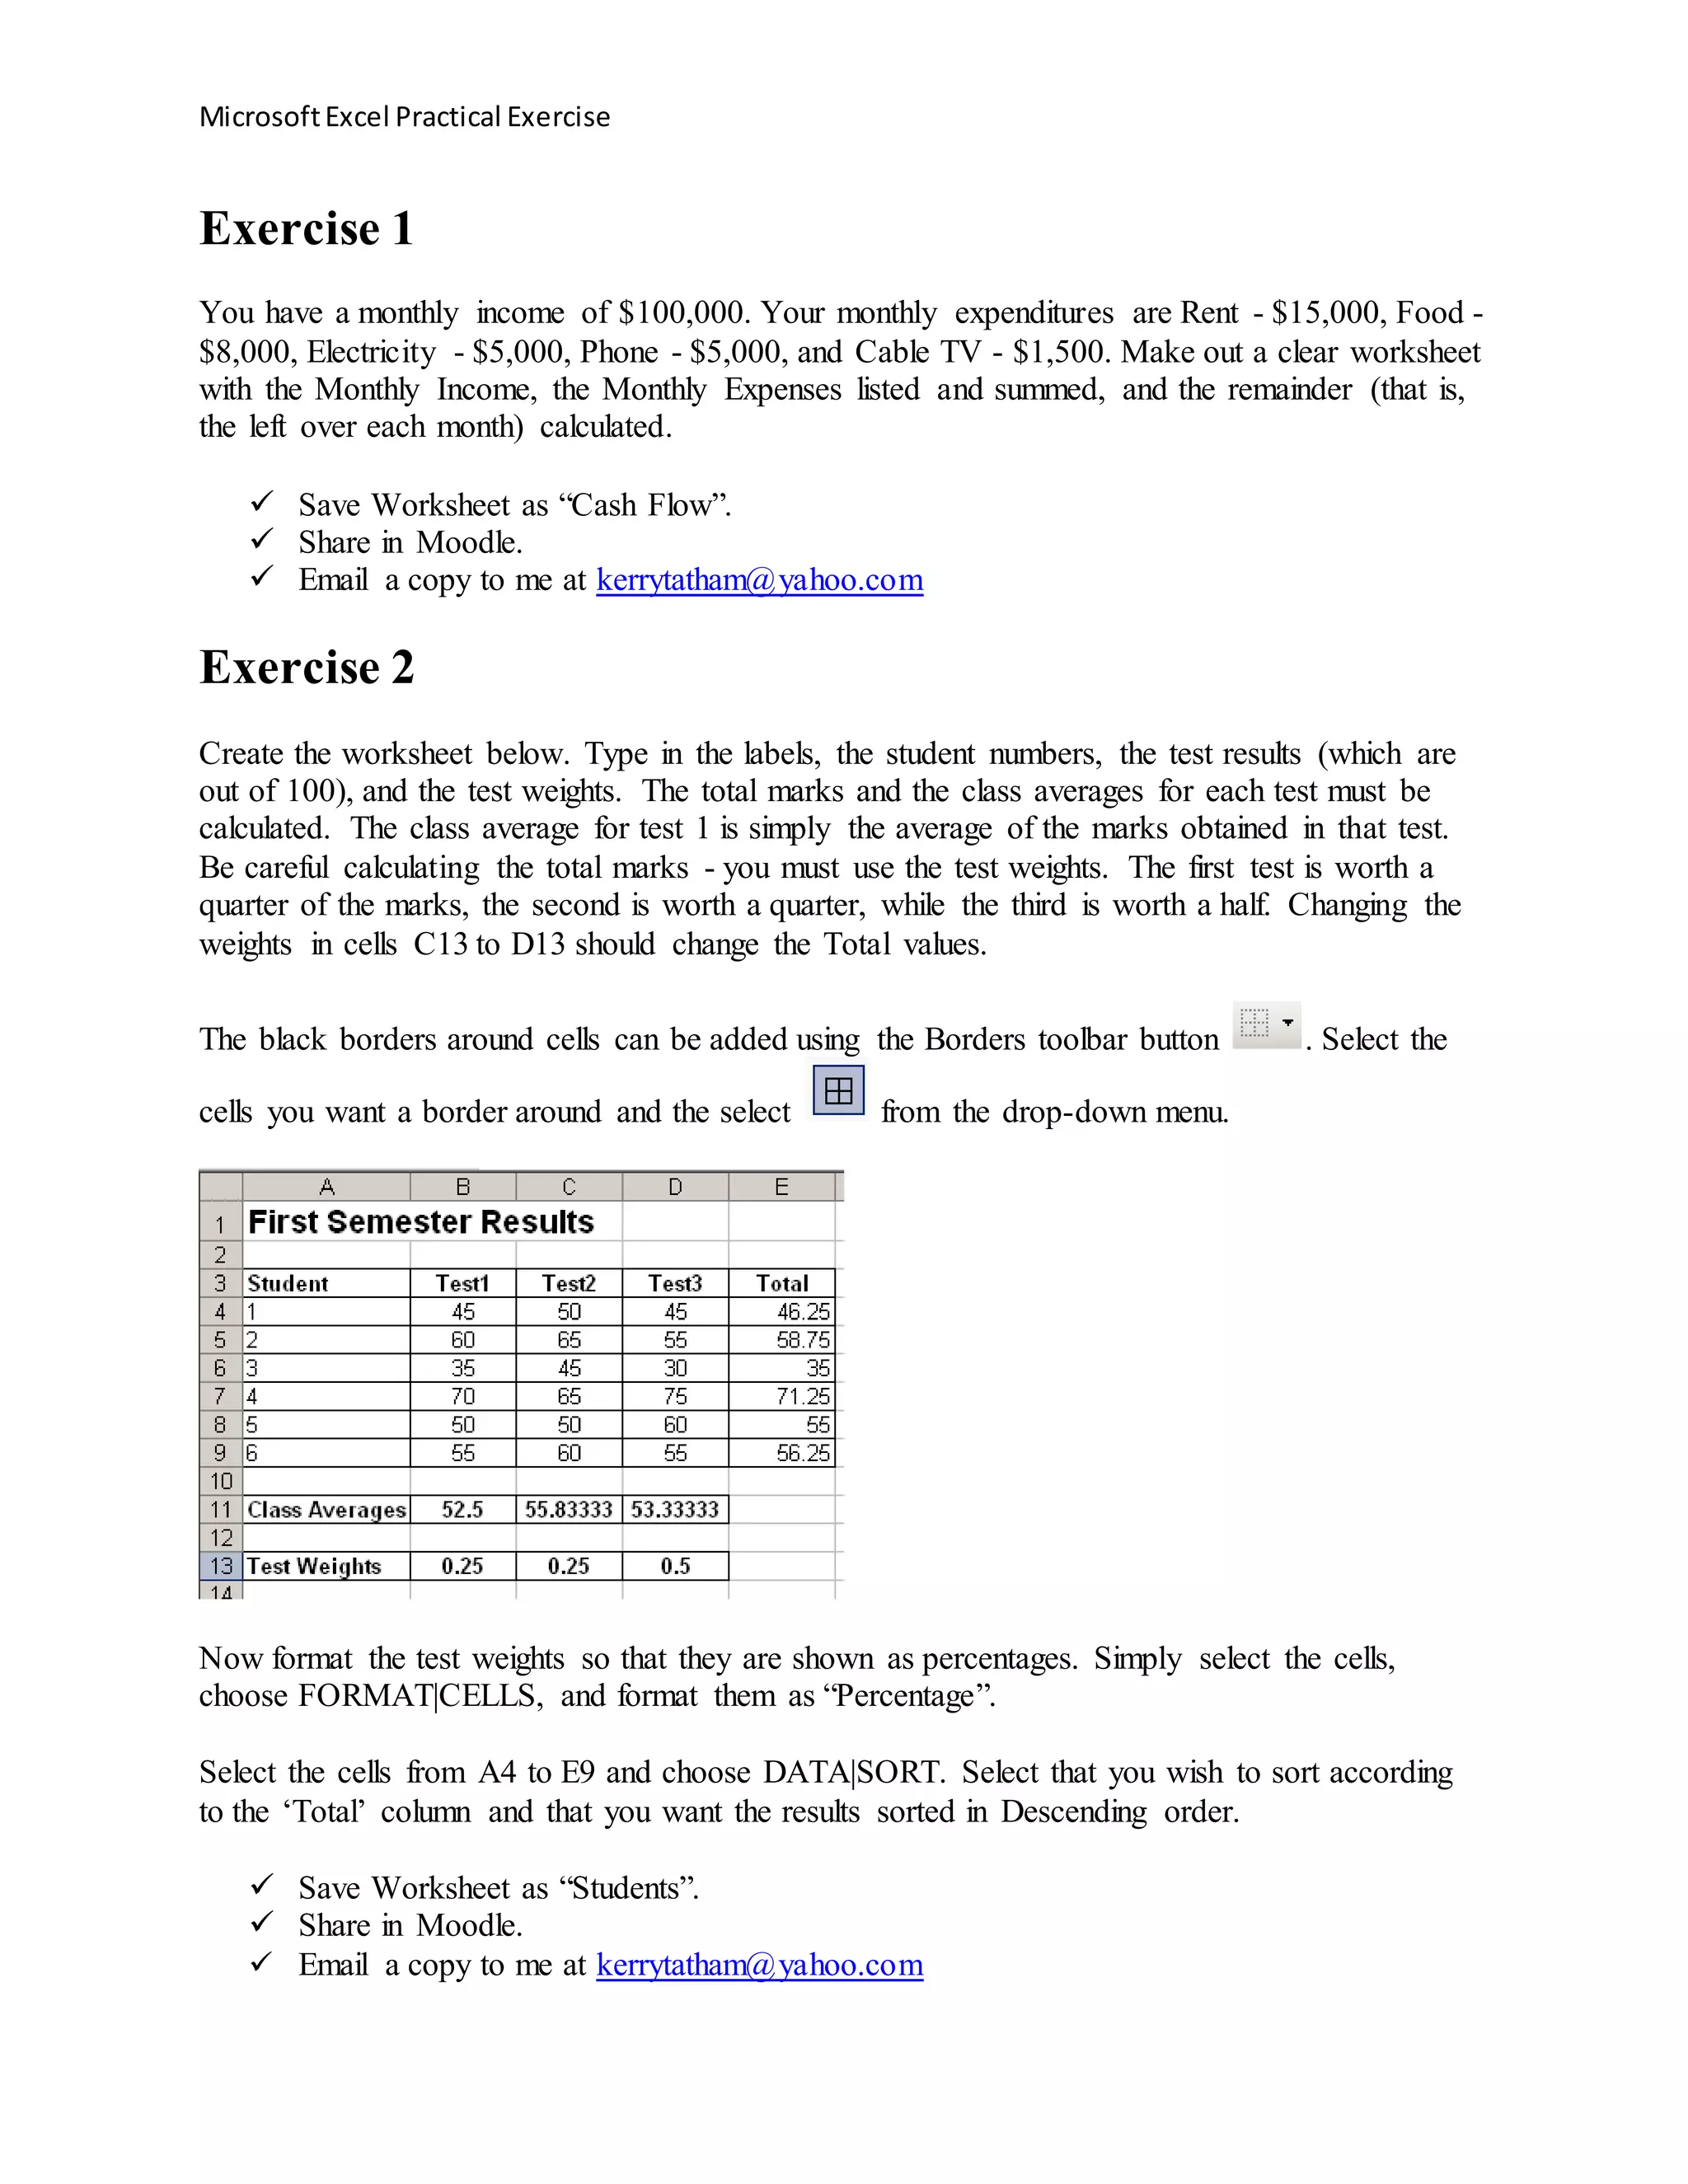
The document provides instructions for two Microsoft Excel exercises. The first asks the user to create a worksheet showing monthly income of $100,000, expenses totaling $34,000, and the remaining amount. The second asks the user to create a worksheet with student data including test scores and weights, calculate totals and averages, format as percentages, and sort by total score. The user is instructed to save, share, and email copies of the worksheets.
Excel – is the world’s most widely used spreadsheet calculating program
It is used in many places like hospitals, hotels, school and companies etc.
A program that allows you to use data to forecast, manage, predict, and present information
Lets Just Go For It! Wish you an Awesome Leaning Experience.
Subscribe to our YouTube channel: https://www.youtube.com/c/TimesRide?sub_confirmation=1
Our Official Website: http://timesride.com
Follow us:
Facebook: https://www.facebook.com/rs.agrawal.9026
Instagram: https://www.instagram.com/timesridenetwork/
Twitter: https://twitter.com/TimesRide
Pinterest: https://in.pinterest.com/ride0472/
Thank You
#AwesomeLearningExperience
#SmartQuickTips&Tricks #LeaningVideos #TimesRide #Keep Learning to Keep Winning!
DataIDSalaryCompa-ratioMidpoint AgePerformance RatingServiceGenderRaiseDegreeGender1GradeDo not manipuilate Data set on this page, copy to another page to make changes154.50.956573485805.70METhe ongoing question that the weekly assignments will focus on is: Are males and females paid the same for equal work (under the Equal Pay Act)? 228.30.913315280703.90MBNote: to simplfy the analysis, we will assume that jobs within each grade comprise equal work.334.11.100313075513.61FB460.91.06857421001605.51METhe column labels in the table mean:549.21.0254836901605.71MDID – Employee sample number Salary – Salary in thousands 674.11.1066736701204.51MFAge – Age in yearsPerformance Rating - Appraisal rating (employee evaluation score)741.41.0344032100815.71FCService – Years of service (rounded)Gender – 0 = male, 1 = female 822.80.992233290915.81FAMidpoint – salary grade midpoint Raise – percent of last raise9731.089674910010041MFGrade – job/pay gradeDegree (0= BS\BA 1 = MS)1023.31.014233080714.71FAGender1 (Male or Female)Compa-ratio - salary divided by midpoint1124.31.05723411001914.81FA1259.71.0475752952204.50ME1341.81.0444030100214.70FC14251.08523329012161FA1522.60.983233280814.91FA1648.51.213404490405.70MC1763.11.1075727553131FE1836.21.1673131801115.60FB1923.91.039233285104.61MA2035.51.1443144701614.80FB2178.91.1786743951306.31MF2257.61.199484865613.81FD2322.20.964233665613.30FA2453.41.112483075913.80FD2523.61.0282341704040MA2622.30.971232295216.20FA2746.21.156403580703.91MC2874.41.111674495914.40FF2975.61.129675295505.40MF3047.50.9894845901804.30MD3122.90.995232960413.91FA3228.10.906312595405.60MB3363.71.117573590905.51ME3426.90.869312680204.91MB3522.70.987232390415.30FA3624.41.059232775314.30FA3723.81.034232295216.20FA3864.61.1335745951104.50ME3937.31.202312790615.50FB4023.71.031232490206.30MA4140.31.008402580504.30MC4224.41.0592332100815.71FA4372.31.0796742952015.50FF4465.91.1565745901605.21ME4549.91.040483695815.21FD4657.41.0075739752003.91ME47560.982573795505.51ME4868.11.1955734901115.31FE4966.21.1615741952106.60ME5061.71.0835738801204.60ME
Week 1Week 1: Descriptive Statistics, including ProbabilityWhile the lectures will examine our equal pay question from the compa-ratio viewpoint, our weekly assignments will focus onexamining the issue using the salary measure.The purpose of this assignmnent is two fold:1. Demonstrate mastery with Excel tools.2. Develop descriptive statistics to help examine the question.3. Interpret descriptive outcomesThe first issue in examining salary data to determine if we - as a company - are paying males and females equally for doing equal work is to develop somedescriptive statistics to give us something to make a preliminary decision on whether we have an issue or not.1Descriptive Statistics: Develop basic descriptive statistics for SalaryThe first step in analyzing data sets is to find some summary descriptive statistics for key variables. Suggestion: Copy the gender1 and salary columns from the Data tab t.
See comments at the right of the data set..docxpotmanandrea
See comments at the right of the data set.
ID
Salary
Compa
Midpoint
Age
Performance Rating
Service
Gender
Raise
Degree
Gender1
Grade
8
23
1.000
23
32
90
9
1
5.8
0
F
A
The ongoing question that the weekly assignments will focus on is:
Are males and females paid the same for equal work (under the Equal Pay Act)?
10
22
0.956
23
30
80
7
1
4.7
0
F
A
Note: to simplfy the analysis, we will assume that jobs within each grade comprise equal work.
11
23
1.000
23
41
100
19
1
4.8
0
F
A
14
24
1.043
23
32
90
12
1
6
0
F
A
The column labels in the
table mean:
15
24
1.043
23
32
80
8
1
4.9
0
F
A
ID – Employee sample number
Salary – Salary in thousands
23
23
1.000
23
36
65
6
1
3.3
1
F
A
Age – Age in years
Performance Rating
– Appraisal rating (Employee evaluation score)
26
24
1.043
23
22
95
2
1
6.2
1
F
A
Service – Years of service (rounded)
Gender:
0 = male, 1 = female
31
24
1.043
23
29
60
4
1
3.9
0
F
A
Midpoint – salary grade midpoint
Raise – percent of last raise
35
24
1.043
23
23
90
4
1
5.3
1
F
A
Grade – job/pay grade
Degree (0= BS\BA 1 = MS)
36
23
1.000
23
27
75
3
1
4.3
1
F
A
Gender1 (Male or Female)
Compa - salary divided by midpoint
37
22
0.956
23
22
95
2
1
6.2
1
F
A
42
24
1.043
23
32
100
8
1
5.7
0
F
A
3
34
1.096
31
30
75
5
1
3.6
0
F
B
18
36
1.161
31
31
80
11
1
5.6
1
F
B
20
34
1.096
31
44
70
16
1
4.8
1
F
B
39
35
1.129
31
27
90
6
1
5.5
1
F
B
7
41
1.025
40
32
100
8
1
5.7
0
F
C
13
42
1.050
40
30
100
2
1
4.7
1
F
C
22
57
1.187
48
48
65
6
1
3.8
0
F
D
24
50
1.041
48
30
75
9
1
3.8
1
F
D
45
55
1.145
48
36
95
8
1
5.2
0
F
D
17
69
1.210
57
27
55
3
1
3
0
F
E
48
65
1.140
57
34
90
11
1
5.3
1
F
E
28
75
1.119
67
44
95
9
1
4.4
1
F
F
43
77
1.149
67
42
95
20
1
5.5
1
F
F
19
24
1.043
23
32
85
1
0
4.6
1
M
A
25
24
1.043
23
41
70
4
0
4
0
M
A
40
25
1.086
23
24
90
2
0
6.3
0
M
A
2
27
0.870
31
52
80
7
0
3.9
0
M
B
32
28
0.903
31
25
95
4
0
5.6
0
M
B
34
28
0.903
31
26
80
2
0
4.9
1
M
B
16
47
1.175
40
44
90
4
0
5.7
0
M
C
27
40
1.000
40
35
80
7
0
3.9
1
M
C
41
43
1.075
40
25
80
5
0
4.3
0
M
C
5
47
0.979
48
36
90
16
0
5.7
1
M
D
30
49
1.020
48
45
90
18
0
4.3
0
M
D
1
58
1.017
57
34
85
8
0
5.7
0
M
E
4
66
1.157
57
42
100
16
0
5.5
1
M
E
12
60
1.052
57
52
95
22
0
4.5
0
M
E
33
64
1.122
57
35
90
9
0
5.5
1
M
E
38
56
0.982
57
45
95
11
0
4.5
0
M
E
44
60
1.052
57
45
90
16
0
5.2
1
M
E
46
65
1.140
57
39
75
20
0
3.9
1
M
E
47
62
1.087
57
37
95
5
0
5.5
1
M
E
49
60
1.052
57
41
95
21
0
6.6
0
M
E
50
66
1.157
57
38
80
12
0
4.6
0
M
E
6
76
1.134
67
36
70
12
0
4.5
1
M
F
9
77
1.149
67
49
100
10
0
4
1
M
F
21
76
1.134
67
43
95
13
0
6.3
1
M
F
29
72
1.074
67
52
95
5
0
5.4
0
M
F
Score:
Week 1.
Measurement and Description - chapters 1 and 2
.
Final Exam Due Friday, Week EightInstructions Each response is.docxmydrynan
Final Exam Due Friday, Week Eight
Instructions: Each response is worth a maximum of 50 points. Number and state the question. Space and then give your response. Each response will be a minimum 175 and maximum 225 words. Utilize the book, at least one resource beyond the course book and your personal examples in each response. This means that beyond the course text you should have a minimum of 4 references for this midterm exam. Create appropriate headings/subheading for each response and then give your detailed answer to the question.
Use Word doc. or docx only. Times New Roman, 12 font and double-space everything. Include a cover page and reference page. Return exam via email attachment NLT. Follow APA 6th ed. formatting requirements.
NO LATE EXAMS WILL BE ACCEPTED!
1. In determining rates of pay, how are the decisions made as to who gets paid $7.00 per hour and who will receive $1 million for a years work?
2. How can team effort result in improved organizational profitability?
3. What is reverse discrimination and how does it influence the design of an executive compensation plan?
4. With benefits consuming approximately 40 percent of the compensation dollar of most organizations, among many managers the “fringe benefit” concept still exists. Develop a detailed outline of the various components of a typically benefits program, indicating their importance and scope. Develop the outline so that it can be used for a presentation. (This response length may vary, so ensure you meet the requirements as stated.)
DataSee comments at the right of the data set.IDSalaryCompaMidpointAgePerformance RatingServiceGenderRaiseDegreeGender1Grade8231.000233290915.80FAThe ongoing question that the weekly assignments will focus on is: Are males and females paid the same for equal work (under the Equal Pay Act)? 10220.956233080714.70FANote: to simplfy the analysis, we will assume that jobs within each grade comprise equal work.11231.00023411001914.80FA14241.04323329012160FAThe column labels in the table mean:15241.043233280814.90FAID – Employee sample number Salary – Salary in thousands 23231.000233665613.31FAAge – Age in yearsPerformance Rating – Appraisal rating (Employee evaluation score)26241.043232295216.21FAService – Years of service (rounded)Gender: 0 = male, 1 = female 31241.043232960413.90FAMidpoint – salary grade midpoint Raise – percent of last raise35241.043232390415.31FAGrade – job/pay gradeDegree (0= BS\BA 1 = MS)36231.000232775314.31FAGender1 (Male or Female)Compa - salary divided by midpoint37220.956232295216.21FA42241.0432332100815.70FA3341.096313075513.60FB18361.1613131801115.61FB20341.0963144701614.81FB39351.129312790615.51FB7411.0254032100815.70FC13421.0504030100214.71FC22571.187484865613.80FD24501.041483075913.81FD45551.145483695815.20FD17691.2105727553130FE48651.1405734901115.31FE28751.119674495914.41FF43771.1496742952015.51FF19241.043233285104.61MA25241.0432341704040MA40251.086232490206.30MA2270.87 ...
Computer Applications Microsoft Excel2016 Graded Project.docxmccormicknadine86
Computer Applications : Microsoft Excel
2016 Graded Project
Lesson 4 Overview
In this lesson, you'll create a spreadsheet that tracks the cost of
elementary school supplies distributed to teachers over a two-month
period in order to illustrate correct usage of Microsoft Excel 2016.
4.1 Design a spreadsheet that tracks the cost of
elementary school supplies distributed to teachers over
a two-month period
Excel 2016
READING ASSIGNMENT
Your project must be submitted as an Excel workbook (.xlsx, .xls). Your
project will be individually graded by your instructor and therefore may take up
to five to seven days to grade. Be sure that each of your files contains the
following information:
Your name
Your student ID number
The exam number
Your email address
Note: If you have more than 10 attachments, you’ll need to collect all of your
files into a compressed folder. To do this, follow these instructions based on
Page 1Copyright Penn Foster, Inc. 2019
Course Version: 1
your operating system:
Windows: Select the files you want to compress, right-click and select
Send to. . . and then Compressed (zipped) folder
Mac: Select the files you want to compress, control-click and select
Compress
To submit your graded project, follow these steps:
Log in to your student portal.
Click on Take Exam next to the lesson you’re working on.
Find the exam number for your project at the top of the Project Upload
page.
Follow the instructions provided to complete your exam.
Be sure to keep a backup copy of any files you submit to the school!
Introduction
This project requires you to develop a spreadsheet that tracks the cost
of elementary school supplies distributed to teachers over a two-
month period. You’ll assume the role of Office Manager, who has
multiple responsibilities, including distributing and maintaining
classroom supplies. For this project, you must prepare an Excel
spreadsheet and chart that will be sent to the school District Manager.
Instructions
Create a Spreadsheet
1. Start Excel and create a new workbook.
2. Enter data as shown in Figure below, sizing columns as
necessary, and then save your file, naming it School Supplies.
Page 2Copyright Penn Foster, Inc. 2019
Course Version: 1
An image of a new excel workbook with data entered and named
School Supplies.
3. Merge and center cells A1 through H1. Format the school name
as Title style.
4. Merge and center cells A2 through H2. Format the label as
Heading 1 style.
5. Bold the labels in row 4 and right align the labels above numeric
values.
6. Format the Cost/Unit values as Currency with 2 decimal places.
Your spreadsheet should look like Figure below.
An image of the School Supplies excel workbook with formatted data.
Page 3Copyright Penn Foster, Inc. 2019
Course Version: 1
7. In column D, enter appropriate formulas to calculate the
September costs for each school supply. Your formulas must use
cell references. Format the calculated values as Currency wit ...
Software Delivery At the Speed of AI: Inflectra Invests In AI-Powered QualityInflectra
In this insightful webinar, Inflectra explores how artificial intelligence (AI) is transforming software development and testing. Discover how AI-powered tools are revolutionizing every stage of the software development lifecycle (SDLC), from design and prototyping to testing, deployment, and monitoring.
Learn about:
• The Future of Testing: How AI is shifting testing towards verification, analysis, and higher-level skills, while reducing repetitive tasks.
• Test Automation: How AI-powered test case generation, optimization, and self-healing tests are making testing more efficient and effective.
• Visual Testing: Explore the emerging capabilities of AI in visual testing and how it's set to revolutionize UI verification.
• Inflectra's AI Solutions: See demonstrations of Inflectra's cutting-edge AI tools like the ChatGPT plugin and Azure Open AI platform, designed to streamline your testing process.
Whether you're a developer, tester, or QA professional, this webinar will give you valuable insights into how AI is shaping the future of software delivery.
Generating a custom Ruby SDK for your web service or Rails API using Smithyg2nightmarescribd
Have you ever wanted a Ruby client API to communicate with your web service? Smithy is a protocol-agnostic language for defining services and SDKs. Smithy Ruby is an implementation of Smithy that generates a Ruby SDK using a Smithy model. In this talk, we will explore Smithy and Smithy Ruby to learn how to generate custom feature-rich SDKs that can communicate with any web service, such as a Rails JSON API.
DevOps and Testing slides at DASA ConnectKari Kakkonen
My and Rik Marselis slides at 30.5.2024 DASA Connect conference. We discuss about what is testing, then what is agile testing and finally what is Testing in DevOps. Finally we had lovely workshop with the participants trying to find out different ways to think about quality and testing in different parts of the DevOps infinity loop.
UiPath Test Automation using UiPath Test Suite series, part 4DianaGray10
Welcome to UiPath Test Automation using UiPath Test Suite series part 4. In this session, we will cover Test Manager overview along with SAP heatmap.
The UiPath Test Manager overview with SAP heatmap webinar offers a concise yet comprehensive exploration of the role of a Test Manager within SAP environments, coupled with the utilization of heatmaps for effective testing strategies.
Participants will gain insights into the responsibilities, challenges, and best practices associated with test management in SAP projects. Additionally, the webinar delves into the significance of heatmaps as a visual aid for identifying testing priorities, areas of risk, and resource allocation within SAP landscapes. Through this session, attendees can expect to enhance their understanding of test management principles while learning practical approaches to optimize testing processes in SAP environments using heatmap visualization techniques
What will you get from this session?
1. Insights into SAP testing best practices
2. Heatmap utilization for testing
3. Optimization of testing processes
4. Demo
Topics covered:
Execution from the test manager
Orchestrator execution result
Defect reporting
SAP heatmap example with demo
Speaker:
Deepak Rai, Automation Practice Lead, Boundaryless Group and UiPath MVP
Transcript: Selling digital books in 2024: Insights from industry leaders - T...BookNet Canada
The publishing industry has been selling digital audiobooks and ebooks for over a decade and has found its groove. What’s changed? What has stayed the same? Where do we go from here? Join a group of leading sales peers from across the industry for a conversation about the lessons learned since the popularization of digital books, best practices, digital book supply chain management, and more.
Link to video recording: https://bnctechforum.ca/sessions/selling-digital-books-in-2024-insights-from-industry-leaders/
Presented by BookNet Canada on May 28, 2024, with support from the Department of Canadian Heritage.
Encryption in Microsoft 365 - ExpertsLive Netherlands 2024Albert Hoitingh
In this session I delve into the encryption technology used in Microsoft 365 and Microsoft Purview. Including the concepts of Customer Key and Double Key Encryption.
Dev Dives: Train smarter, not harder – active learning and UiPath LLMs for do...UiPathCommunity
💥 Speed, accuracy, and scaling – discover the superpowers of GenAI in action with UiPath Document Understanding and Communications Mining™:
See how to accelerate model training and optimize model performance with active learning
Learn about the latest enhancements to out-of-the-box document processing – with little to no training required
Get an exclusive demo of the new family of UiPath LLMs – GenAI models specialized for processing different types of documents and messages
This is a hands-on session specifically designed for automation developers and AI enthusiasts seeking to enhance their knowledge in leveraging the latest intelligent document processing capabilities offered by UiPath.
Speakers:
👨🏫 Andras Palfi, Senior Product Manager, UiPath
👩🏫 Lenka Dulovicova, Product Program Manager, UiPath
Key Trends Shaping the Future of Infrastructure.pdfCheryl Hung
Keynote at DIGIT West Expo, Glasgow on 29 May 2024.
Cheryl Hung, ochery.com
Sr Director, Infrastructure Ecosystem, Arm.
The key trends across hardware, cloud and open-source; exploring how these areas are likely to mature and develop over the short and long-term, and then considering how organisations can position themselves to adapt and thrive.
Slack (or Teams) Automation for Bonterra Impact Management (fka Social Soluti...Jeffrey Haguewood
Sidekick Solutions uses Bonterra Impact Management (fka Social Solutions Apricot) and automation solutions to integrate data for business workflows.
We believe integration and automation are essential to user experience and the promise of efficient work through technology. Automation is the critical ingredient to realizing that full vision. We develop integration products and services for Bonterra Case Management software to support the deployment of automations for a variety of use cases.
This video focuses on the notifications, alerts, and approval requests using Slack for Bonterra Impact Management. The solutions covered in this webinar can also be deployed for Microsoft Teams.
Interested in deploying notification automations for Bonterra Impact Management? Contact us at sales@sidekicksolutionsllc.com to discuss next steps.
The Art of the Pitch: WordPress Relationships and SalesLaura Byrne
Clients don’t know what they don’t know. What web solutions are right for them? How does WordPress come into the picture? How do you make sure you understand scope and timeline? What do you do if sometime changes?
All these questions and more will be explored as we talk about matching clients’ needs with what your agency offers without pulling teeth or pulling your hair out. Practical tips, and strategies for successful relationship building that leads to closing the deal.
Smart TV Buyer Insights Survey 2024 by 91mobiles.pdf91mobiles
91mobiles recently conducted a Smart TV Buyer Insights Survey in which we asked over 3,000 respondents about the TV they own, aspects they look at on a new TV, and their TV buying preferences.
Designing Great Products: The Power of Design and Leadership by Chief Designe...
Excel Exercise
1. MicrosoftExcel Practical Exercise
Exercise 1
You have a monthly income of $100,000. Your monthly expenditures are Rent - $15,000, Food -
$8,000, Electricity - $5,000, Phone - $5,000, and Cable TV - $1,500. Make out a clear worksheet
with the Monthly Income, the Monthly Expenses listed and summed, and the remainder (that is,
the left over each month) calculated.
Save Worksheet as “Cash Flow”.
Share in Moodle.
Email a copy to me at kerrytatham@yahoo.com
Exercise 2
Create the worksheet below. Type in the labels, the student numbers, the test results (which are
out of 100), and the test weights. The total marks and the class averages for each test must be
calculated. The class average for test 1 is simply the average of the marks obtained in that test.
Be careful calculating the total marks - you must use the test weights. The first test is worth a
quarter of the marks, the second is worth a quarter, while the third is worth a half. Changing the
weights in cells C13 to D13 should change the Total values.
The black borders around cells can be added using the Borders toolbar button . Select the
cells you want a border around and the select from the drop-down menu.
Now format the test weights so that they are shown as percentages. Simply select the cells,
choose FORMAT|CELLS, and format them as “Percentage”.
Select the cells from A4 to E9 and choose DATA|SORT. Select that you wish to sort according
to the ‘Total’ column and that you want the results sorted in Descending order.
Save Worksheet as “Students”.
Share in Moodle.
Email a copy to me at kerrytatham@yahoo.com