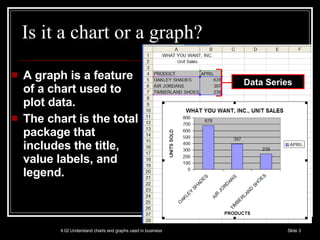
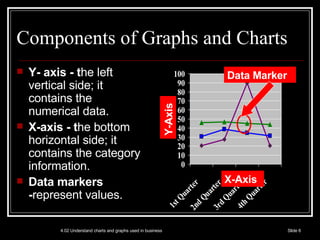
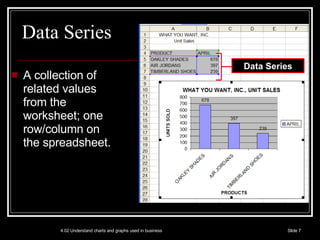
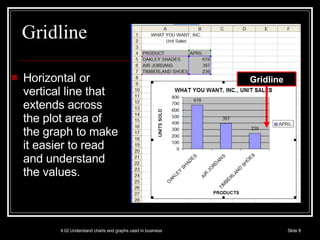
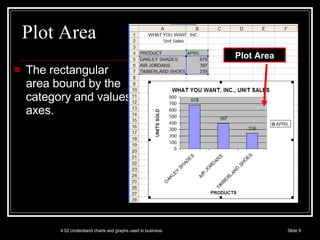
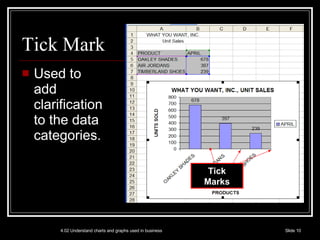
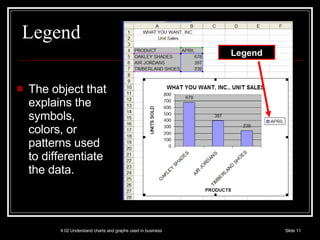
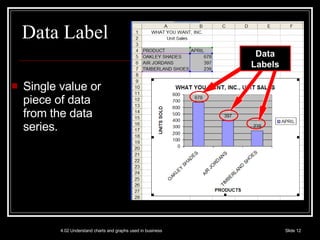
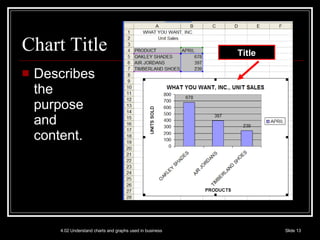
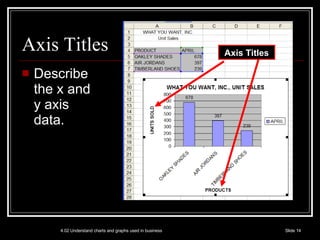
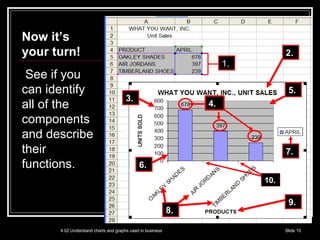
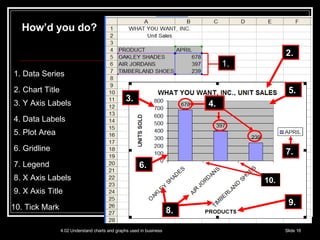
This courseware will introduce you to basics in working with Excel Spreadsheets. It'll serve as a compliment to the in-lab sessions that will be held during the data journalism training session - Voter's Count - in Kumasi
This presentation educates you about Tableau - Data Terminology and Terms & Meaning of Tableau - Data
Terminology are Alias, bin, bookmark, Calculated Field, crosstab, Dashboard, data source page, Data Pane, Dimension, Extract, Filters Shelf, format pane, Level Of Detail (LOD) Expression, Marks, marks card, Pages Shelf, rows shelf, Shelves, Workbook and Worksheet.
For more topics stay tuned with Learnbay.
This presentation shows how to use Microsoft Excel to analyze data. It covers basics, formulas, ranges, formatting, functions, charts, and pivots.
Examples are provided for more than 200 concepts introduced to users of MS Excel to enable them in analyzing and visualizing their data using this powerful and widely available tool.
Examples are also available in an MS Excel spreadsheet.
Please reach out to the author for a copy.
**Tableau Basics Cheat Sheet**
*Introduction:*
Tableau is a powerful data visualization and business intelligence tool that allows users to easily analyze and present data in a visually compelling way. This Tableau Basics Cheat Sheet serves as a quick reference guide to help beginners get started with Tableau and perform common tasks efficiently.
*1. Data Connection:*
- Connect to data sources like Excel, CSV, databases, etc.
- Drag and drop data fields onto the "Rows" and "Columns" shelves to create a basic view.
*2. Visualizations:*
- Create various visualizations like bar charts, line graphs, scatter plots, maps, etc.
- Double-click on a field to create a basic visualization or drag fields onto the "Marks" shelf to customize.
*3. Filters:*
- Apply filters to focus on specific data subsets.
- Right-click on a field or drag it onto the "Filters" shelf to create a filter.
*4. Sorting:*
- Sort data based on specific fields.
- Right-click on a field or use the sort icon in the toolbar to sort data.
*5. Calculated Fields:*
- Create custom calculations using existing fields.
- Go to "Analysis" > "Create Calculated Field" to define formulas.
*6. Groups & Hierarchies:*
- Group data by combining individual data points.
- Create hierarchies to organize data into drill-down levels.
*7. Aggregation:*
- Aggregate data using functions like SUM, AVG, COUNT, etc.
- Drag fields to the "Measure Values" shelf to apply aggregation.
*8. Dual-Axis Charts:*
- Combine two different chart types on the same axes to compare data.
- Right-click on a axis and select "Dual-Axis" to enable this feature.
*9. Dashboard Creation:*
- Combine multiple visualizations into a single dashboard.
- Drag sheets onto the dashboard canvas and arrange as desired.
*10. Parameters:*
- Use parameters to create interactive dashboards.
- Right-click in the data pane and select "Create Parameter" to get started.
*11. Data Blending:*
- Blend data from multiple sources for comprehensive analysis.
- Go to "Data" > "Edit Relationships" to define data blending.
*12. Publishing:*
- Share your Tableau workbooks with others by publishing to Tableau Server or Tableau Public.
- Go to "Server" > "Publish Workbook" to share your insights.
*13. Formatting:*
- Customize the appearance of visualizations and dashboards.
- Use the "Format" options and "Dashboard" menu to fine-tune the design.
*14. Interactivity:*
- Add filters, actions, and tooltips to make visualizations interactive.
- Explore the "Dashboard" menu for interaction options.
*15. Exporting:*
- Export visualizations as images, PDFs, or data files.
- Use the "File" menu to access export options.
Remember, this Tableau Basics Cheat Sheet provides just a glimpse of Tableau's capabilities. As you gain more experience, you can explore advanced features and create more sophisticated data visualizations and insights to drive better decision-making. Happy data analyzing with Tableau!
Key Trends Shaping the Future of Infrastructure.pdfCheryl Hung
Â
Keynote at DIGIT West Expo, Glasgow on 29 May 2024.
Cheryl Hung, ochery.com
Sr Director, Infrastructure Ecosystem, Arm.
The key trends across hardware, cloud and open-source; exploring how these areas are likely to mature and develop over the short and long-term, and then considering how organisations can position themselves to adapt and thrive.
Smart TV Buyer Insights Survey 2024 by 91mobiles.pdf91mobiles
Â
91mobiles recently conducted a Smart TV Buyer Insights Survey in which we asked over 3,000 respondents about the TV they own, aspects they look at on a new TV, and their TV buying preferences.
"Impact of front-end architecture on development cost", Viktor TurskyiFwdays
Â
I have heard many times that architecture is not important for the front-end. Also, many times I have seen how developers implement features on the front-end just following the standard rules for a framework and think that this is enough to successfully launch the project, and then the project fails. How to prevent this and what approach to choose? I have launched dozens of complex projects and during the talk we will analyze which approaches have worked for me and which have not.
Accelerate your Kubernetes clusters with Varnish CachingThijs Feryn
Â
A presentation about the usage and availability of Varnish on Kubernetes. This talk explores the capabilities of Varnish caching and shows how to use the Varnish Helm chart to deploy it to Kubernetes.
This presentation was delivered at K8SUG Singapore. See https://feryn.eu/presentations/accelerate-your-kubernetes-clusters-with-varnish-caching-k8sug-singapore-28-2024 for more details.
Let's dive deeper into the world of ODC! Ricardo Alves (OutSystems) will join us to tell all about the new Data Fabric. After that, Sezen de Bruijn (OutSystems) will get into the details on how to best design a sturdy architecture within ODC.
UiPath Test Automation using UiPath Test Suite series, part 3DianaGray10
Â
Welcome to UiPath Test Automation using UiPath Test Suite series part 3. In this session, we will cover desktop automation along with UI automation.
Topics covered:
UI automation Introduction,
UI automation Sample
Desktop automation flow
Pradeep Chinnala, Senior Consultant Automation Developer @WonderBotz and UiPath MVP
Deepak Rai, Automation Practice Lead, Boundaryless Group and UiPath MVP
DevOps and Testing slides at DASA ConnectKari Kakkonen
Â
My and Rik Marselis slides at 30.5.2024 DASA Connect conference. We discuss about what is testing, then what is agile testing and finally what is Testing in DevOps. Finally we had lovely workshop with the participants trying to find out different ways to think about quality and testing in different parts of the DevOps infinity loop.
Epistemic Interaction - tuning interfaces to provide information for AI supportAlan Dix
Â
Paper presented at SYNERGY workshop at AVI 2024, Genoa, Italy. 3rd June 2024
https://alandix.com/academic/papers/synergy2024-epistemic/
As machine learning integrates deeper into human-computer interactions, the concept of epistemic interaction emerges, aiming to refine these interactions to enhance system adaptability. This approach encourages minor, intentional adjustments in user behaviour to enrich the data available for system learning. This paper introduces epistemic interaction within the context of human-system communication, illustrating how deliberate interaction design can improve system understanding and adaptation. Through concrete examples, we demonstrate the potential of epistemic interaction to significantly advance human-computer interaction by leveraging intuitive human communication strategies to inform system design and functionality, offering a novel pathway for enriching user-system engagements.
Search and Society: Reimagining Information Access for Radical FuturesBhaskar Mitra
Â
The field of Information retrieval (IR) is currently undergoing a transformative shift, at least partly due to the emerging applications of generative AI to information access. In this talk, we will deliberate on the sociotechnical implications of generative AI for information access. We will argue that there is both a critical necessity and an exciting opportunity for the IR community to re-center our research agendas on societal needs while dismantling the artificial separation between the work on fairness, accountability, transparency, and ethics in IR and the rest of IR research. Instead of adopting a reactionary strategy of trying to mitigate potential social harms from emerging technologies, the community should aim to proactively set the research agenda for the kinds of systems we should build inspired by diverse explicitly stated sociotechnical imaginaries. The sociotechnical imaginaries that underpin the design and development of information access technologies needs to be explicitly articulated, and we need to develop theories of change in context of these diverse perspectives. Our guiding future imaginaries must be informed by other academic fields, such as democratic theory and critical theory, and should be co-developed with social science scholars, legal scholars, civil rights and social justice activists, and artists, among others.
LF Energy Webinar: Electrical Grid Modelling and Simulation Through PowSyBl -...DanBrown980551
Â
Do you want to learn how to model and simulate an electrical network from scratch in under an hour?
Then welcome to this PowSyBl workshop, hosted by Rte, the French Transmission System Operator (TSO)!
During the webinar, you will discover the PowSyBl ecosystem as well as handle and study an electrical network through an interactive Python notebook.
PowSyBl is an open source project hosted by LF Energy, which offers a comprehensive set of features for electrical grid modelling and simulation. Among other advanced features, PowSyBl provides:
- A fully editable and extendable library for grid component modelling;
- Visualization tools to display your network;
- Grid simulation tools, such as power flows, security analyses (with or without remedial actions) and sensitivity analyses;
The framework is mostly written in Java, with a Python binding so that Python developers can access PowSyBl functionalities as well.
What you will learn during the webinar:
- For beginners: discover PowSyBl's functionalities through a quick general presentation and the notebook, without needing any expert coding skills;
- For advanced developers: master the skills to efficiently apply PowSyBl functionalities to your real-world scenarios.
Kubernetes & AI - Beauty and the Beast !?! @KCD Istanbul 2024Tobias Schneck
Â
As AI technology is pushing into IT I was wondering myself, as an “infrastructure container kubernetes guy”, how get this fancy AI technology get managed from an infrastructure operational view? Is it possible to apply our lovely cloud native principals as well? What benefit’s both technologies could bring to each other?
Let me take this questions and provide you a short journey through existing deployment models and use cases for AI software. On practical examples, we discuss what cloud/on-premise strategy we may need for applying it to our own infrastructure to get it to work from an enterprise perspective. I want to give an overview about infrastructure requirements and technologies, what could be beneficial or limiting your AI use cases in an enterprise environment. An interactive Demo will give you some insides, what approaches I got already working for real.
15. Now it’s your turn! See if you can identify all of the components and describe their functions. 7. 4. 1. 6. 5. 8. 3. 2. 9. 10.
16. How’d you do? 1. Data Series 2. Chart Title 3. Y Axis Labels 4. Data Labels 5. Plot Area 6. Gridline 7. Legend 8. X Axis Labels 9. X Axis Title 10. Tick Mark 7. 1. 6. 8. 5. 3. 2. 9. 4. 10.