Downloaded 288 times
![Structure chart 1
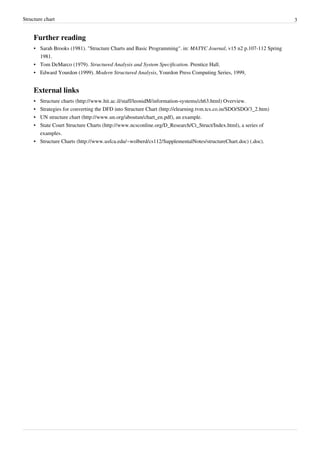
Structure chart
A Structure Chart (SC) in software
engineering and organizational theory is
a chart, which shows the breakdown of
the configuration system to the lowest
manageable levels.[2]
This chart is used in structured
programming to arrange the program
modules in a tree structure. Each
module is represented by a box, which
contains the module's name. The tree
structure visualizes the relationships
between the modules.[3]
[1]
Example of a Structured Chart.
Overview
A structure chart is a top-down modular design
tool, constructed of squares representing the
different modules in the system, and lines that
connect them. The lines represent the connection
and or ownership between activities and
subactivities as they are used in organization
charts.[4]
In structured analysis structure charts, according to
Wolber (2009), "are used to specify the high-level
design, or architecture, of a computer program. As
a design tool, they aid the programmer in dividing
and conquering a large software problem, that is,
recursively breaking a problem down into parts
This illustration is hierarchy chart that represent data passing between two
that are small enough to be understood by a human modules. When the module Pay_Bill executed, the pseudocode check if it
brain. The process is called top-down design, or already pay the bill by search the receipt of payment (execute
functional decomposition. Programmers use a Search_Receipt). If the receipt is not found then it will execute module
Give_Money_To_Debt_Collector to finish the job.
structure chart to build a program in a manner
similar to how an architect uses a blueprint to build
a house. In the design stage, the chart is drawn and used as a way for the client and the various software designers to
communicate. During the actual building of the program (implementation), the chart is continually referred to as the
master-plan".[5] .
A structure chart depicts[2]
• the size and complexity of the system, and
• number of readily identifiable functions and modules within each function and
• whether each identifiable function is a manageable entity or should be broken down into smaller components.](https://image.slidesharecdn.com/structurechart-110419224319-phpapp01/85/Structure-chart-1-320.jpg)
![Structure chart 2
A structure chart is also used to diagram associated elements that comprise a run stream or thread. It is often
developed as a hierarchical diagram, but other representations are allowable. The representation must describe the
breakdown of the configuration system into subsystems and the lowest manageable level. An accurate and complete
structure chart is the key to the determination of the configuration items, and a visual representation of the
configuration system and the internal interfaces among its CIs. During the configuration control process, the
structure chart is used to identify CIs and their associated artifacts that a proposed change may impact.[2]
Structure chart construction
According to Wolber (2009), "a
structure chart can be developed
starting with the creating of a structure,
which places the root of an
upside-down tree which forms the
structure chart. The next step is to
conceptualize the main sub-tasks that
must be performed by the program to
solve the problem. Next, the
programmer focuses on each sub-task
individually, and conceptualizes how
each can be broken down into even
smaller tasks. Eventually, the program
is broken down to a point where the
leaves of the tree represent simple
methods that can be coded with just a
few program statements".[5]
In practice, see figure, first it is checked
A process flow diagram describing the construction of a structure chart by a so called
if a Structure Chart has been developed [2]
Subject Matter Experts (SME).
already. If so an expert needs to review
it to ensure it represents the current
structure and if not, updates the chart where needed.[2]
References
[1] Sandia National Laboratories (1992). Sandia Software Guidelines Volume 5 Tools, Techniques,and Methodologies (http:/ / www. prod.
sandia. gov/ cgi-bin/ techlib/ access-control. pl/ 1985/ 852348. pdf) SANDIA REPORTS 85–2348qUC–32
[2] IRS (2008) "Configuration Management"] In: IRS Resources Part 2. Information Technology Chapter 27. Configuration Management.
Accessed at IRS.GOV (http:/ / www. irs. gov/ ) 14 Nov 2008. No longer online Nov 8, 2009.
[3] James Martin, Carma L. McClure (1988). Structured Techniques: The Basis for Case. Prentice Hall. p.56.
[4] H. Fujita & V. Gruhn (2004). New Trends in Software Methodologies, Tools and Techniques. Page 6.
[5] David Wolber (2009) " Structure Charts (http:/ / www. usfca. edu/ ~wolberd/ cs112/ SupplementalNotes/ structureChart. doc): Supplementary
Notes Structure Charts and Bottom-up Implementation: Java Version. Accessed Nov 8, 2009](https://image.slidesharecdn.com/structurechart-110419224319-phpapp01/85/Structure-chart-2-320.jpg)


A structure chart is a top-down diagram that shows the breakdown of a system into manageable sub-modules. It represents each module as a box with lines connecting them to show relationships. Structure charts are used in software engineering to plan program structure and divide a problem into smaller tasks. They provide a hierarchical visualization of how a program or system is decomposed.