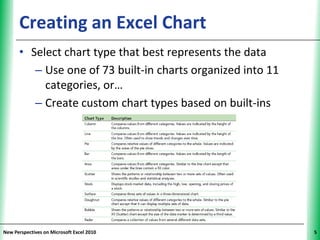
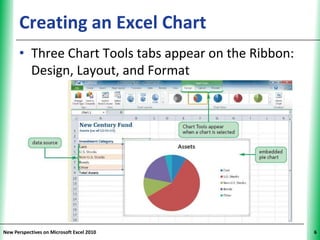
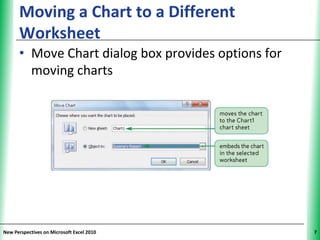
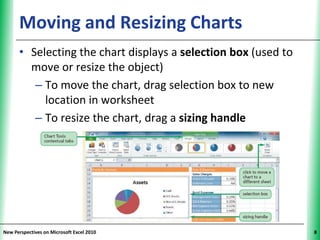
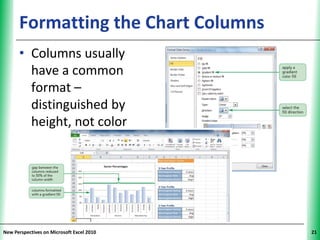
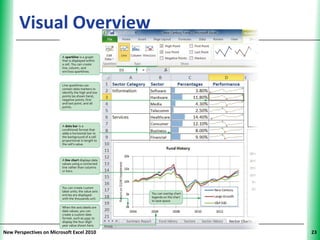
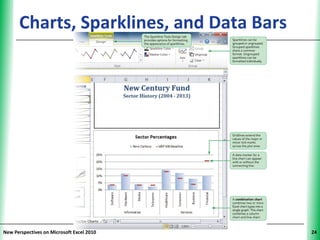
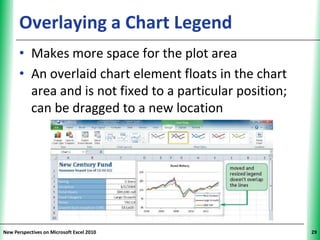
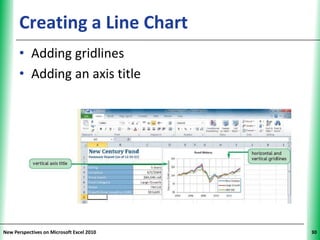
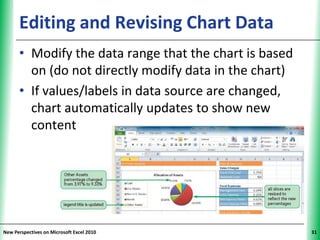
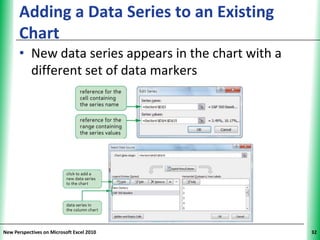
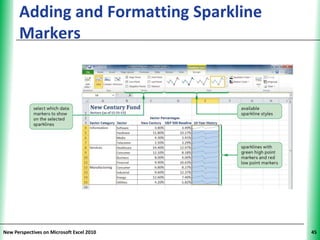
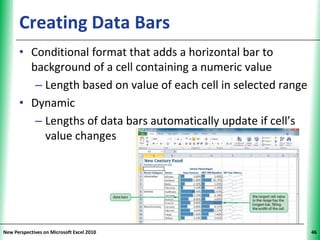
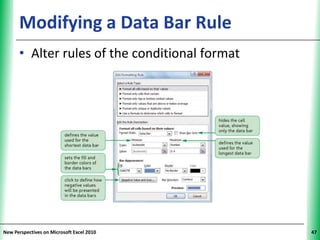
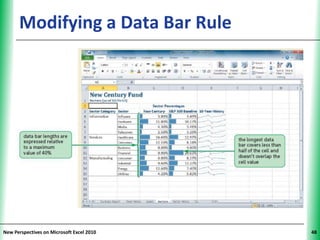
The document serves as a tutorial for enhancing workbooks in Microsoft Excel 2010 with charts and graphs, detailing the creation and formatting of various chart types including pie, column, and line charts. It explains the use of chart tools, customizing chart elements, and visual best practices for effective communication of data. Additionally, it covers advanced features such as creating sparklines and data bars to represent data visually within limited space.