Downloaded 299 times

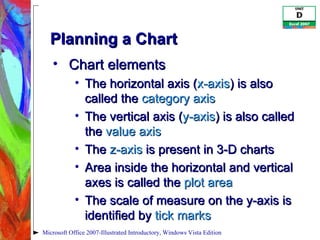
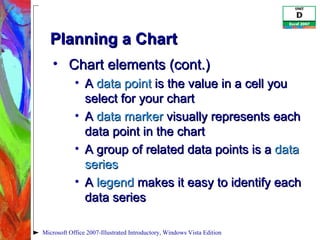
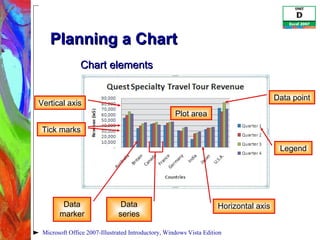
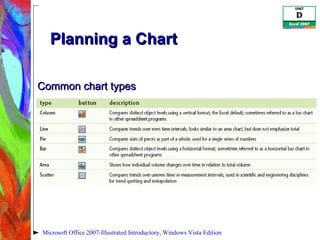
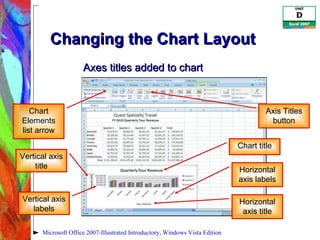
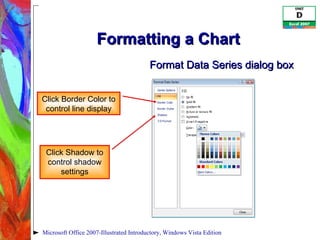
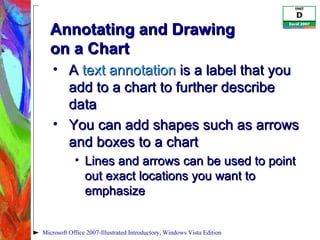
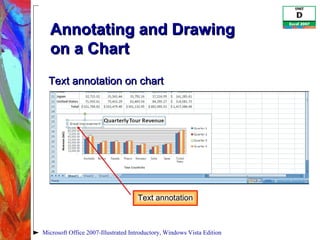
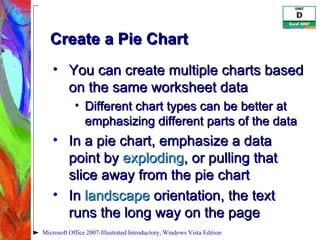
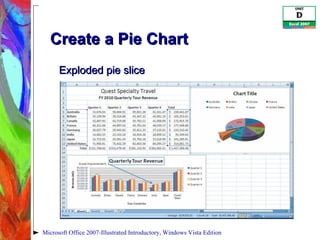


The document discusses how to plan, create, format and annotate charts in Microsoft Office 2007. It describes the different elements of charts like data points, series and legends. It explains how to select data and insert charts, move and resize charts, change the chart type and layout. The document also covers formatting charts, adding annotations and text, and how to create a pie chart.