Downloaded 21 times
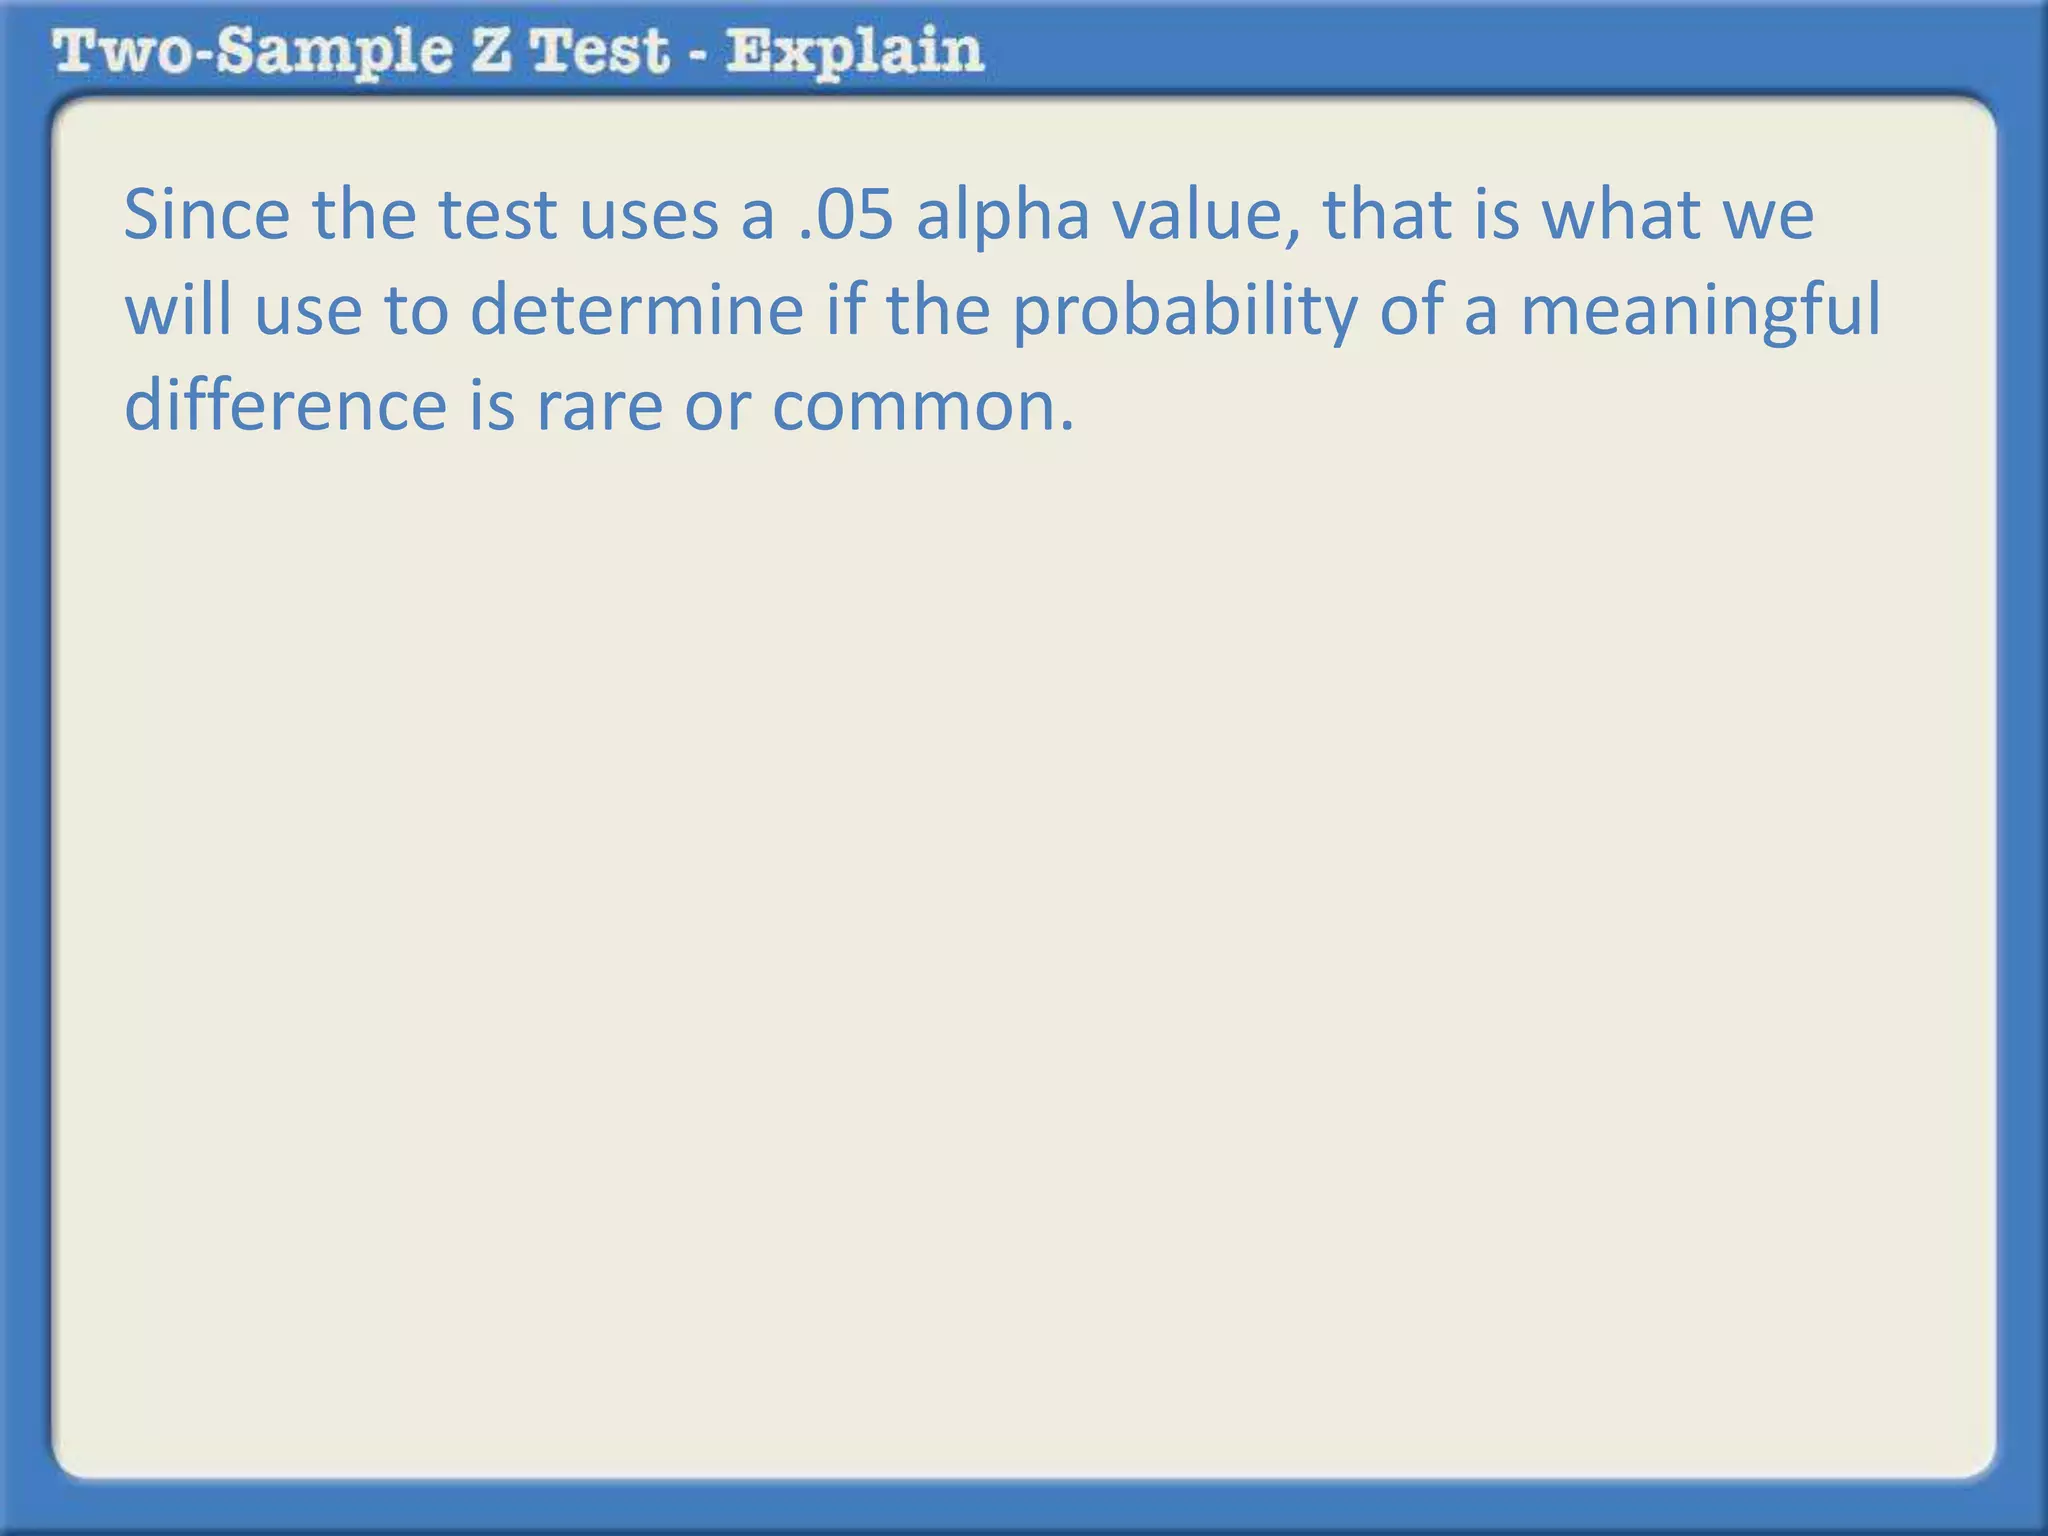
![Since the test uses a .05 alpha value, that is what we
will use to determine if the probability of a meaningful
difference is rare or common.
The alpha value makes it possible to determine what is
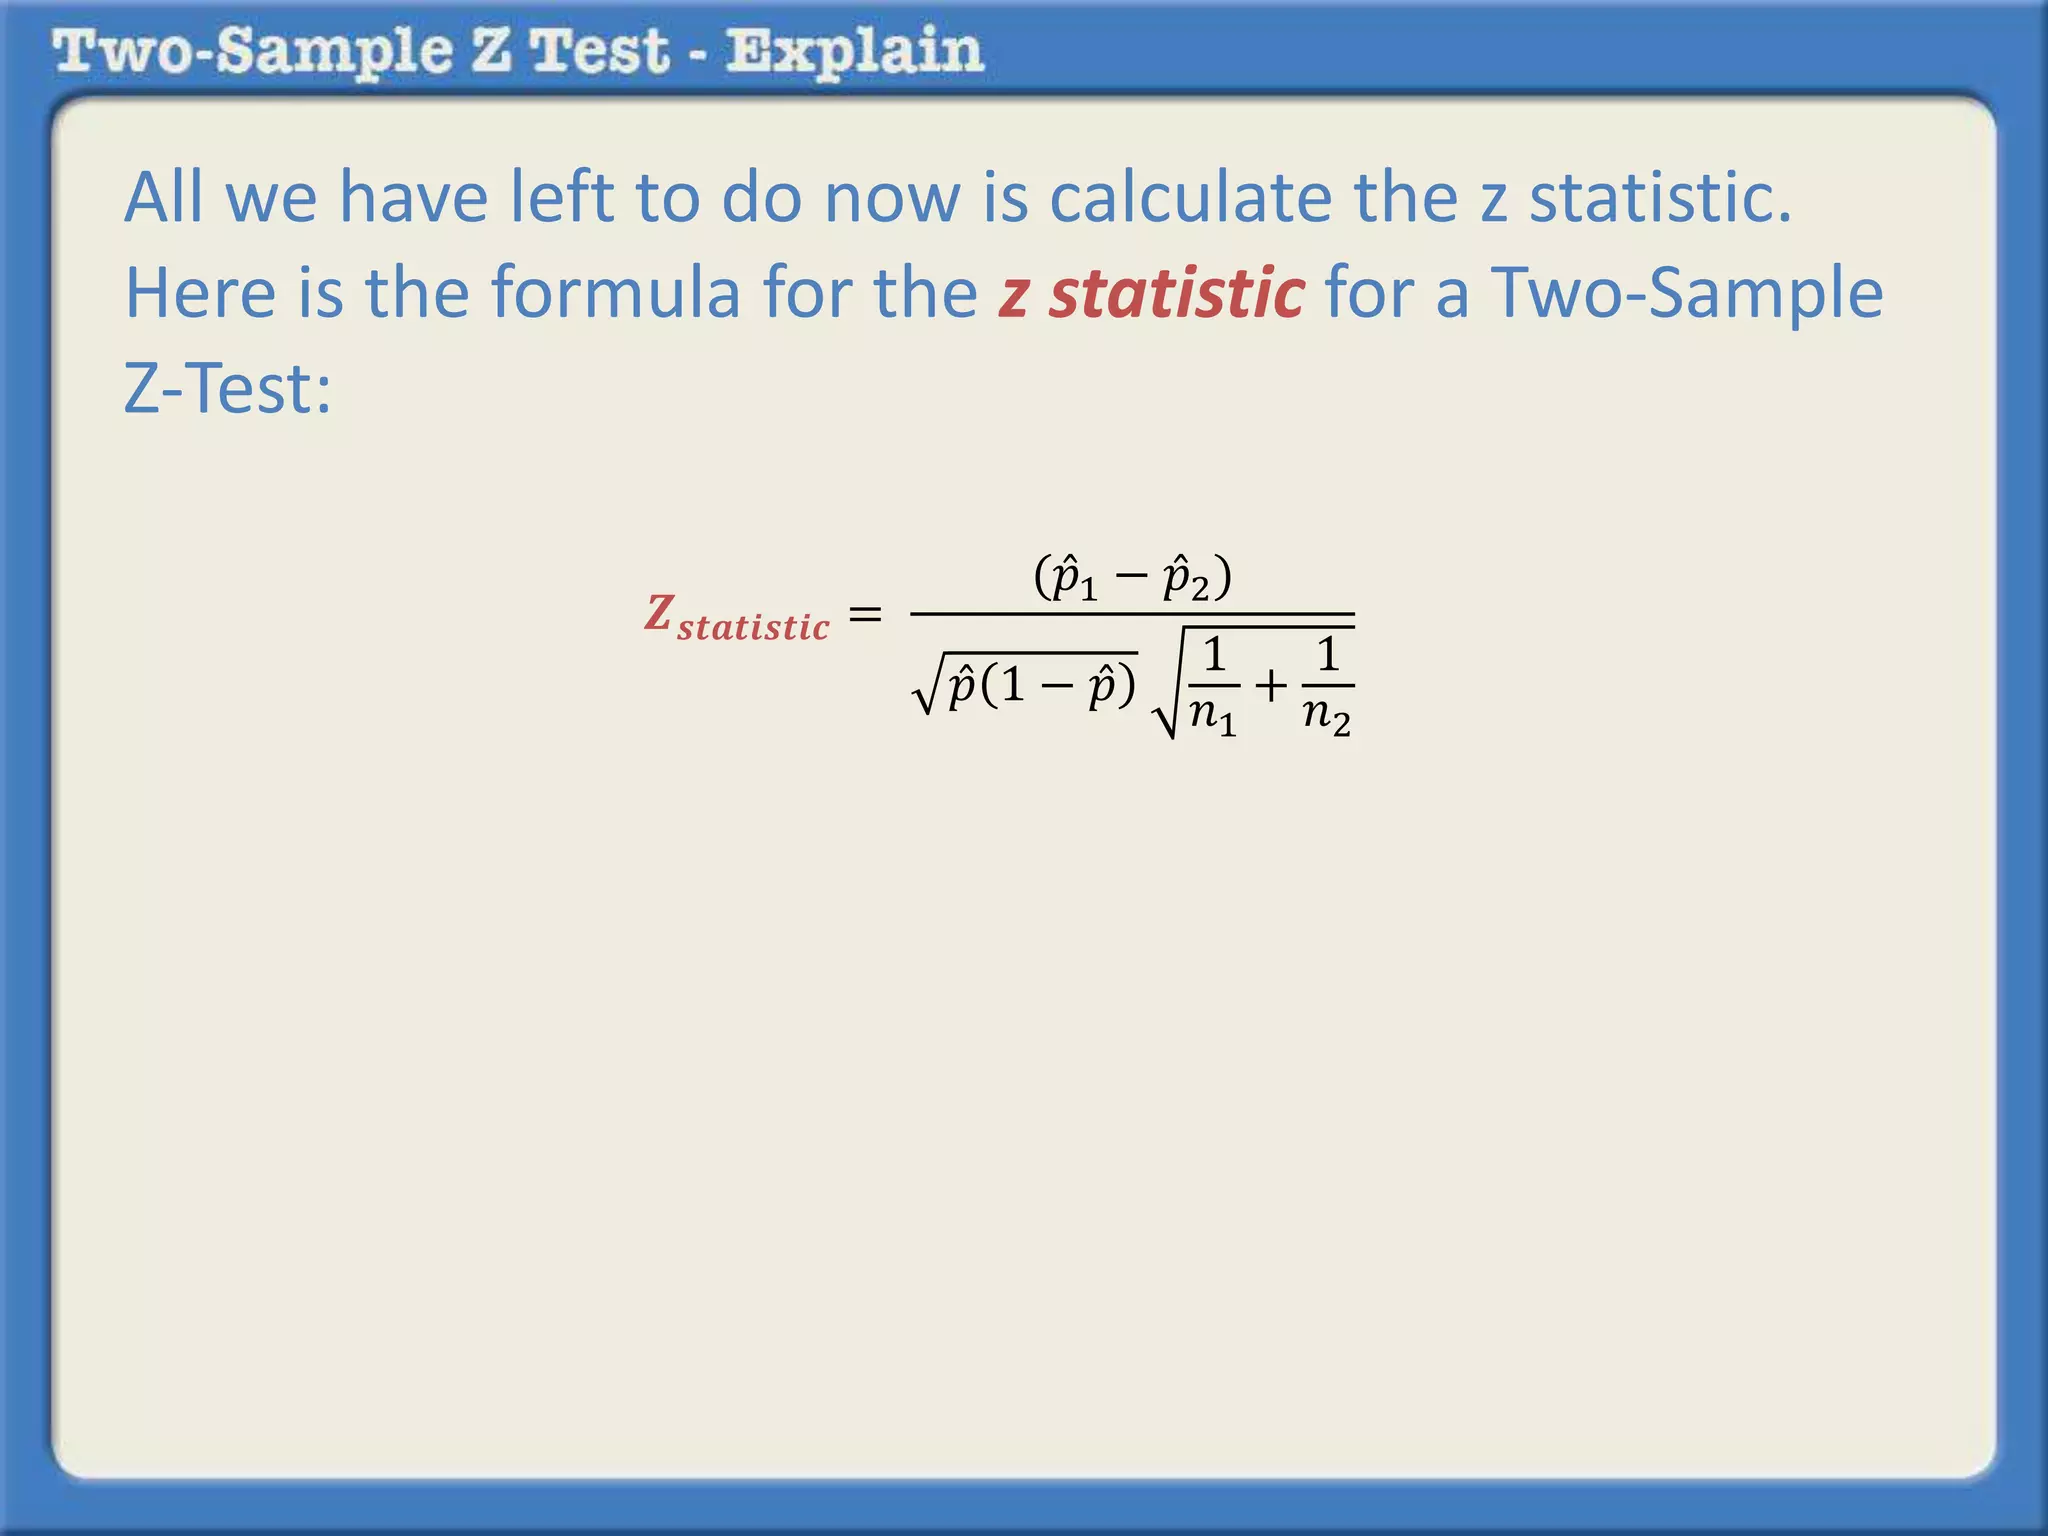
called the z critical. If the z statistic that we are about
to calculate from the data in the question is outside of
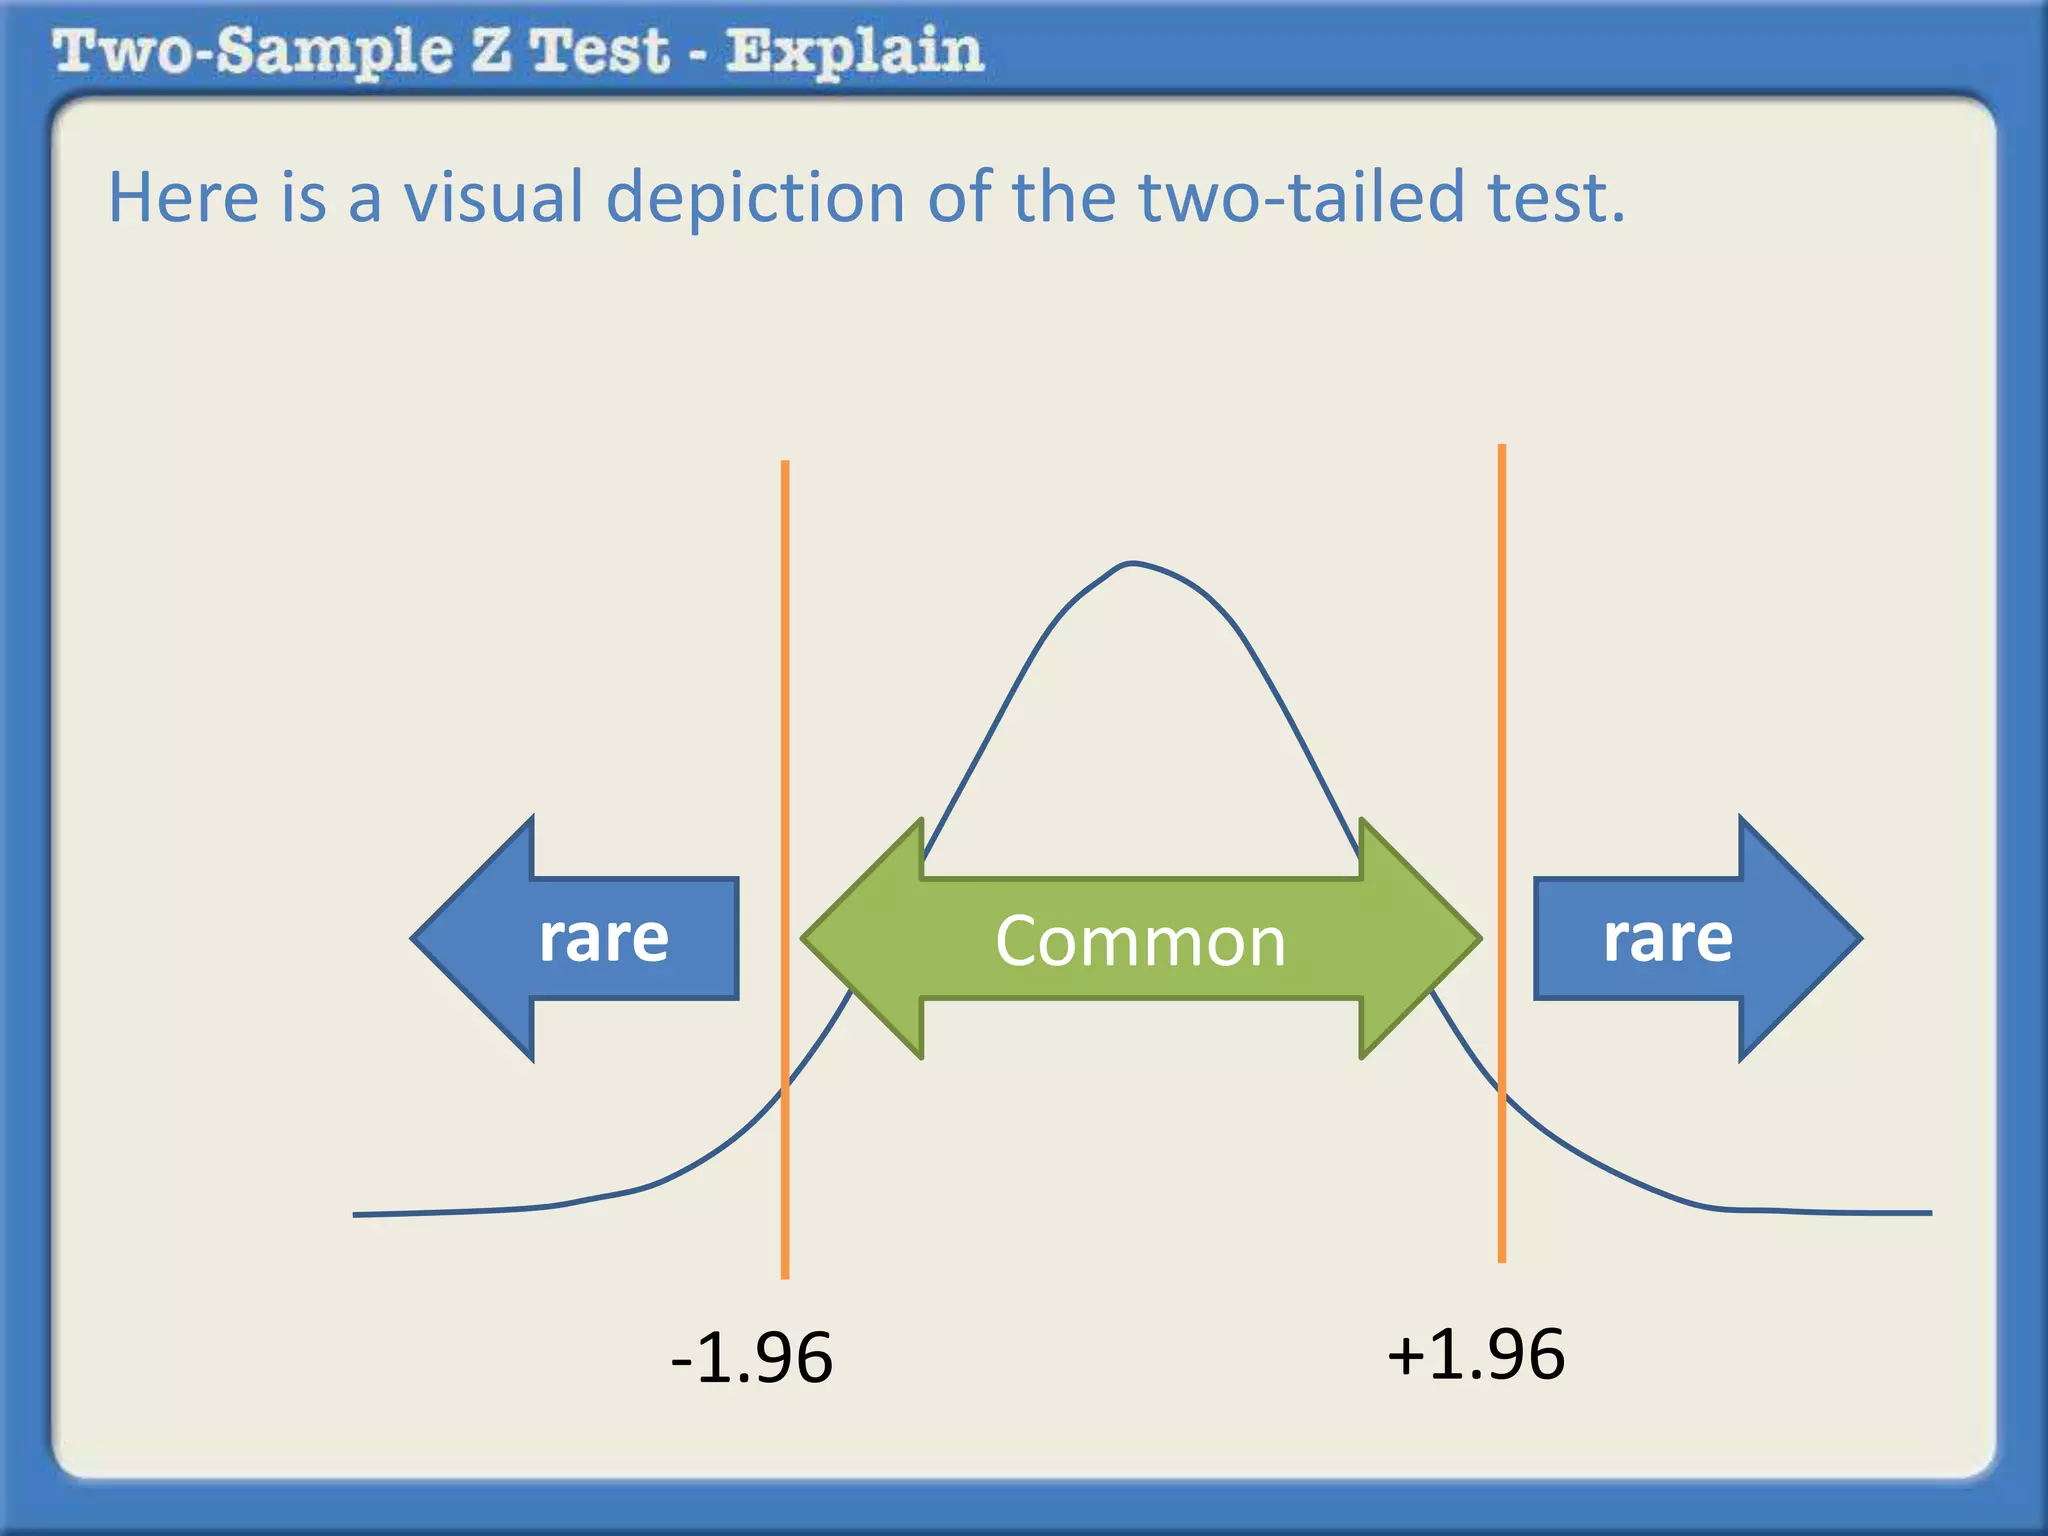
the z critical [for a one-tailed test (e.g., +1.64) or a two-tailed
test (e.g., -1.96 or +1.96]](https://image.slidesharecdn.com/whatisatwo-sampleztest-140913011359-phpapp02/75/What-is-a-two-sample-z-test-12-2048.jpg)
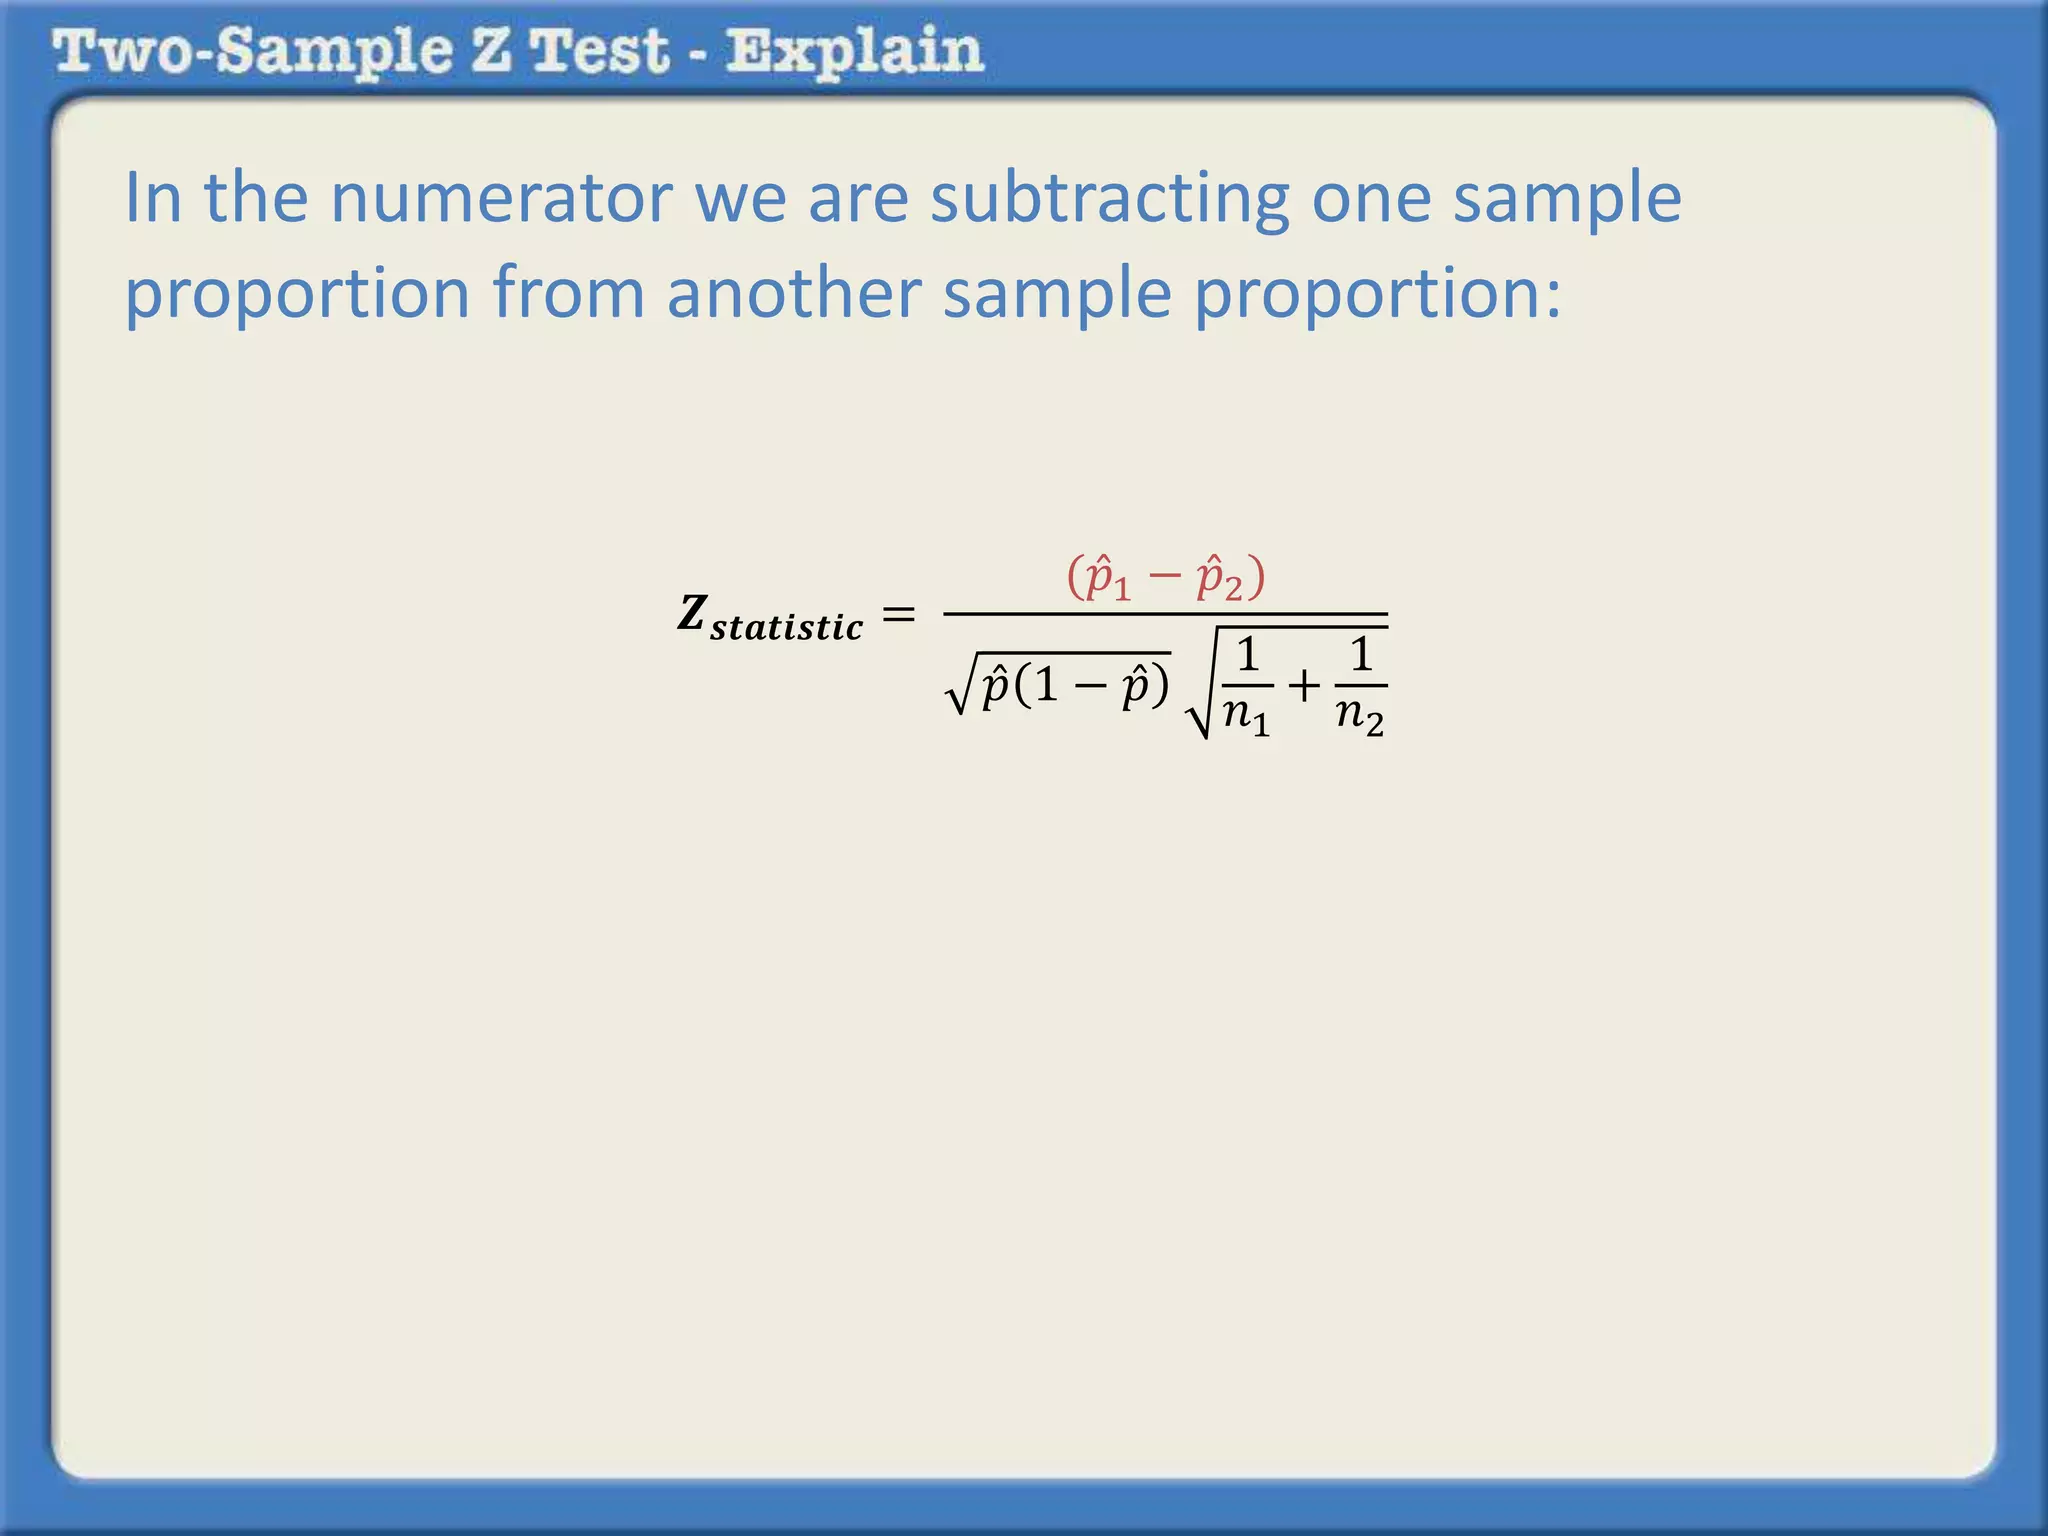
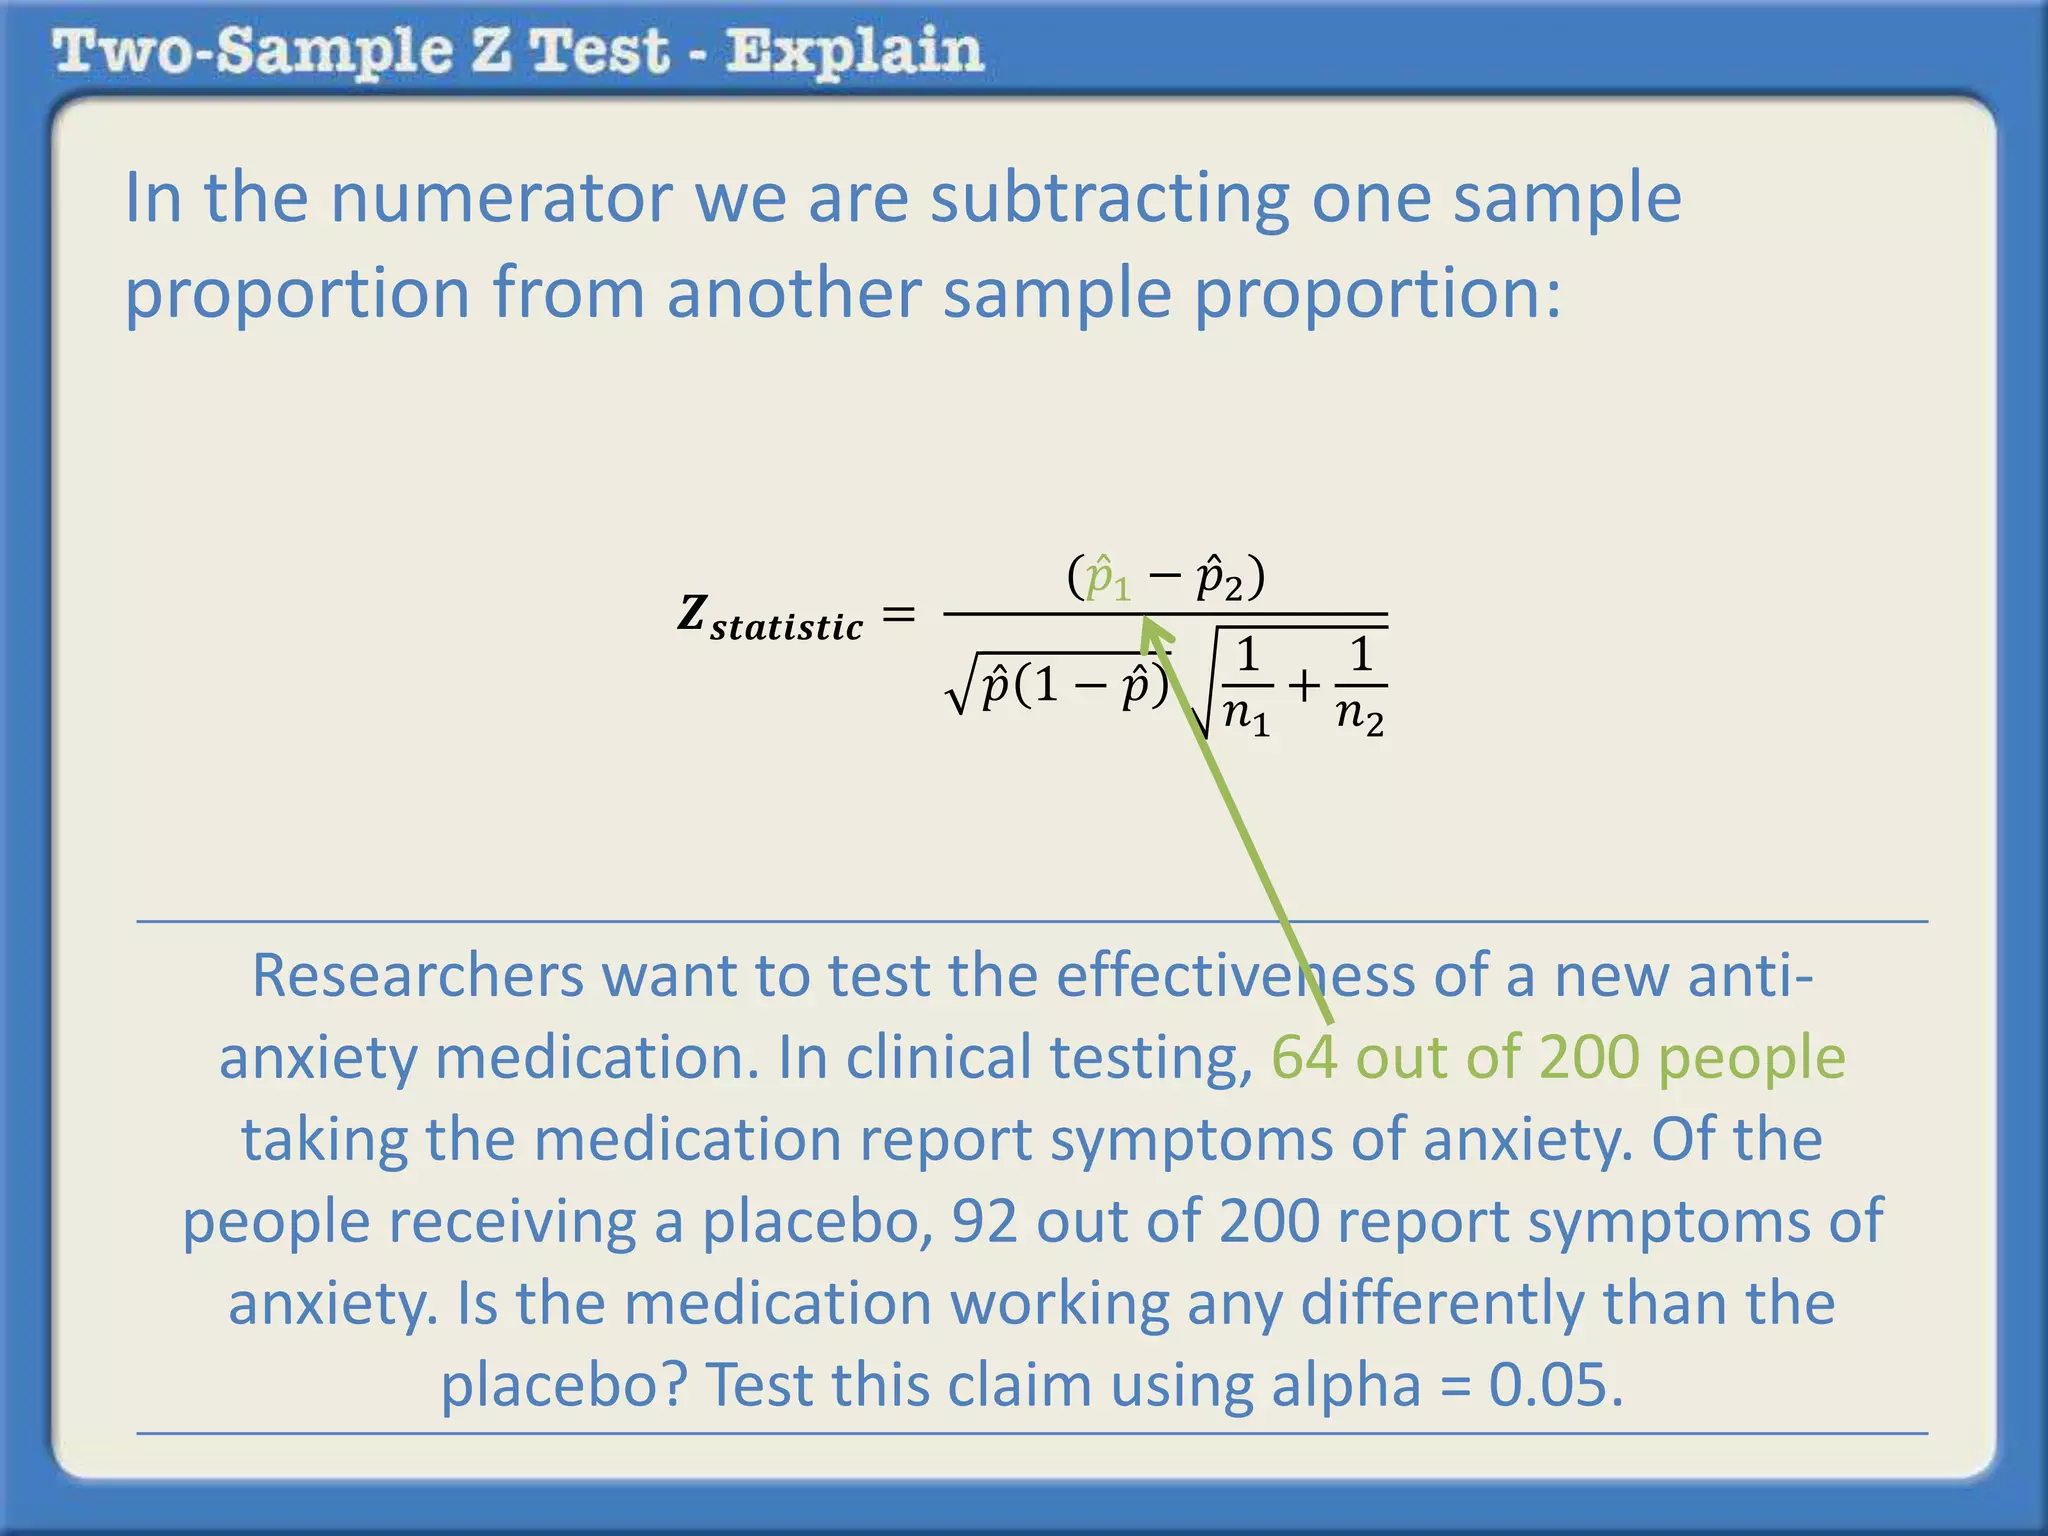
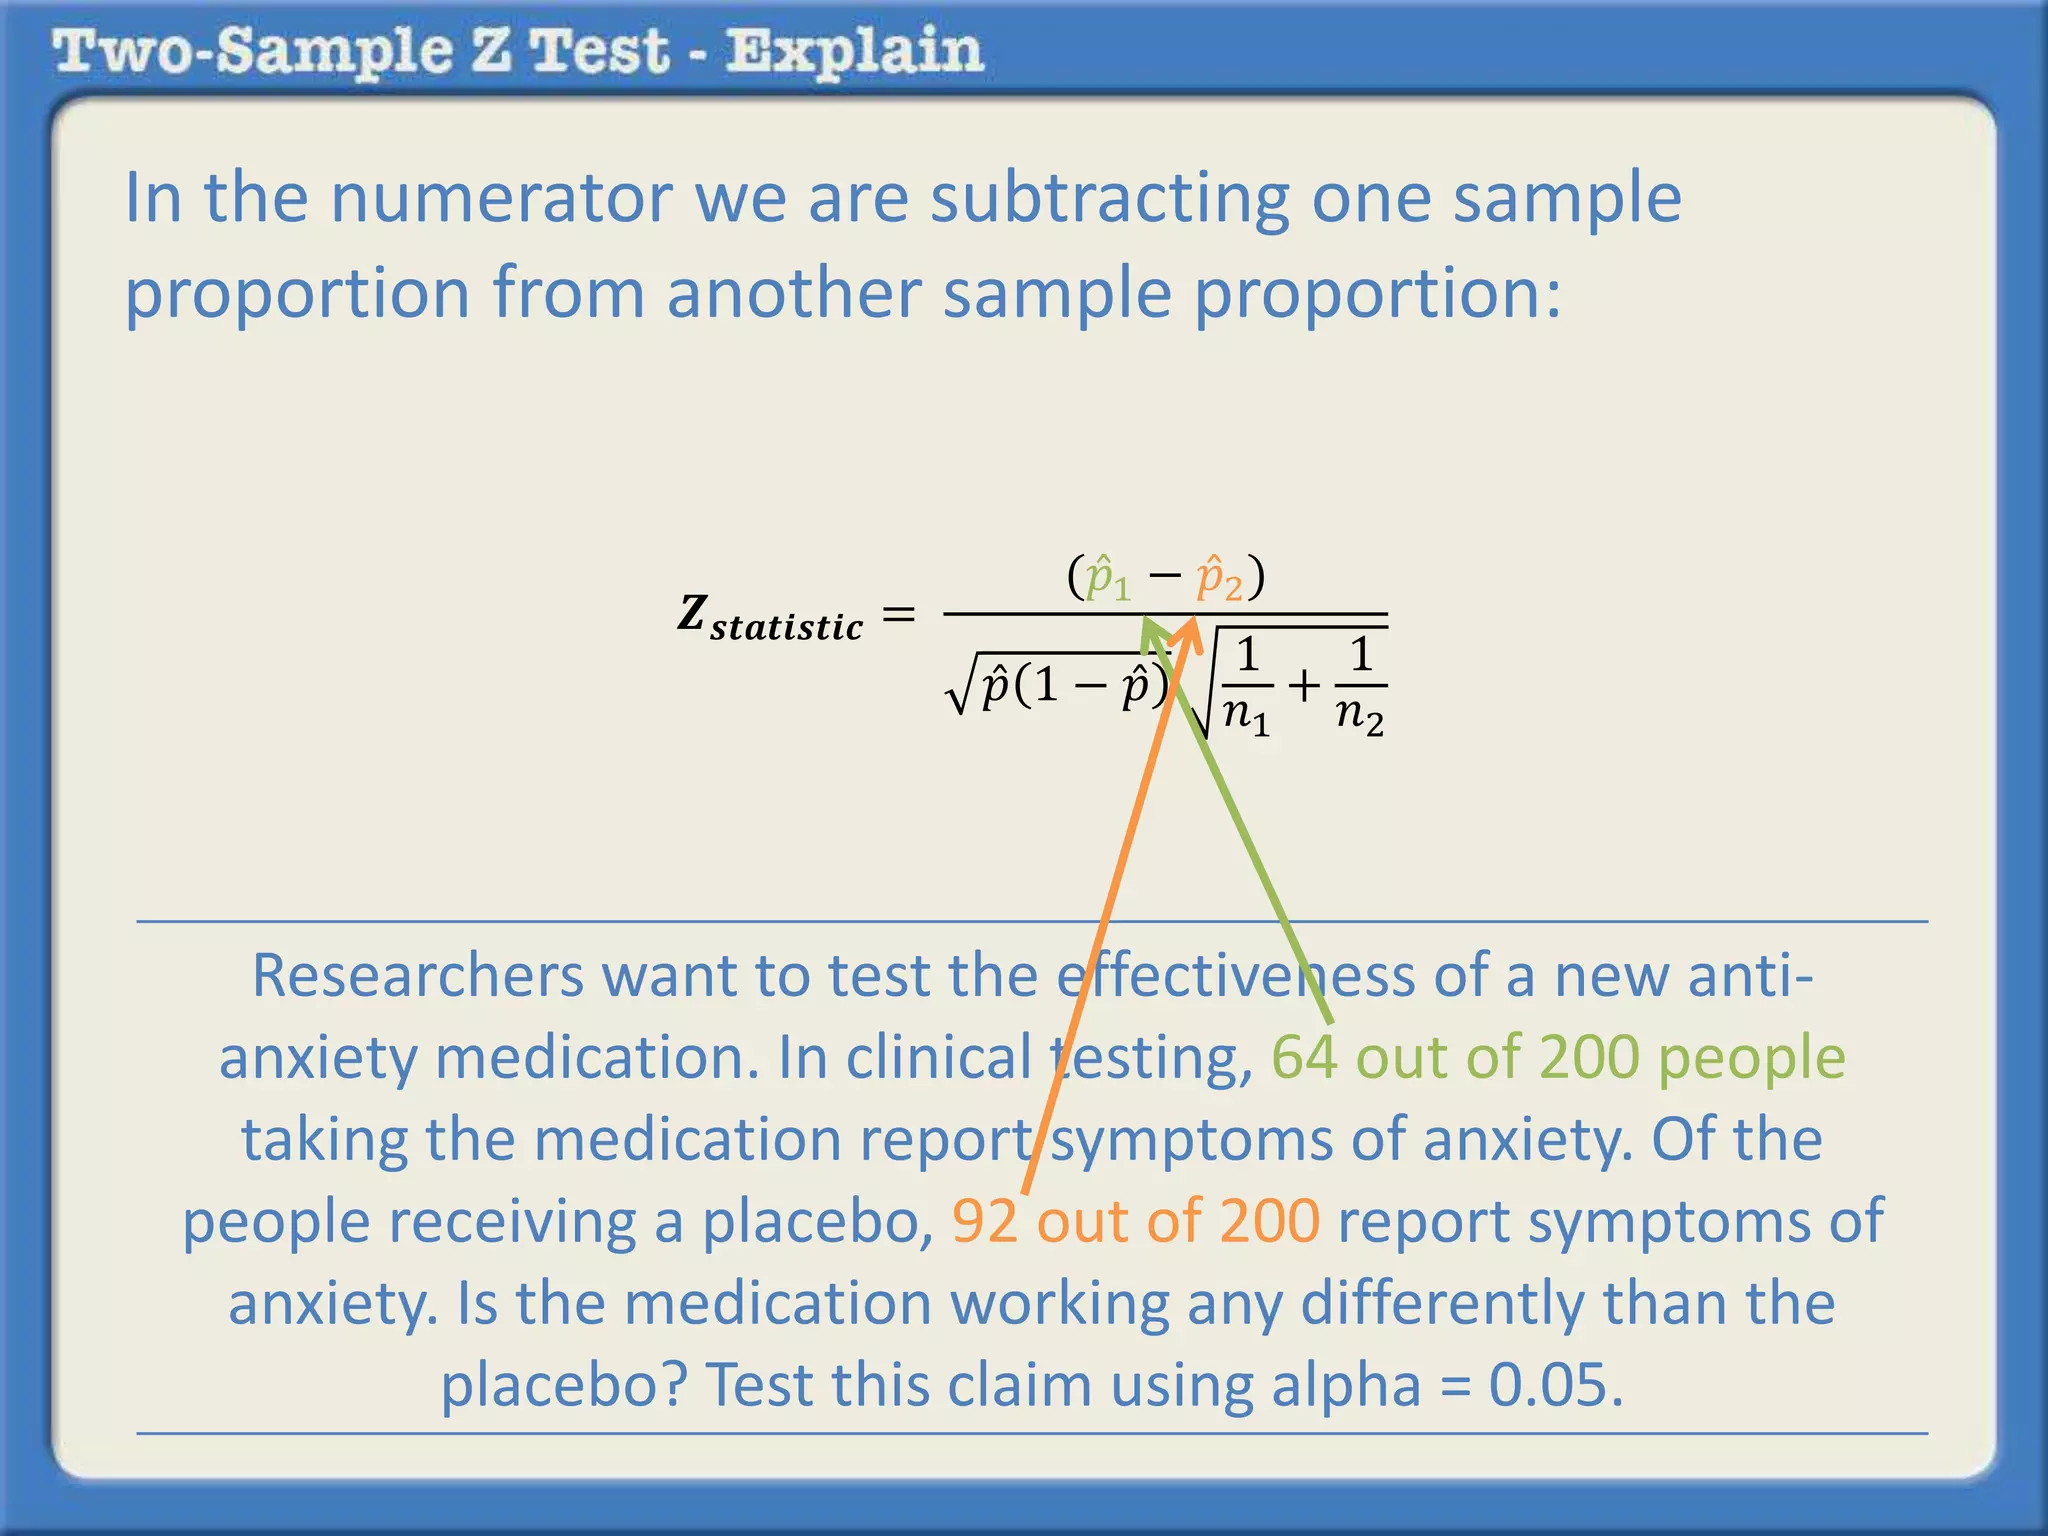
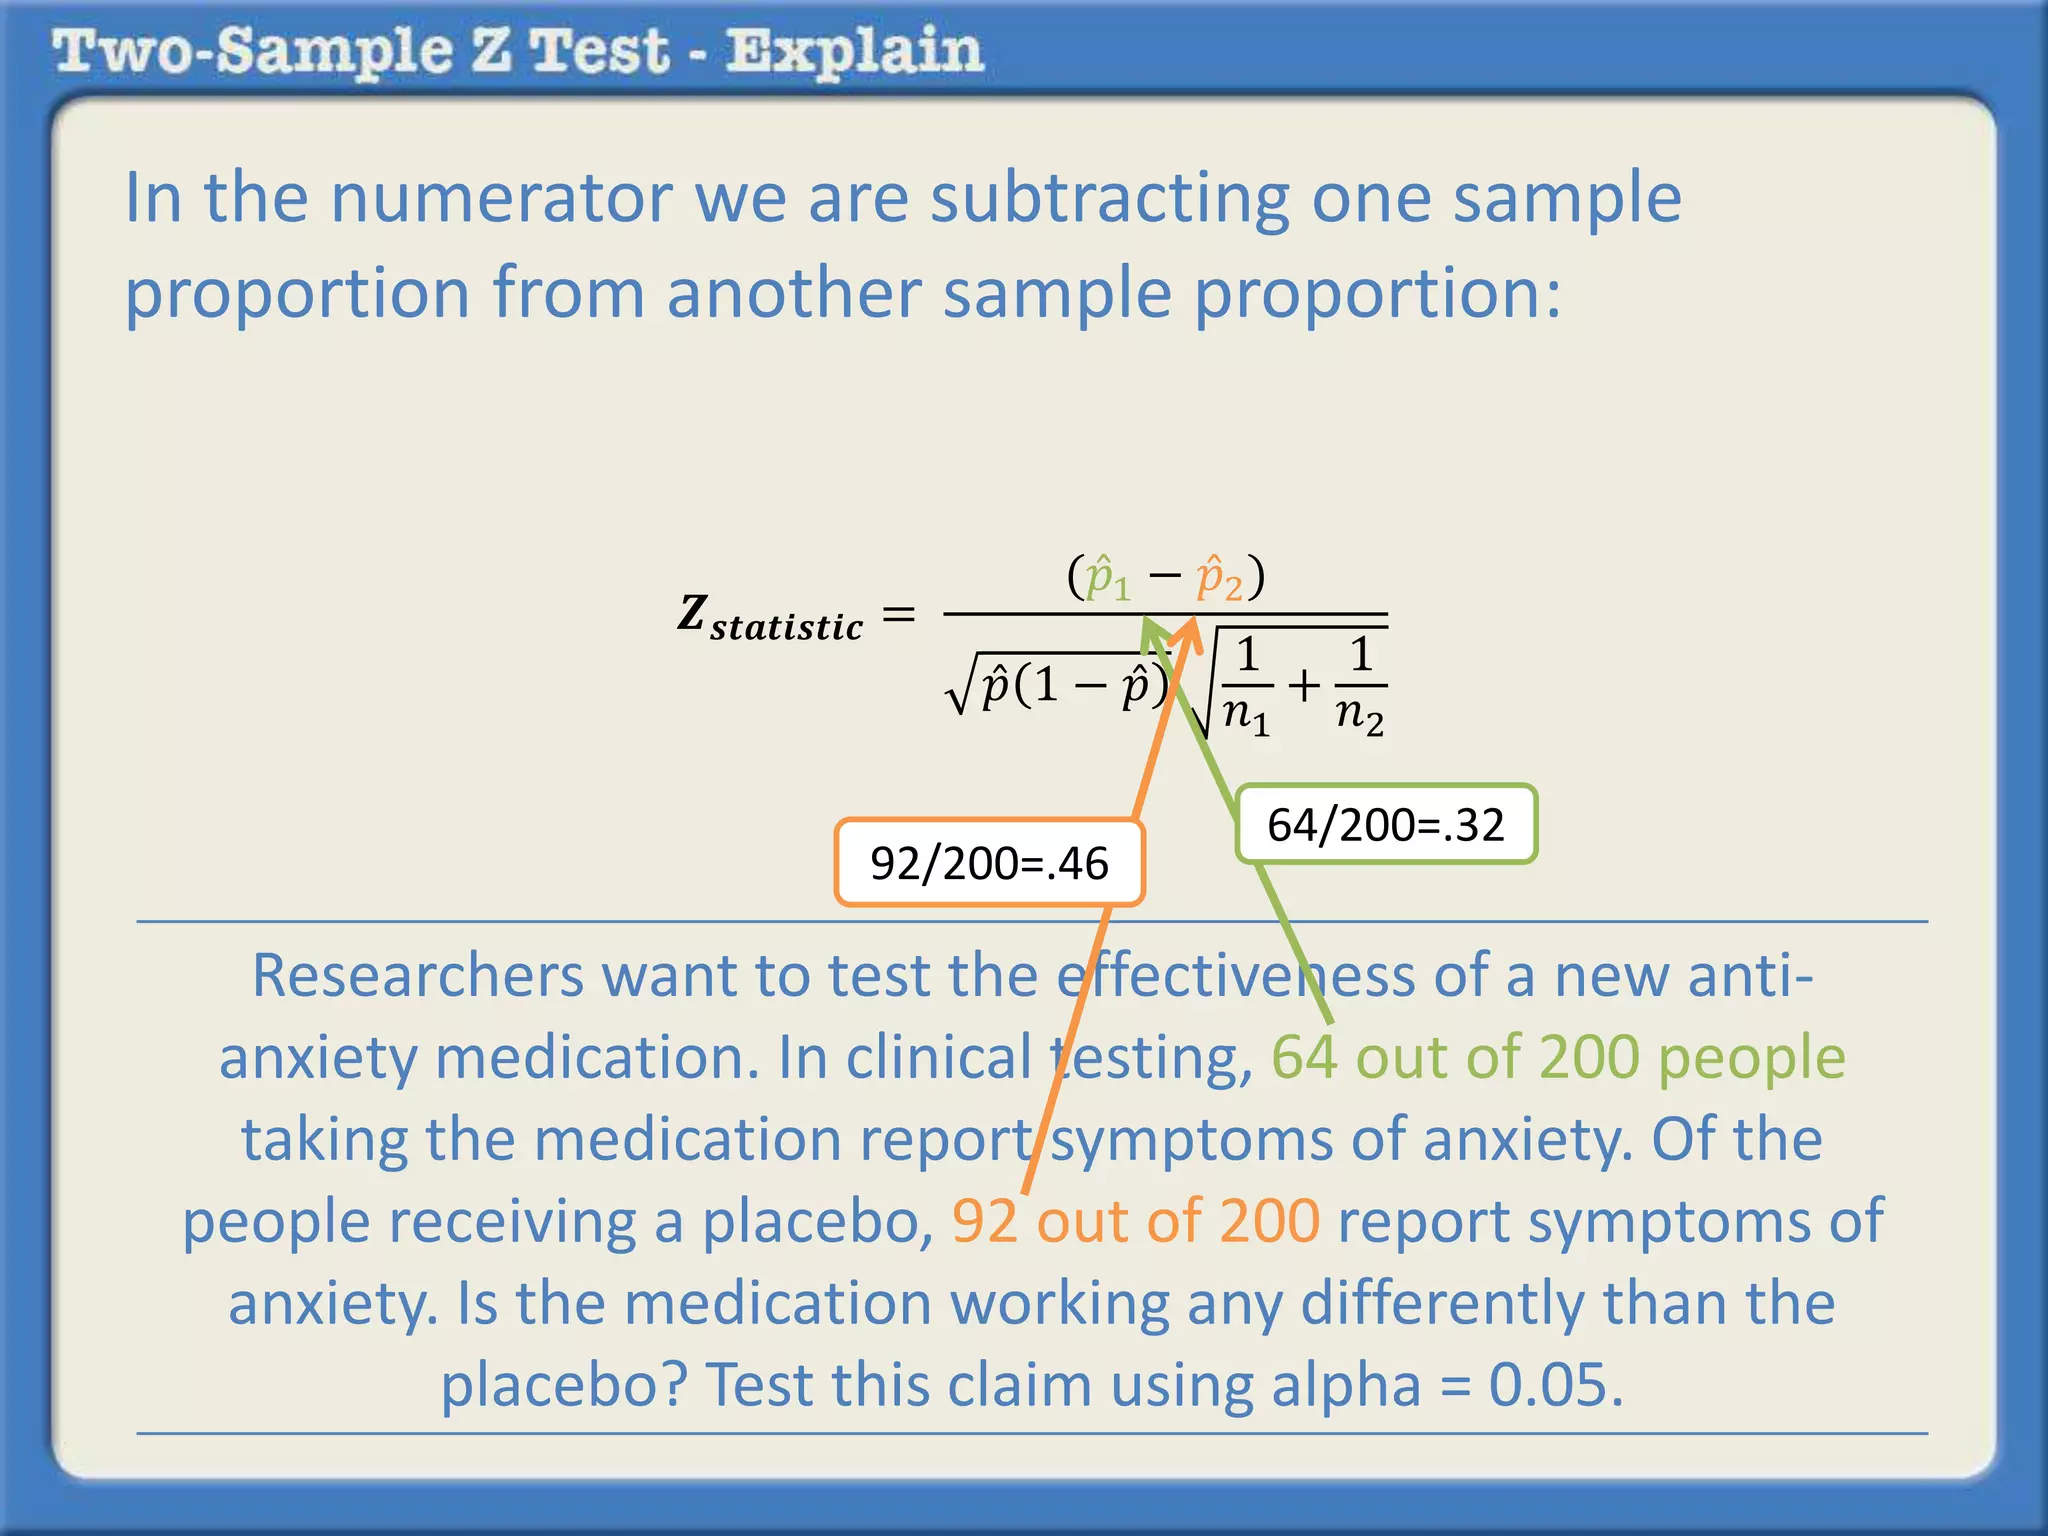
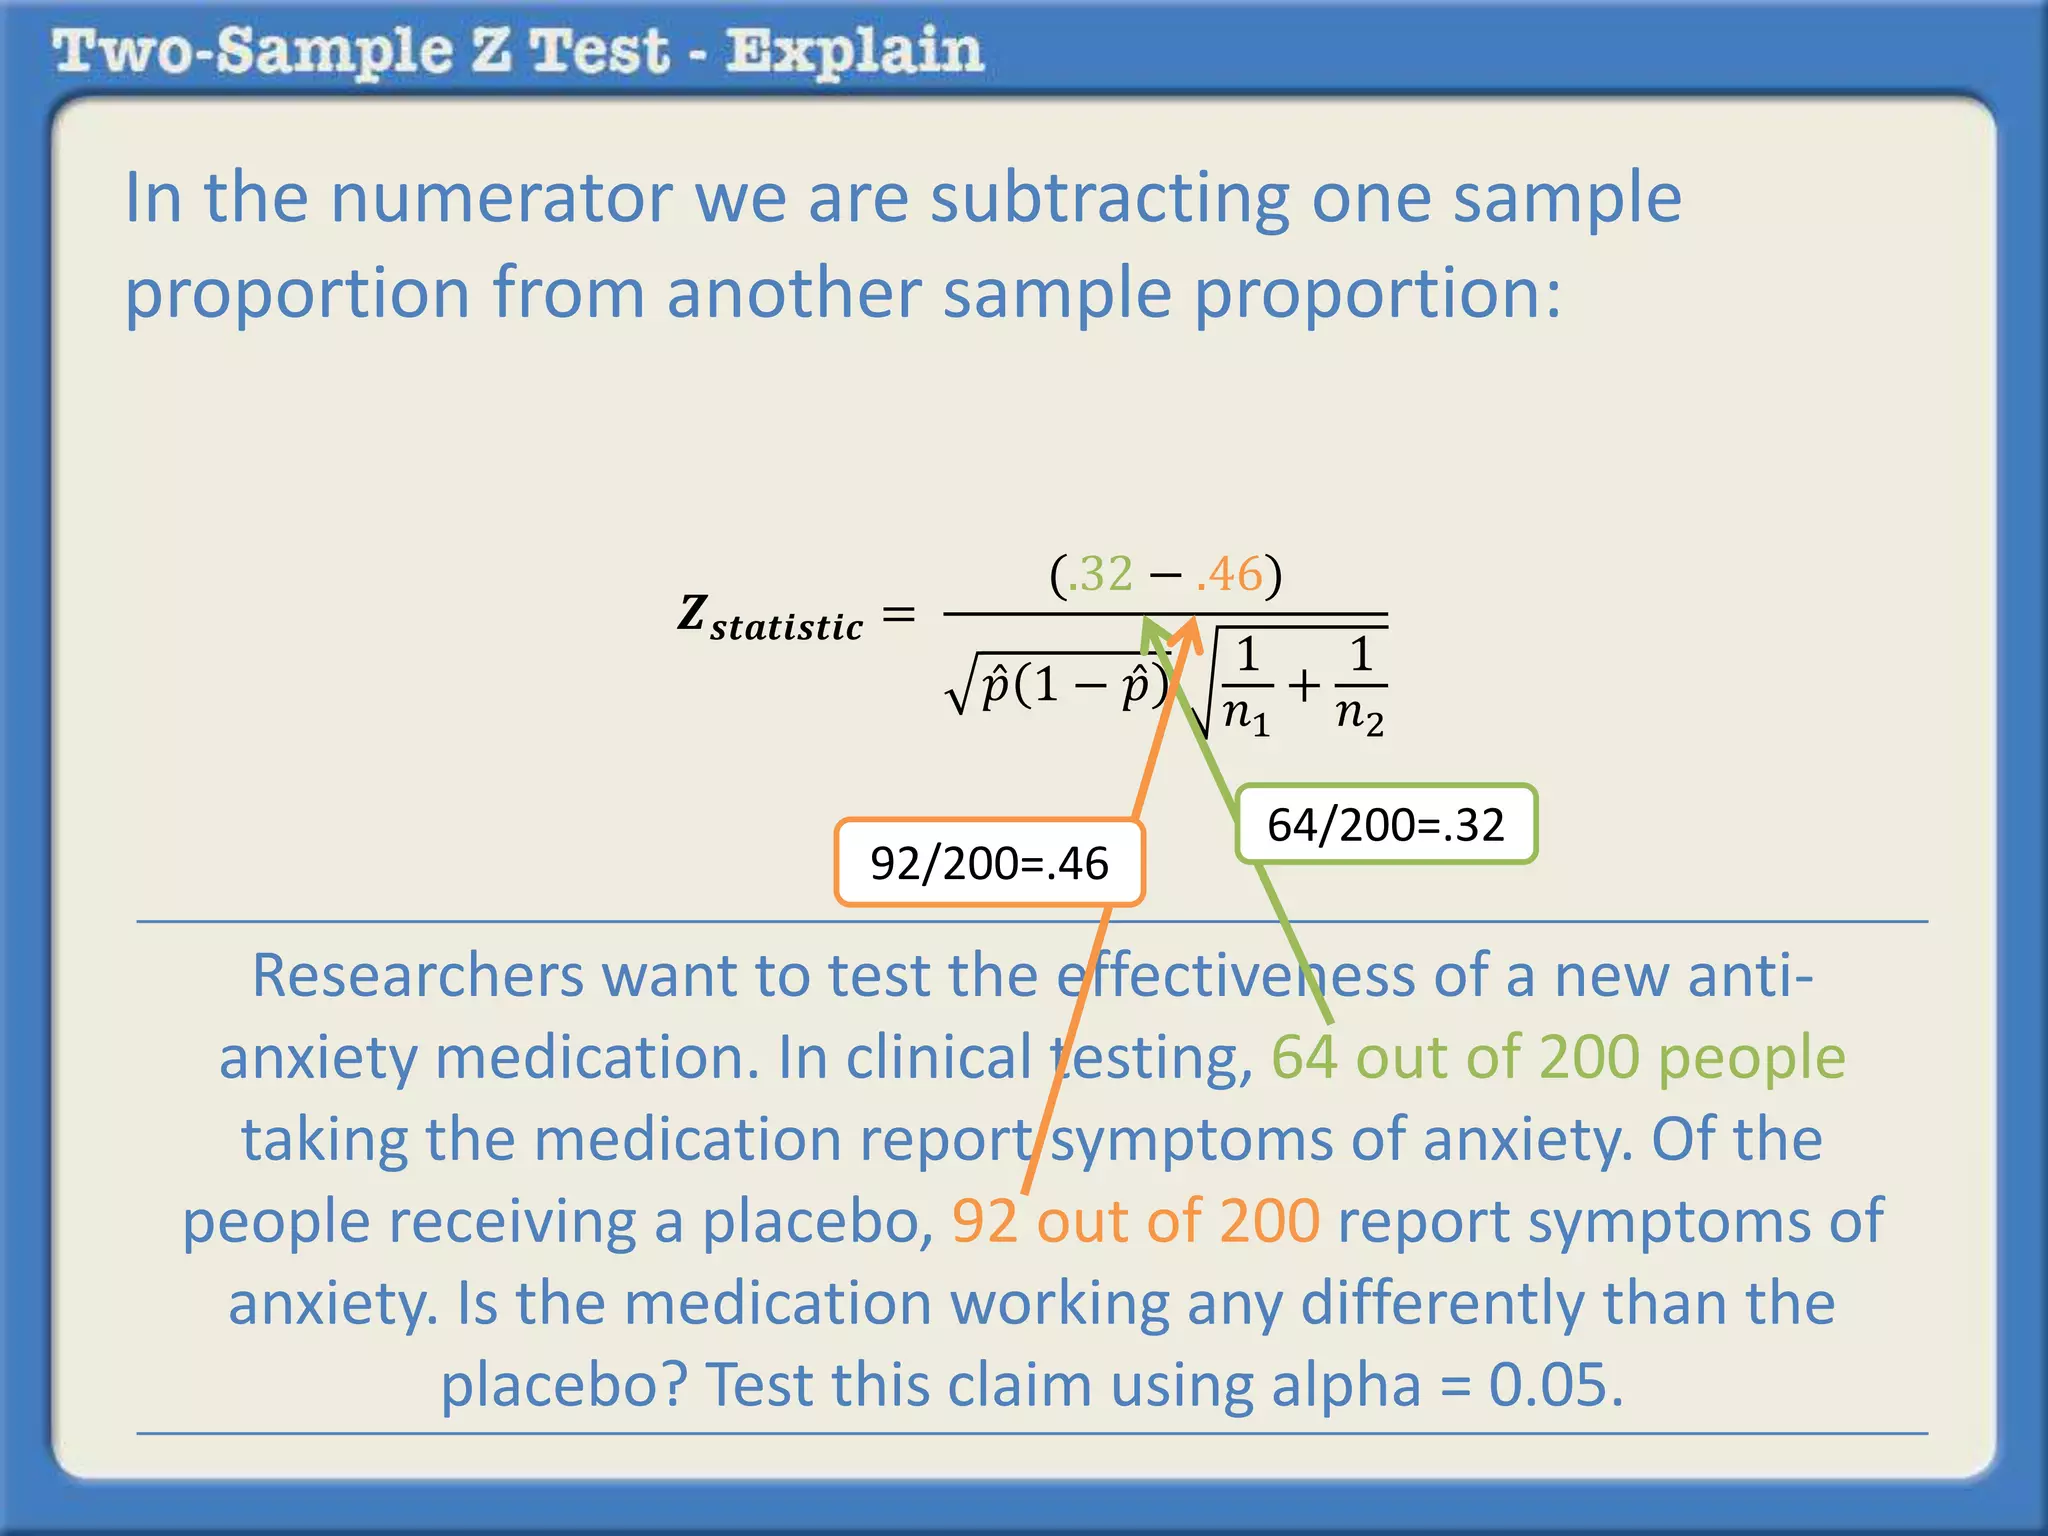
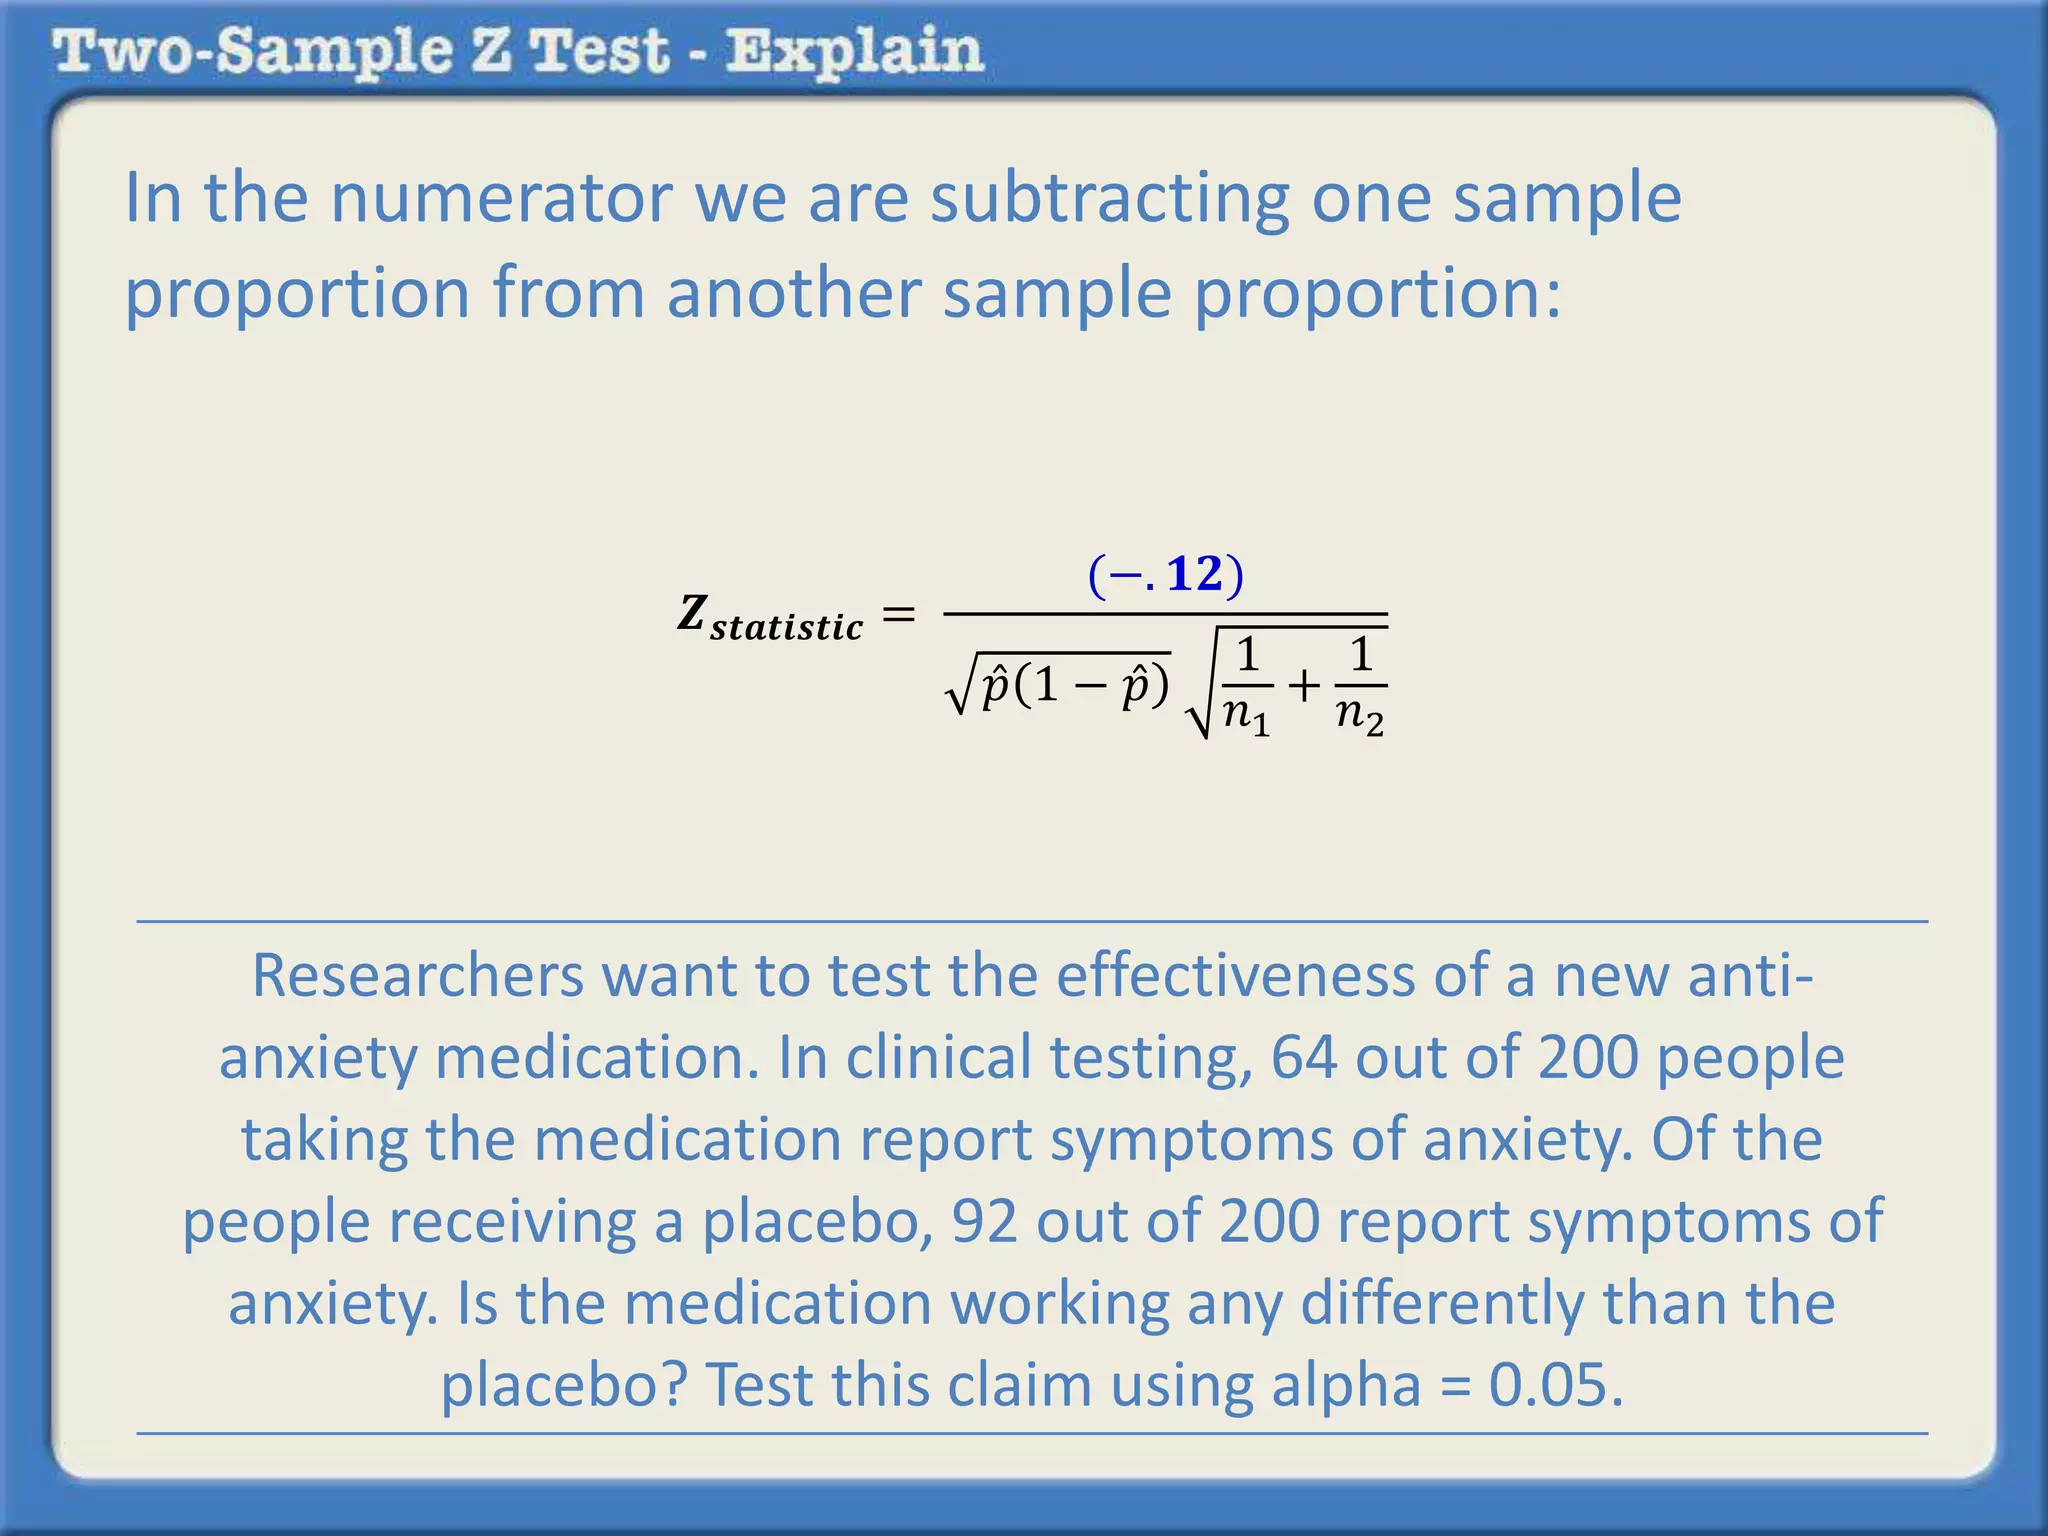
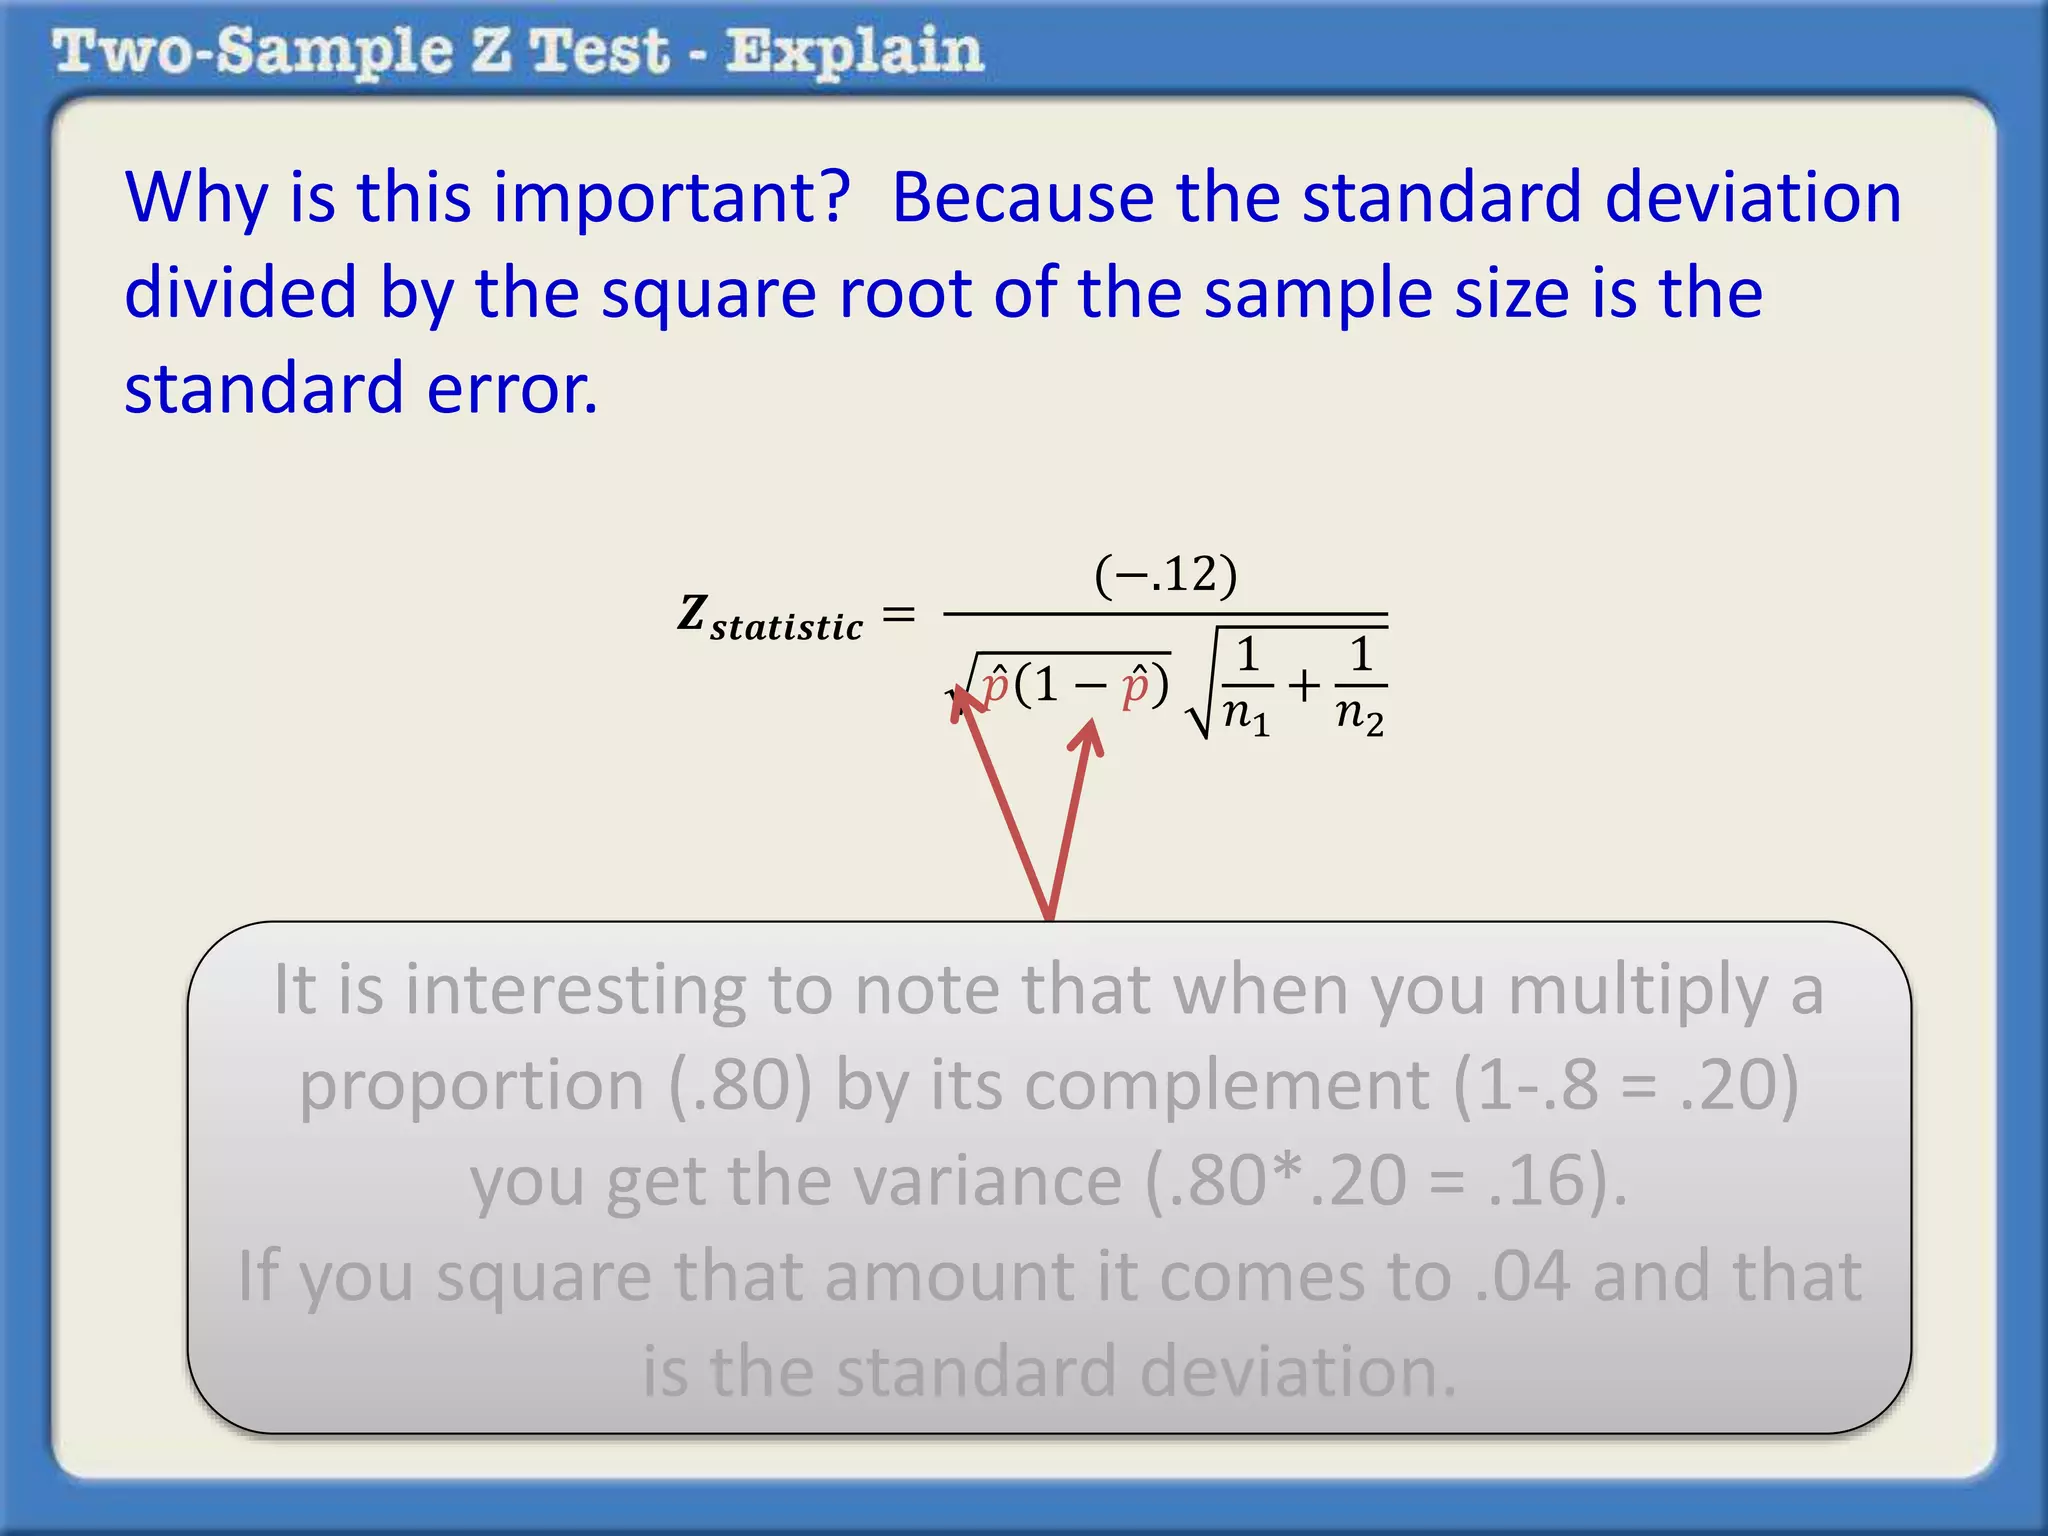
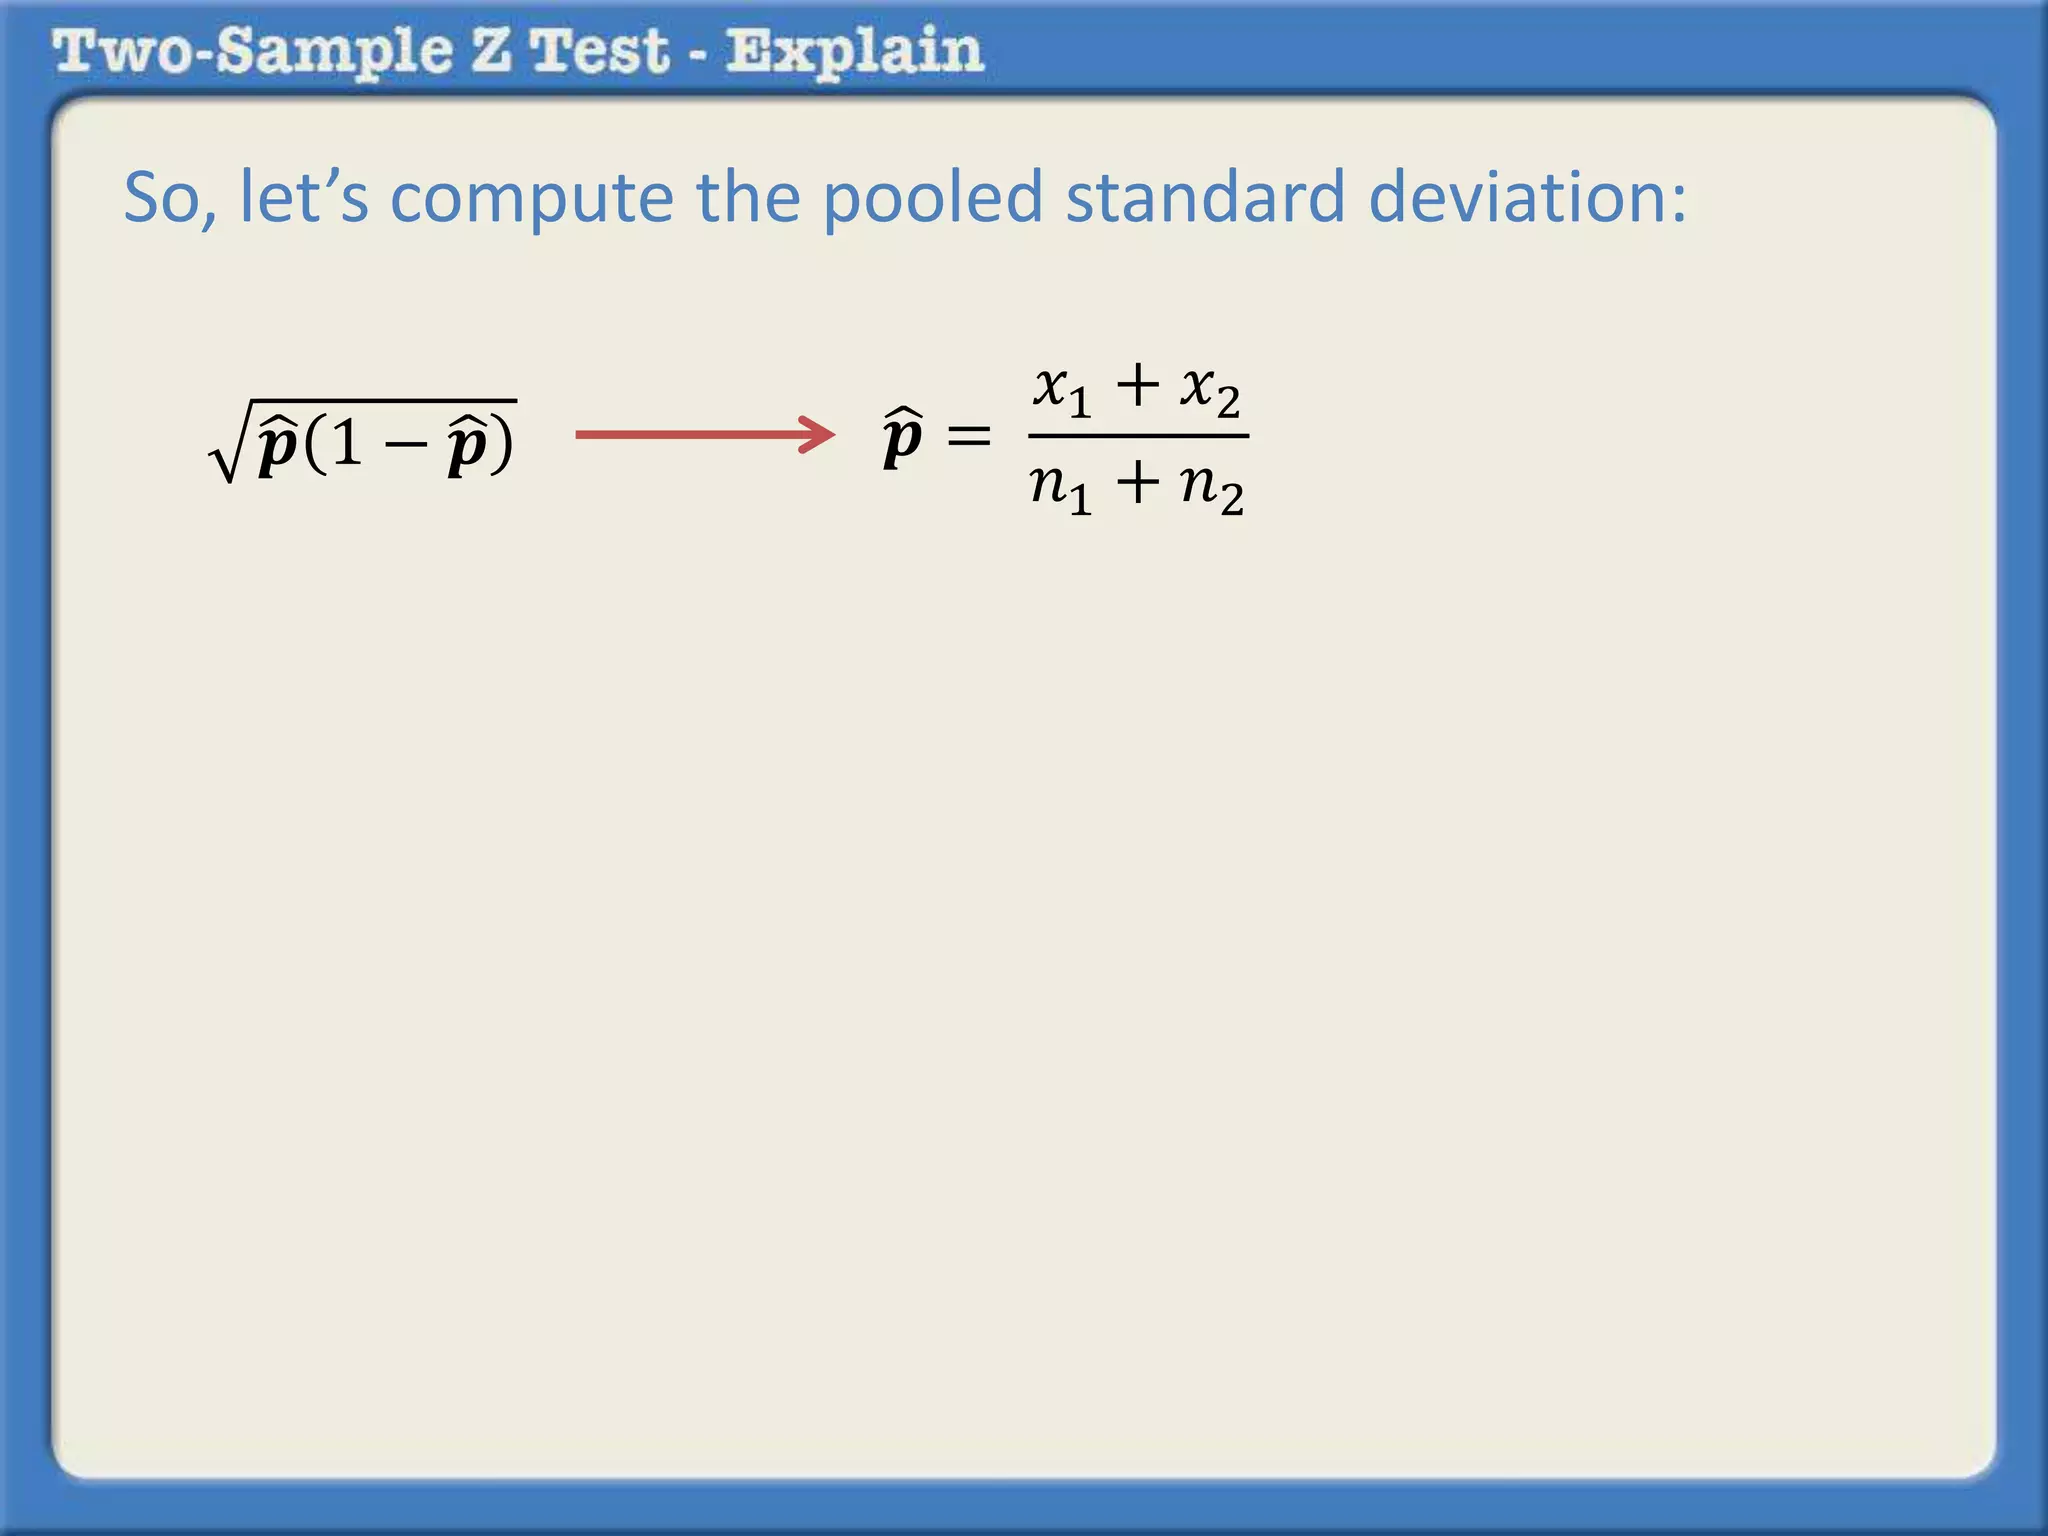
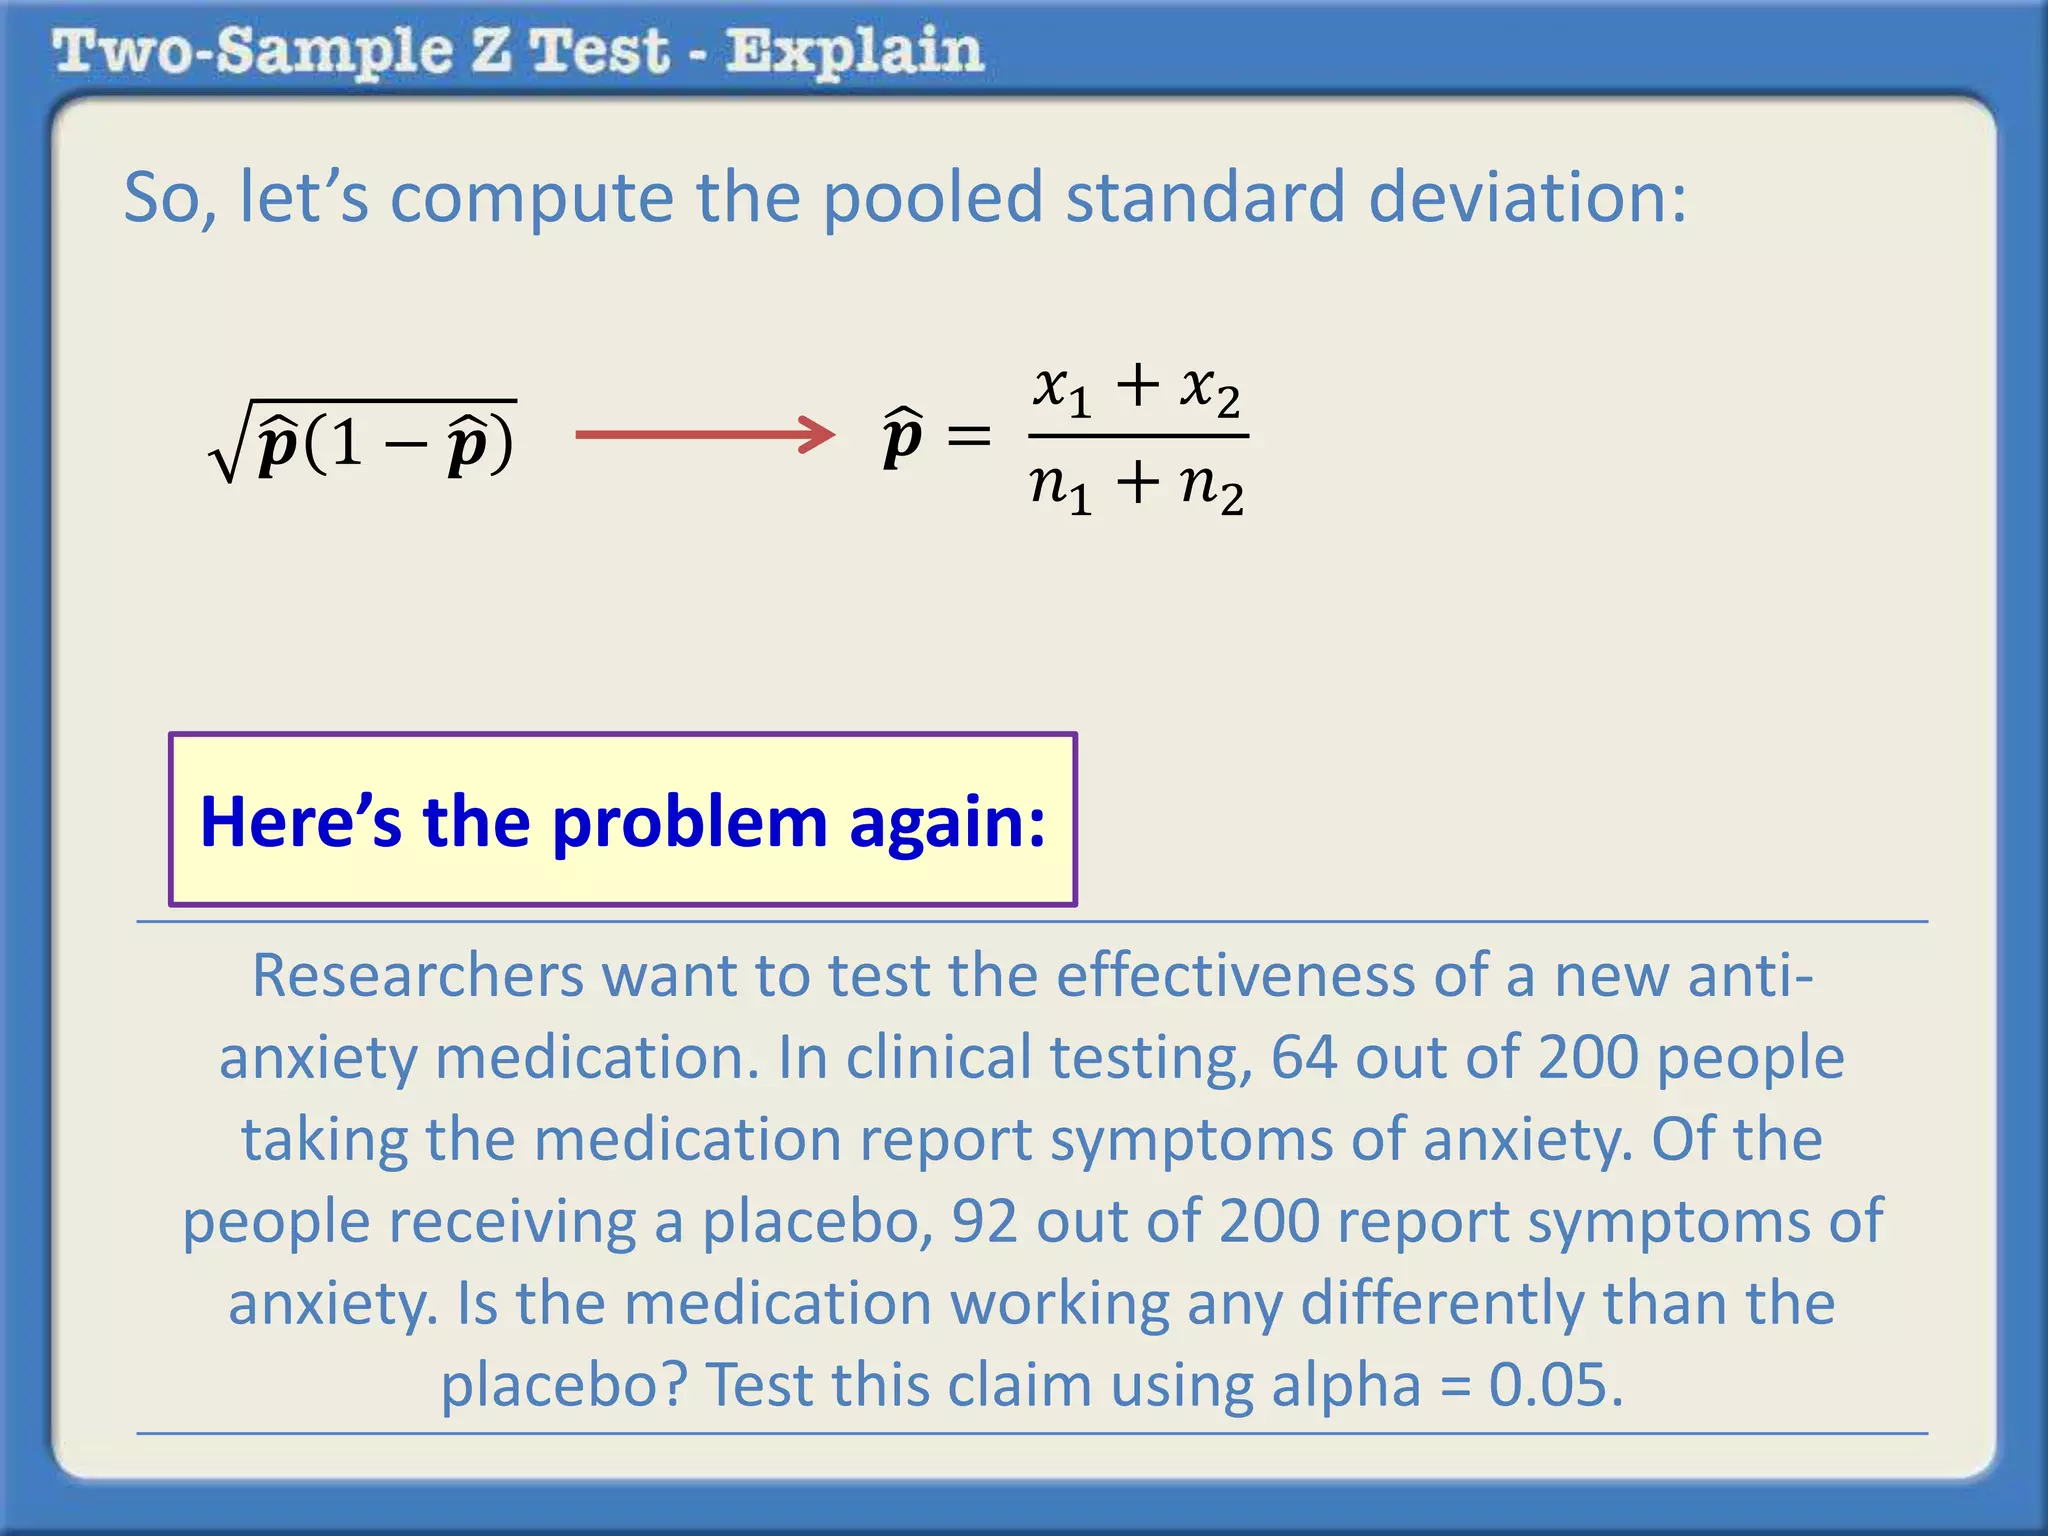
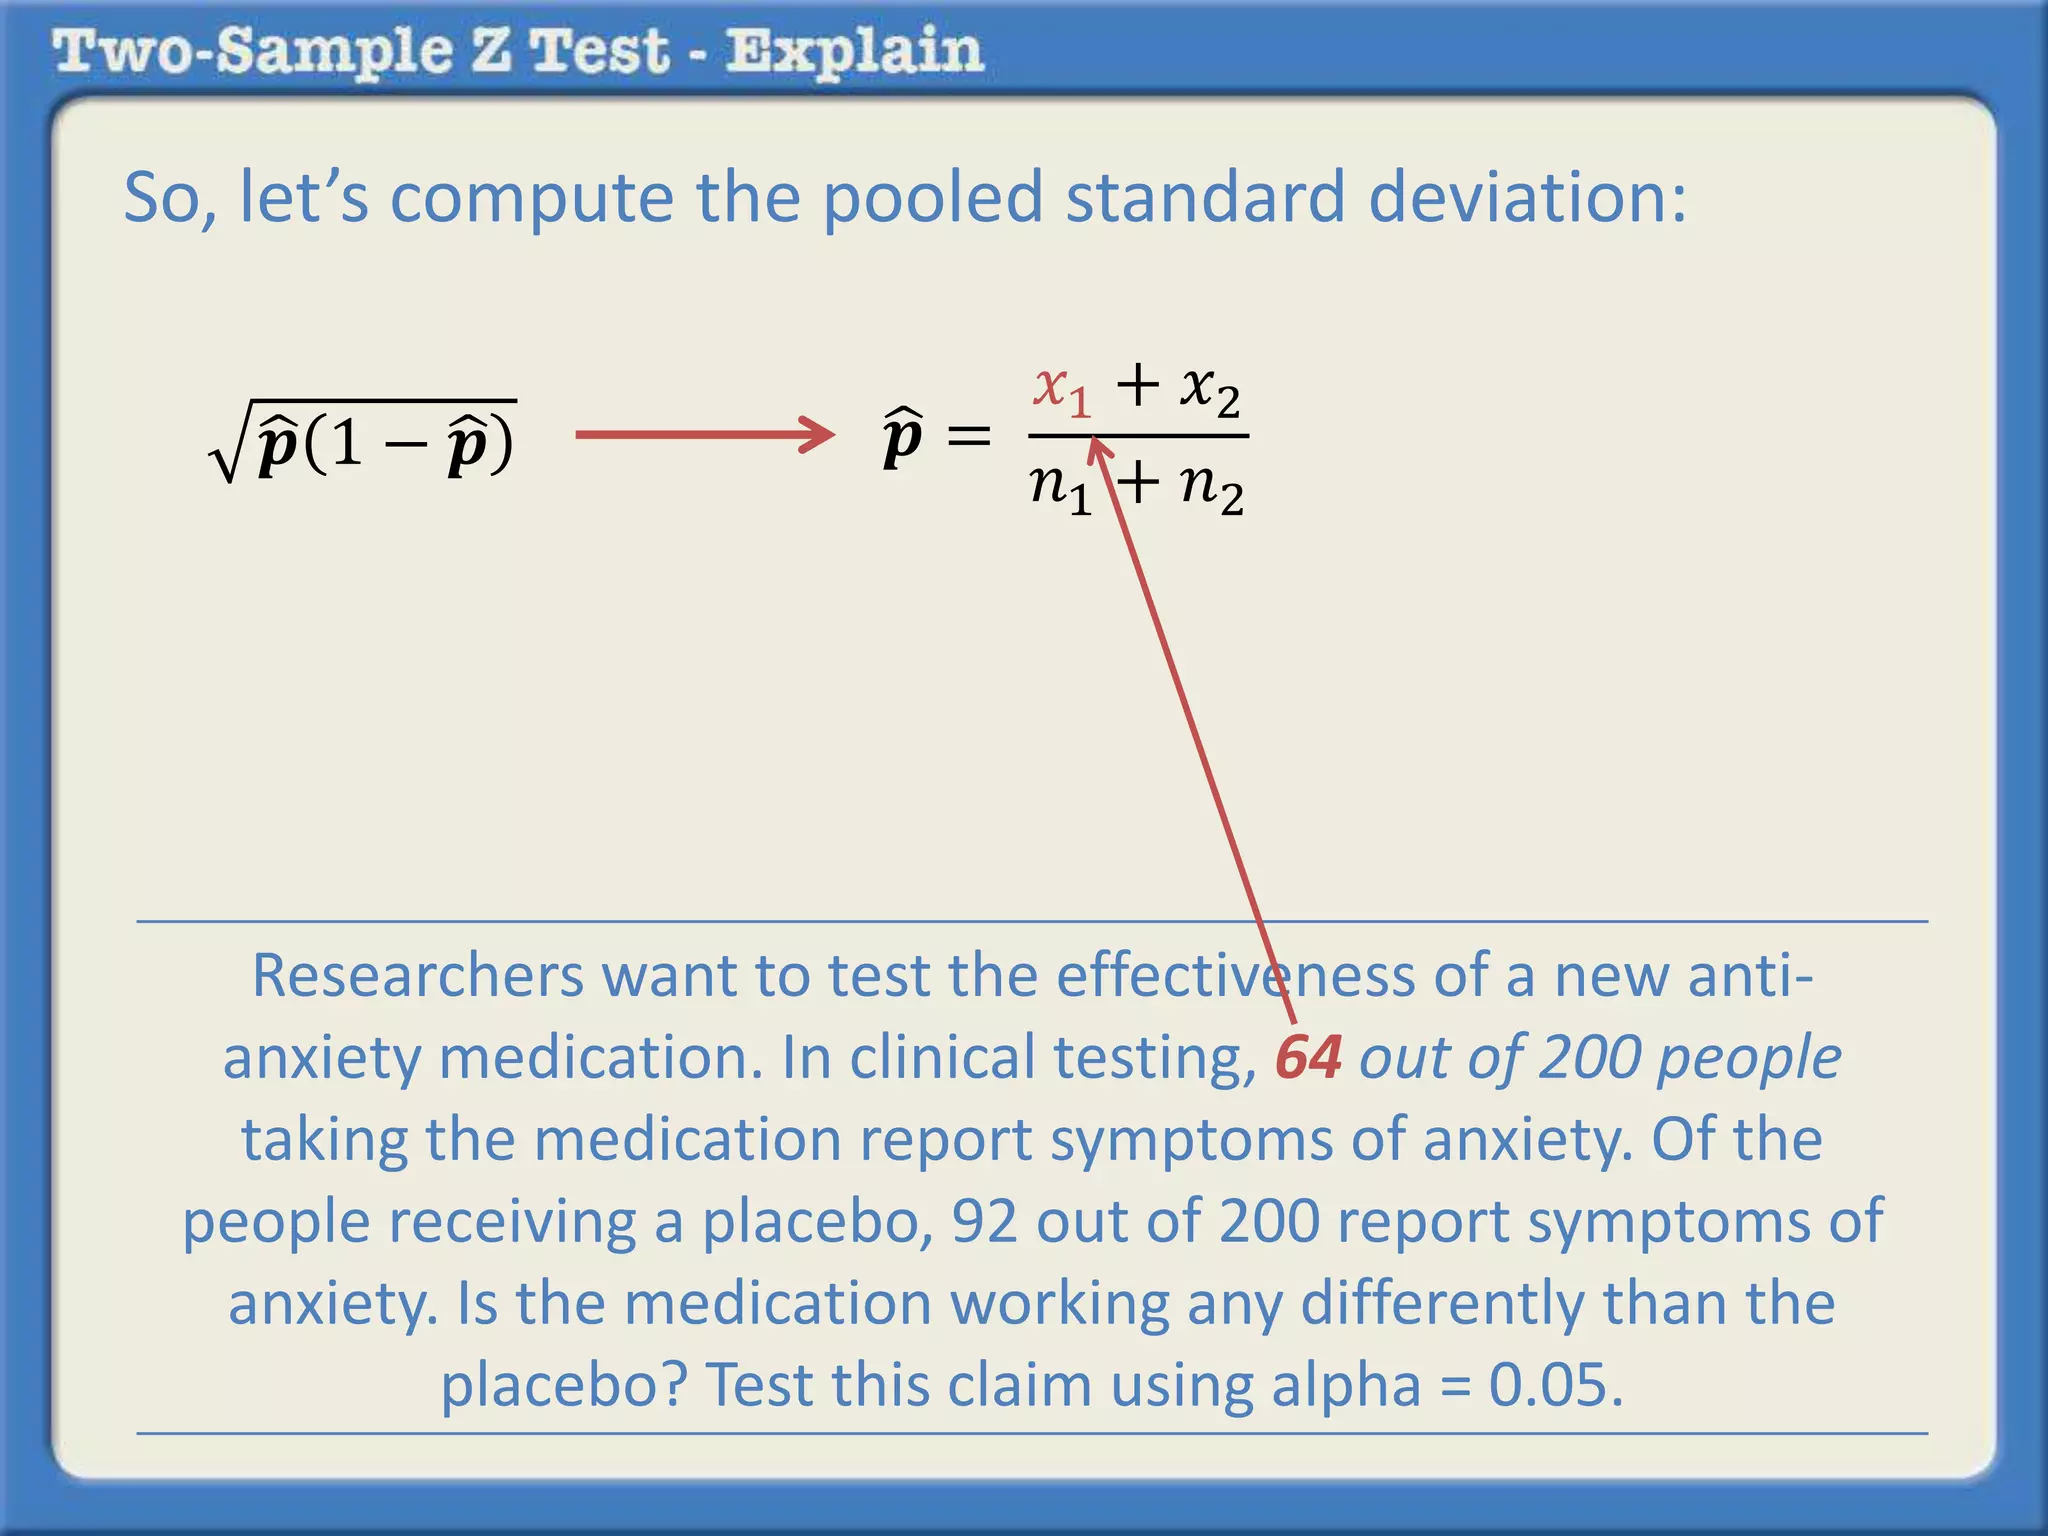
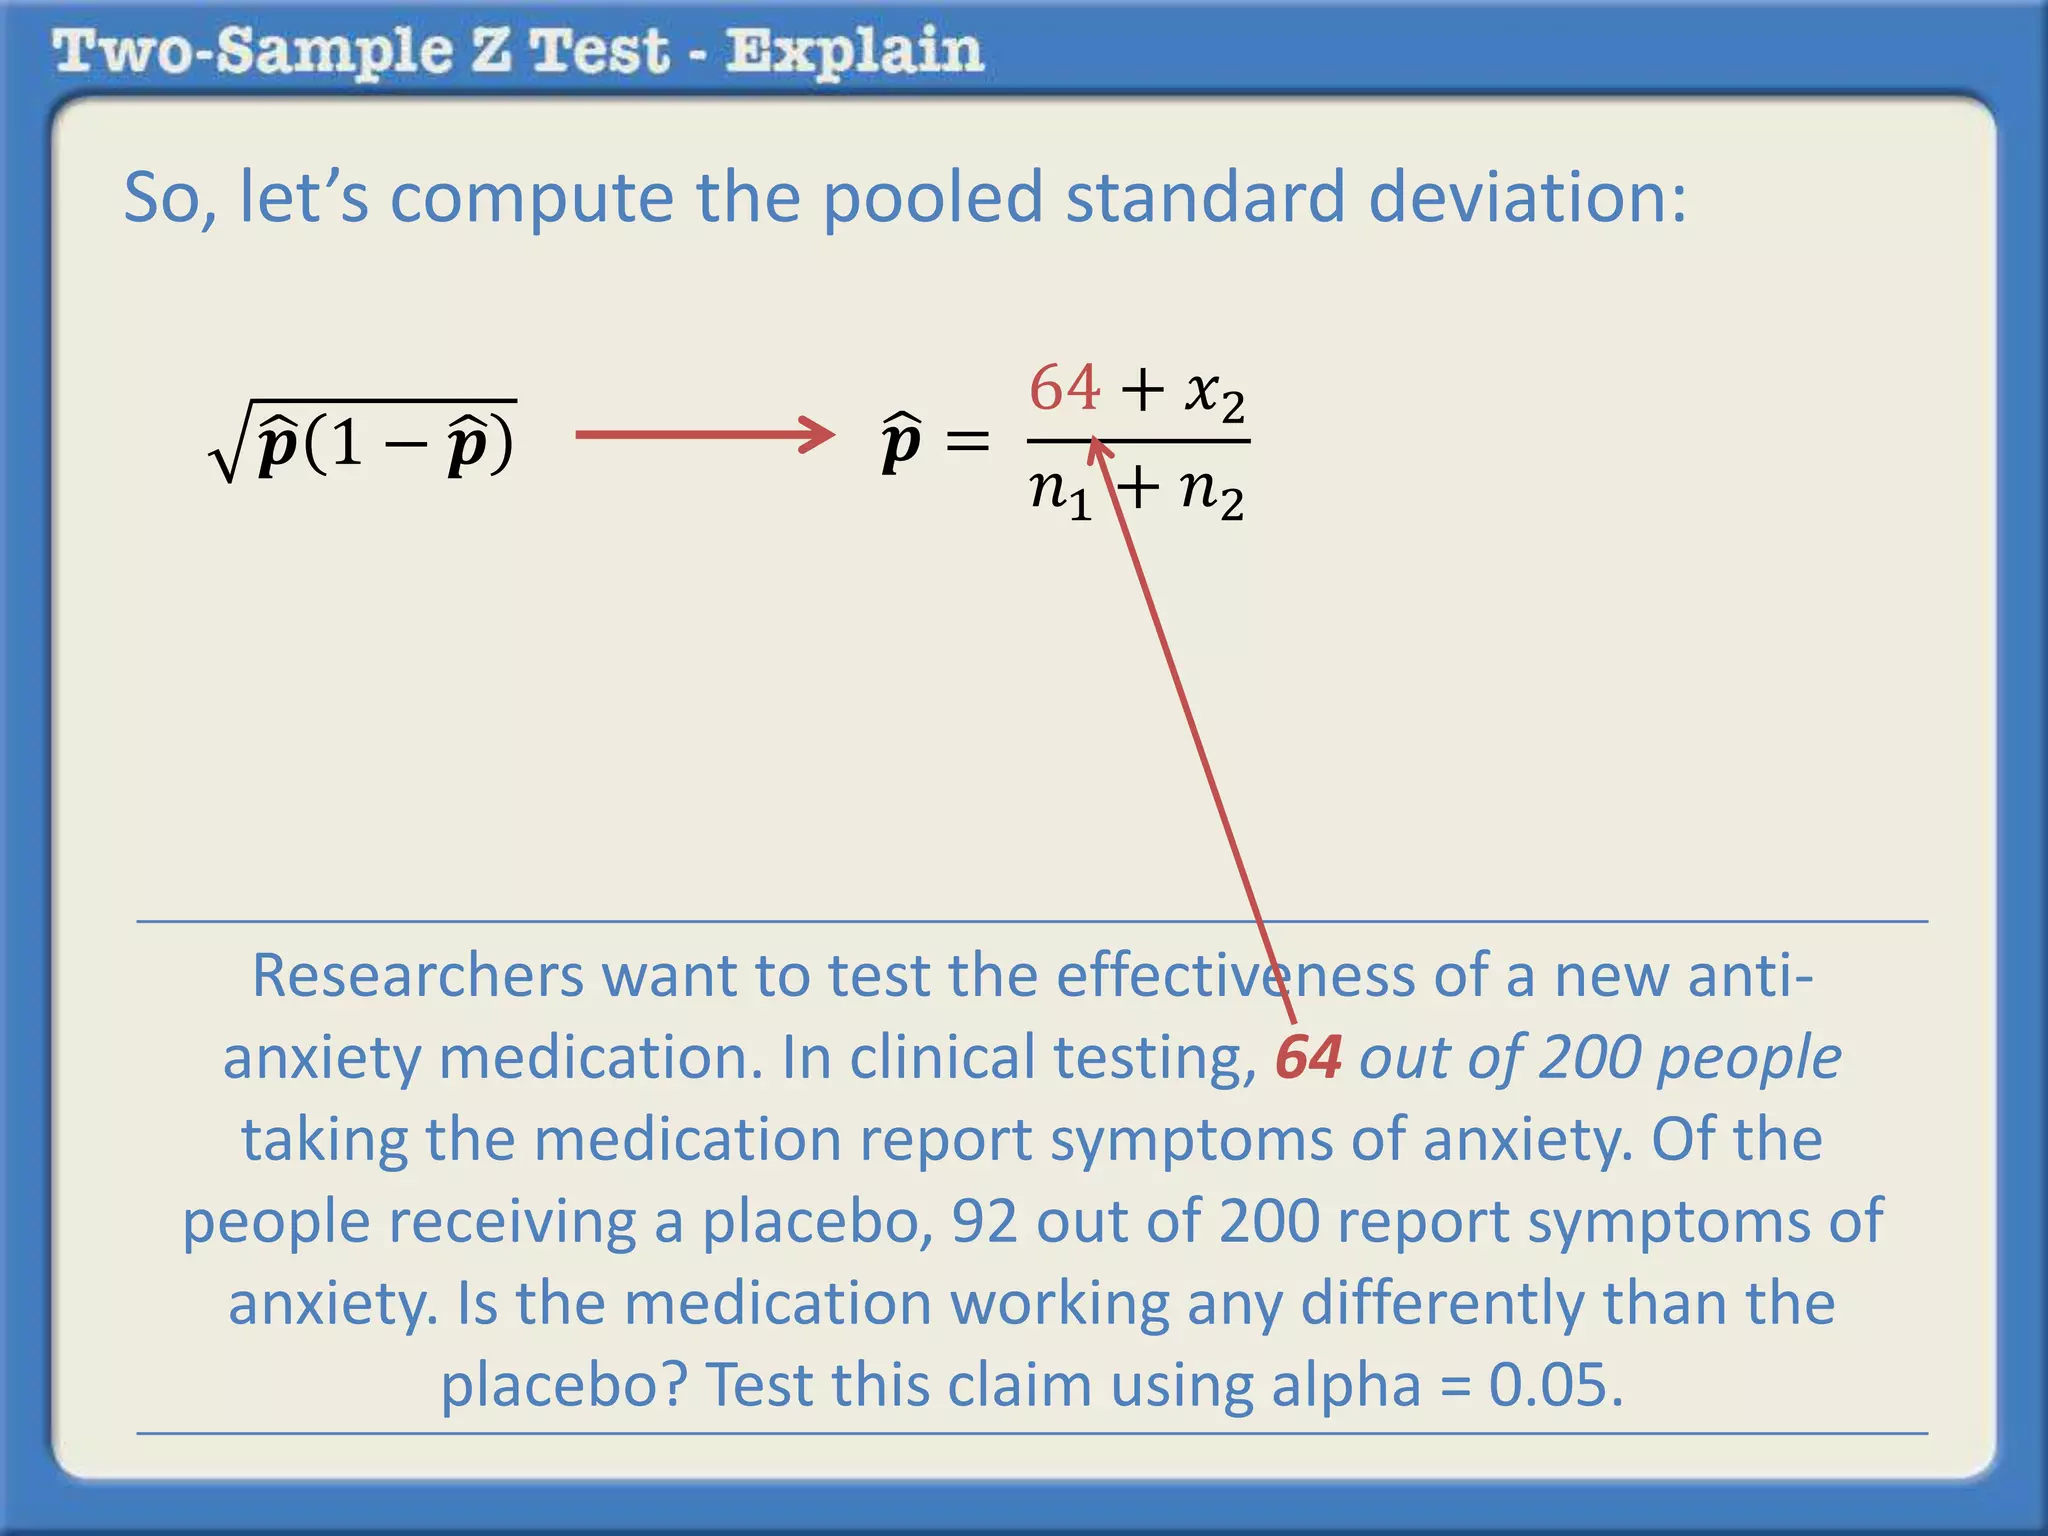
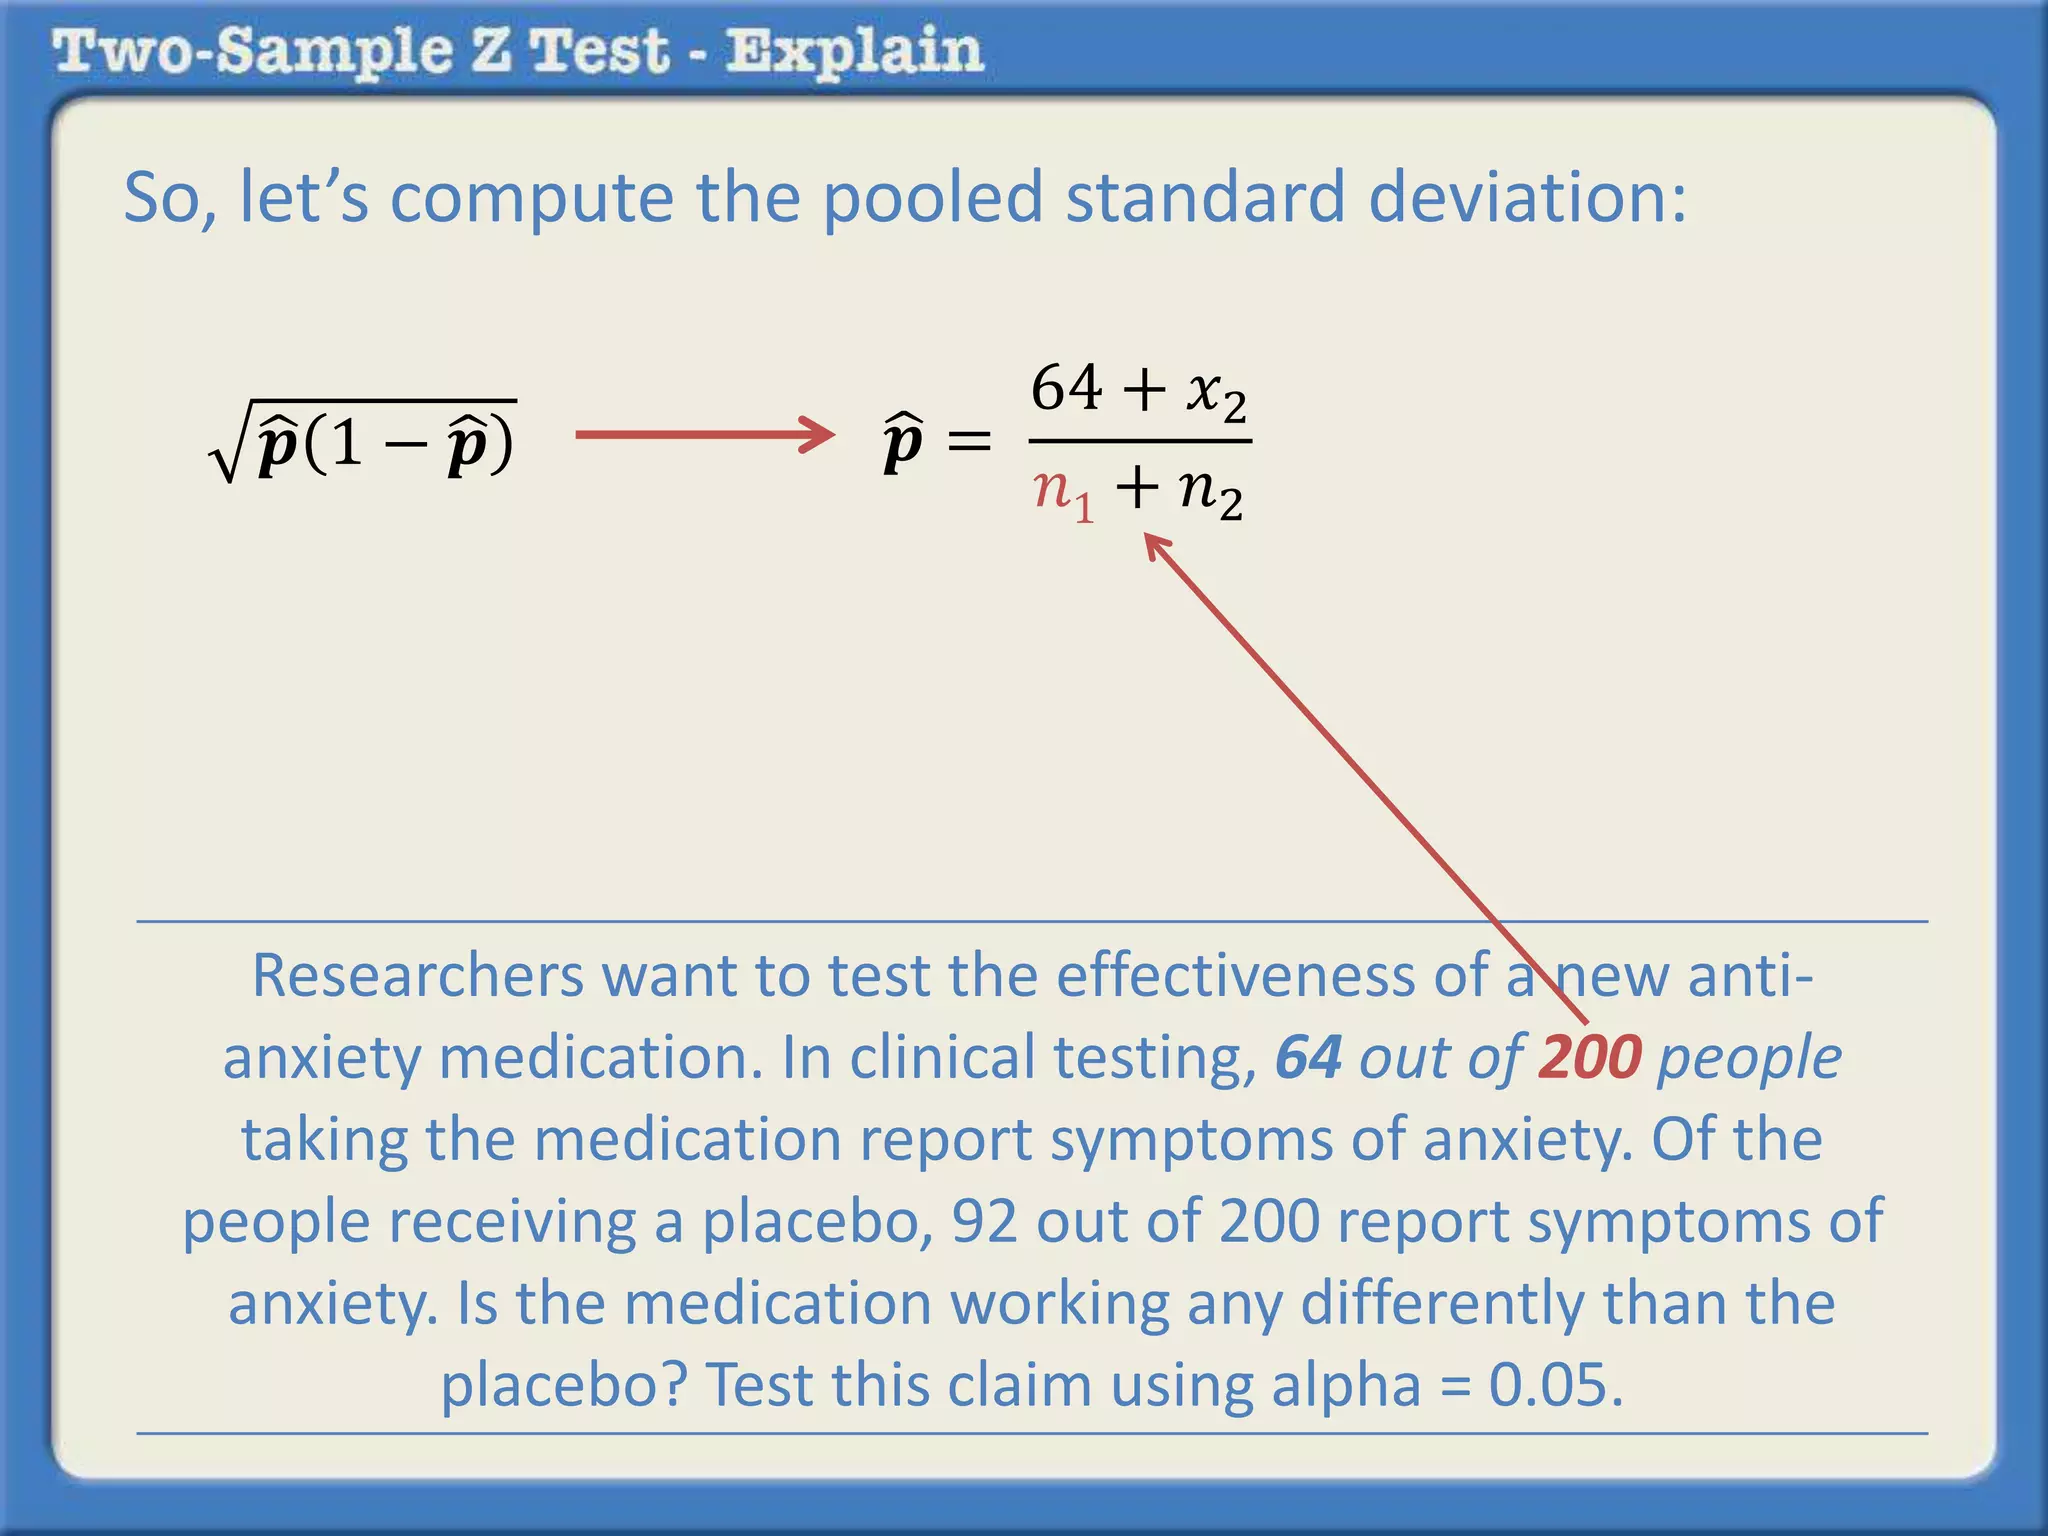
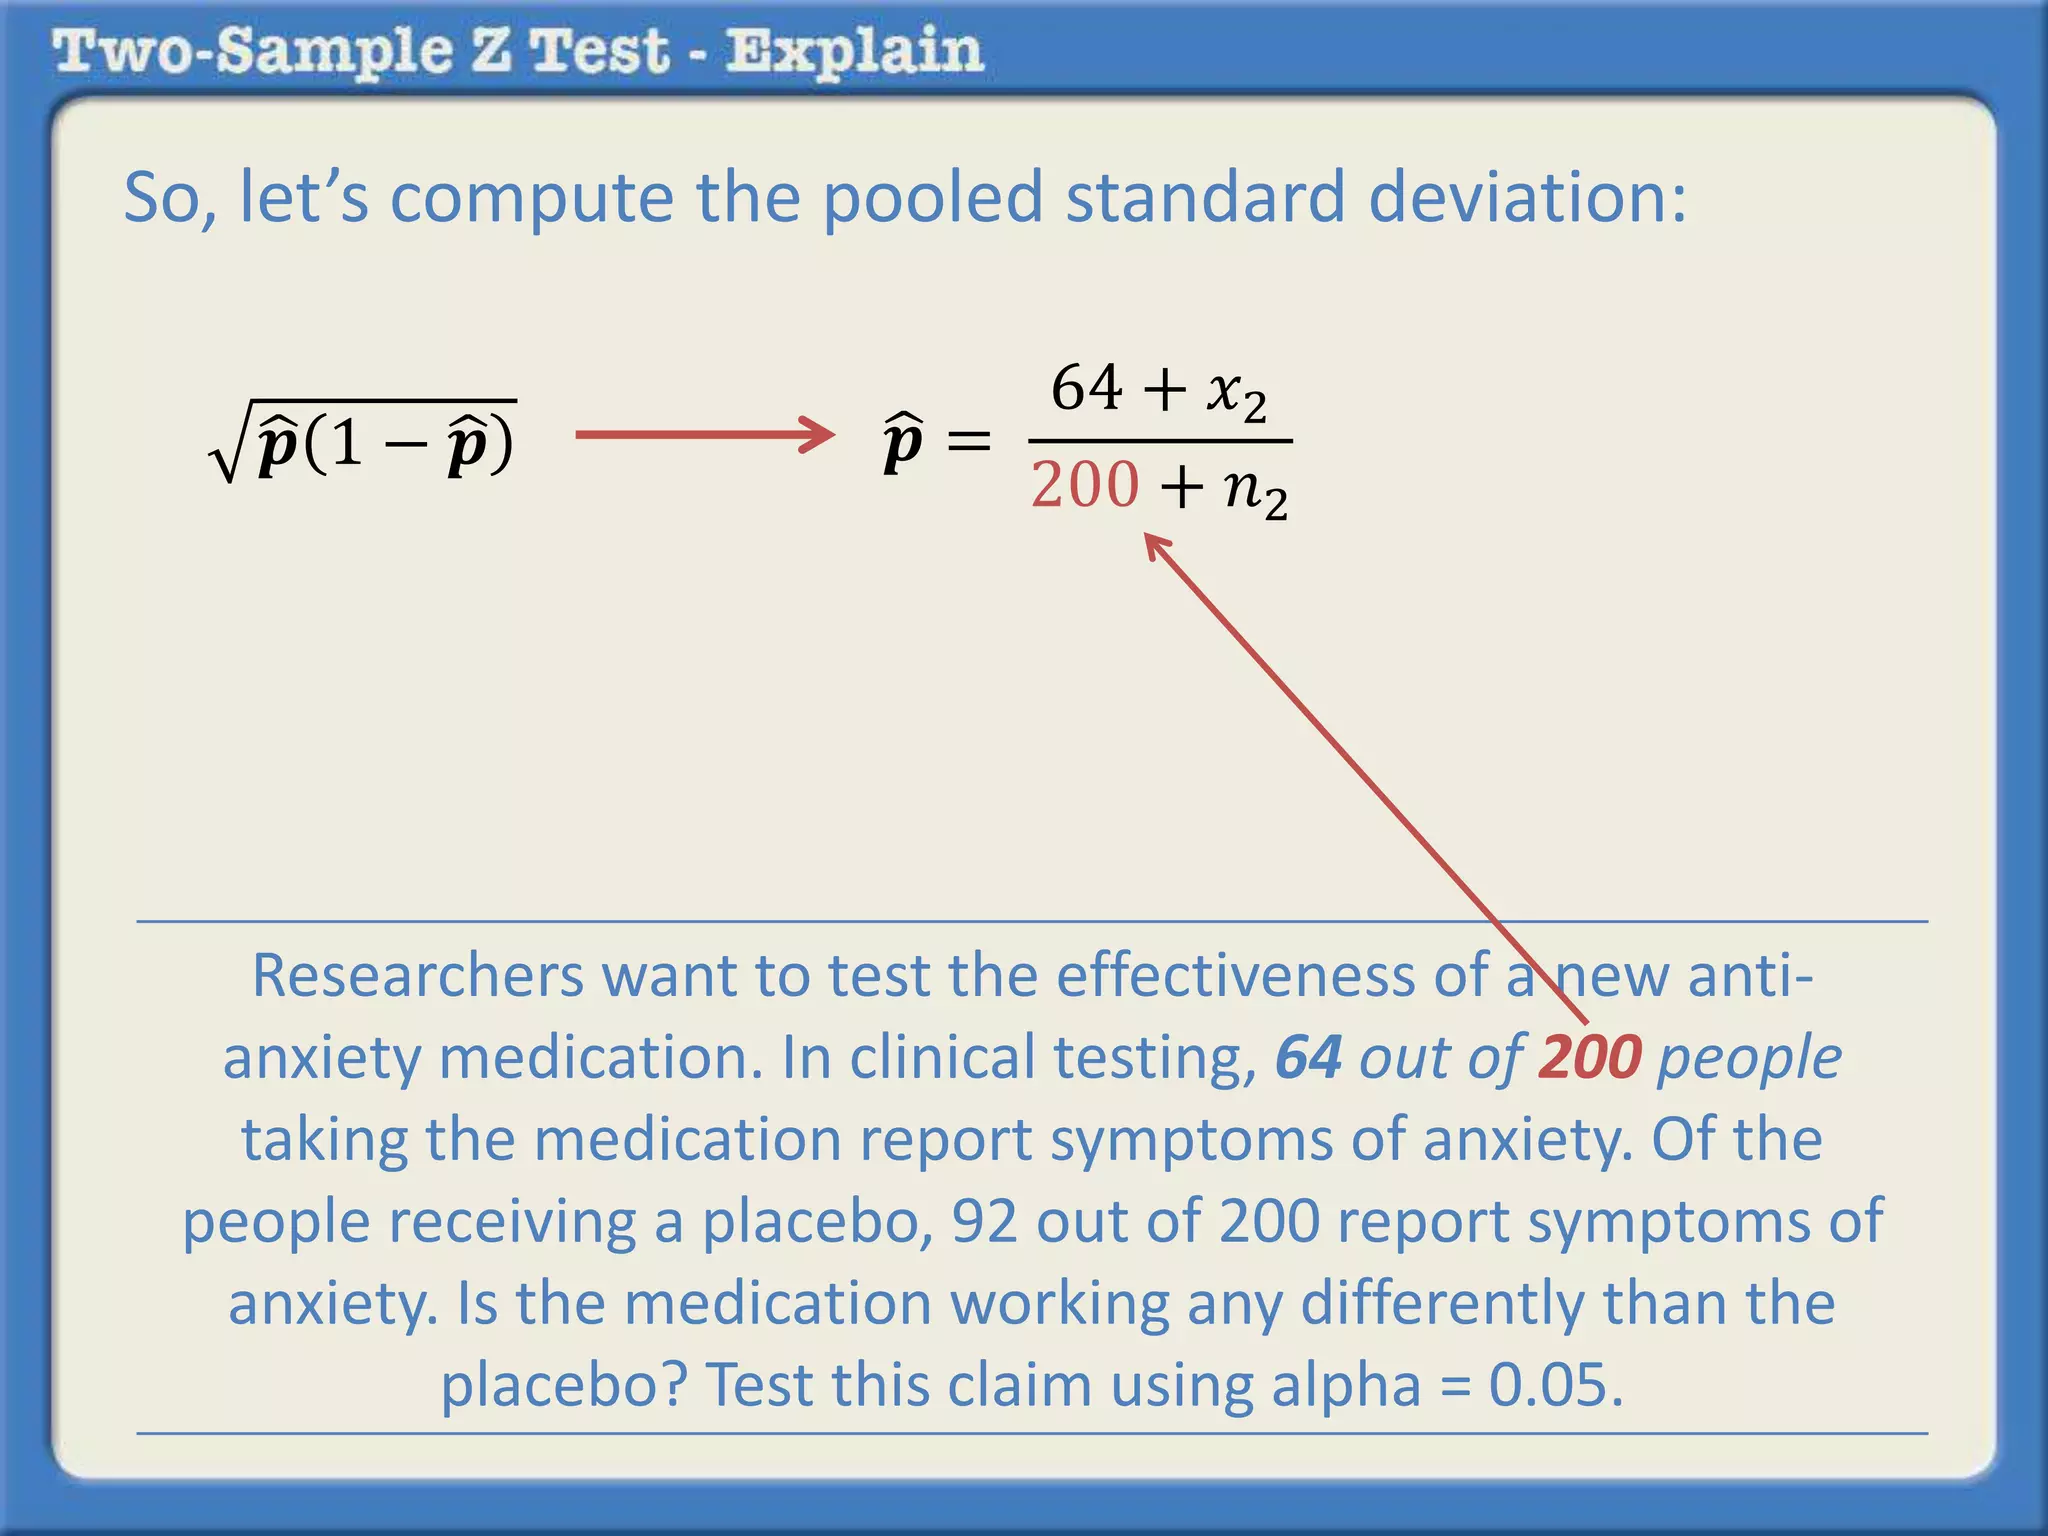
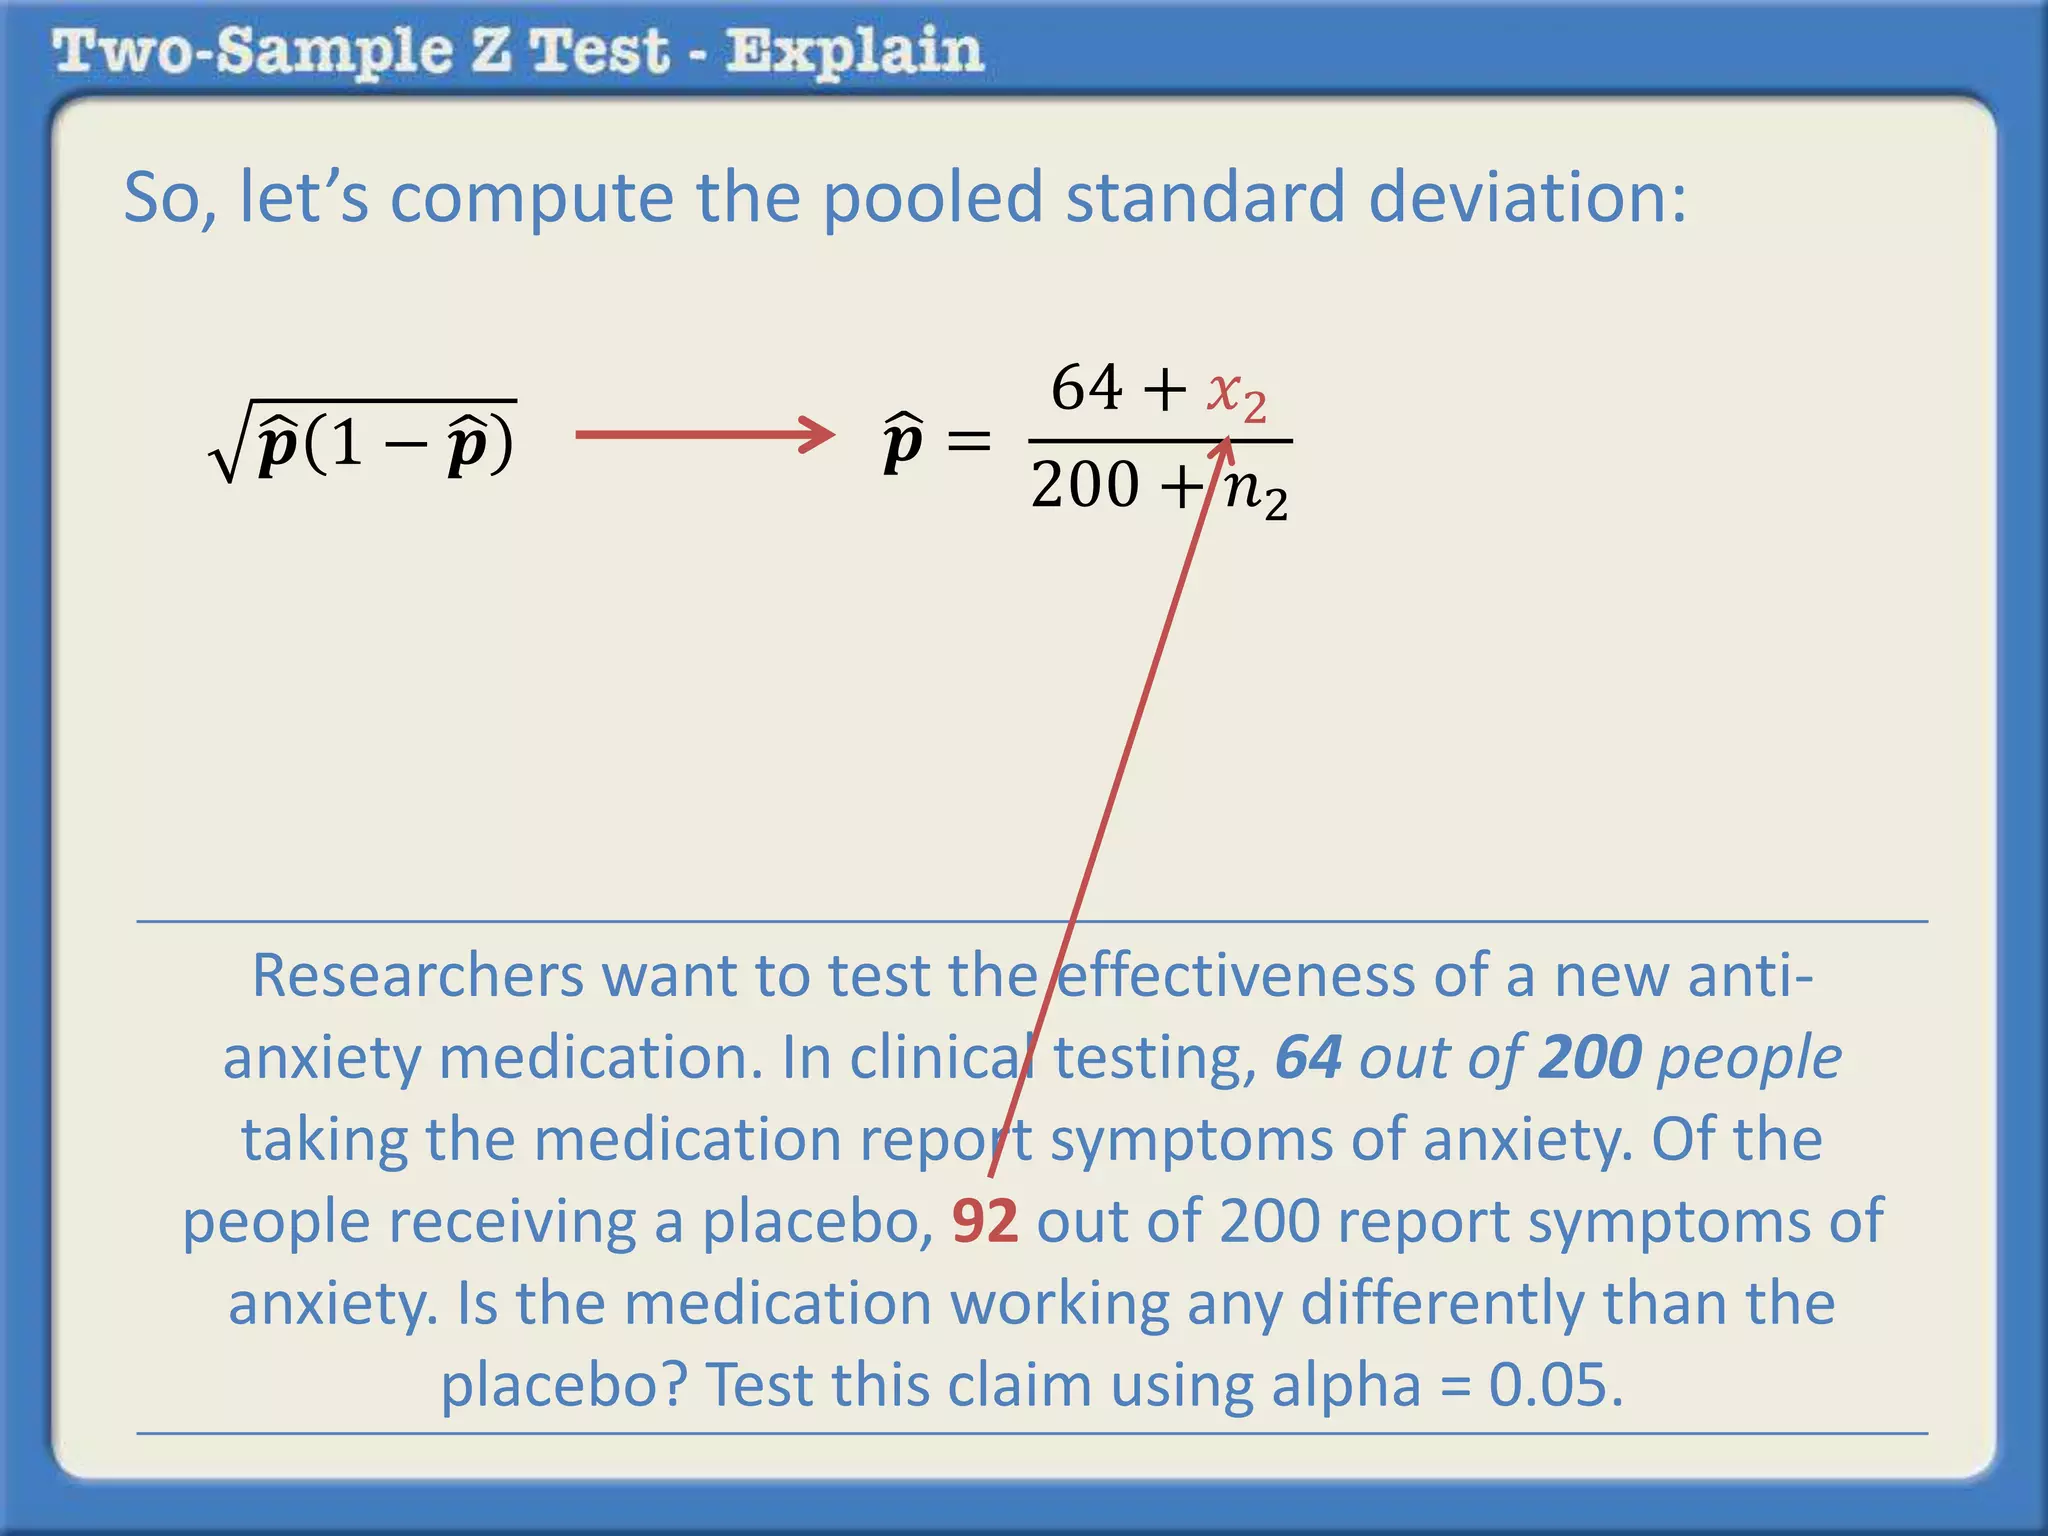
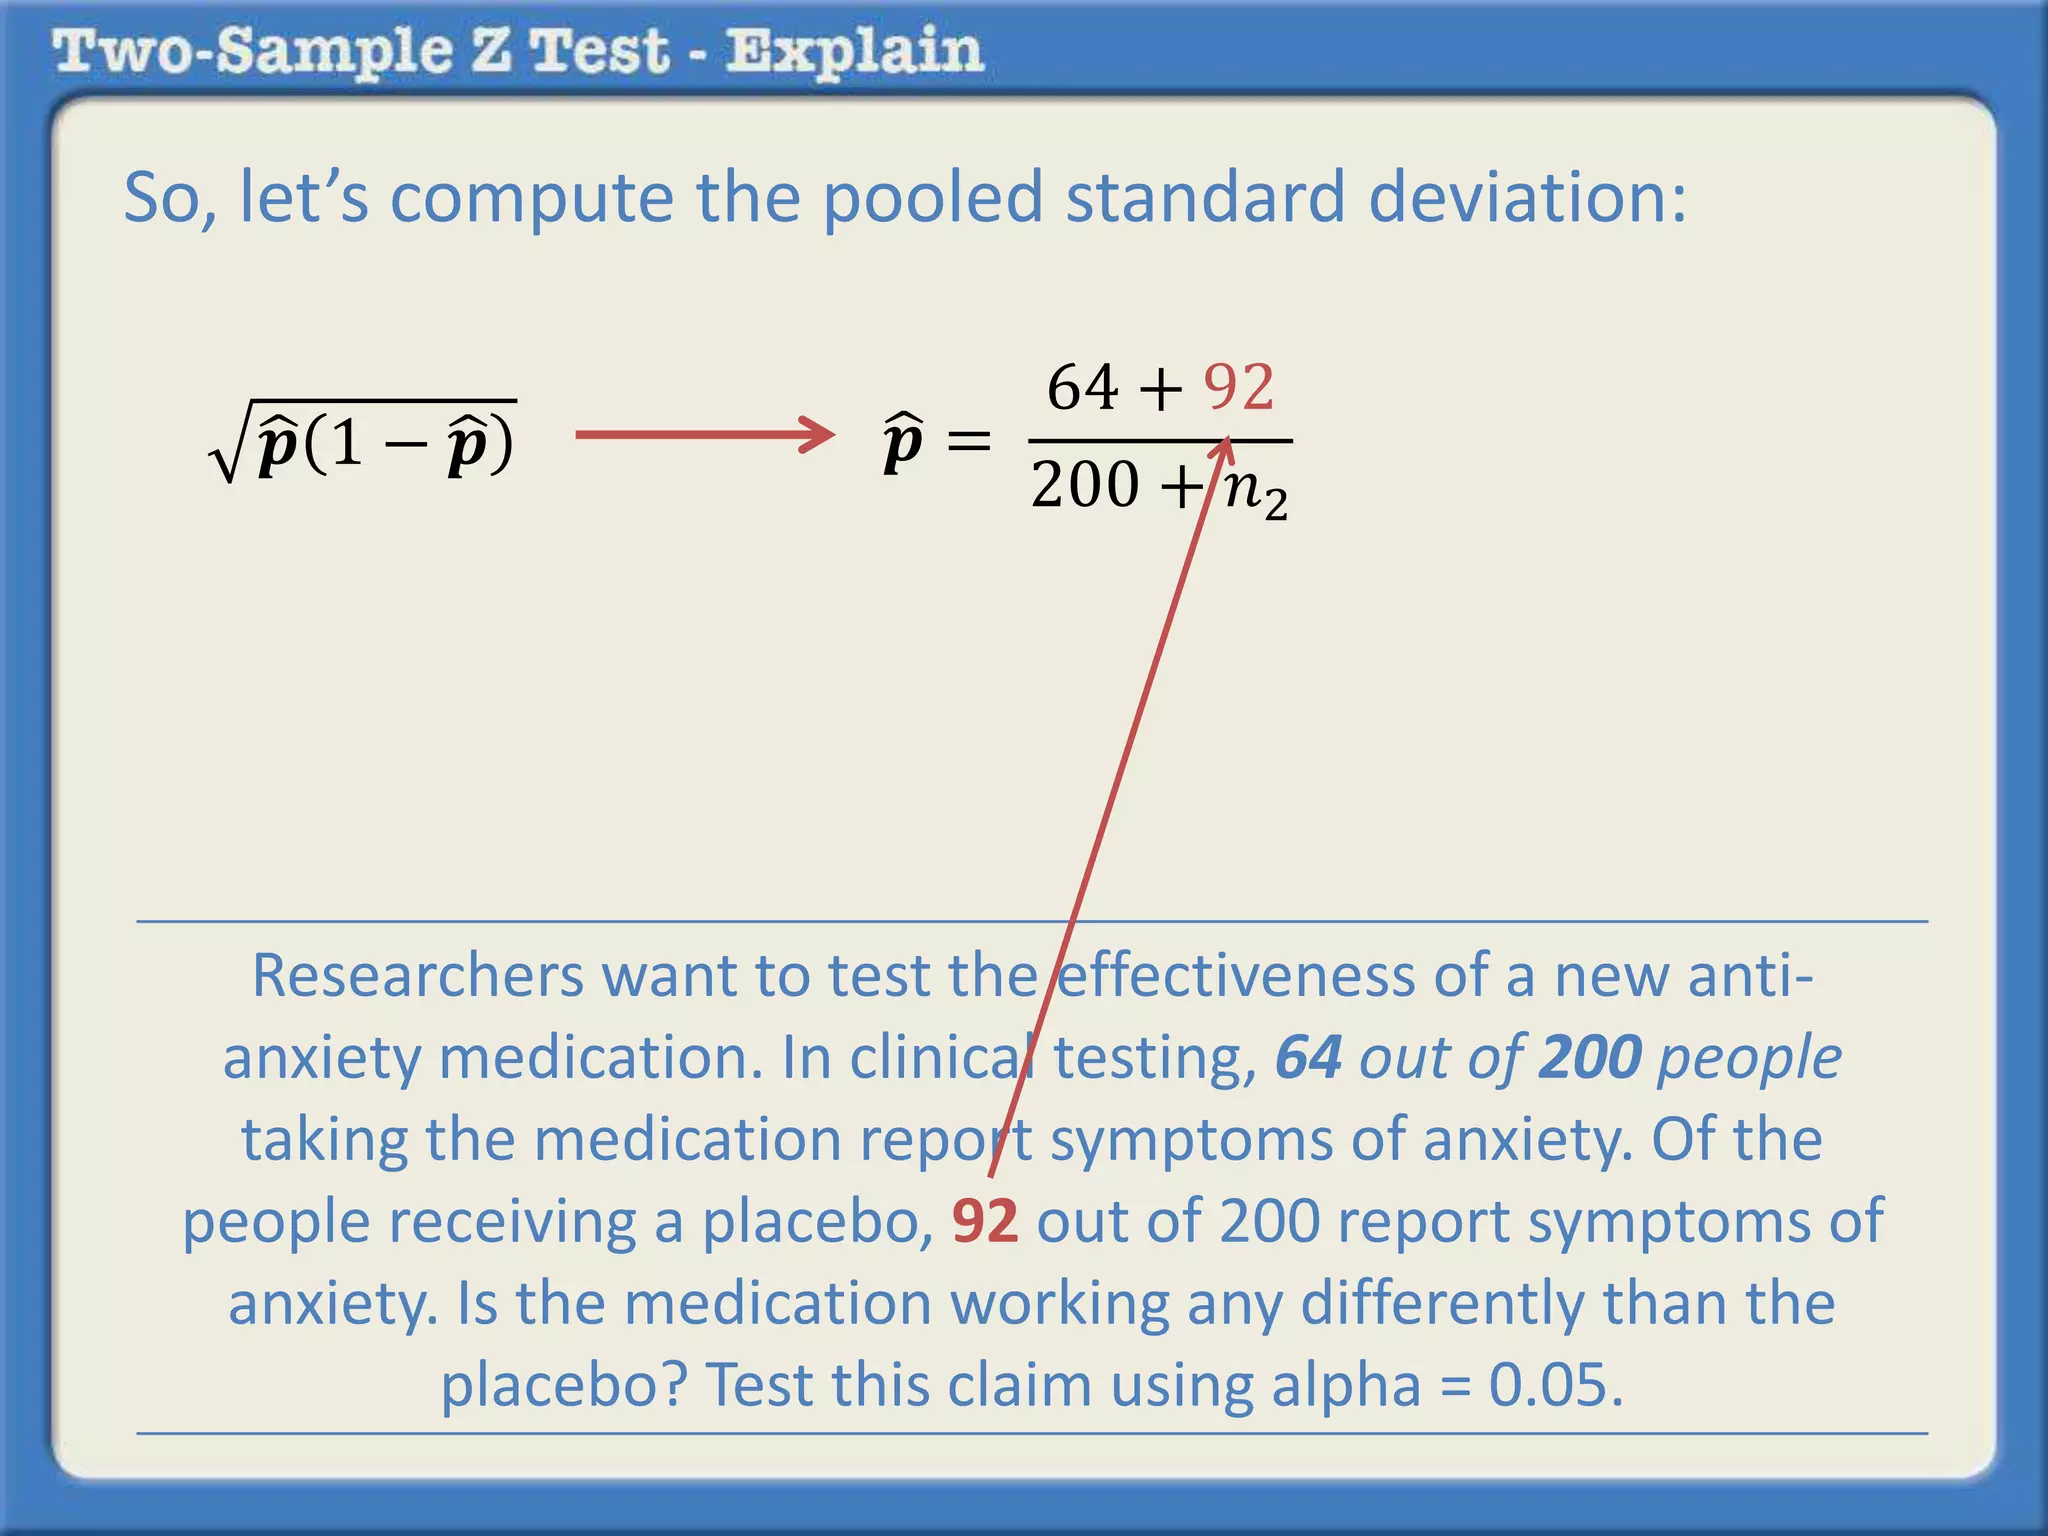
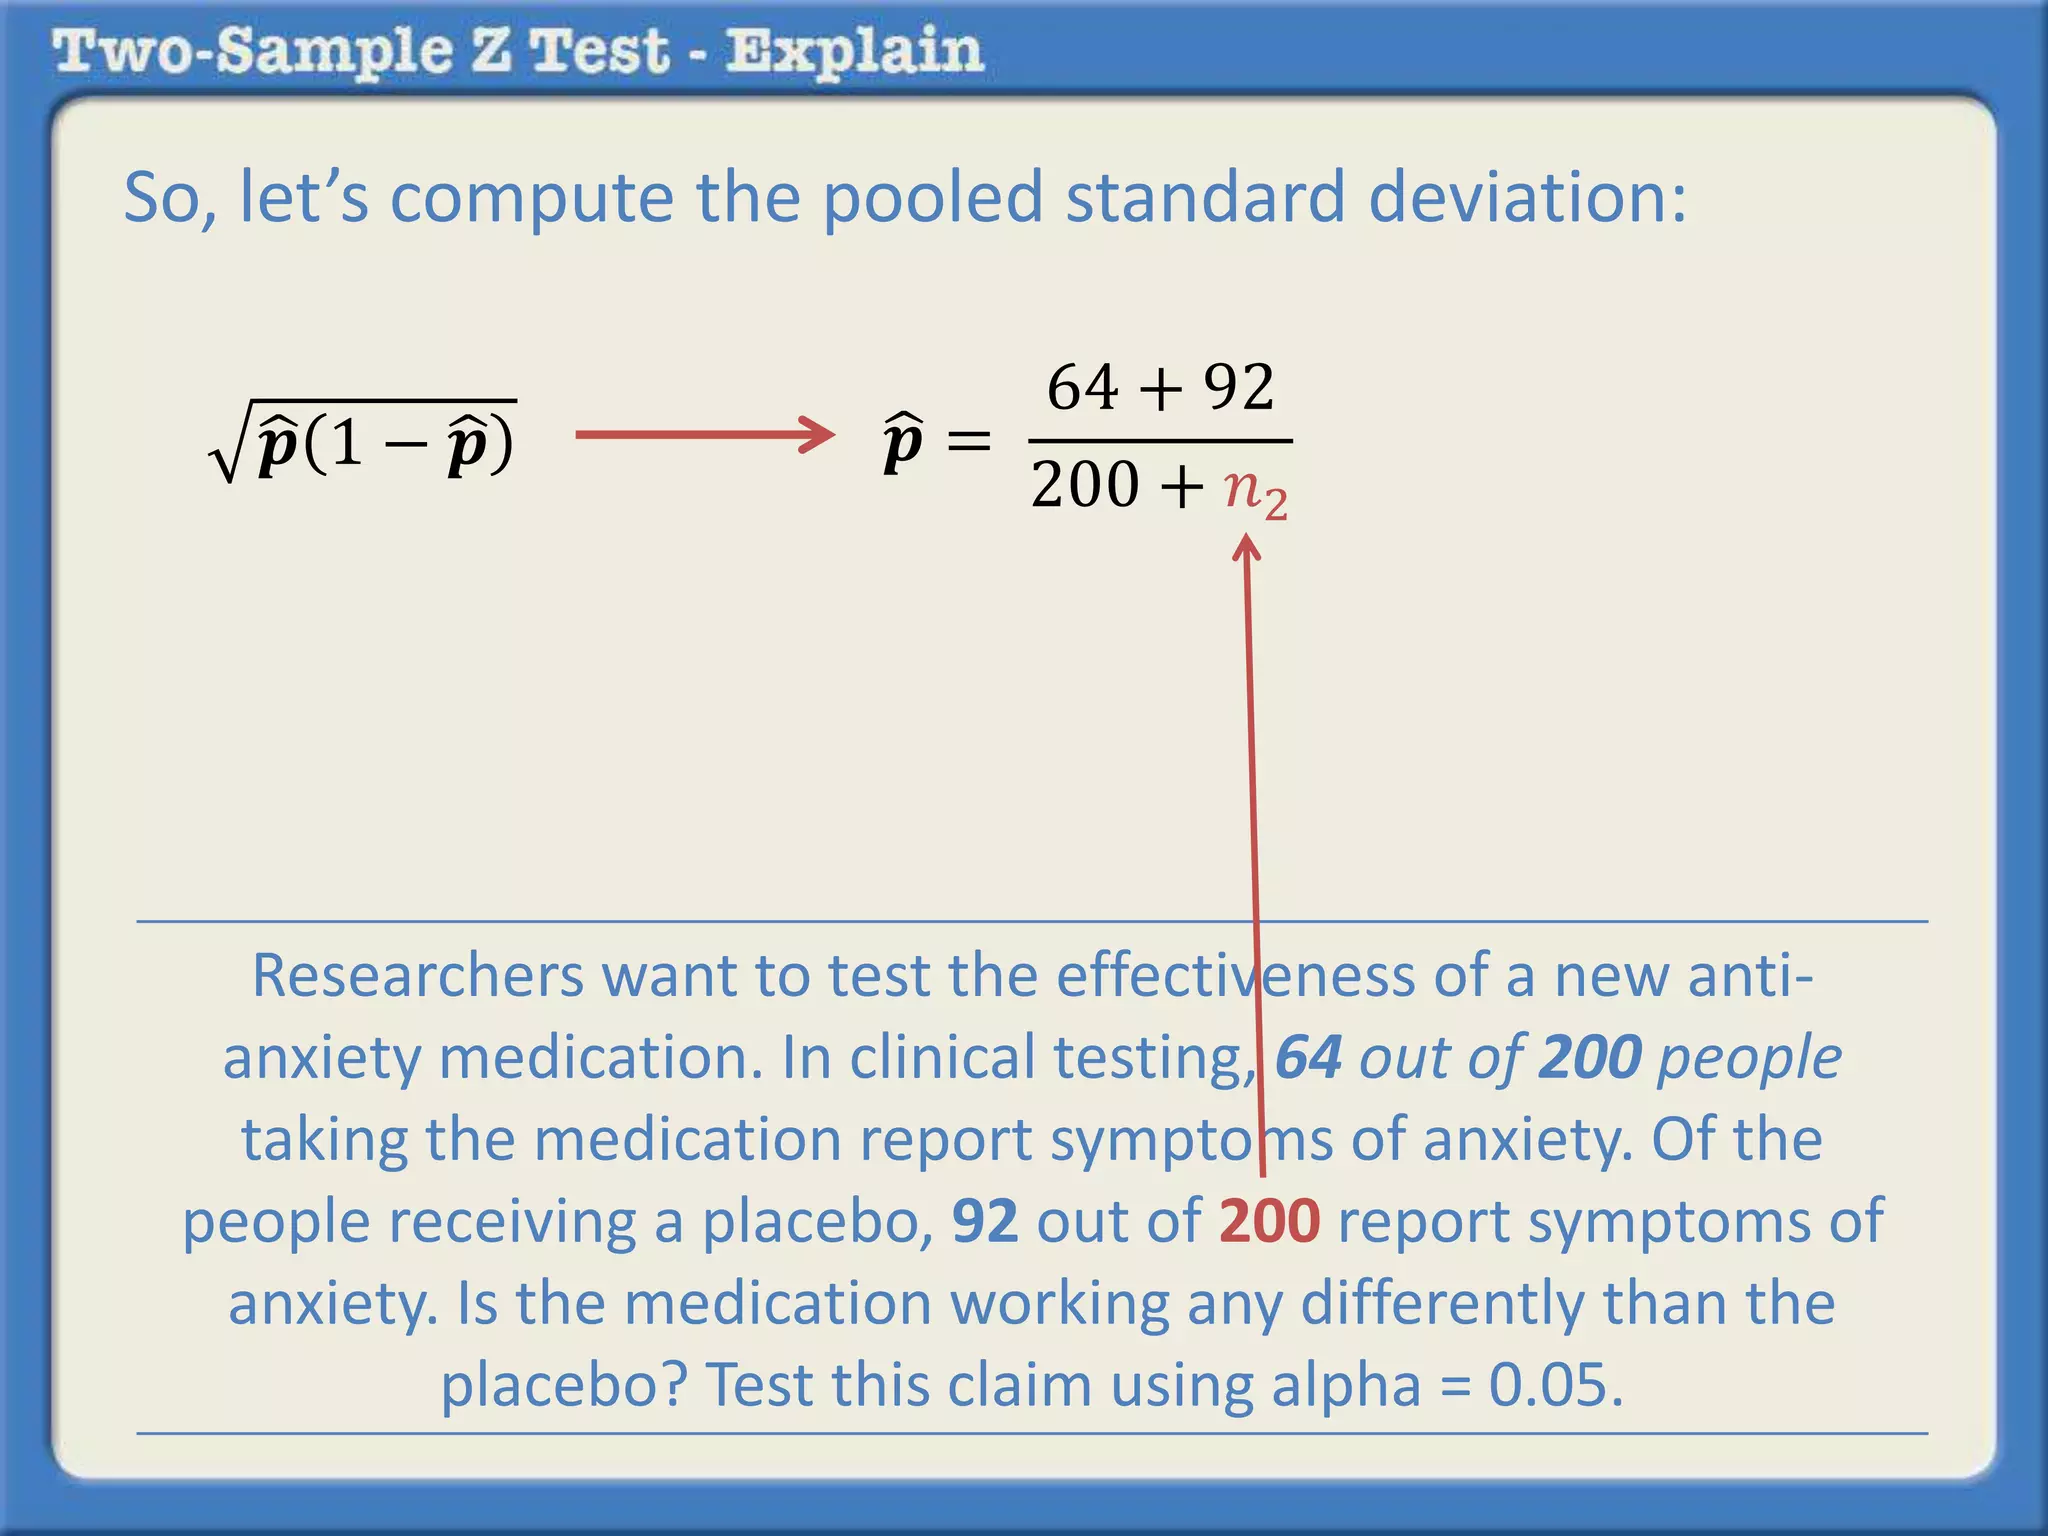
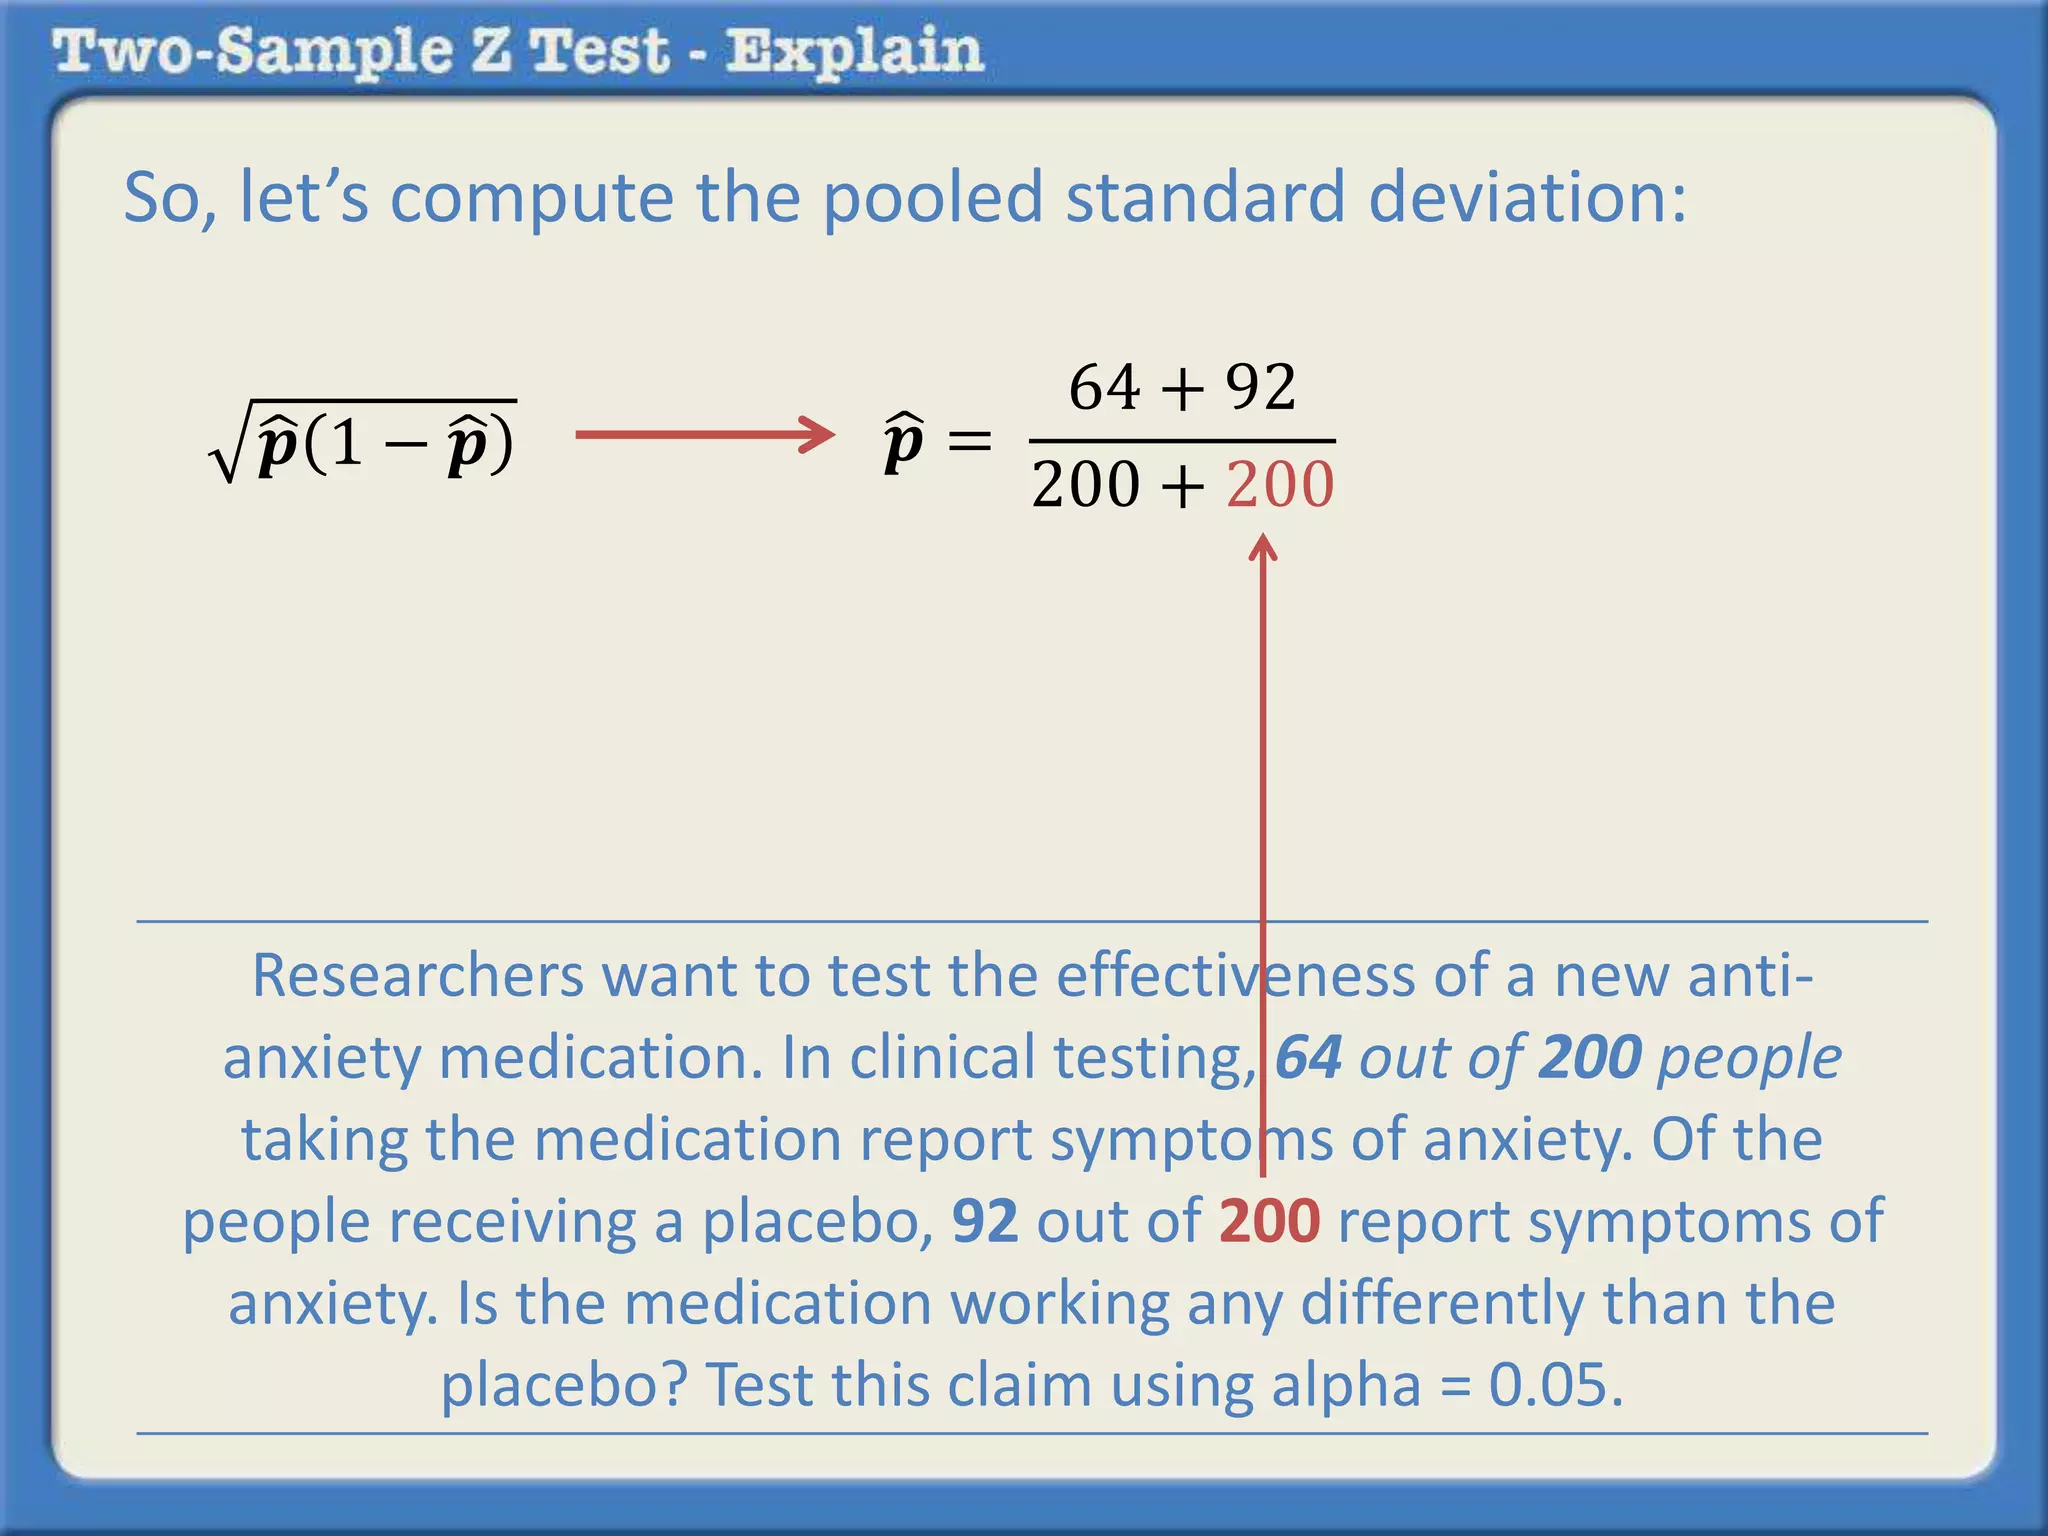
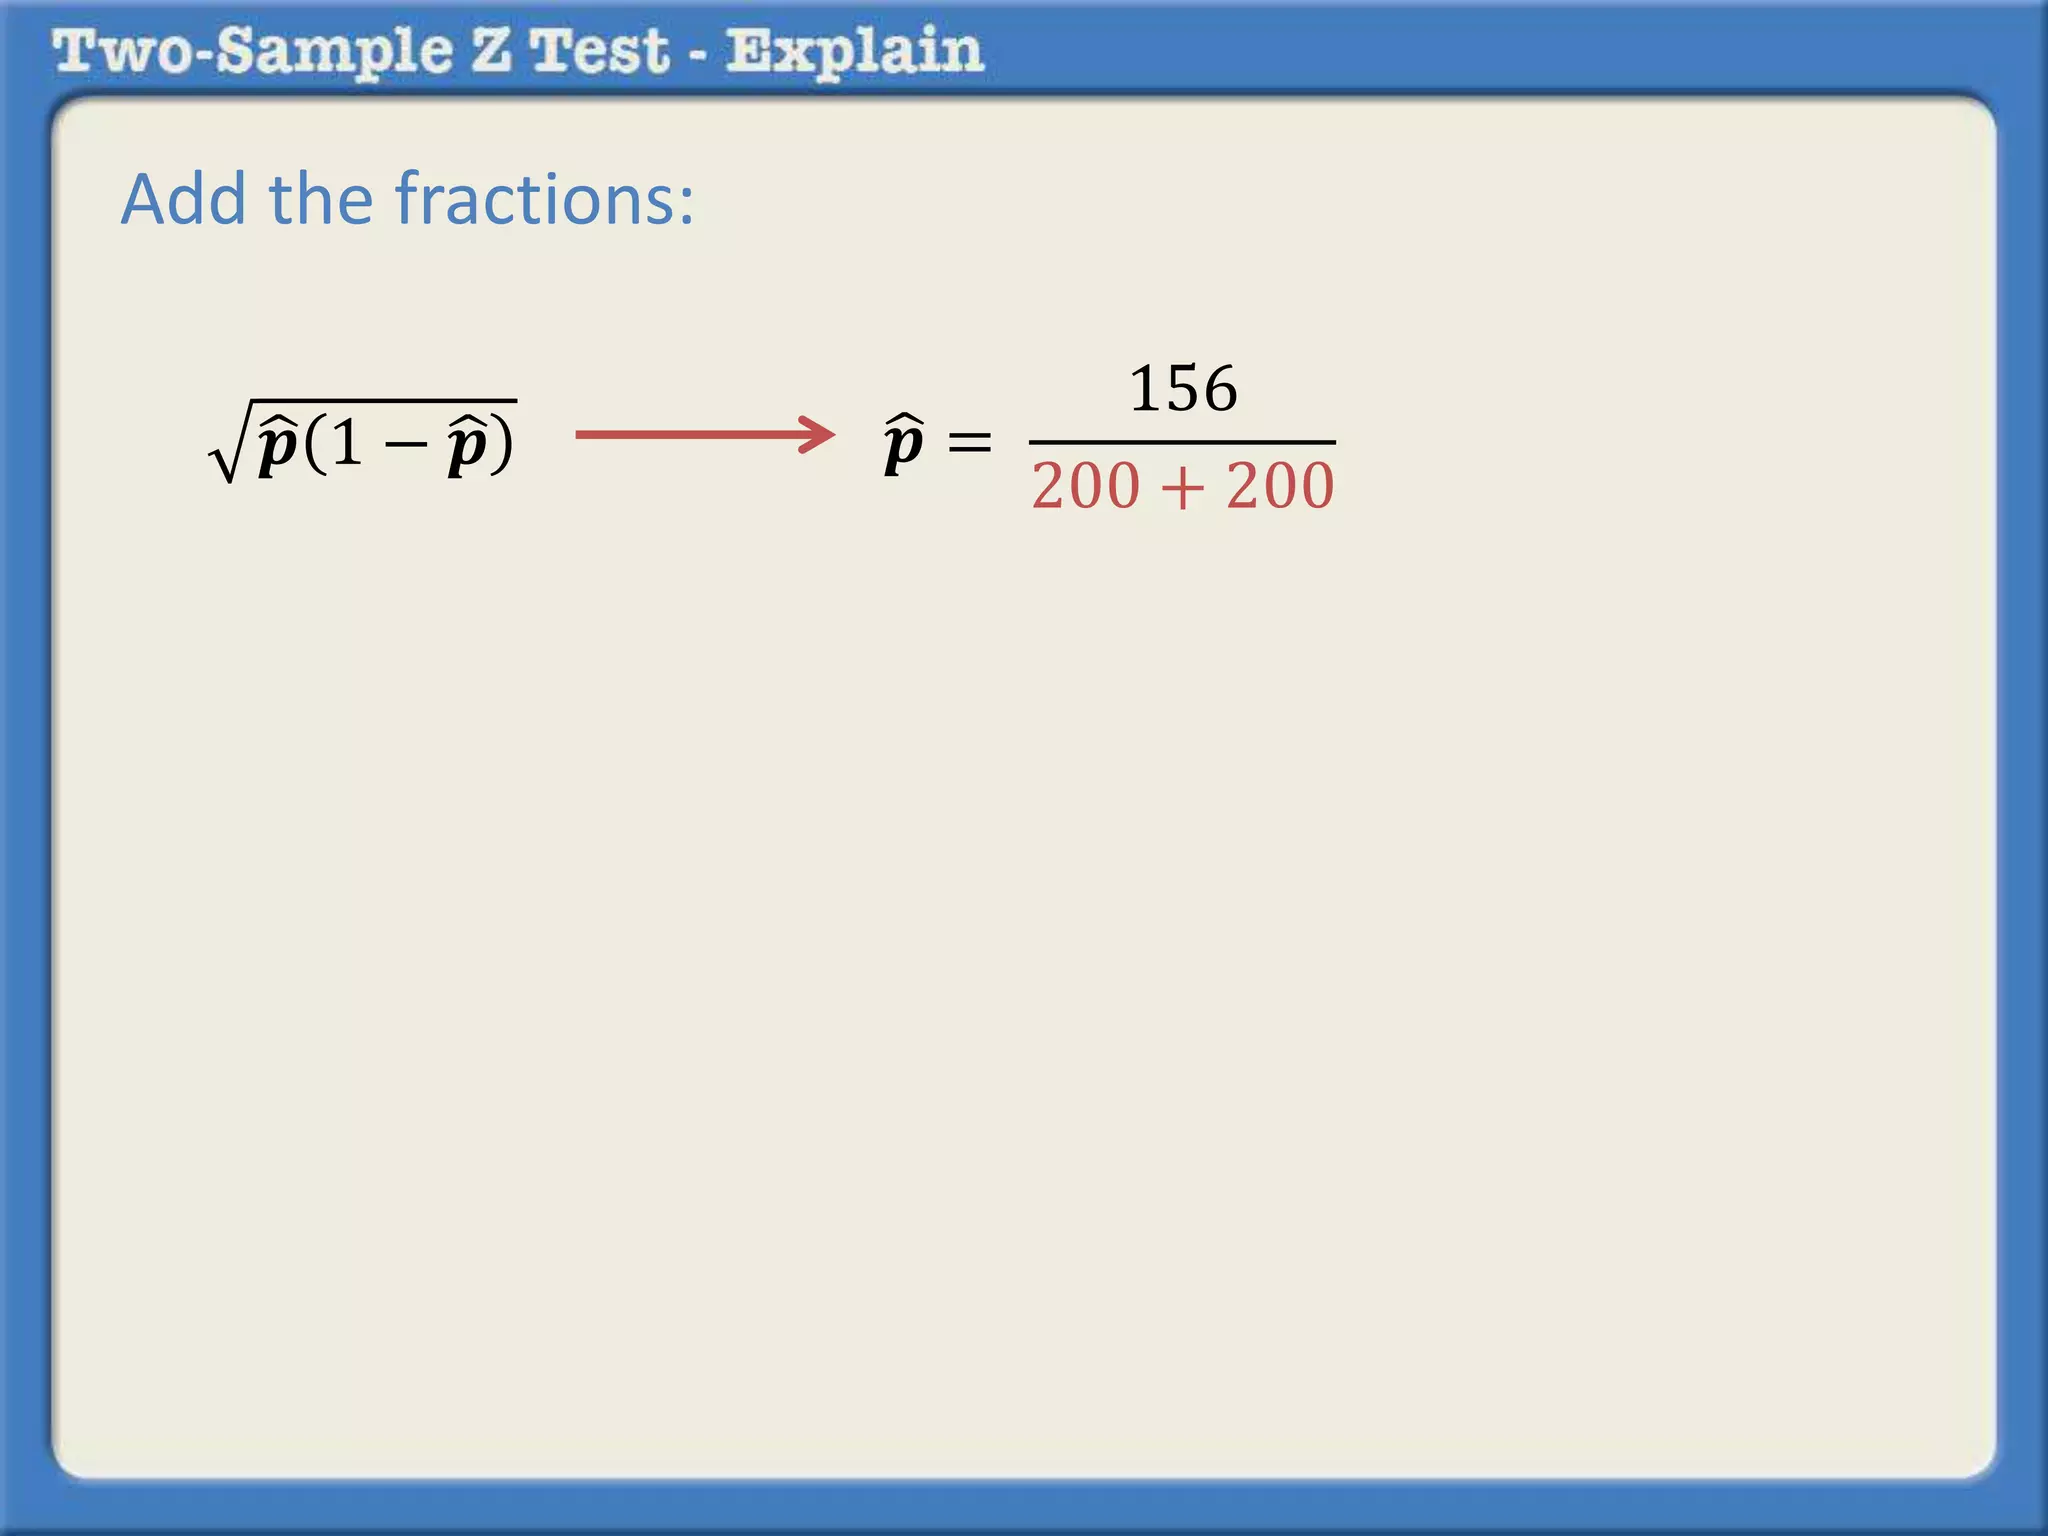
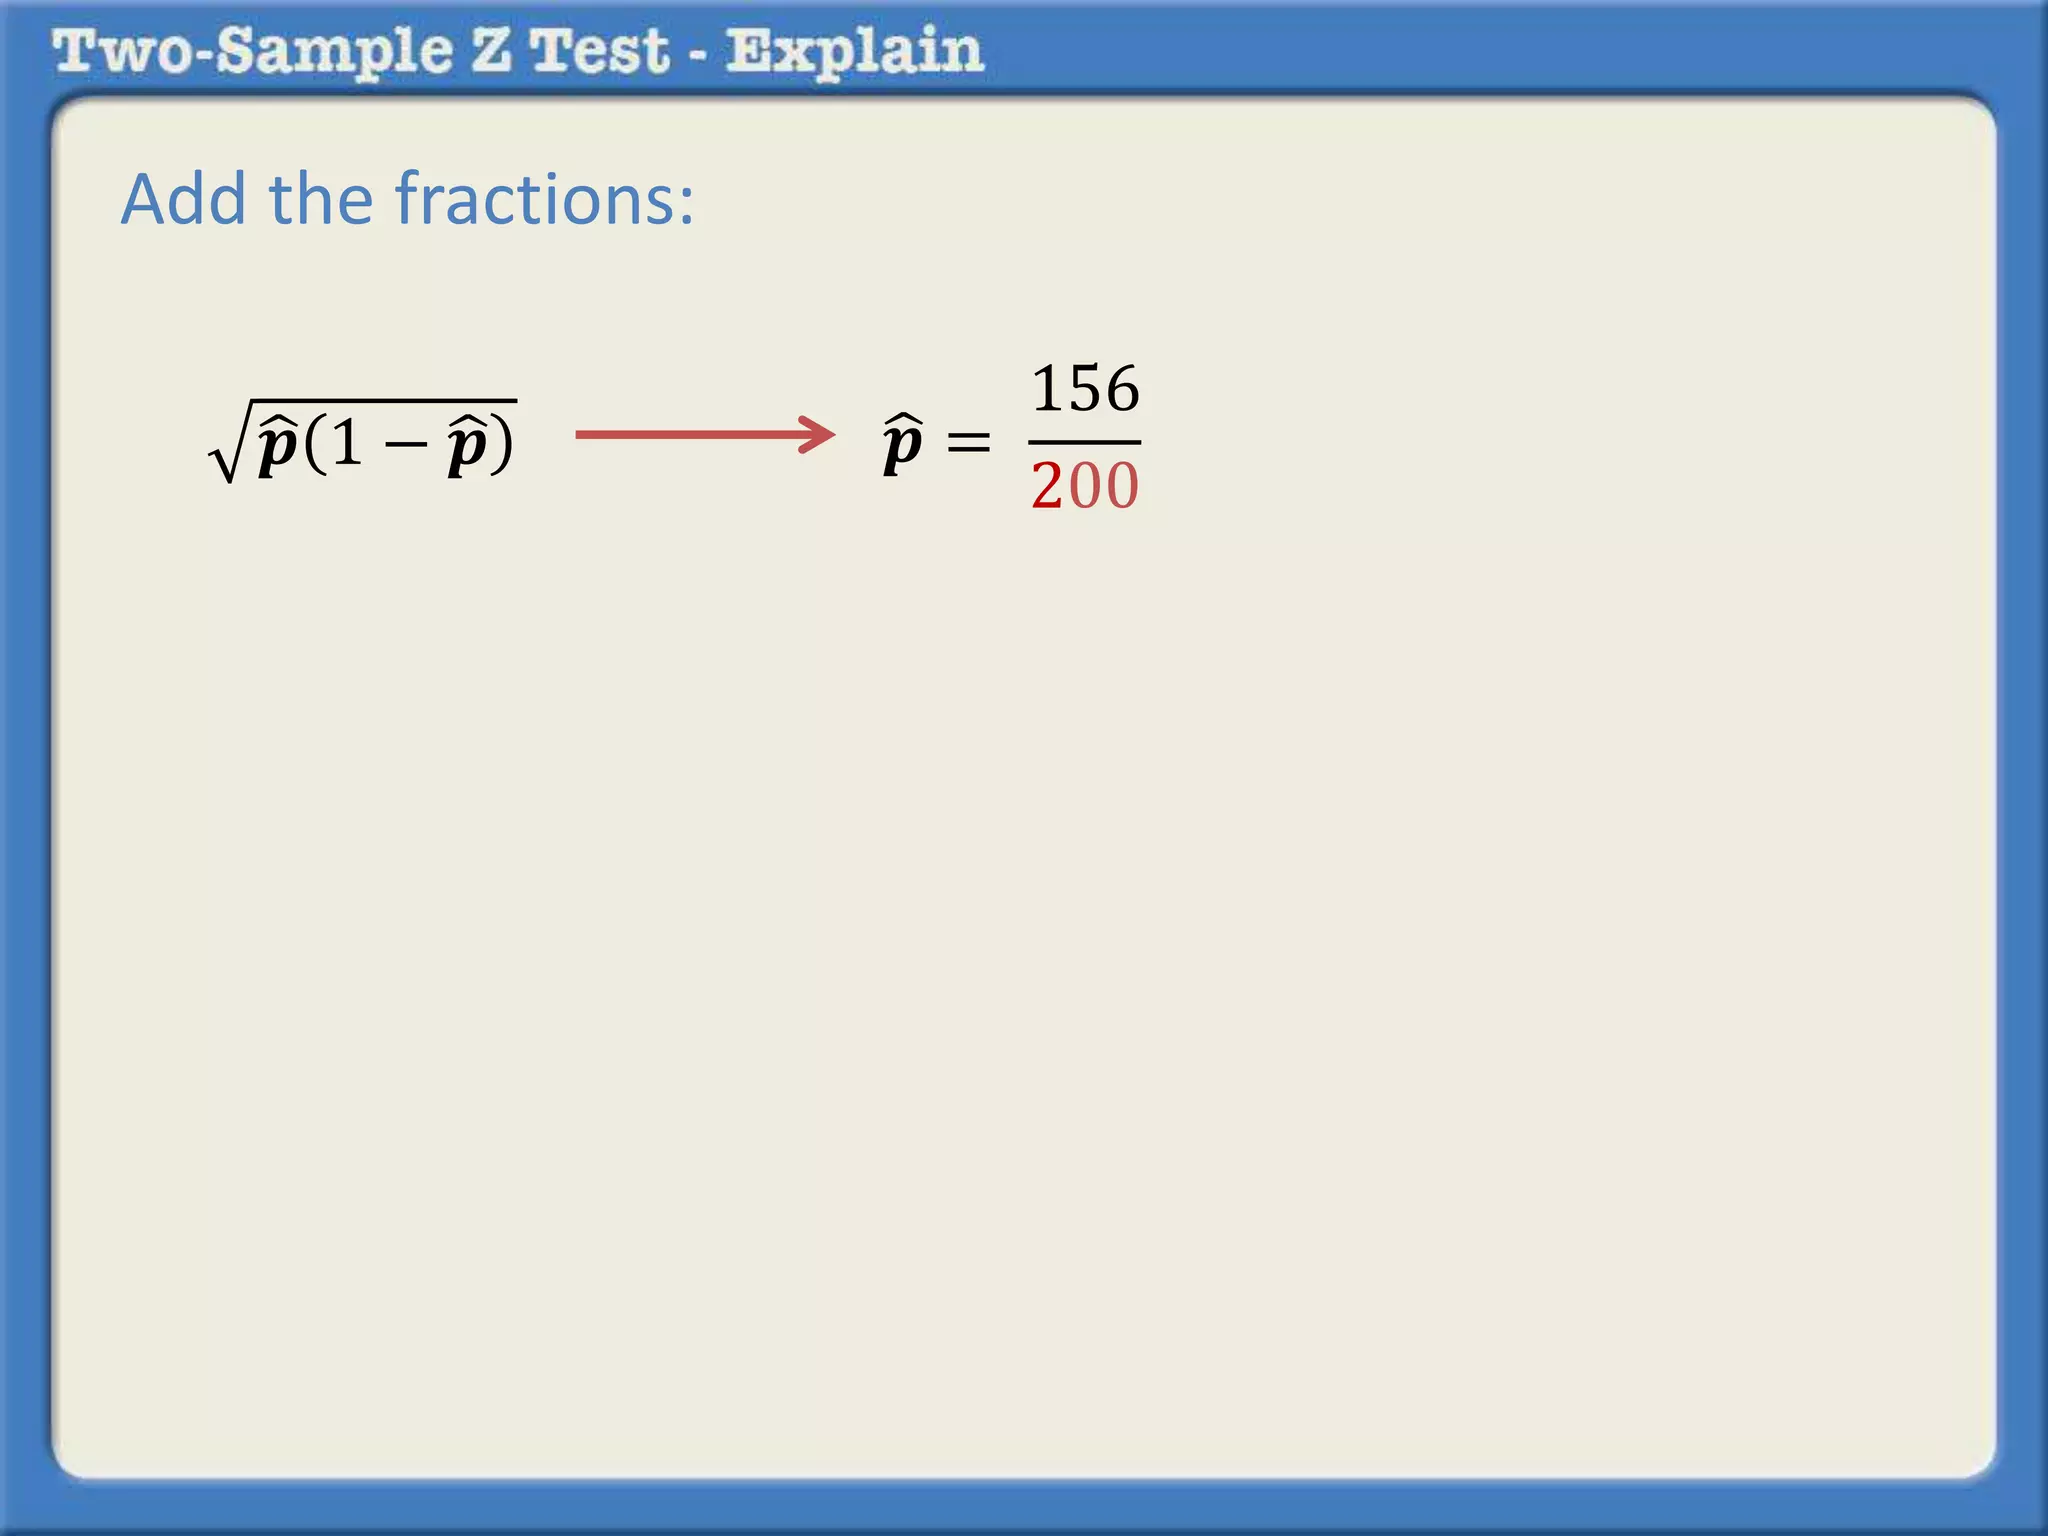
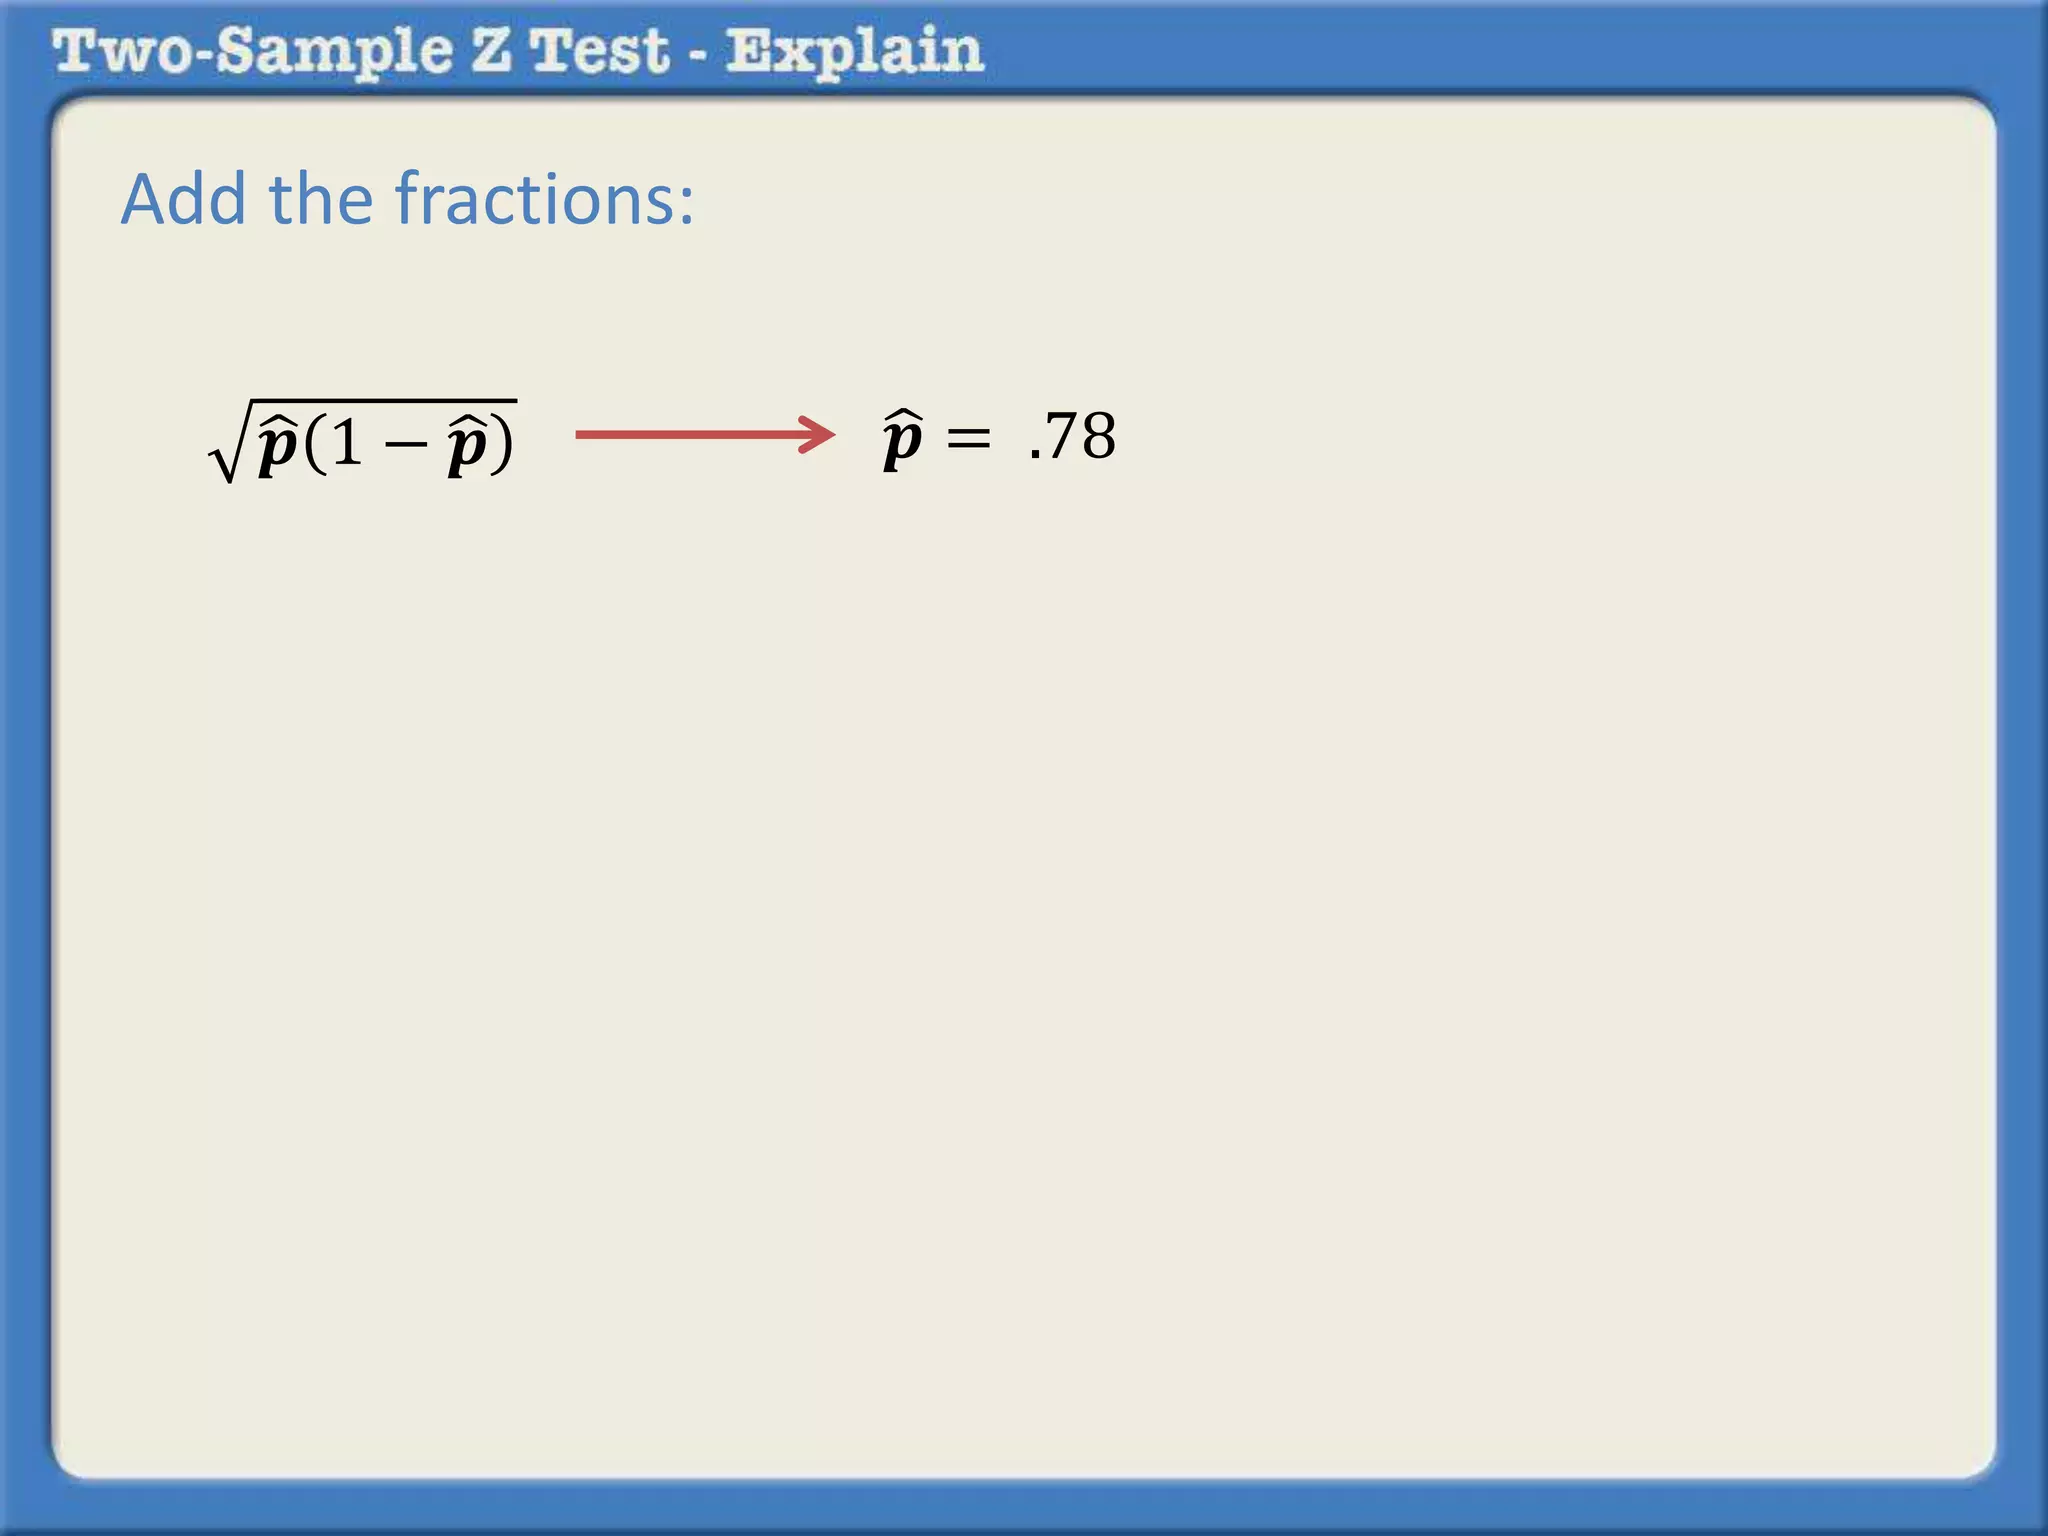
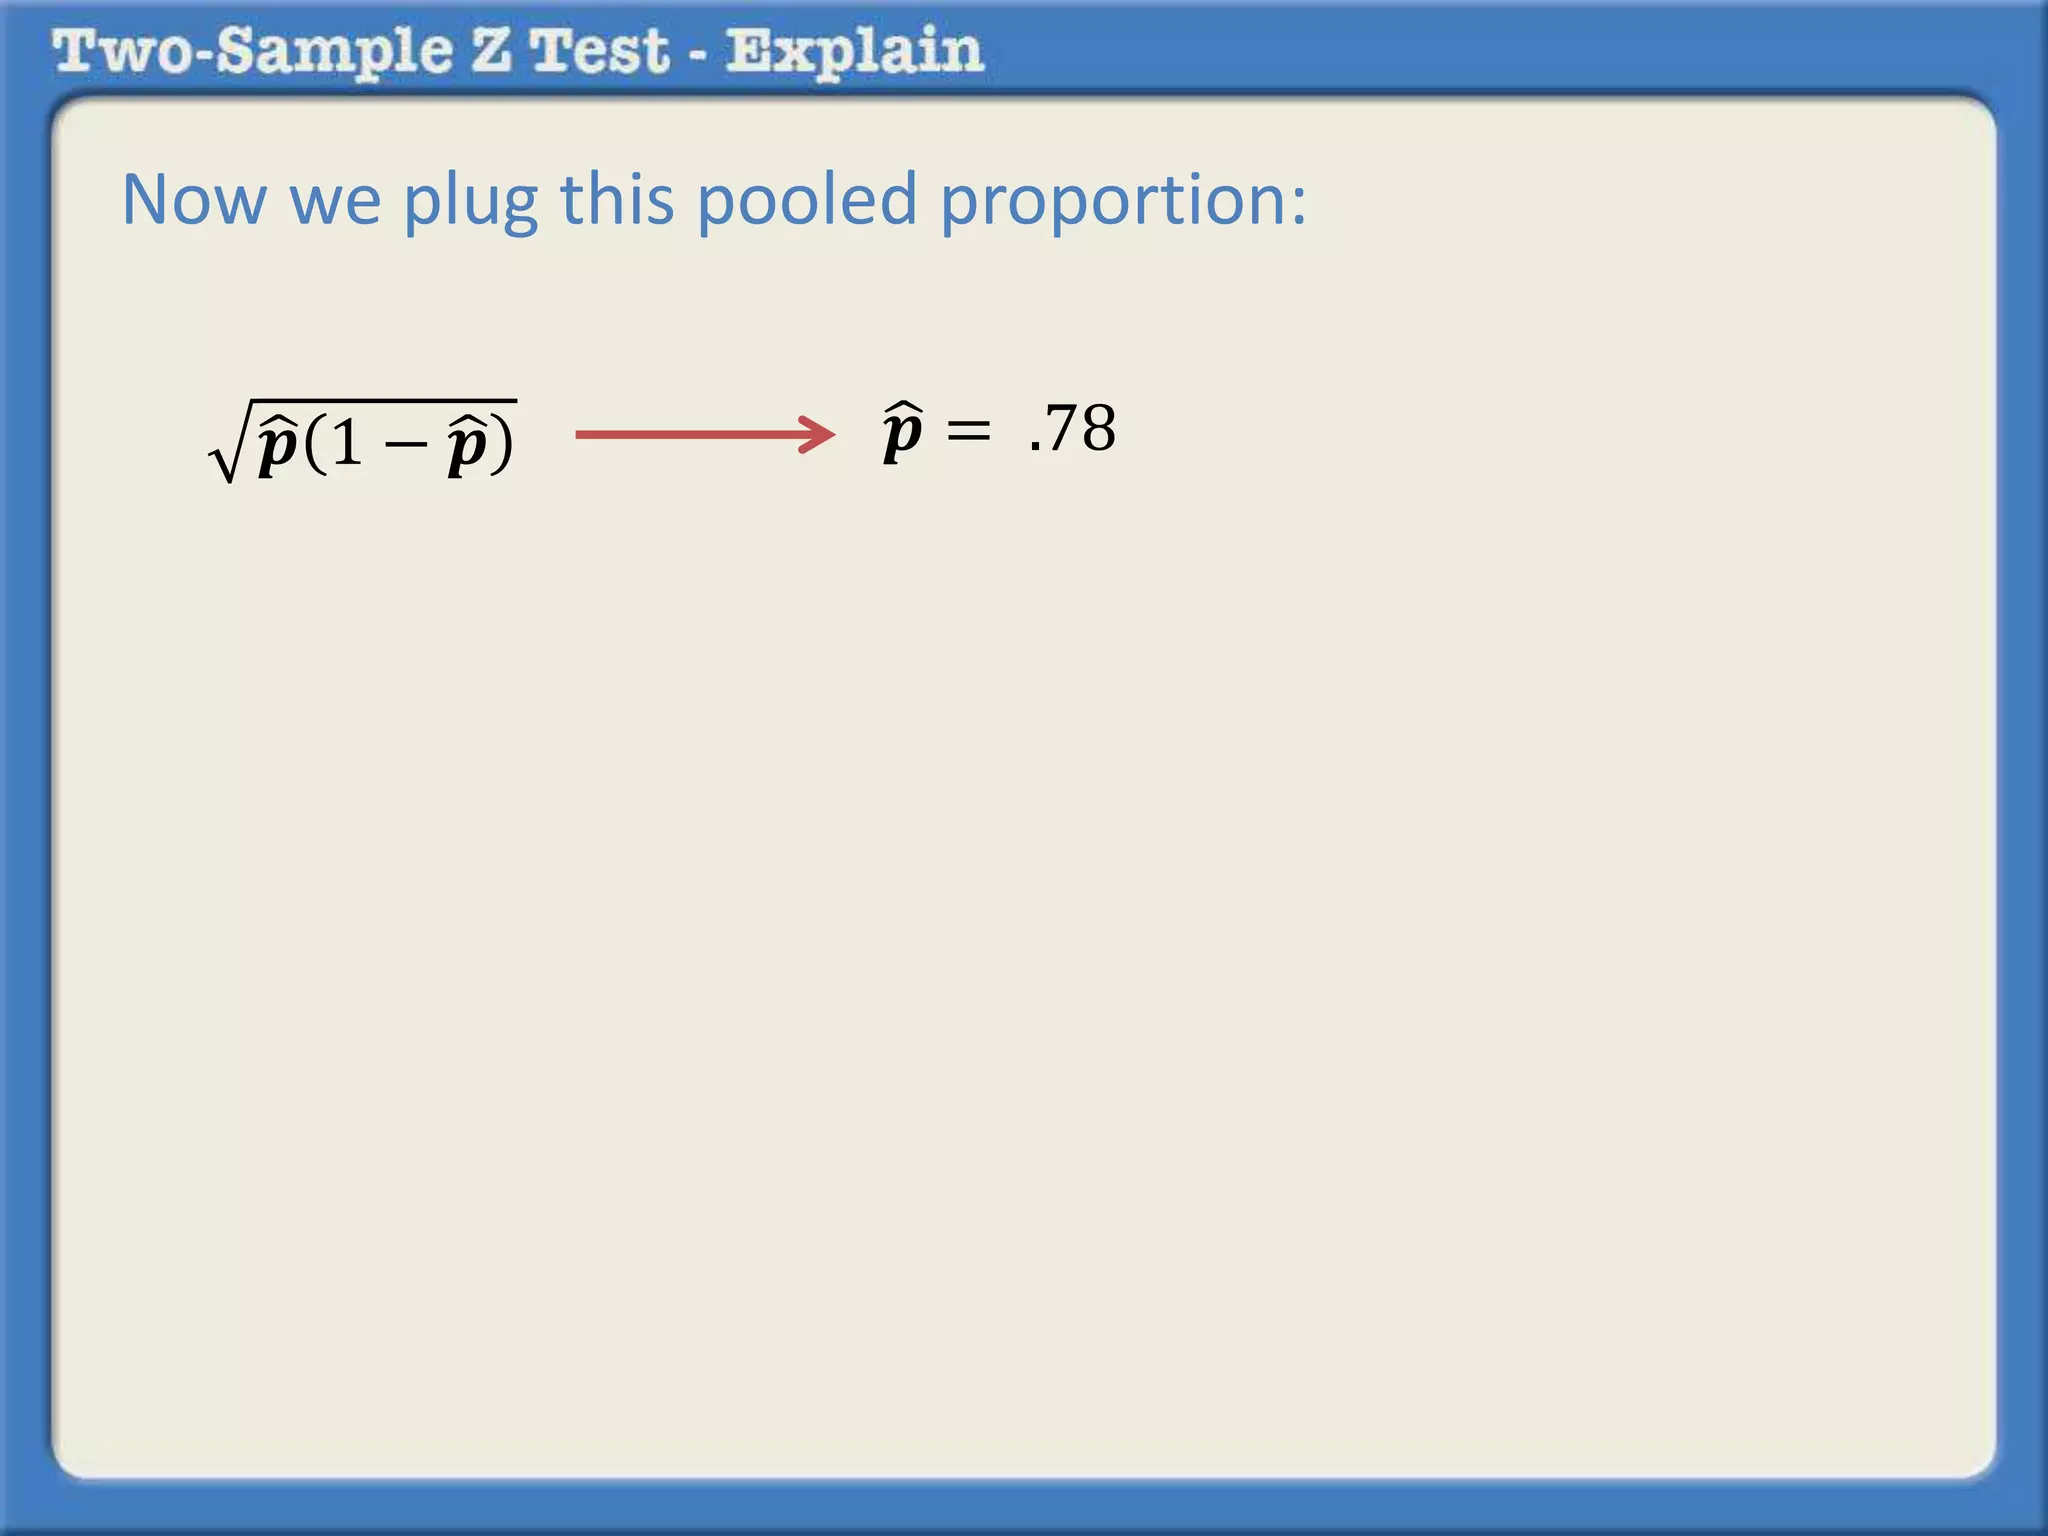
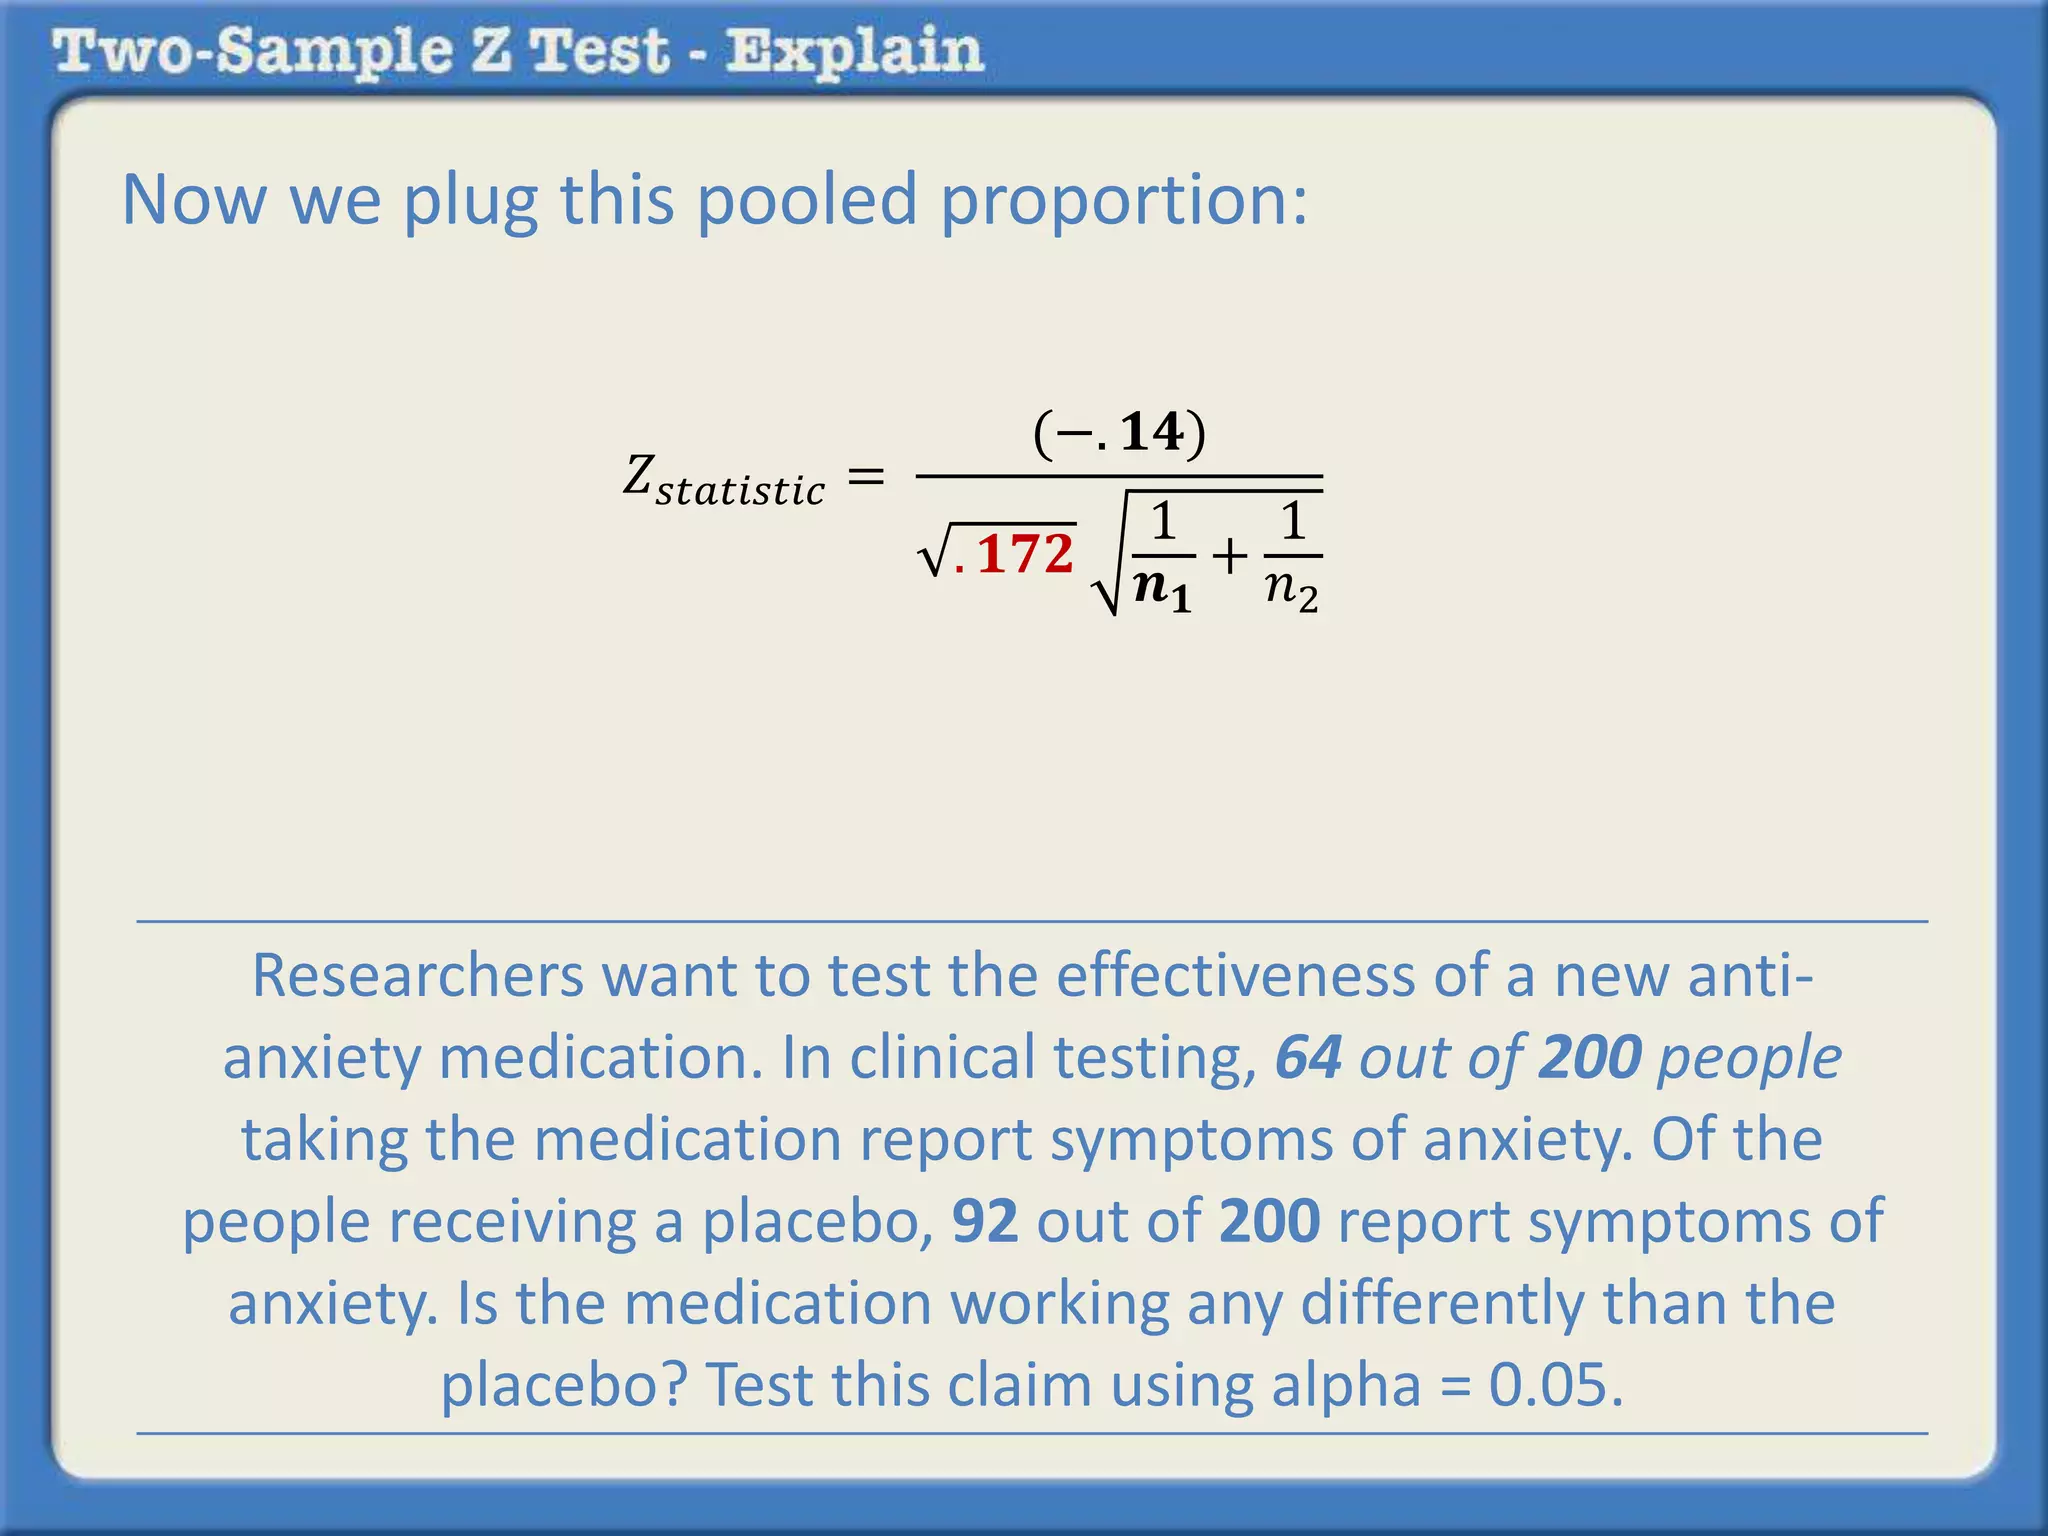

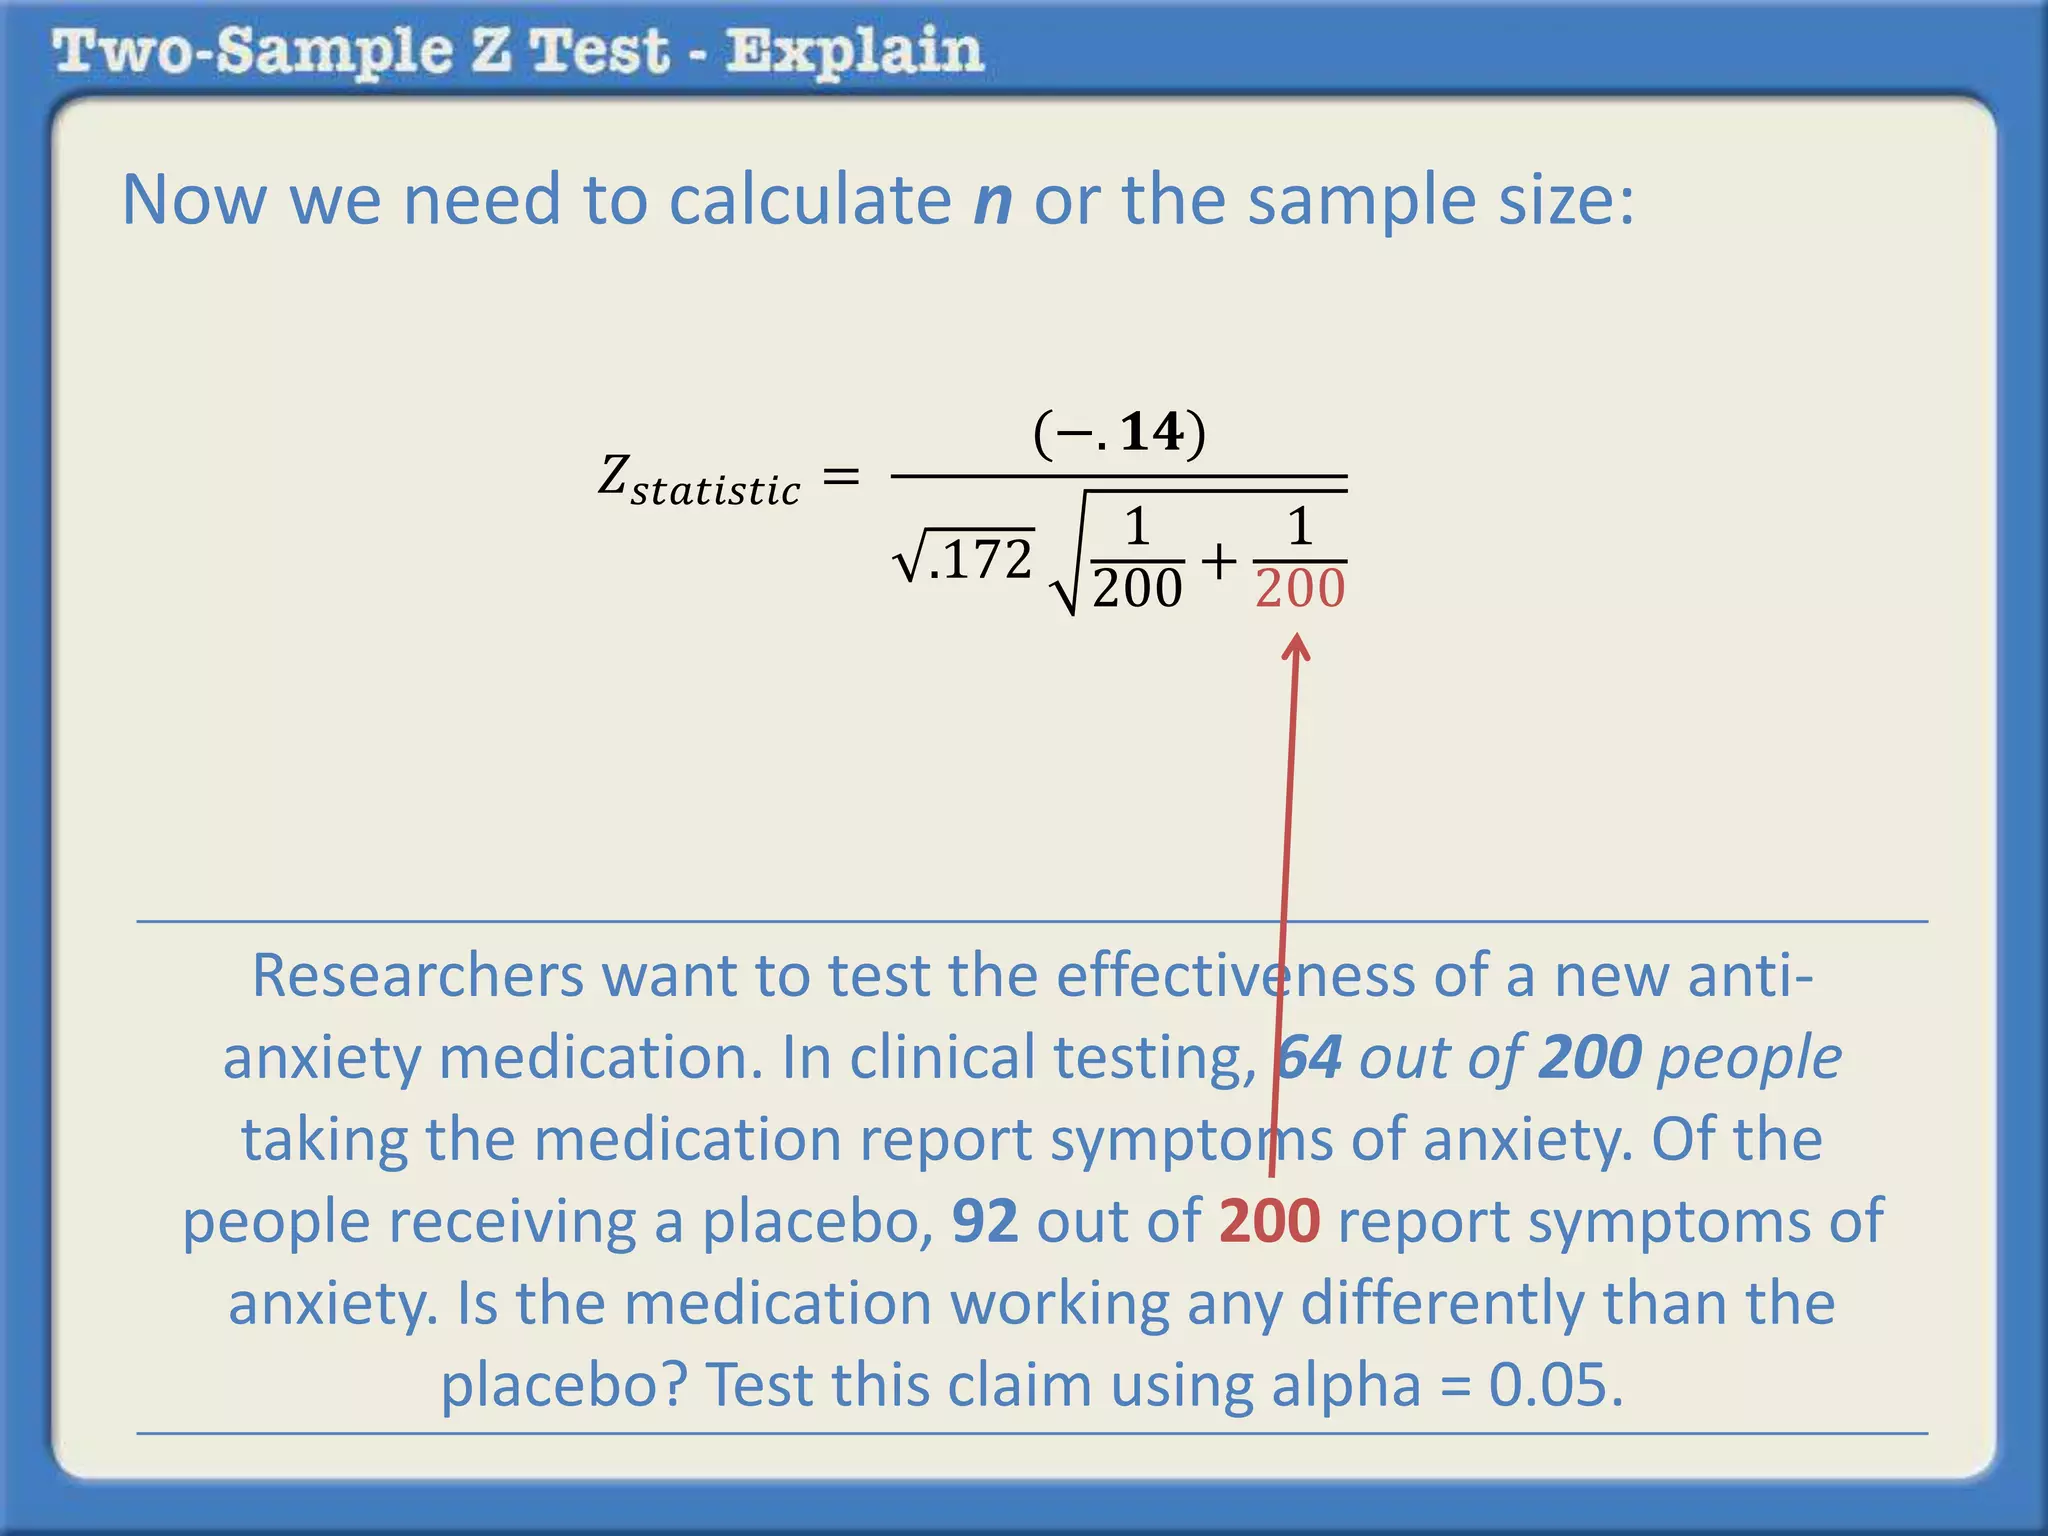
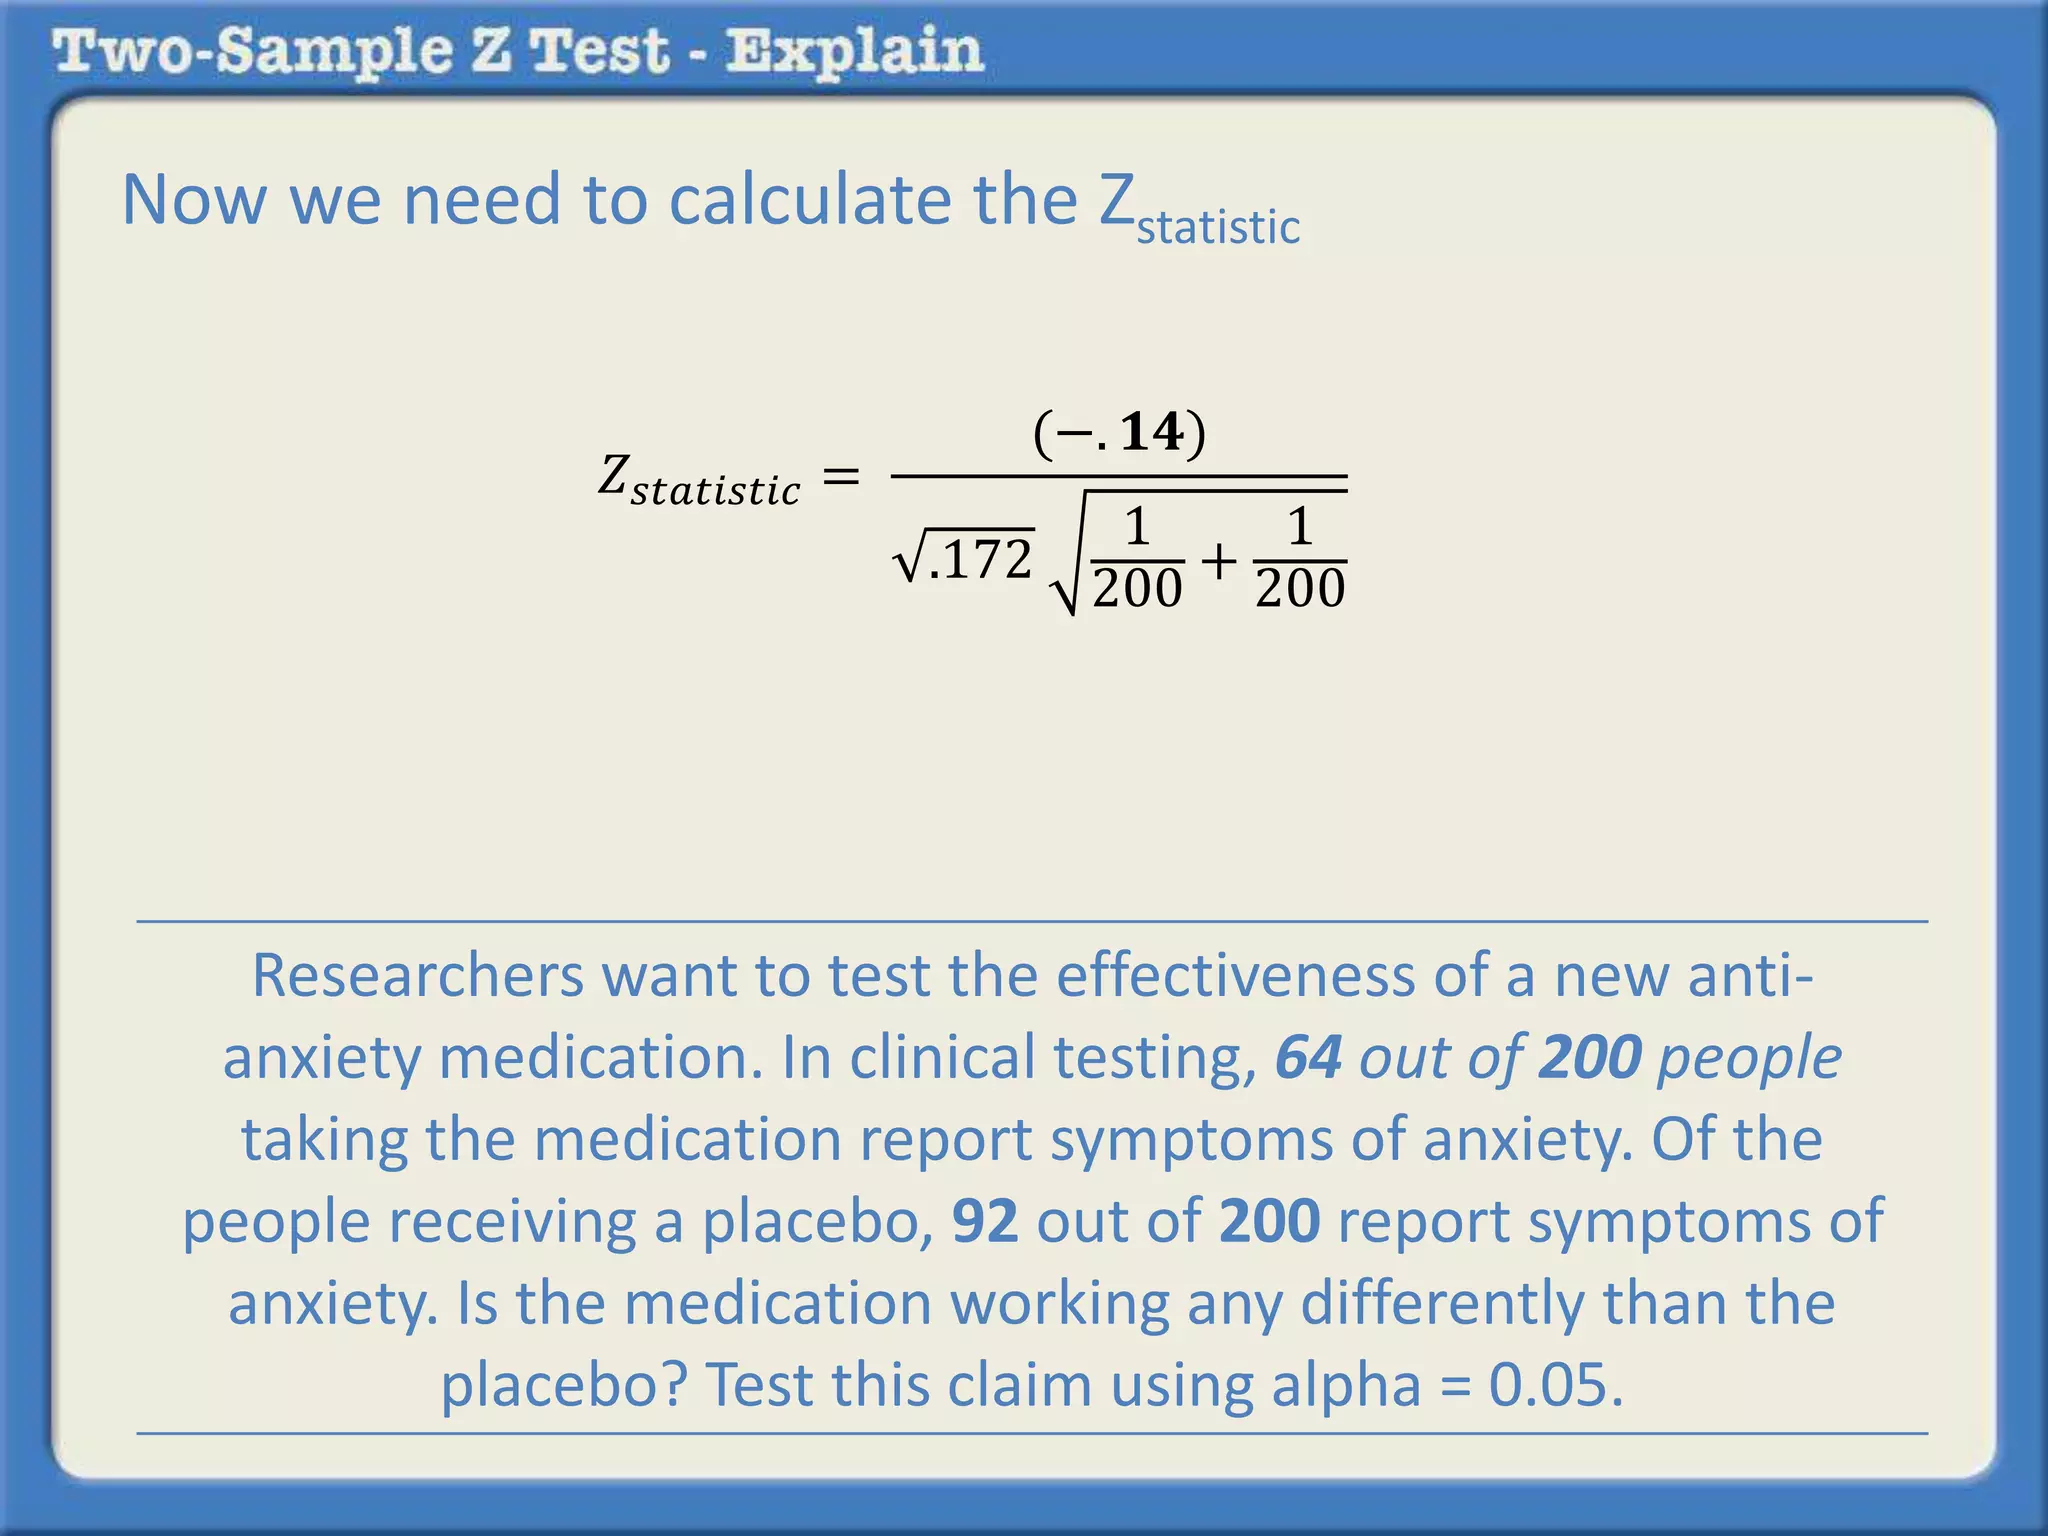


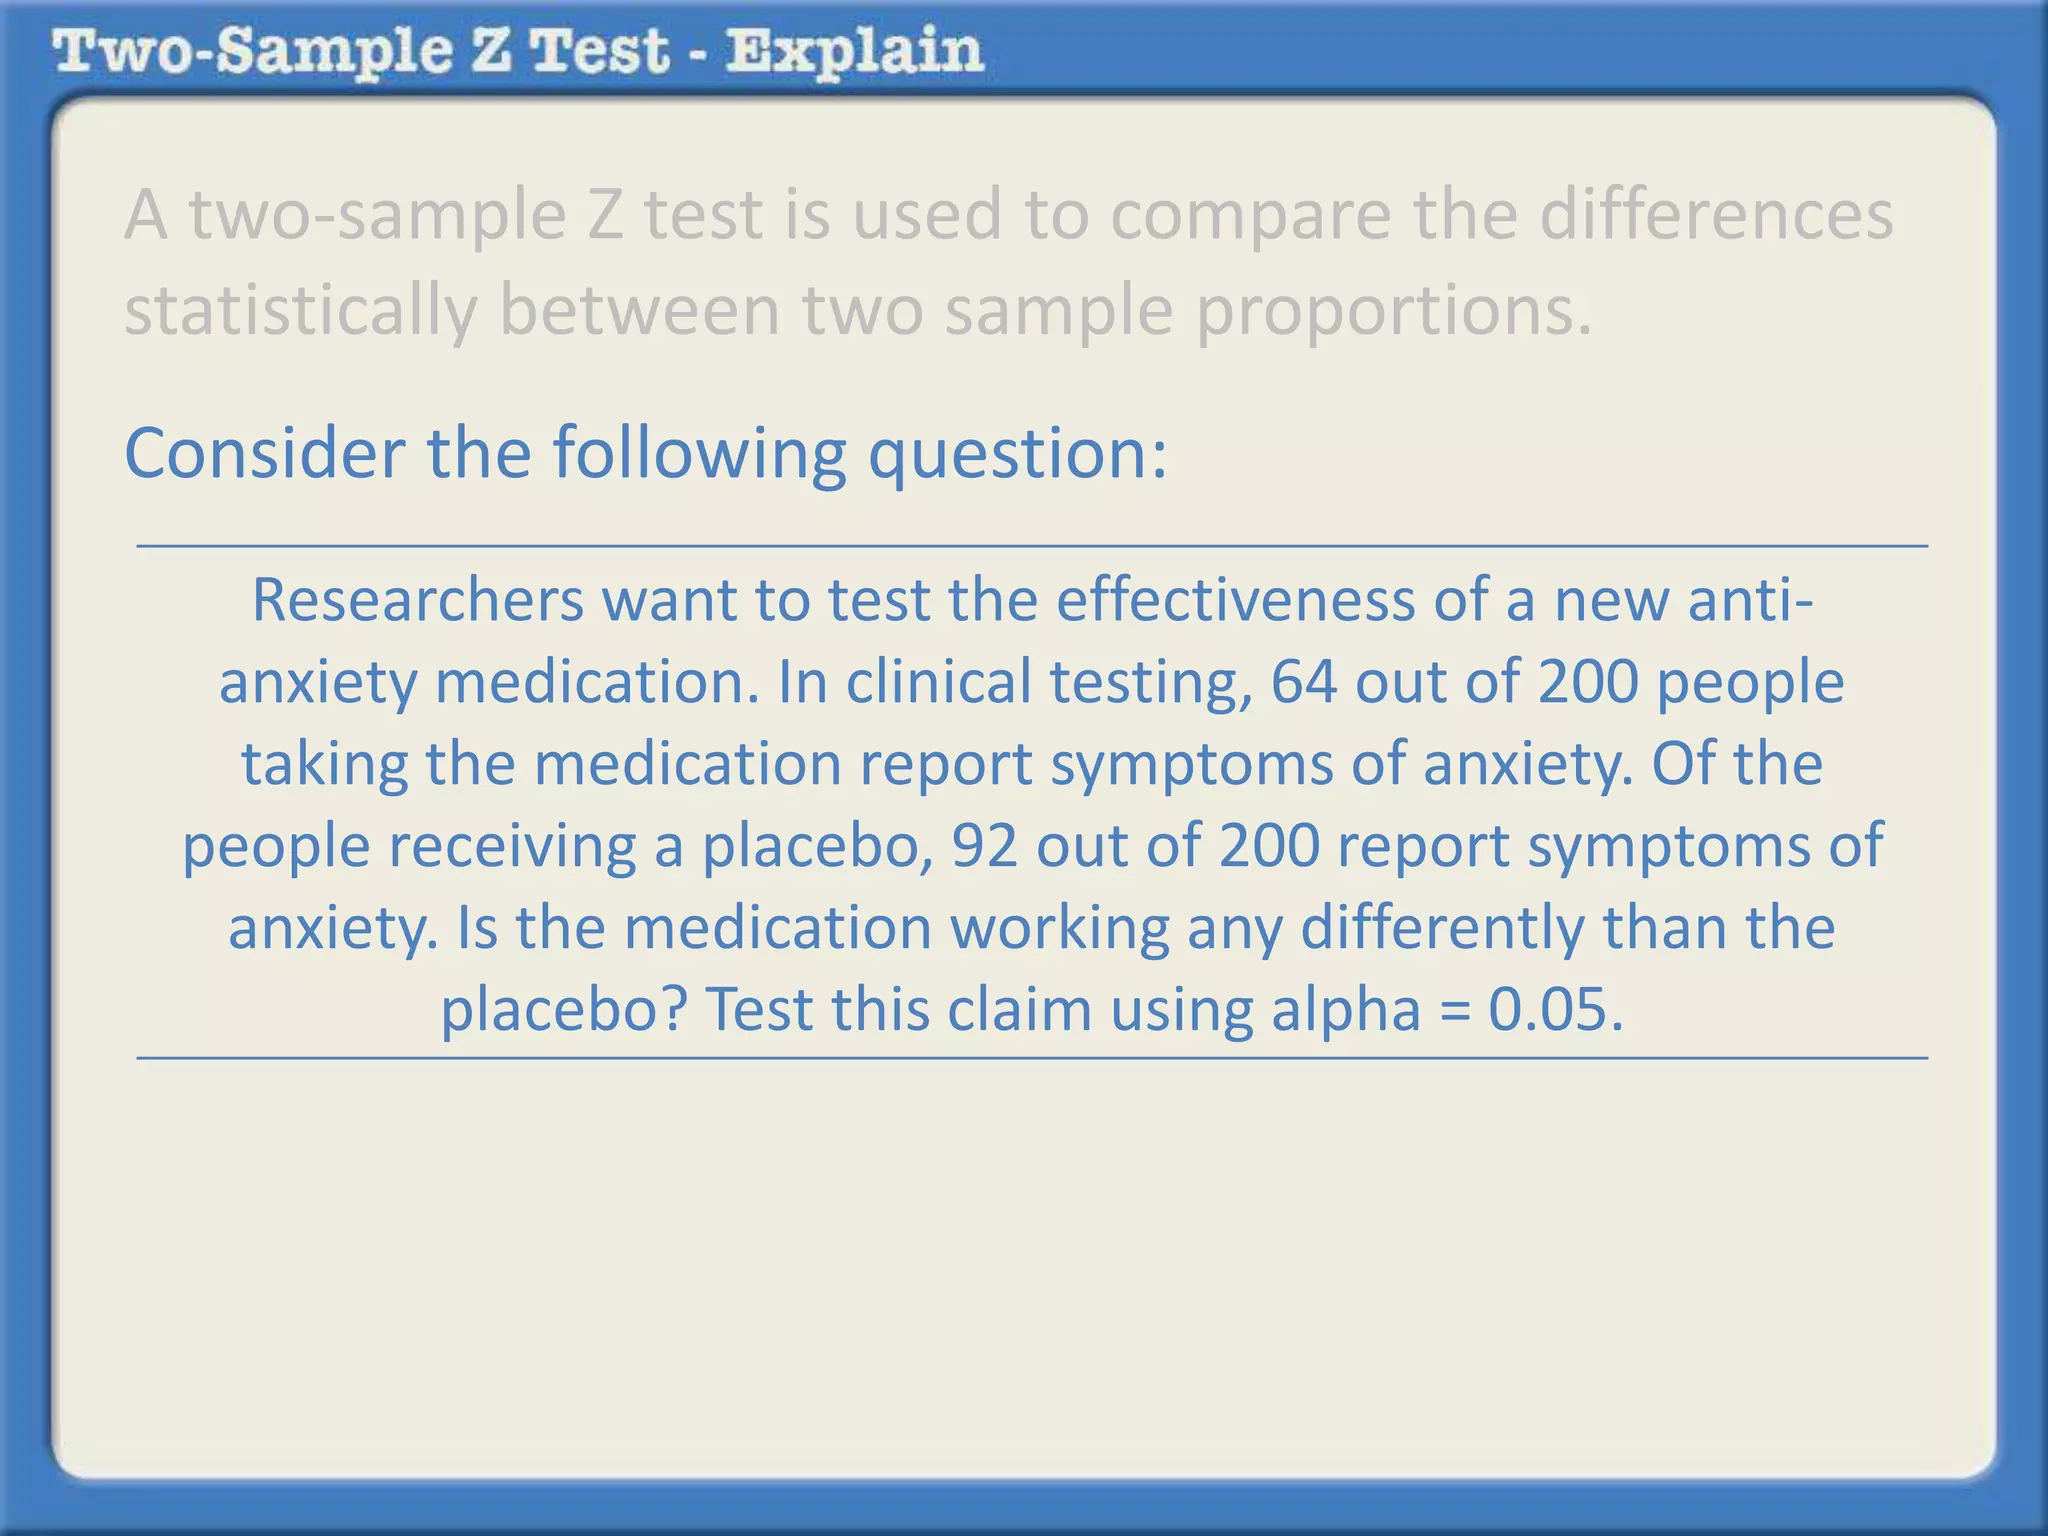
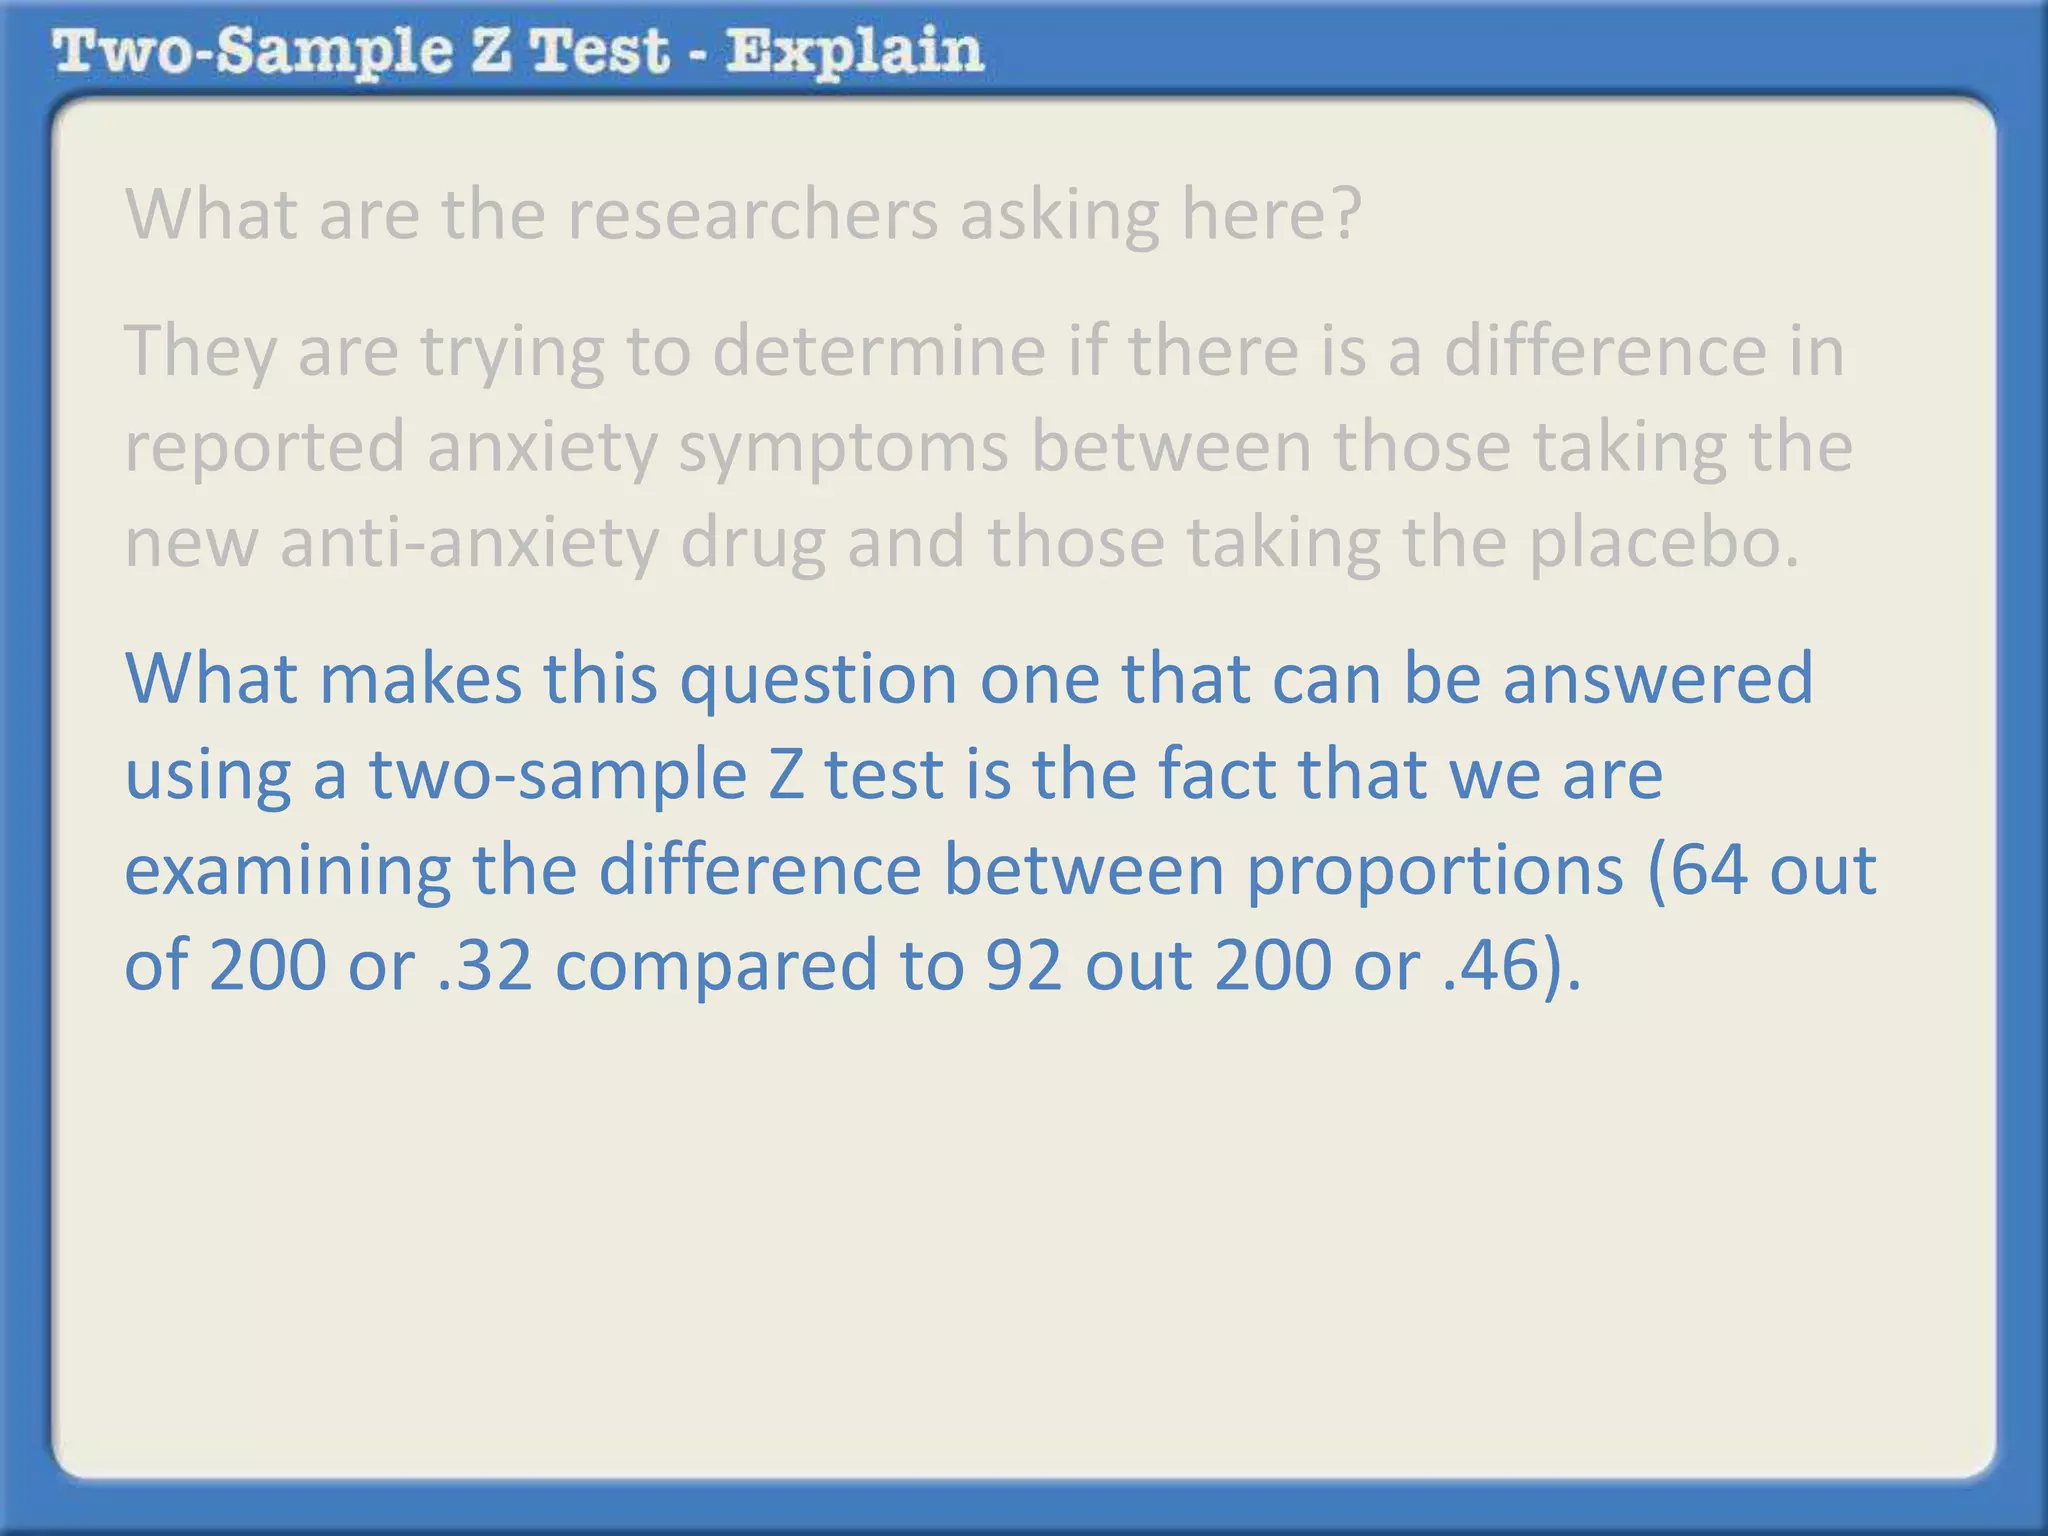
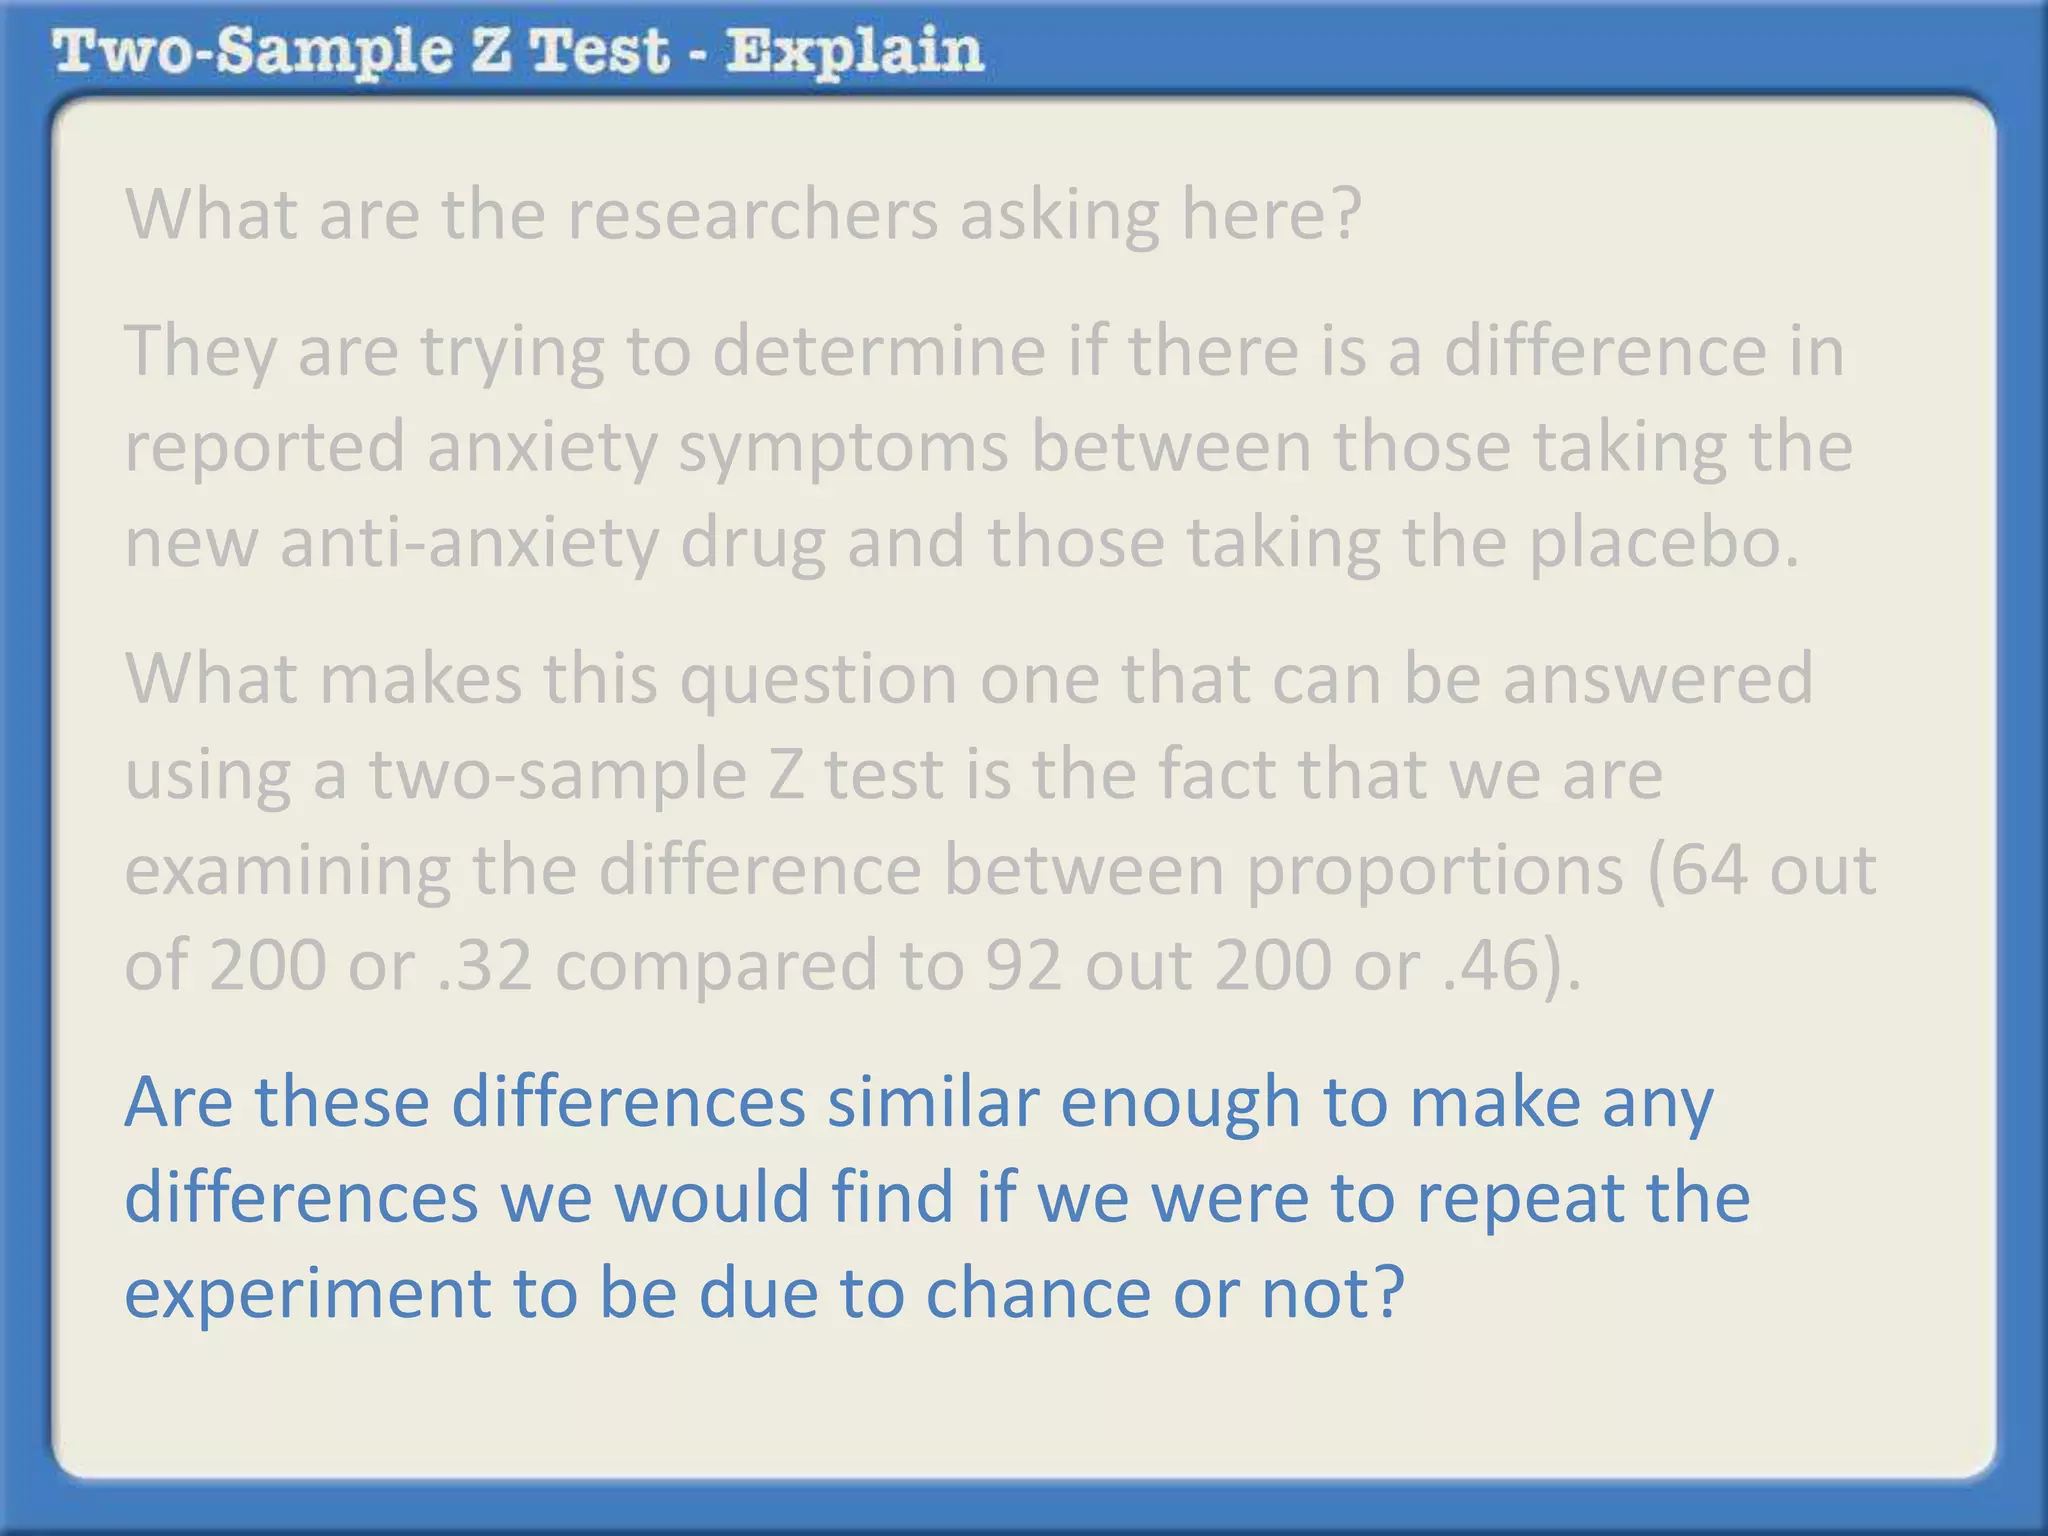
Researchers tested a new anti-anxiety medication on 200 people and a placebo on another 200 people. 64 of those on the medication and 92 of those on the placebo reported anxiety symptoms. The researchers want to determine if there is a statistically significant difference in reported anxiety between the two groups using a two-sample z-test with an alpha of 0.05. A two-sample z-test is used to compare differences between two sample proportions and determines if any observed difference is likely due to chance or not.