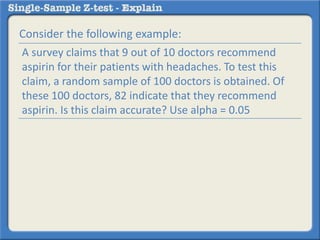
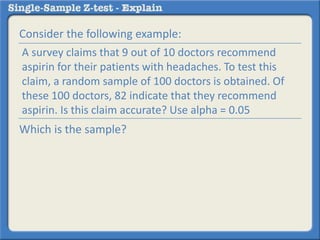
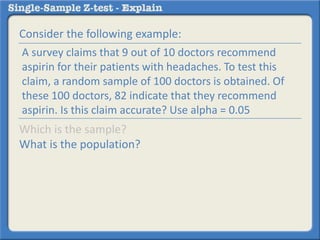
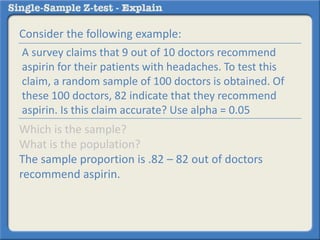
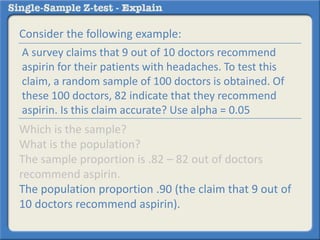
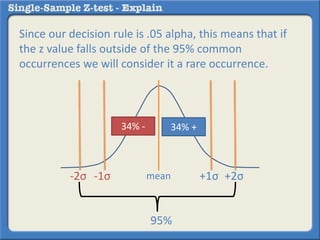
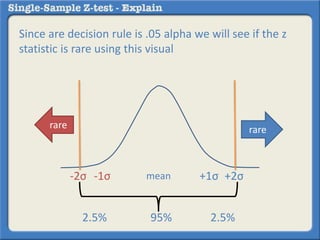
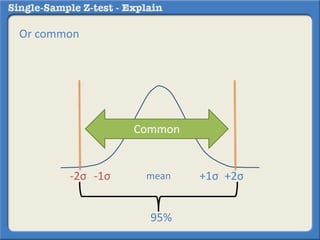
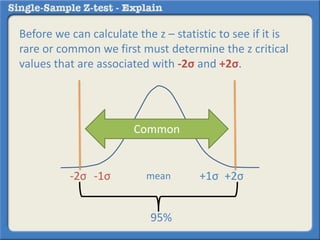
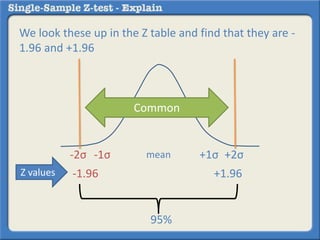
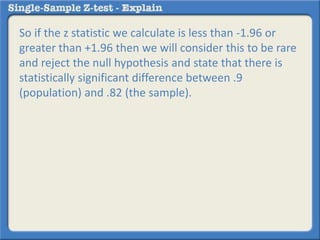
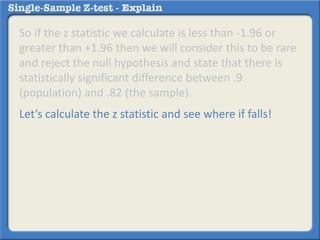
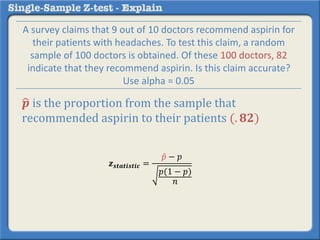
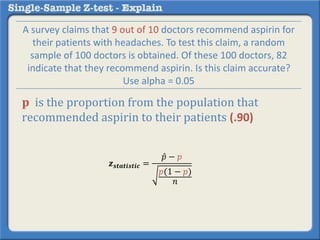
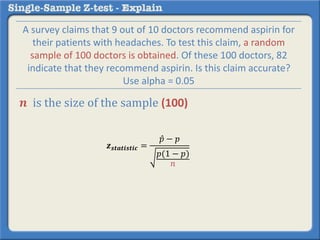
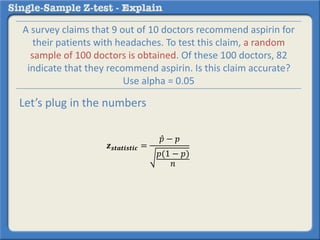
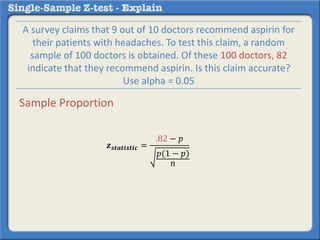
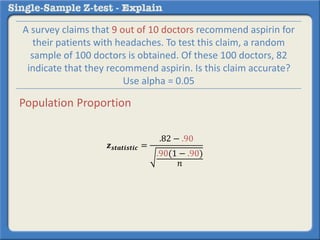
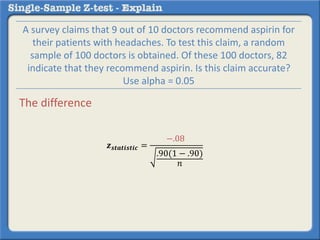
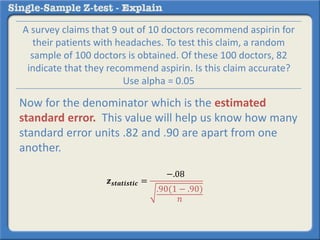
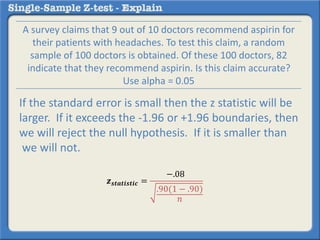
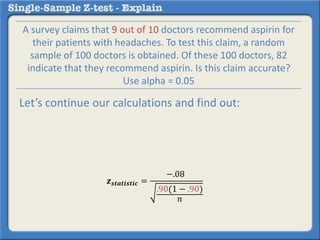
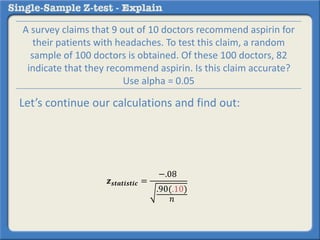
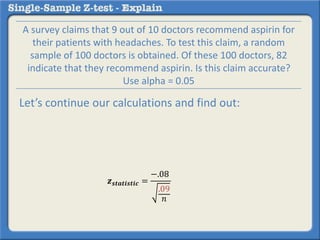
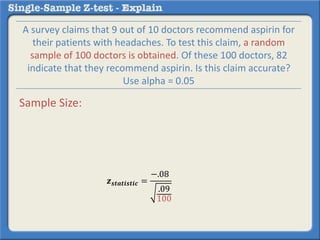
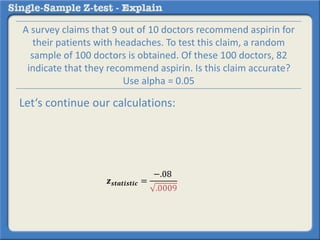
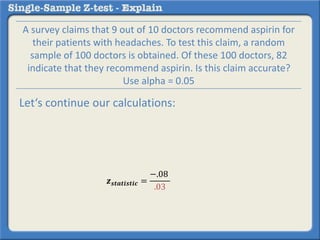
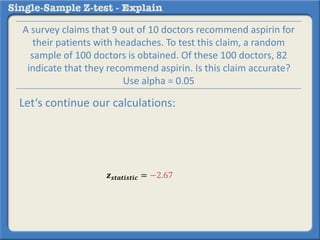
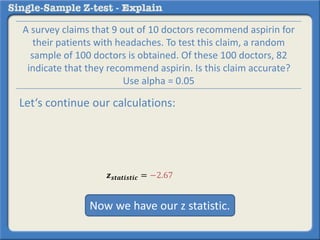
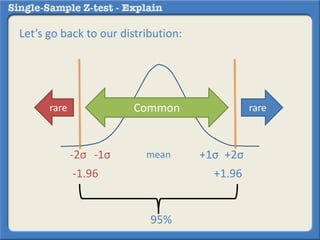
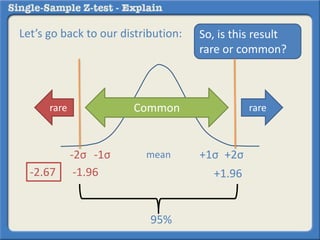
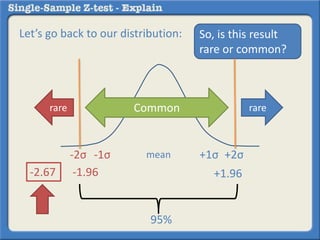
Single-Sample Z Test
Theoretical Explanation
A one-sample Z-test for proportions is a test that helps
us compare a population proportion with a sample
proportion.
A one-sample Z-test for proportions is a test that helps
us compare a population proportion with a sample
proportion.
Sample Population
30% 32%
A one-sample Z-test for proportions is a test that helps
us compare a population proportion with a sample
proportion.
Here is our question: Are the population and the
sample proportions (which supposedly have the same
general characteristics as the population) statistically
significantly the same or different?
Sample Population
30% 32%
Consider the following example:
A survey claims that 9 out of 10 doctors recommend
aspirin for their patients with headaches. To test this
claim, a random sample of 100 doctors is obtained. Of
these 100 doctors, 82 indicate that they recommend
aspirin. Is this claim accurate? Use alpha = 0.05
Consider the following example:
Which is the sample?
What is the population?
The sample proportion is .82 – 82 out of doctors
recommend aspirin.
The population proportion .90 (the claim that 9 out of
10 doctors recommend aspirin).
A survey claims that 9 out of 10 doctors recommend
aspirin for their patients with headaches. To test this
claim, a random sample of 100 doctors is obtained. Of
these 100 doctors, 82 indicate that they recommend
aspirin. Is this claim accurate? Use alpha = 0.05
We begin by stating the null hypothesis:
The alternative hypothesis would be:
The proportion of a sample of 100 medical doctors who
recommend aspirin for their patients with headaches IS NOT
statistically significantly different from the claim that 9 out of
10 doctors recommend aspirin for their patients with
headaches.
The proportion of a sample of 100 medical doctors who
recommend aspirin for their patients with headaches IS
statistically significantly different from the claim that 9 out of
10 doctors recommend aspirin for their patients with
headaches.
State the decision rule: We will calculate what is called
the z statistic which will make it possible to determine
the likelihood that the sample proportion (.82) is a rare
or common occurrence with reference to the
population proportion (.90).
State the decision rule: We will calculate what is called
the z statistic which will make it possible to determine
the likelihood that the sample proportion (.82) is a rare
or common occurrence with reference to the
population proportion (.90).
If the z-statistic falls outside of the 95% common
occurrences and into the 5% rare occurrences then we
will conclude that it is a rare event and that the sample
is different from the population and therefore reject
the null hypothesis.
Before we calculate this z-statistic, we must locate the
z critical values.
Before we calculate this z-statistic, we must locate the
z critical values.
What are the z critical values? These are the values
that demarcate what is the rare and the common
occurrence.
Let’s look at the normal distribution:
It has some important properties that make it possible
for us to locate the z statistic and compare them to the
z criticals.
Here is the mean and the median of a normal
distribution.
50% of the values are above and below the orange
line.
50% - 50% +
68% of the values fall between +1 and -1 standard
deviations from the mean.
34% - 34% +
68% of the values fall between +1 and -1 standard
deviations from the mean.
34% - 34% +
68%
mean-1σ +1σ
68% of the values fall between +1 and -1 standard
deviations from the mean.
34% - 34% +
95%
mean-1σ +1σ-2σ +2σ
Since our decision rule is .05 alpha, this means that if
the z value falls outside of the 95% common
occurrences we will consider it a rare occurrence.
34% - 34% +
95%
mean-1σ +1σ-2σ +2σ
Since are decision rule is .05 alpha we will see if the z
statistic is rare using this visual
95%
mean-1σ +1σ-2σ +2σ
2.5% 2.5%
rarerare
Or common
95%
mean-1σ +1σ-2σ +2σ
Common
Before we can calculate the z – statistic to see if it is
rare or common we first must determine the z critical
values that are associated with -2σ and +2σ.
95%
mean-1σ +1σ-2σ +2σ
Common
We look these up in the Z table and find that they are -
1.96 and +1.96
95%
mean-1σ +1σ-2σ +2σ
Common
-1.96 +1.96Z values
So if the z statistic we calculate is less than -1.96 or
greater than +1.96 then we will consider this to be rare
and reject the null hypothesis and state that there is
statistically significant difference between .9
(population) and .82 (the sample).
So if the z statistic we calculate is less than -1.96 or
greater than +1.96 then we will consider this to be rare
and reject the null hypothesis and state that there is
statistically significant difference between .9
(population) and .82 (the sample).
Let’s calculate the z statistic and see where if falls!
We do this by using the following equation:
𝒛 𝒔𝒕𝒂𝒕𝒊𝒔𝒕𝒊𝒄 =
𝑝 − 𝑝
𝑝(1 − 𝑝)
𝑛
So if the z statistic we calculate is less than -1.96 or
greater than +1.96 then we will consider this to be rare
and reject the null hypothesis and state that there is
statistically significant difference between .9
(population) and .82 (the sample).
Let’s calculate the z statistic and see where if falls!
We do this by using the following equation:
Zstatistic is what we are trying to find to see if it is
outside or inside the z critical values (-1.96 and +1.96).
𝒛 𝒔𝒕𝒂𝒕𝒊𝒔𝒕𝒊𝒄 =
𝑝 − 𝑝
𝑝(1 − 𝑝)
𝑛
𝒑 is the proportion from the sample that
recommended aspirin to their patients (. 𝟖𝟐)
𝒛 𝒔𝒕𝒂𝒕𝒊𝒔𝒕𝒊𝒄 =
𝑝 − 𝑝
𝑝(1 − 𝑝)
𝑛
A survey claims that 9 out of 10 doctors recommend aspirin for
their patients with headaches. To test this claim, a random
sample of 100 doctors is obtained. Of these 100 doctors, 82
indicate that they recommend aspirin. Is this claim accurate?
Use alpha = 0.05
𝐩 is the proportion from the population that
recommended aspirin to their patients (.90)
𝒛 𝒔𝒕𝒂𝒕𝒊𝒔𝒕𝒊𝒄 =
𝑝 − 𝑝
𝑝(1 − 𝑝)
𝑛
A survey claims that 9 out of 10 doctors recommend aspirin for
their patients with headaches. To test this claim, a random
sample of 100 doctors is obtained. Of these 100 doctors, 82
indicate that they recommend aspirin. Is this claim accurate?
Use alpha = 0.05
𝒛 𝒔𝒕𝒂𝒕𝒊𝒔𝒕𝒊𝒄 =
𝑝 − 𝑝
𝑝(1 − 𝑝)
𝑛
A survey claims that 9 out of 10 doctors recommend aspirin for
their patients with headaches. To test this claim, a random
sample of 100 doctors is obtained. Of these 100 doctors, 82
indicate that they recommend aspirin. Is this claim accurate?
Use alpha = 0.05
𝒏 is the size of the sample (100)
𝒛 𝒔𝒕𝒂𝒕𝒊𝒔𝒕𝒊𝒄 =
𝑝 − 𝑝
𝑝(1 − 𝑝)
𝑛
A survey claims that 9 out of 10 doctors recommend aspirin for
their patients with headaches. To test this claim, a random
sample of 100 doctors is obtained. Of these 100 doctors, 82
indicate that they recommend aspirin. Is this claim accurate?
Use alpha = 0.05
Let’s plug in the numbers
𝒛 𝒔𝒕𝒂𝒕𝒊𝒔𝒕𝒊𝒄 =
.82 − 𝑝
𝑝(1 − 𝑝)
𝑛
A survey claims that 9 out of 10 doctors recommend aspirin for
their patients with headaches. To test this claim, a random
sample of 100 doctors is obtained. Of these 100 doctors, 82
indicate that they recommend aspirin. Is this claim accurate?
Use alpha = 0.05
Sample Proportion
𝒛 𝒔𝒕𝒂𝒕𝒊𝒔𝒕𝒊𝒄 =
.82 − .90
.90(1 − .90)
𝑛
A survey claims that 9 out of 10 doctors recommend aspirin for
their patients with headaches. To test this claim, a random
sample of 100 doctors is obtained. Of these 100 doctors, 82
indicate that they recommend aspirin. Is this claim accurate?
Use alpha = 0.05
Population Proportion
𝒛 𝒔𝒕𝒂𝒕𝒊𝒔𝒕𝒊𝒄 =
−.08
.90(1 − .90)
𝑛
A survey claims that 9 out of 10 doctors recommend aspirin for
their patients with headaches. To test this claim, a random
sample of 100 doctors is obtained. Of these 100 doctors, 82
indicate that they recommend aspirin. Is this claim accurate?
Use alpha = 0.05
The difference
𝒛 𝒔𝒕𝒂𝒕𝒊𝒔𝒕𝒊𝒄 =
−.08
.90(1 − .90)
𝑛
A survey claims that 9 out of 10 doctors recommend aspirin for
their patients with headaches. To test this claim, a random
sample of 100 doctors is obtained. Of these 100 doctors, 82
indicate that they recommend aspirin. Is this claim accurate?
Use alpha = 0.05
Now for the denominator which is the estimated
standard error. This value will help us know how many
standard error units .82 and .90 are apart from one
another.
𝒛 𝒔𝒕𝒂𝒕𝒊𝒔𝒕𝒊𝒄 =
−.08
.90(1 − .90)
𝑛
A survey claims that 9 out of 10 doctors recommend aspirin for
their patients with headaches. To test this claim, a random
sample of 100 doctors is obtained. Of these 100 doctors, 82
indicate that they recommend aspirin. Is this claim accurate?
Use alpha = 0.05
If the standard error is small then the z statistic will be
larger. If it exceeds the -1.96 or +1.96 boundaries, then
we will reject the null hypothesis. If it is smaller than
we will not.
𝒛 𝒔𝒕𝒂𝒕𝒊𝒔𝒕𝒊𝒄 =
−.08
.90(1 − .90)
𝑛
A survey claims that 9 out of 10 doctors recommend aspirin for
their patients with headaches. To test this claim, a random
sample of 100 doctors is obtained. Of these 100 doctors, 82
indicate that they recommend aspirin. Is this claim accurate?
Use alpha = 0.05
Let’s continue our calculations and find out:
𝒛 𝒔𝒕𝒂𝒕𝒊𝒔𝒕𝒊𝒄 =
−.08
.90(.10)
𝑛
A survey claims that 9 out of 10 doctors recommend aspirin for
their patients with headaches. To test this claim, a random
sample of 100 doctors is obtained. Of these 100 doctors, 82
indicate that they recommend aspirin. Is this claim accurate?
Use alpha = 0.05
Let’s continue our calculations and find out:
𝒛 𝒔𝒕𝒂𝒕𝒊𝒔𝒕𝒊𝒄 =
−.08
.09
100
A survey claims that 9 out of 10 doctors recommend aspirin for
their patients with headaches. To test this claim, a random
sample of 100 doctors is obtained. Of these 100 doctors, 82
indicate that they recommend aspirin. Is this claim accurate?
Use alpha = 0.05
Sample Size:
𝒛 𝒔𝒕𝒂𝒕𝒊𝒔𝒕𝒊𝒄 =
−.08
.0009
A survey claims that 9 out of 10 doctors recommend aspirin for
their patients with headaches. To test this claim, a random
sample of 100 doctors is obtained. Of these 100 doctors, 82
indicate that they recommend aspirin. Is this claim accurate?
Use alpha = 0.05
Let‘s continue our calculations:
𝒛 𝒔𝒕𝒂𝒕𝒊𝒔𝒕𝒊𝒄 =
−.08
.03
A survey claims that 9 out of 10 doctors recommend aspirin for
their patients with headaches. To test this claim, a random
sample of 100 doctors is obtained. Of these 100 doctors, 82
indicate that they recommend aspirin. Is this claim accurate?
Use alpha = 0.05
Let‘s continue our calculations:
𝒛 𝒔𝒕𝒂𝒕𝒊𝒔𝒕𝒊𝒄 = −2.67
A survey claims that 9 out of 10 doctors recommend aspirin for
their patients with headaches. To test this claim, a random
sample of 100 doctors is obtained. Of these 100 doctors, 82
indicate that they recommend aspirin. Is this claim accurate?
Use alpha = 0.05
Let‘s continue our calculations:
Now we have our z statistic.
Let’s go back to our distribution:
rarerare
95%
mean-1σ +1σ-2σ +2σ
Common
-1.96 +1.96
Let’s go back to our distribution: So, is this result
rare or common?
rarerare
95%
mean-1σ +1σ-2σ +2σ
Common
-1.96 +1.96-2.67
Let’s go back to our distribution: So, is this result
rare or common?
rarerare
95%
mean-1σ +1σ-2σ +2σ
Common
-1.96 +1.96-2.67
Looks like it is a rare event therefore we will reject the
null hypothesis in favor of the alternative hypothesis:
Looks like it is a rare event therefore we will reject the
null hypothesis in favor of the alternative hypothesis:
The proportion of a sample of 100 medical doctors
who recommend aspirin for their patients with
headaches IS statistically significantly different from
the claim that 9 out of 10 doctors recommend aspirin
for their patients with headaches.

Single sample z test - explain (final)

  • 1.
  • 2.
    A one-sample Z-testfor proportions is a test that helps us compare a population proportion with a sample proportion.
  • 3.
    A one-sample Z-testfor proportions is a test that helps us compare a population proportion with a sample proportion. Sample Population 30% 32%
  • 4.
    A one-sample Z-testfor proportions is a test that helps us compare a population proportion with a sample proportion. Here is our question: Are the population and the sample proportions (which supposedly have the same general characteristics as the population) statistically significantly the same or different? Sample Population 30% 32%
  • 5.
  • 6.
    Consider the followingexample: A survey claims that 9 out of 10 doctors recommend aspirin for their patients with headaches. To test this claim, a random sample of 100 doctors is obtained. Of these 100 doctors, 82 indicate that they recommend aspirin. Is this claim accurate? Use alpha = 0.05
  • 7.
    Consider the followingexample: Which is the sample? A survey claims that 9 out of 10 doctors recommend aspirin for their patients with headaches. To test this claim, a random sample of 100 doctors is obtained. Of these 100 doctors, 82 indicate that they recommend aspirin. Is this claim accurate? Use alpha = 0.05
  • 8.
    Consider the followingexample: Which is the sample? What is the population? A survey claims that 9 out of 10 doctors recommend aspirin for their patients with headaches. To test this claim, a random sample of 100 doctors is obtained. Of these 100 doctors, 82 indicate that they recommend aspirin. Is this claim accurate? Use alpha = 0.05
  • 9.
    Consider the followingexample: Which is the sample? What is the population? The sample proportion is .82 – 82 out of doctors recommend aspirin. A survey claims that 9 out of 10 doctors recommend aspirin for their patients with headaches. To test this claim, a random sample of 100 doctors is obtained. Of these 100 doctors, 82 indicate that they recommend aspirin. Is this claim accurate? Use alpha = 0.05
  • 10.
    Consider the followingexample: Which is the sample? What is the population? The sample proportion is .82 – 82 out of doctors recommend aspirin. The population proportion .90 (the claim that 9 out of 10 doctors recommend aspirin). A survey claims that 9 out of 10 doctors recommend aspirin for their patients with headaches. To test this claim, a random sample of 100 doctors is obtained. Of these 100 doctors, 82 indicate that they recommend aspirin. Is this claim accurate? Use alpha = 0.05
  • 11.
    We begin bystating the null hypothesis:
  • 12.
    We begin bystating the null hypothesis: The alternative hypothesis would be: The proportion of a sample of 100 medical doctors who recommend aspirin for their patients with headaches IS NOT statistically significantly different from the claim that 9 out of 10 doctors recommend aspirin for their patients with headaches.
  • 13.
    We begin bystating the null hypothesis: The alternative hypothesis would be: The proportion of a sample of 100 medical doctors who recommend aspirin for their patients with headaches IS NOT statistically significantly different from the claim that 9 out of 10 doctors recommend aspirin for their patients with headaches. The proportion of a sample of 100 medical doctors who recommend aspirin for their patients with headaches IS statistically significantly different from the claim that 9 out of 10 doctors recommend aspirin for their patients with headaches.
  • 14.
    State the decisionrule: We will calculate what is called the z statistic which will make it possible to determine the likelihood that the sample proportion (.82) is a rare or common occurrence with reference to the population proportion (.90).
  • 15.
    State the decisionrule: We will calculate what is called the z statistic which will make it possible to determine the likelihood that the sample proportion (.82) is a rare or common occurrence with reference to the population proportion (.90). If the z-statistic falls outside of the 95% common occurrences and into the 5% rare occurrences then we will conclude that it is a rare event and that the sample is different from the population and therefore reject the null hypothesis.
  • 16.
    Before we calculatethis z-statistic, we must locate the z critical values.
  • 17.
    Before we calculatethis z-statistic, we must locate the z critical values. What are the z critical values? These are the values that demarcate what is the rare and the common occurrence.
  • 18.
    Let’s look atthe normal distribution: It has some important properties that make it possible for us to locate the z statistic and compare them to the z criticals.
  • 19.
    Here is themean and the median of a normal distribution.
  • 20.
    50% of thevalues are above and below the orange line. 50% - 50% +
  • 21.
    68% of thevalues fall between +1 and -1 standard deviations from the mean. 34% - 34% +
  • 22.
    68% of thevalues fall between +1 and -1 standard deviations from the mean. 34% - 34% + 68% mean-1σ +1σ
  • 23.
    68% of thevalues fall between +1 and -1 standard deviations from the mean. 34% - 34% + 95% mean-1σ +1σ-2σ +2σ
  • 24.
    Since our decisionrule is .05 alpha, this means that if the z value falls outside of the 95% common occurrences we will consider it a rare occurrence. 34% - 34% + 95% mean-1σ +1σ-2σ +2σ
  • 25.
    Since are decisionrule is .05 alpha we will see if the z statistic is rare using this visual 95% mean-1σ +1σ-2σ +2σ 2.5% 2.5% rarerare
  • 26.
  • 27.
    Before we cancalculate the z – statistic to see if it is rare or common we first must determine the z critical values that are associated with -2σ and +2σ. 95% mean-1σ +1σ-2σ +2σ Common
  • 28.
    We look theseup in the Z table and find that they are - 1.96 and +1.96 95% mean-1σ +1σ-2σ +2σ Common -1.96 +1.96Z values
  • 29.
    So if thez statistic we calculate is less than -1.96 or greater than +1.96 then we will consider this to be rare and reject the null hypothesis and state that there is statistically significant difference between .9 (population) and .82 (the sample).
  • 30.
    So if thez statistic we calculate is less than -1.96 or greater than +1.96 then we will consider this to be rare and reject the null hypothesis and state that there is statistically significant difference between .9 (population) and .82 (the sample). Let’s calculate the z statistic and see where if falls!
  • 31.
    So if thez statistic we calculate is less than -1.96 or greater than +1.96 then we will consider this to be rare and reject the null hypothesis and state that there is statistically significant difference between .9 (population) and .82 (the sample). Let’s calculate the z statistic and see where if falls! We do this by using the following equation:
  • 32.
    So if thez statistic we calculate is less than -1.96 or greater than +1.96 then we will consider this to be rare and reject the null hypothesis and state that there is statistically significant difference between .9 (population) and .82 (the sample). Let’s calculate the z statistic and see where if falls! We do this by using the following equation: 𝒛 𝒔𝒕𝒂𝒕𝒊𝒔𝒕𝒊𝒄 = 𝑝 − 𝑝 𝑝(1 − 𝑝) 𝑛
  • 33.
    So if thez statistic we calculate is less than -1.96 or greater than +1.96 then we will consider this to be rare and reject the null hypothesis and state that there is statistically significant difference between .9 (population) and .82 (the sample). Let’s calculate the z statistic and see where if falls! We do this by using the following equation: Zstatistic is what we are trying to find to see if it is outside or inside the z critical values (-1.96 and +1.96). 𝒛 𝒔𝒕𝒂𝒕𝒊𝒔𝒕𝒊𝒄 = 𝑝 − 𝑝 𝑝(1 − 𝑝) 𝑛
  • 34.
    𝒑 is theproportion from the sample that recommended aspirin to their patients (. 𝟖𝟐) 𝒛 𝒔𝒕𝒂𝒕𝒊𝒔𝒕𝒊𝒄 = 𝑝 − 𝑝 𝑝(1 − 𝑝) 𝑛 A survey claims that 9 out of 10 doctors recommend aspirin for their patients with headaches. To test this claim, a random sample of 100 doctors is obtained. Of these 100 doctors, 82 indicate that they recommend aspirin. Is this claim accurate? Use alpha = 0.05
  • 35.
    𝐩 is theproportion from the population that recommended aspirin to their patients (.90) 𝒛 𝒔𝒕𝒂𝒕𝒊𝒔𝒕𝒊𝒄 = 𝑝 − 𝑝 𝑝(1 − 𝑝) 𝑛 A survey claims that 9 out of 10 doctors recommend aspirin for their patients with headaches. To test this claim, a random sample of 100 doctors is obtained. Of these 100 doctors, 82 indicate that they recommend aspirin. Is this claim accurate? Use alpha = 0.05
  • 36.
    𝒛 𝒔𝒕𝒂𝒕𝒊𝒔𝒕𝒊𝒄 = 𝑝− 𝑝 𝑝(1 − 𝑝) 𝑛 A survey claims that 9 out of 10 doctors recommend aspirin for their patients with headaches. To test this claim, a random sample of 100 doctors is obtained. Of these 100 doctors, 82 indicate that they recommend aspirin. Is this claim accurate? Use alpha = 0.05 𝒏 is the size of the sample (100)
  • 37.
    𝒛 𝒔𝒕𝒂𝒕𝒊𝒔𝒕𝒊𝒄 = 𝑝− 𝑝 𝑝(1 − 𝑝) 𝑛 A survey claims that 9 out of 10 doctors recommend aspirin for their patients with headaches. To test this claim, a random sample of 100 doctors is obtained. Of these 100 doctors, 82 indicate that they recommend aspirin. Is this claim accurate? Use alpha = 0.05 Let’s plug in the numbers
  • 38.
    𝒛 𝒔𝒕𝒂𝒕𝒊𝒔𝒕𝒊𝒄 = .82− 𝑝 𝑝(1 − 𝑝) 𝑛 A survey claims that 9 out of 10 doctors recommend aspirin for their patients with headaches. To test this claim, a random sample of 100 doctors is obtained. Of these 100 doctors, 82 indicate that they recommend aspirin. Is this claim accurate? Use alpha = 0.05 Sample Proportion
  • 39.
    𝒛 𝒔𝒕𝒂𝒕𝒊𝒔𝒕𝒊𝒄 = .82− .90 .90(1 − .90) 𝑛 A survey claims that 9 out of 10 doctors recommend aspirin for their patients with headaches. To test this claim, a random sample of 100 doctors is obtained. Of these 100 doctors, 82 indicate that they recommend aspirin. Is this claim accurate? Use alpha = 0.05 Population Proportion
  • 40.
    𝒛 𝒔𝒕𝒂𝒕𝒊𝒔𝒕𝒊𝒄 = −.08 .90(1− .90) 𝑛 A survey claims that 9 out of 10 doctors recommend aspirin for their patients with headaches. To test this claim, a random sample of 100 doctors is obtained. Of these 100 doctors, 82 indicate that they recommend aspirin. Is this claim accurate? Use alpha = 0.05 The difference
  • 41.
    𝒛 𝒔𝒕𝒂𝒕𝒊𝒔𝒕𝒊𝒄 = −.08 .90(1− .90) 𝑛 A survey claims that 9 out of 10 doctors recommend aspirin for their patients with headaches. To test this claim, a random sample of 100 doctors is obtained. Of these 100 doctors, 82 indicate that they recommend aspirin. Is this claim accurate? Use alpha = 0.05 Now for the denominator which is the estimated standard error. This value will help us know how many standard error units .82 and .90 are apart from one another.
  • 42.
    𝒛 𝒔𝒕𝒂𝒕𝒊𝒔𝒕𝒊𝒄 = −.08 .90(1− .90) 𝑛 A survey claims that 9 out of 10 doctors recommend aspirin for their patients with headaches. To test this claim, a random sample of 100 doctors is obtained. Of these 100 doctors, 82 indicate that they recommend aspirin. Is this claim accurate? Use alpha = 0.05 If the standard error is small then the z statistic will be larger. If it exceeds the -1.96 or +1.96 boundaries, then we will reject the null hypothesis. If it is smaller than we will not.
  • 43.
    𝒛 𝒔𝒕𝒂𝒕𝒊𝒔𝒕𝒊𝒄 = −.08 .90(1− .90) 𝑛 A survey claims that 9 out of 10 doctors recommend aspirin for their patients with headaches. To test this claim, a random sample of 100 doctors is obtained. Of these 100 doctors, 82 indicate that they recommend aspirin. Is this claim accurate? Use alpha = 0.05 Let’s continue our calculations and find out:
  • 44.
    𝒛 𝒔𝒕𝒂𝒕𝒊𝒔𝒕𝒊𝒄 = −.08 .90(.10) 𝑛 Asurvey claims that 9 out of 10 doctors recommend aspirin for their patients with headaches. To test this claim, a random sample of 100 doctors is obtained. Of these 100 doctors, 82 indicate that they recommend aspirin. Is this claim accurate? Use alpha = 0.05 Let’s continue our calculations and find out:
  • 45.
    𝒛 𝒔𝒕𝒂𝒕𝒊𝒔𝒕𝒊𝒄 = −.08 .09 𝑛 Asurvey claims that 9 out of 10 doctors recommend aspirin for their patients with headaches. To test this claim, a random sample of 100 doctors is obtained. Of these 100 doctors, 82 indicate that they recommend aspirin. Is this claim accurate? Use alpha = 0.05 Let’s continue our calculations and find out:
  • 46.
    𝒛 𝒔𝒕𝒂𝒕𝒊𝒔𝒕𝒊𝒄 = −.08 .09 100 Asurvey claims that 9 out of 10 doctors recommend aspirin for their patients with headaches. To test this claim, a random sample of 100 doctors is obtained. Of these 100 doctors, 82 indicate that they recommend aspirin. Is this claim accurate? Use alpha = 0.05 Sample Size:
  • 47.
    𝒛 𝒔𝒕𝒂𝒕𝒊𝒔𝒕𝒊𝒄 = −.08 .0009 Asurvey claims that 9 out of 10 doctors recommend aspirin for their patients with headaches. To test this claim, a random sample of 100 doctors is obtained. Of these 100 doctors, 82 indicate that they recommend aspirin. Is this claim accurate? Use alpha = 0.05 Let‘s continue our calculations:
  • 48.
    𝒛 𝒔𝒕𝒂𝒕𝒊𝒔𝒕𝒊𝒄 = −.08 .03 Asurvey claims that 9 out of 10 doctors recommend aspirin for their patients with headaches. To test this claim, a random sample of 100 doctors is obtained. Of these 100 doctors, 82 indicate that they recommend aspirin. Is this claim accurate? Use alpha = 0.05 Let‘s continue our calculations:
  • 49.
    𝒛 𝒔𝒕𝒂𝒕𝒊𝒔𝒕𝒊𝒄 =−2.67 A survey claims that 9 out of 10 doctors recommend aspirin for their patients with headaches. To test this claim, a random sample of 100 doctors is obtained. Of these 100 doctors, 82 indicate that they recommend aspirin. Is this claim accurate? Use alpha = 0.05 Let‘s continue our calculations:
  • 50.
    𝒛 𝒔𝒕𝒂𝒕𝒊𝒔𝒕𝒊𝒄 =−2.67 A survey claims that 9 out of 10 doctors recommend aspirin for their patients with headaches. To test this claim, a random sample of 100 doctors is obtained. Of these 100 doctors, 82 indicate that they recommend aspirin. Is this claim accurate? Use alpha = 0.05 Let‘s continue our calculations: Now we have our z statistic.
  • 51.
    Let’s go backto our distribution: rarerare 95% mean-1σ +1σ-2σ +2σ Common -1.96 +1.96
  • 52.
    Let’s go backto our distribution: So, is this result rare or common? rarerare 95% mean-1σ +1σ-2σ +2σ Common -1.96 +1.96-2.67
  • 53.
    Let’s go backto our distribution: So, is this result rare or common? rarerare 95% mean-1σ +1σ-2σ +2σ Common -1.96 +1.96-2.67
  • 54.
    Looks like itis a rare event therefore we will reject the null hypothesis in favor of the alternative hypothesis:
  • 55.
    Looks like itis a rare event therefore we will reject the null hypothesis in favor of the alternative hypothesis: The proportion of a sample of 100 medical doctors who recommend aspirin for their patients with headaches IS statistically significantly different from the claim that 9 out of 10 doctors recommend aspirin for their patients with headaches.