Download as PDF, PPTX
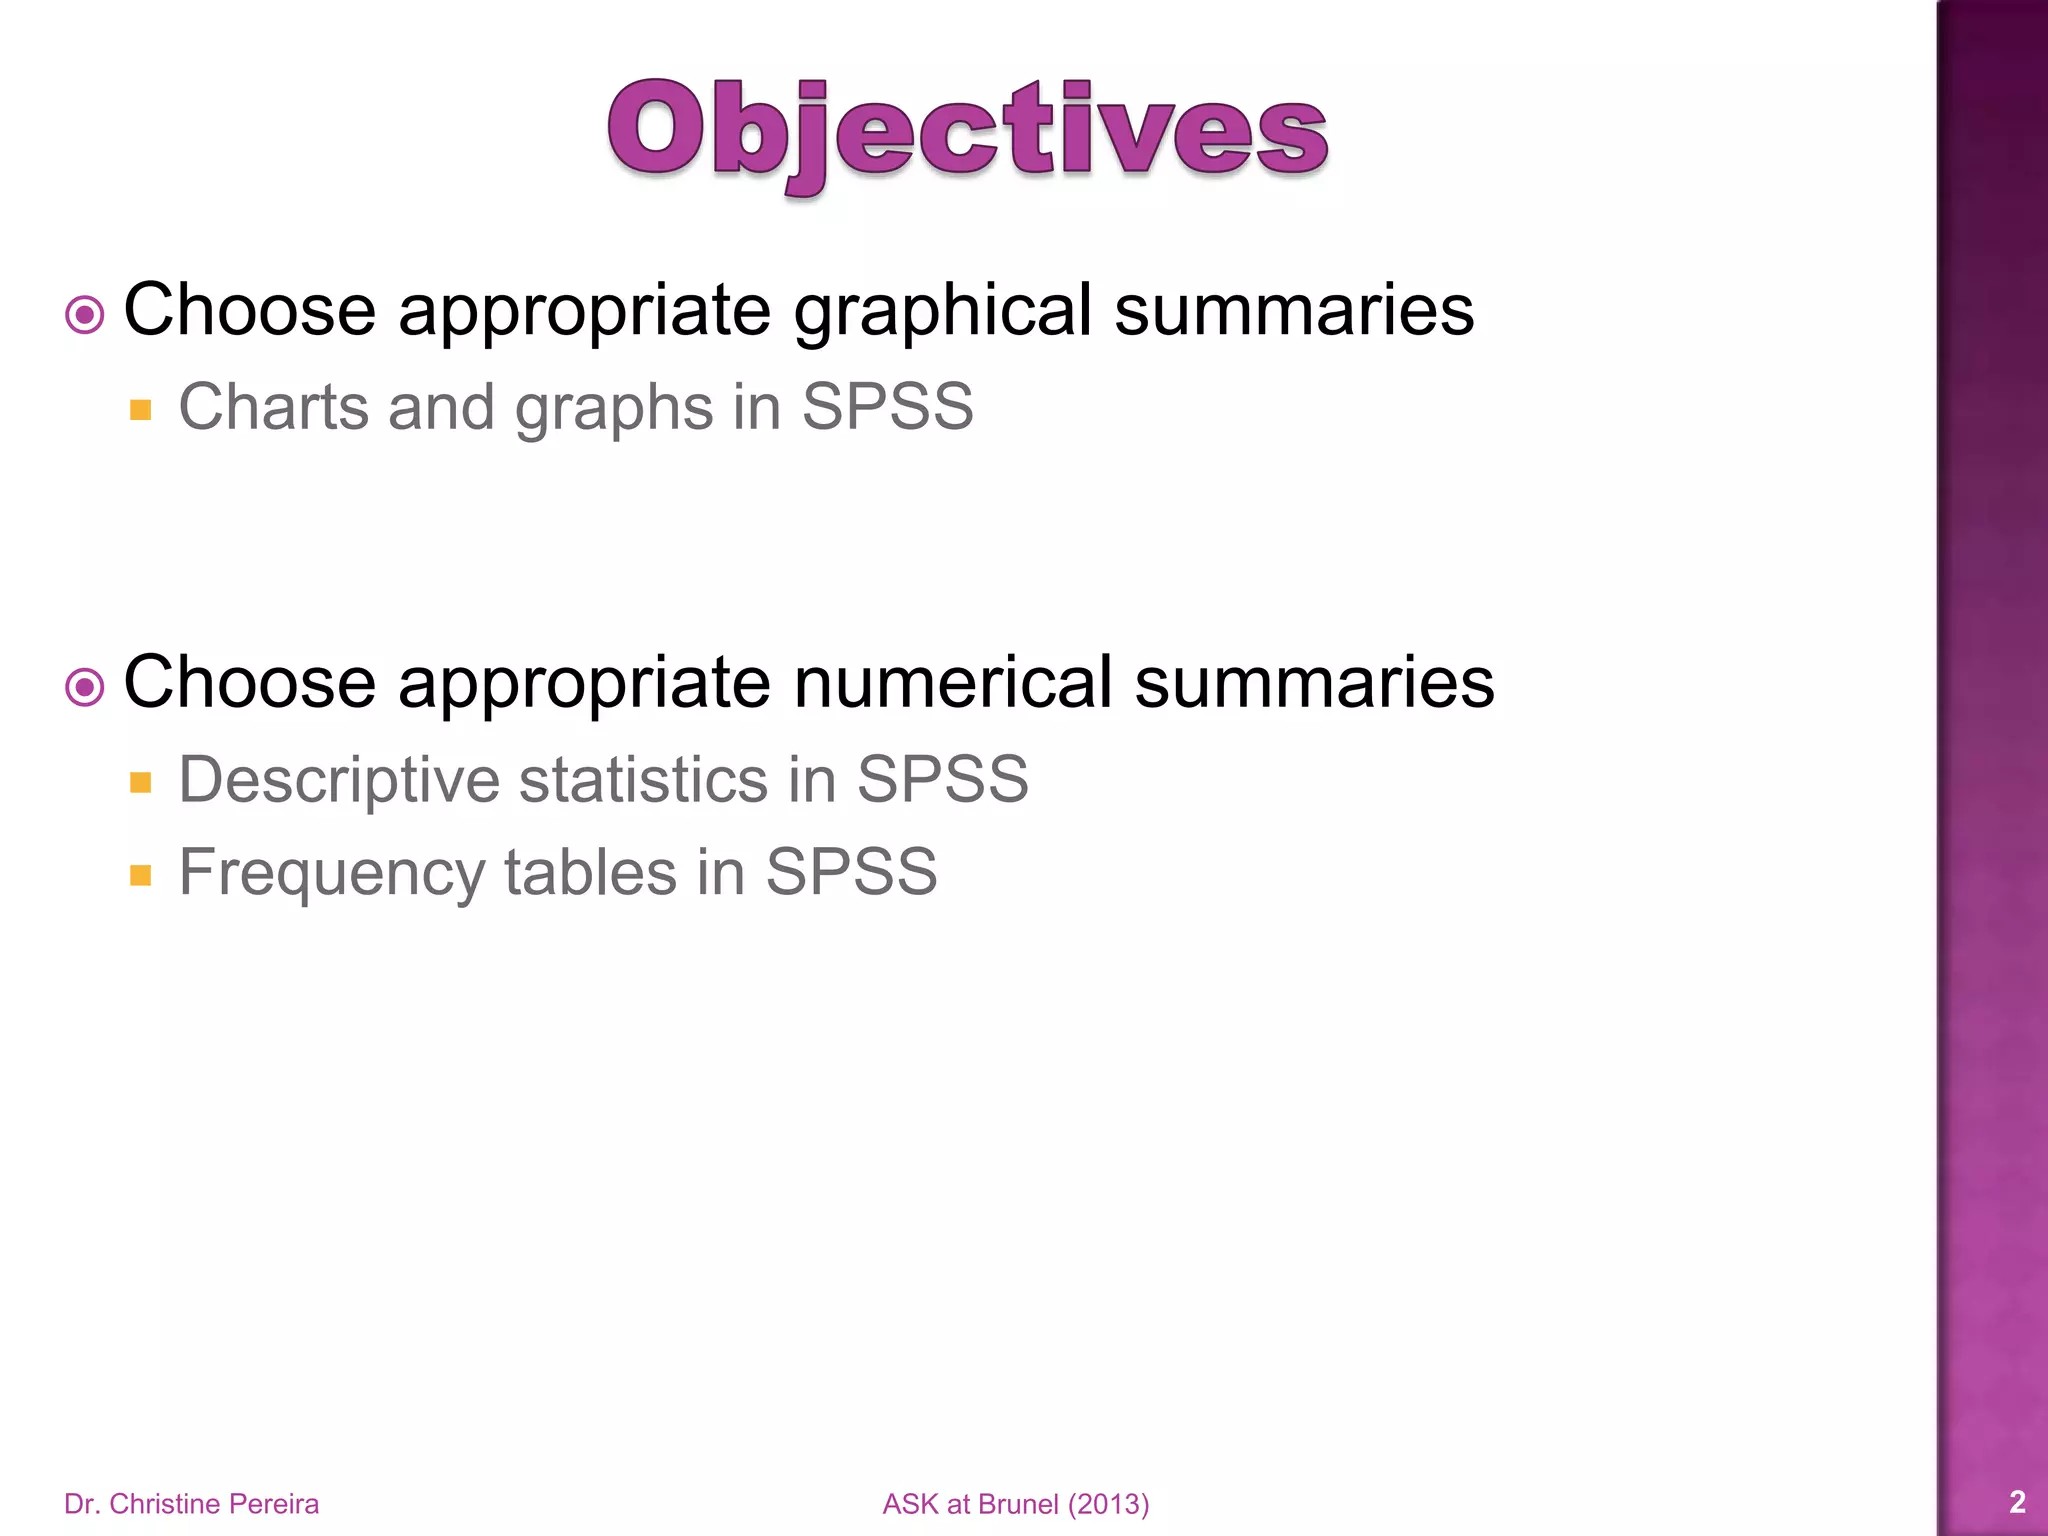
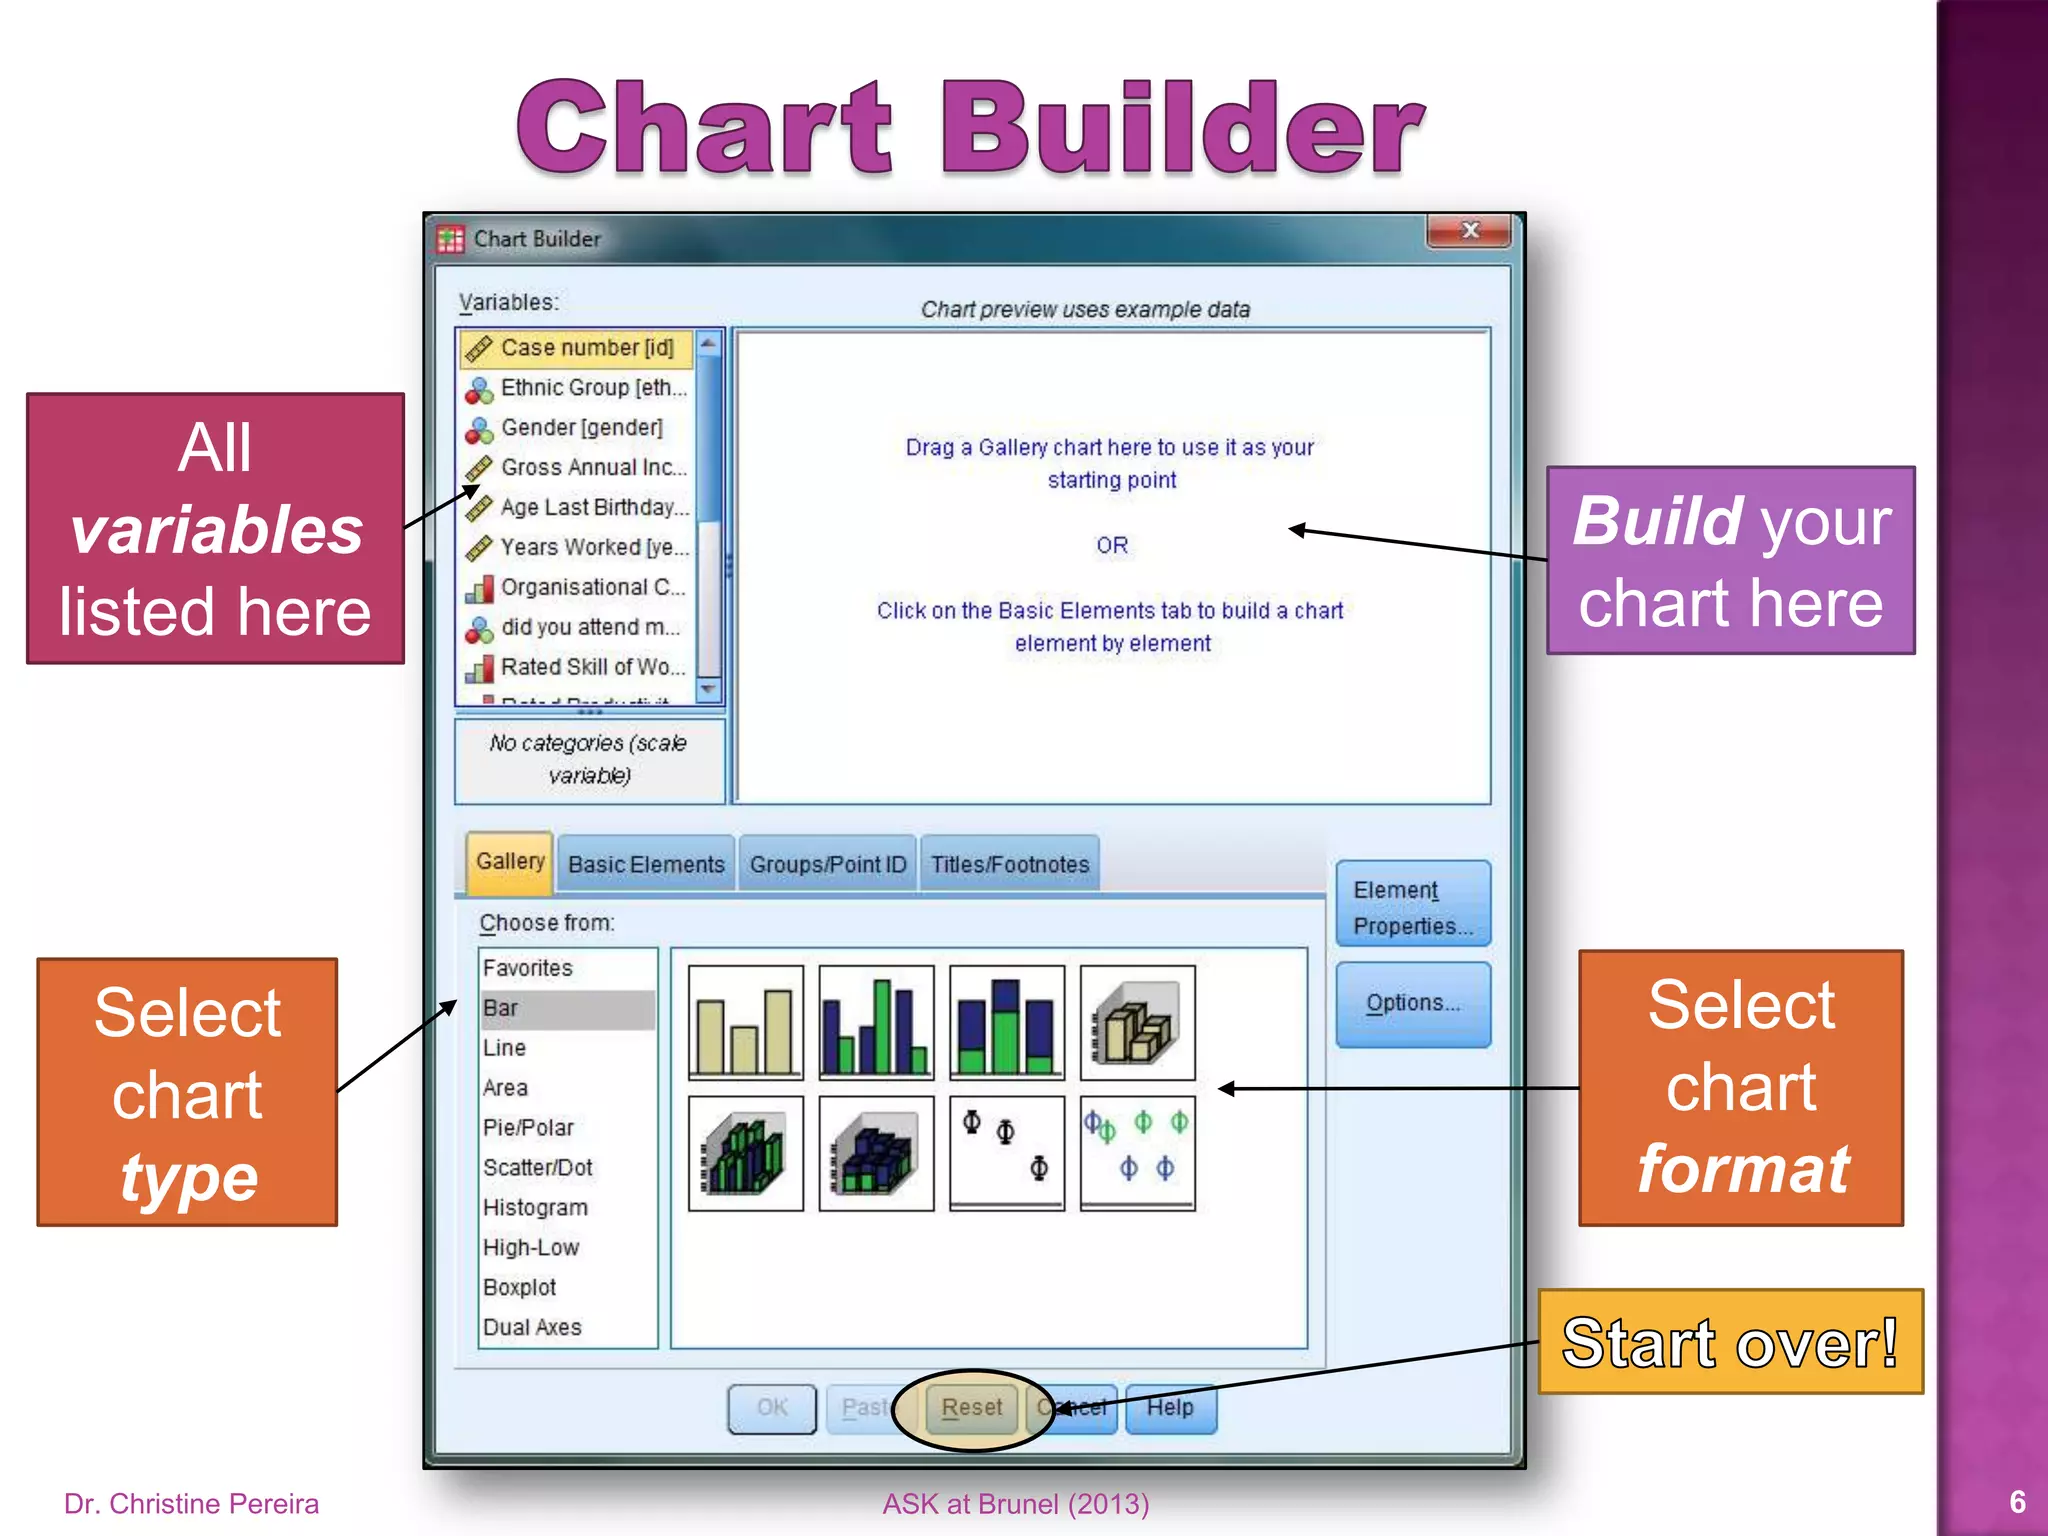
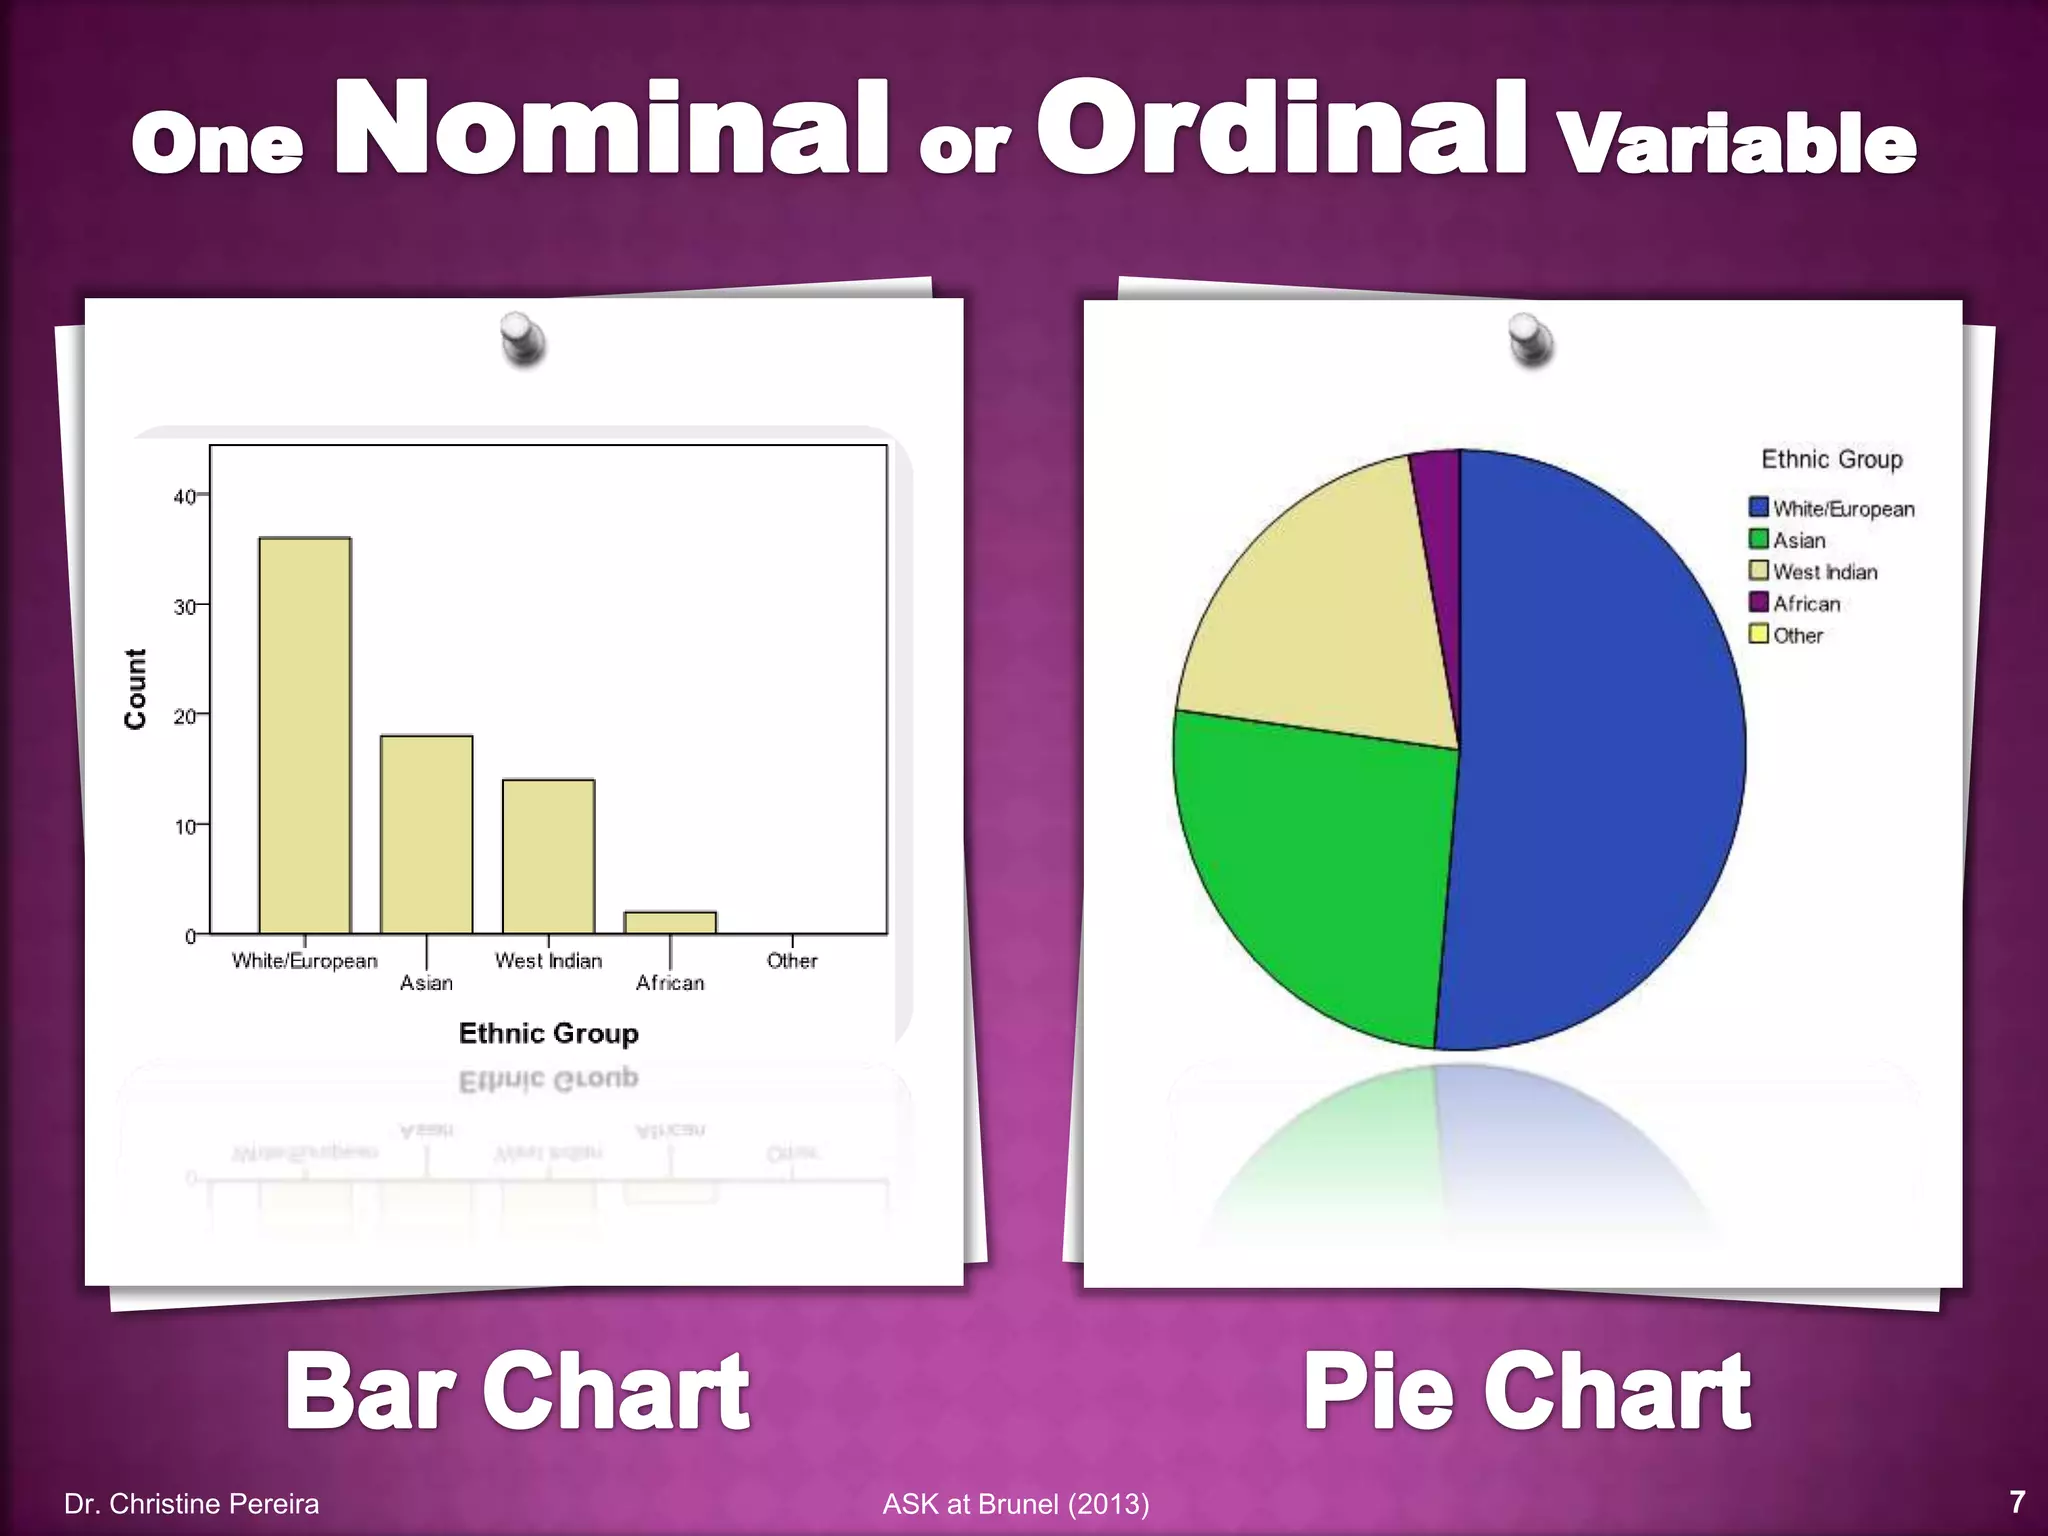
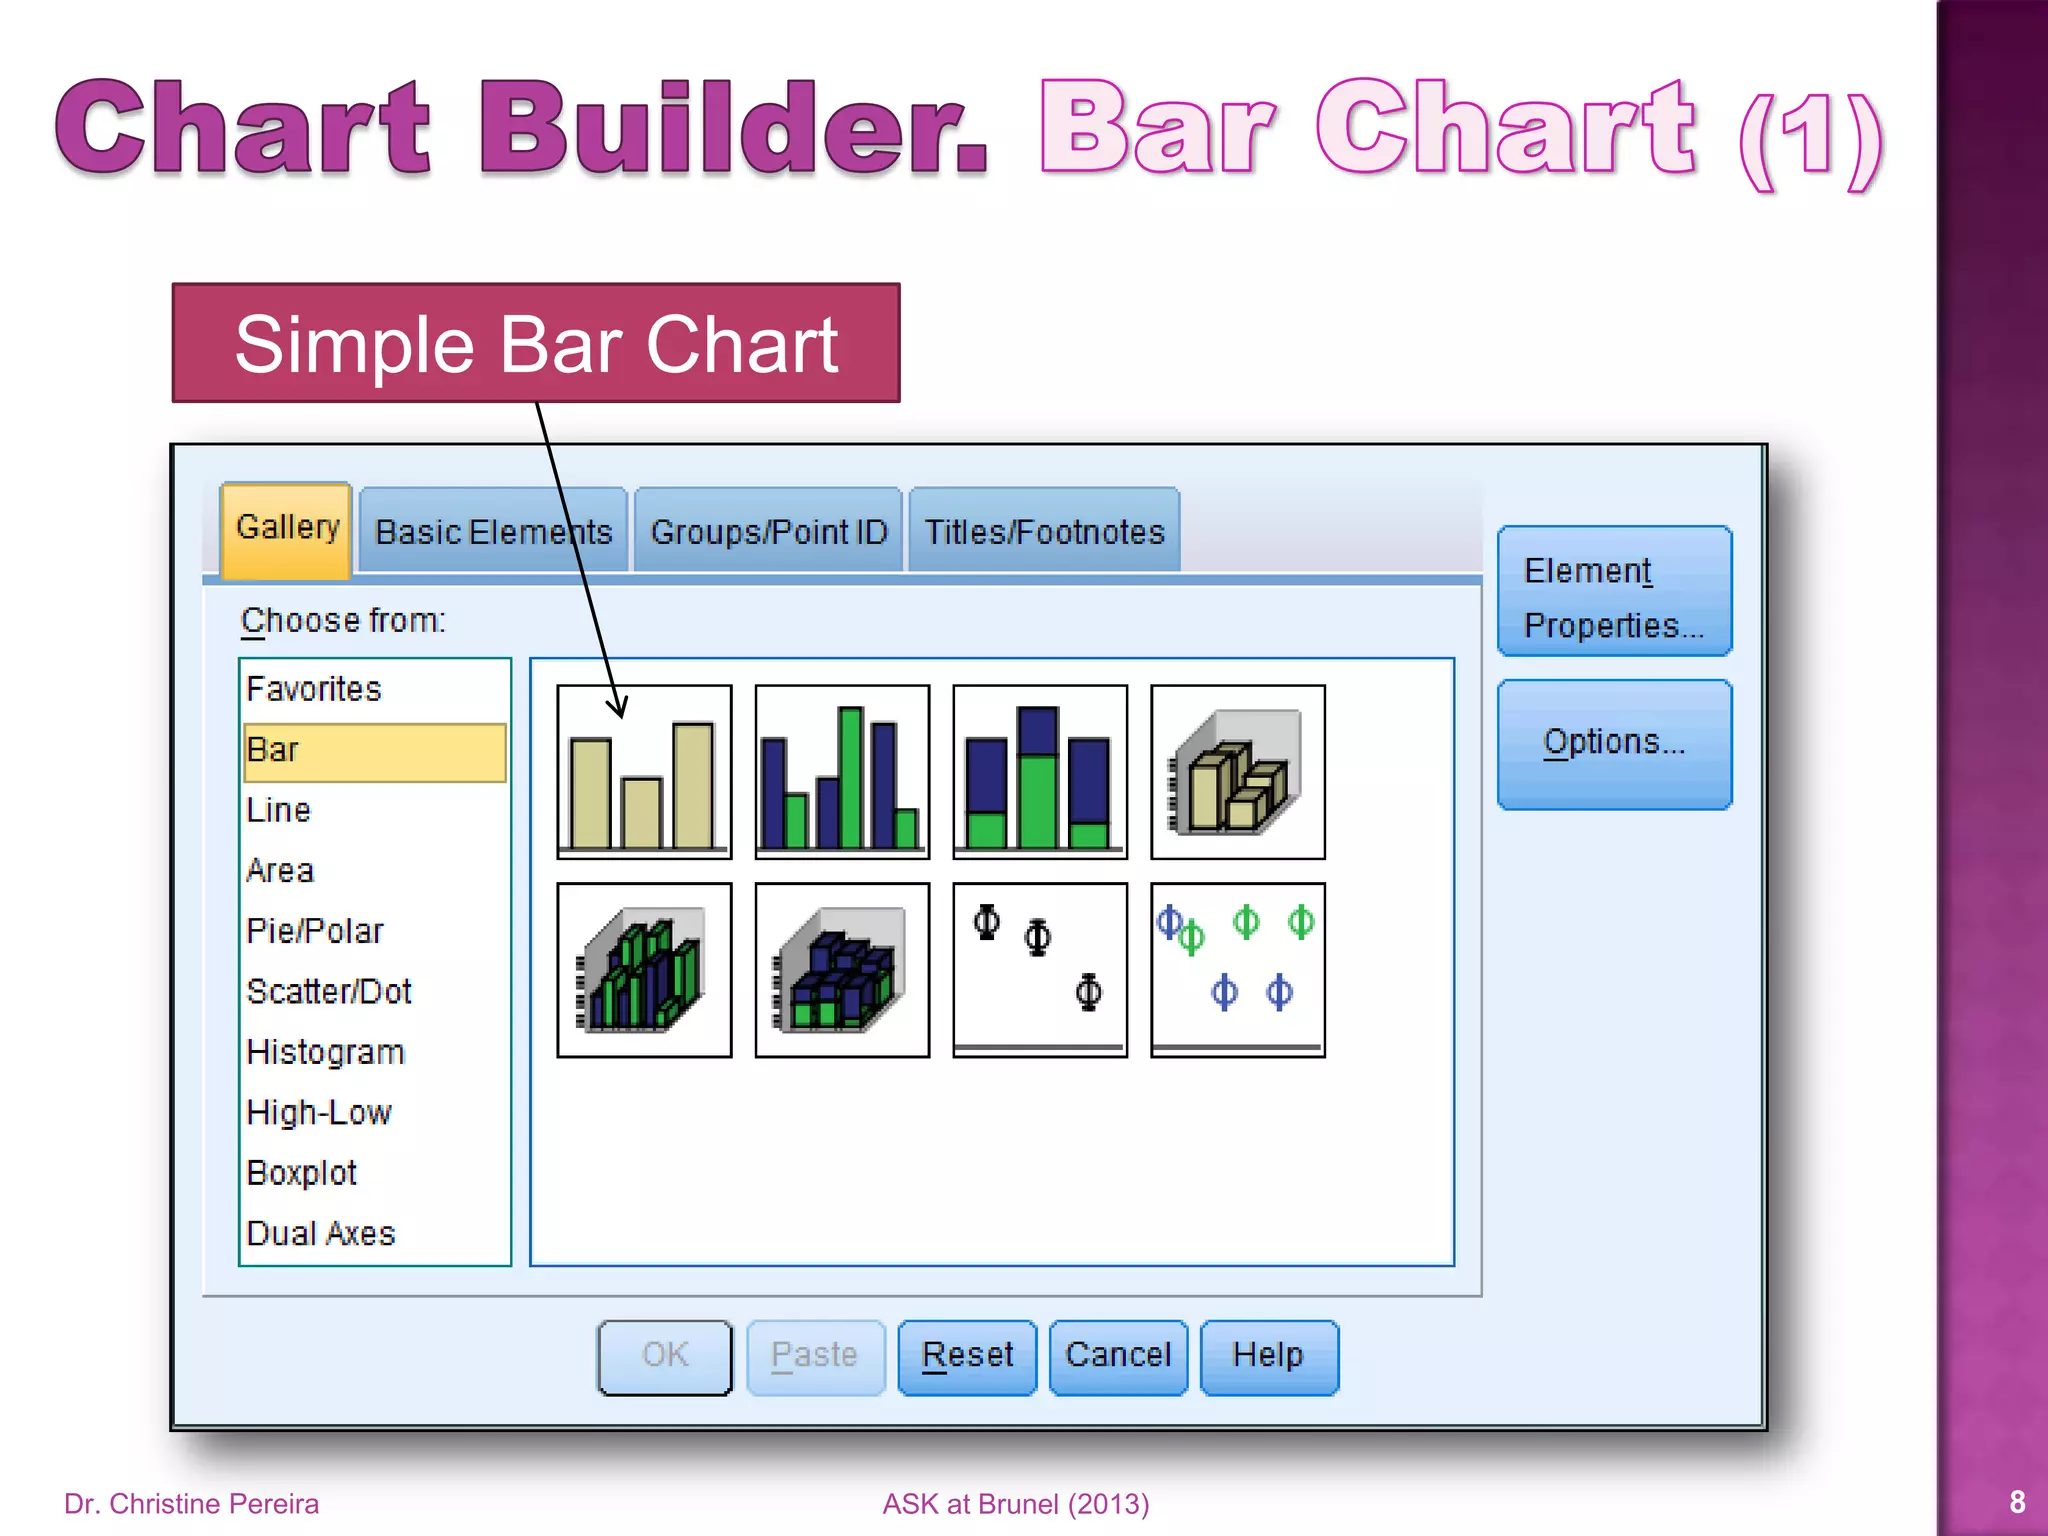
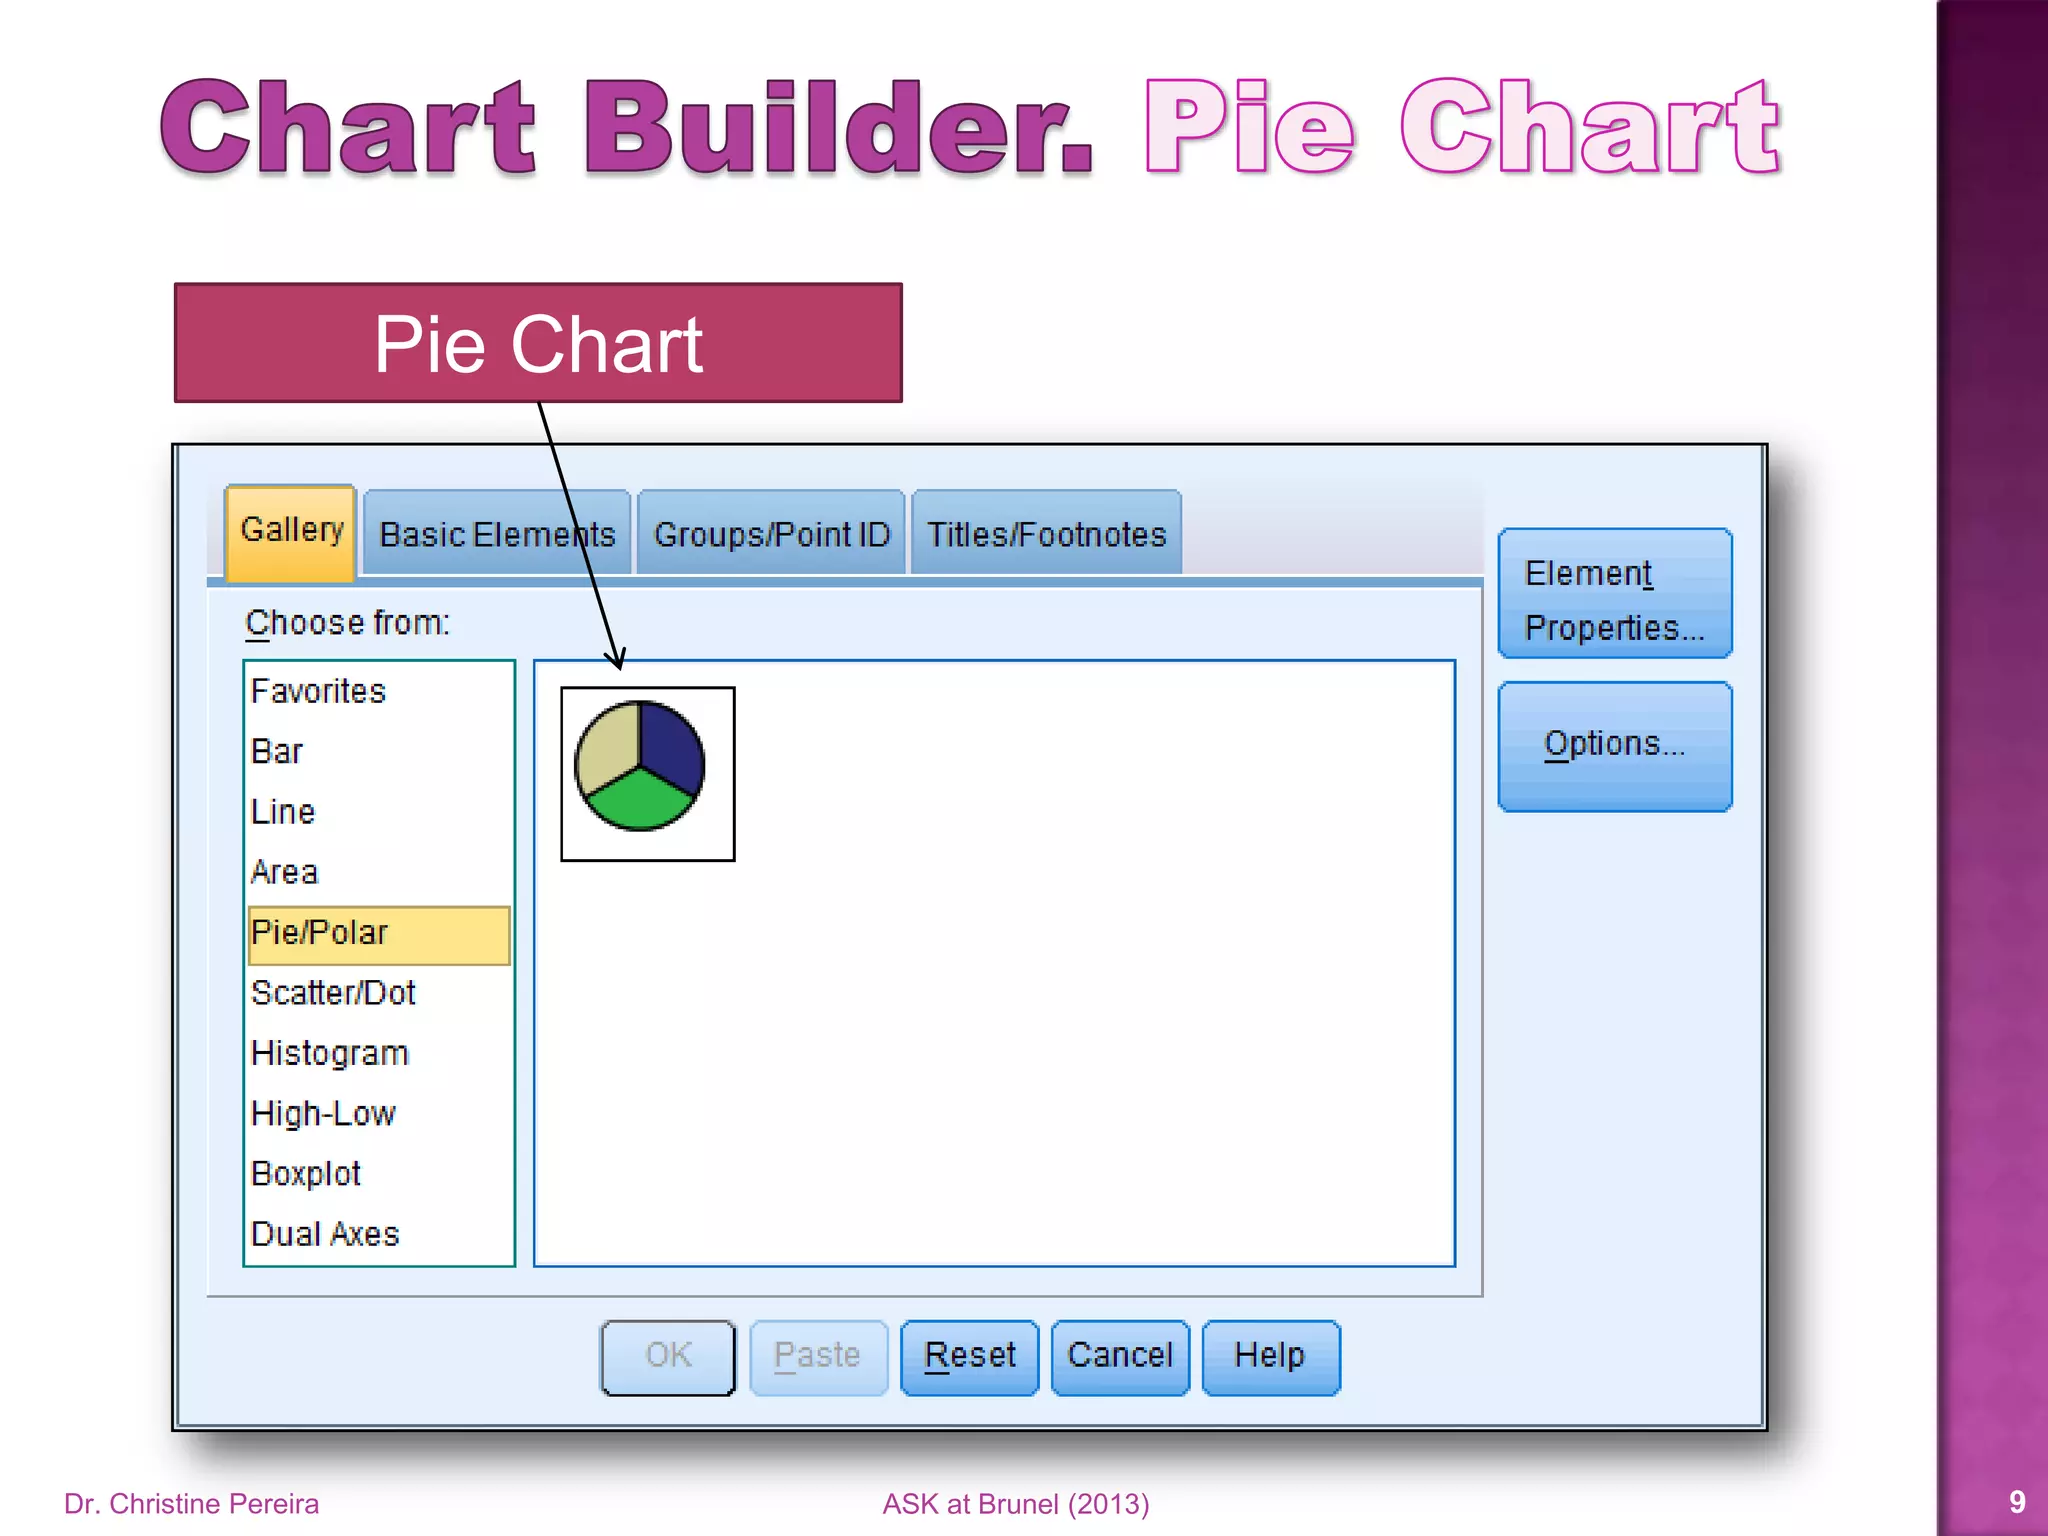
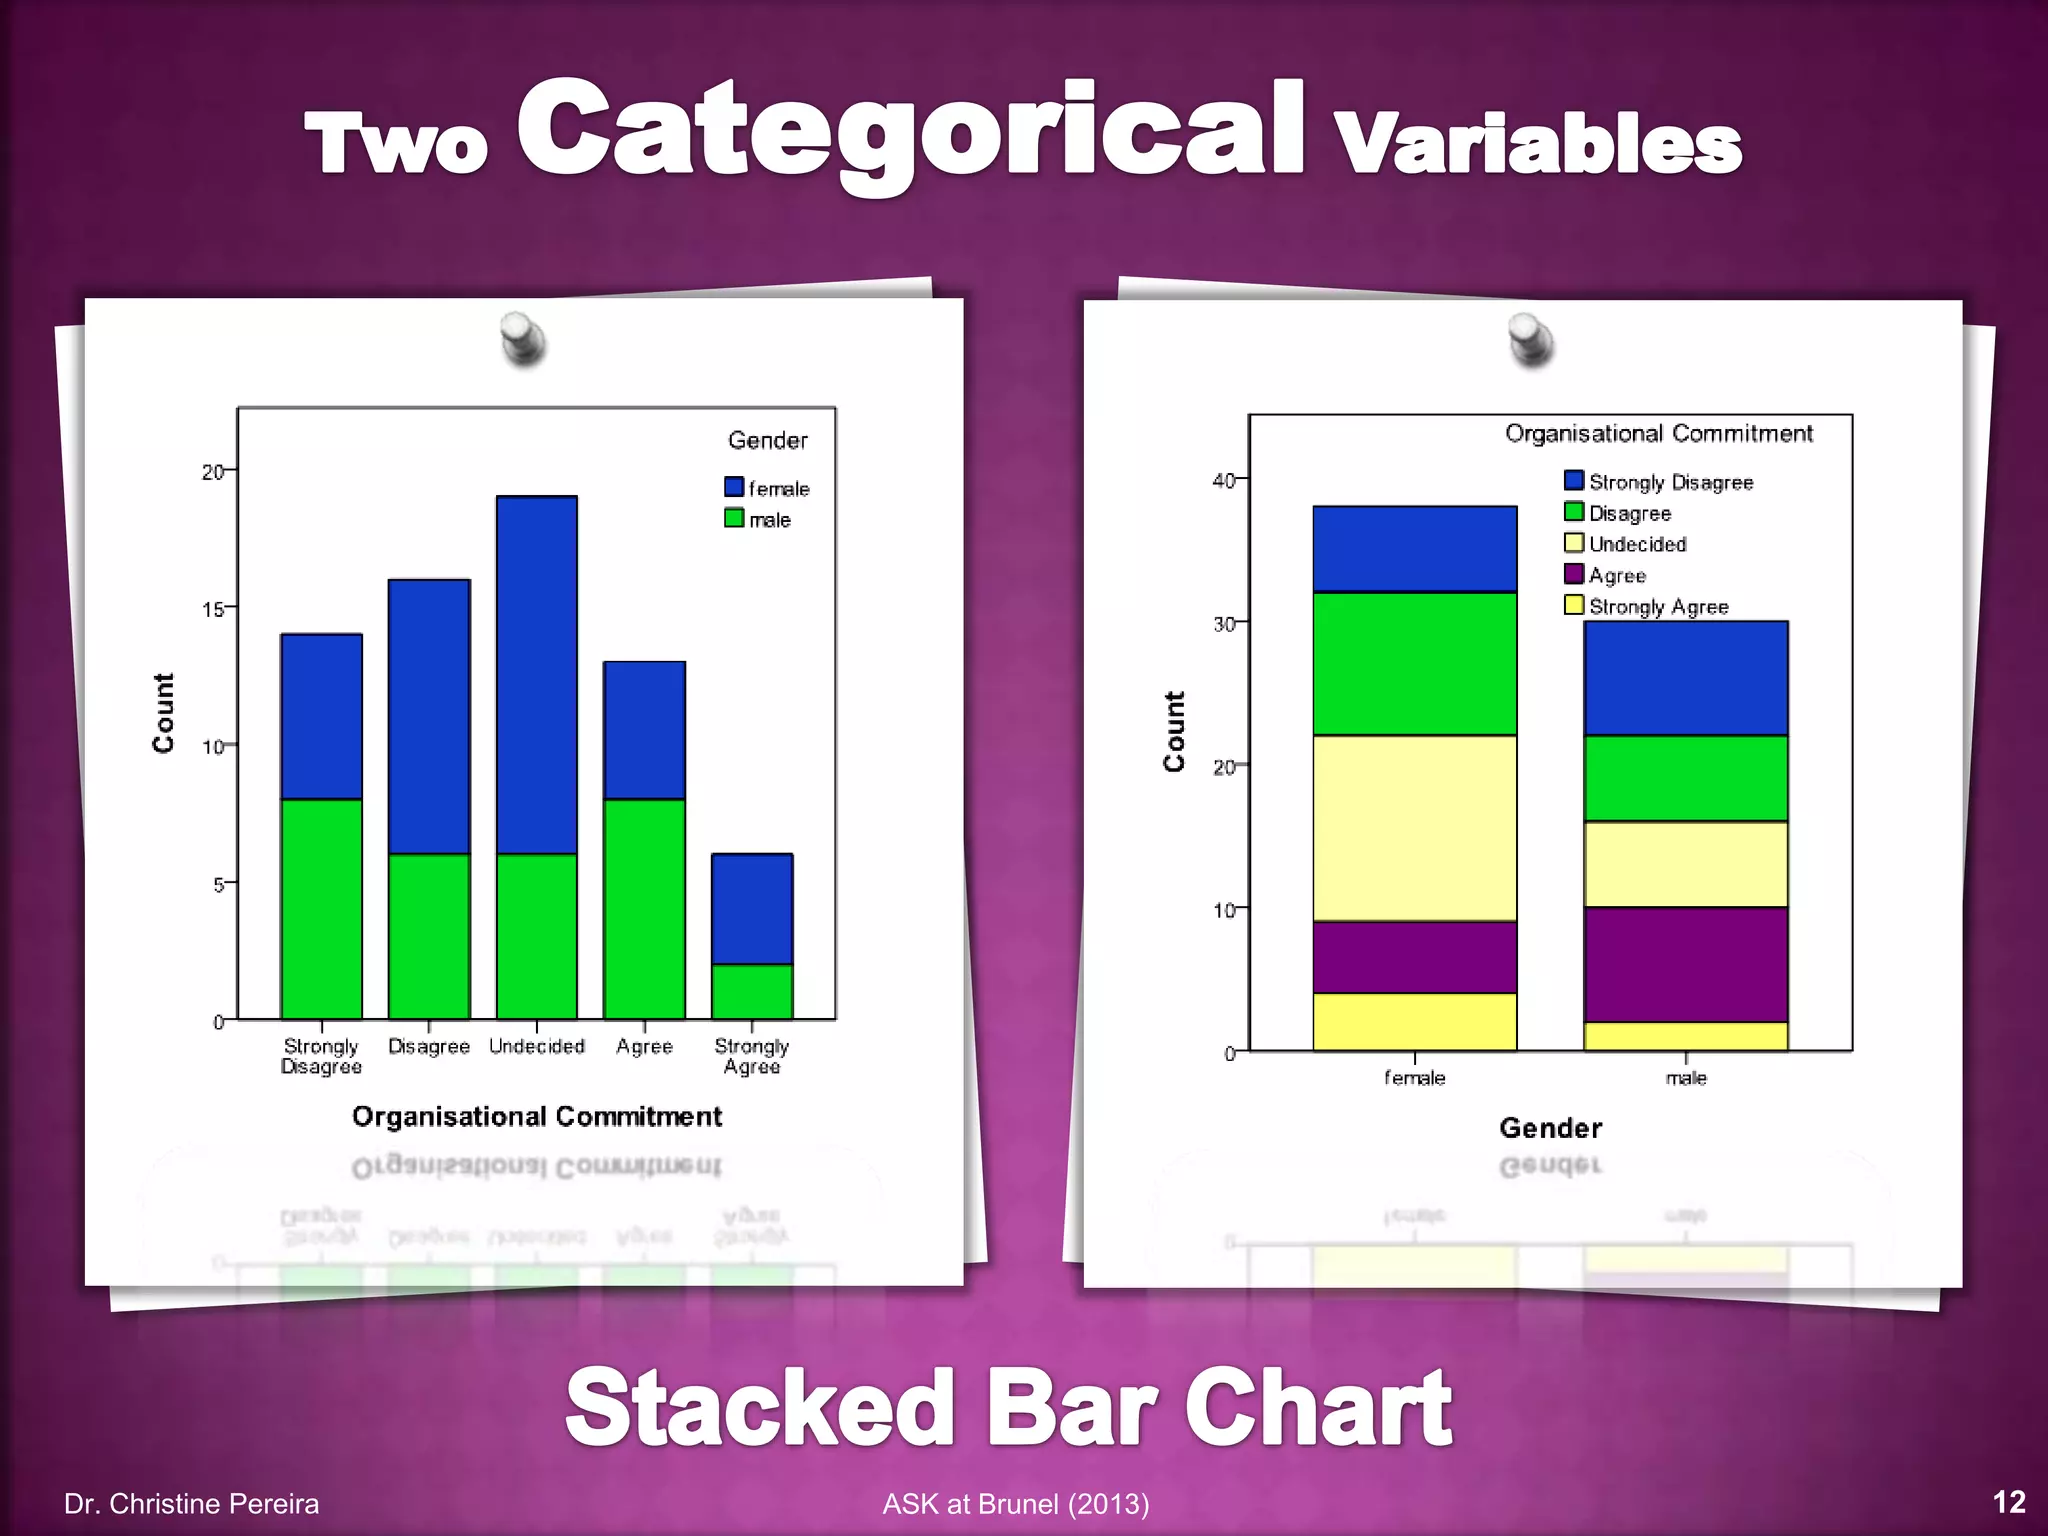
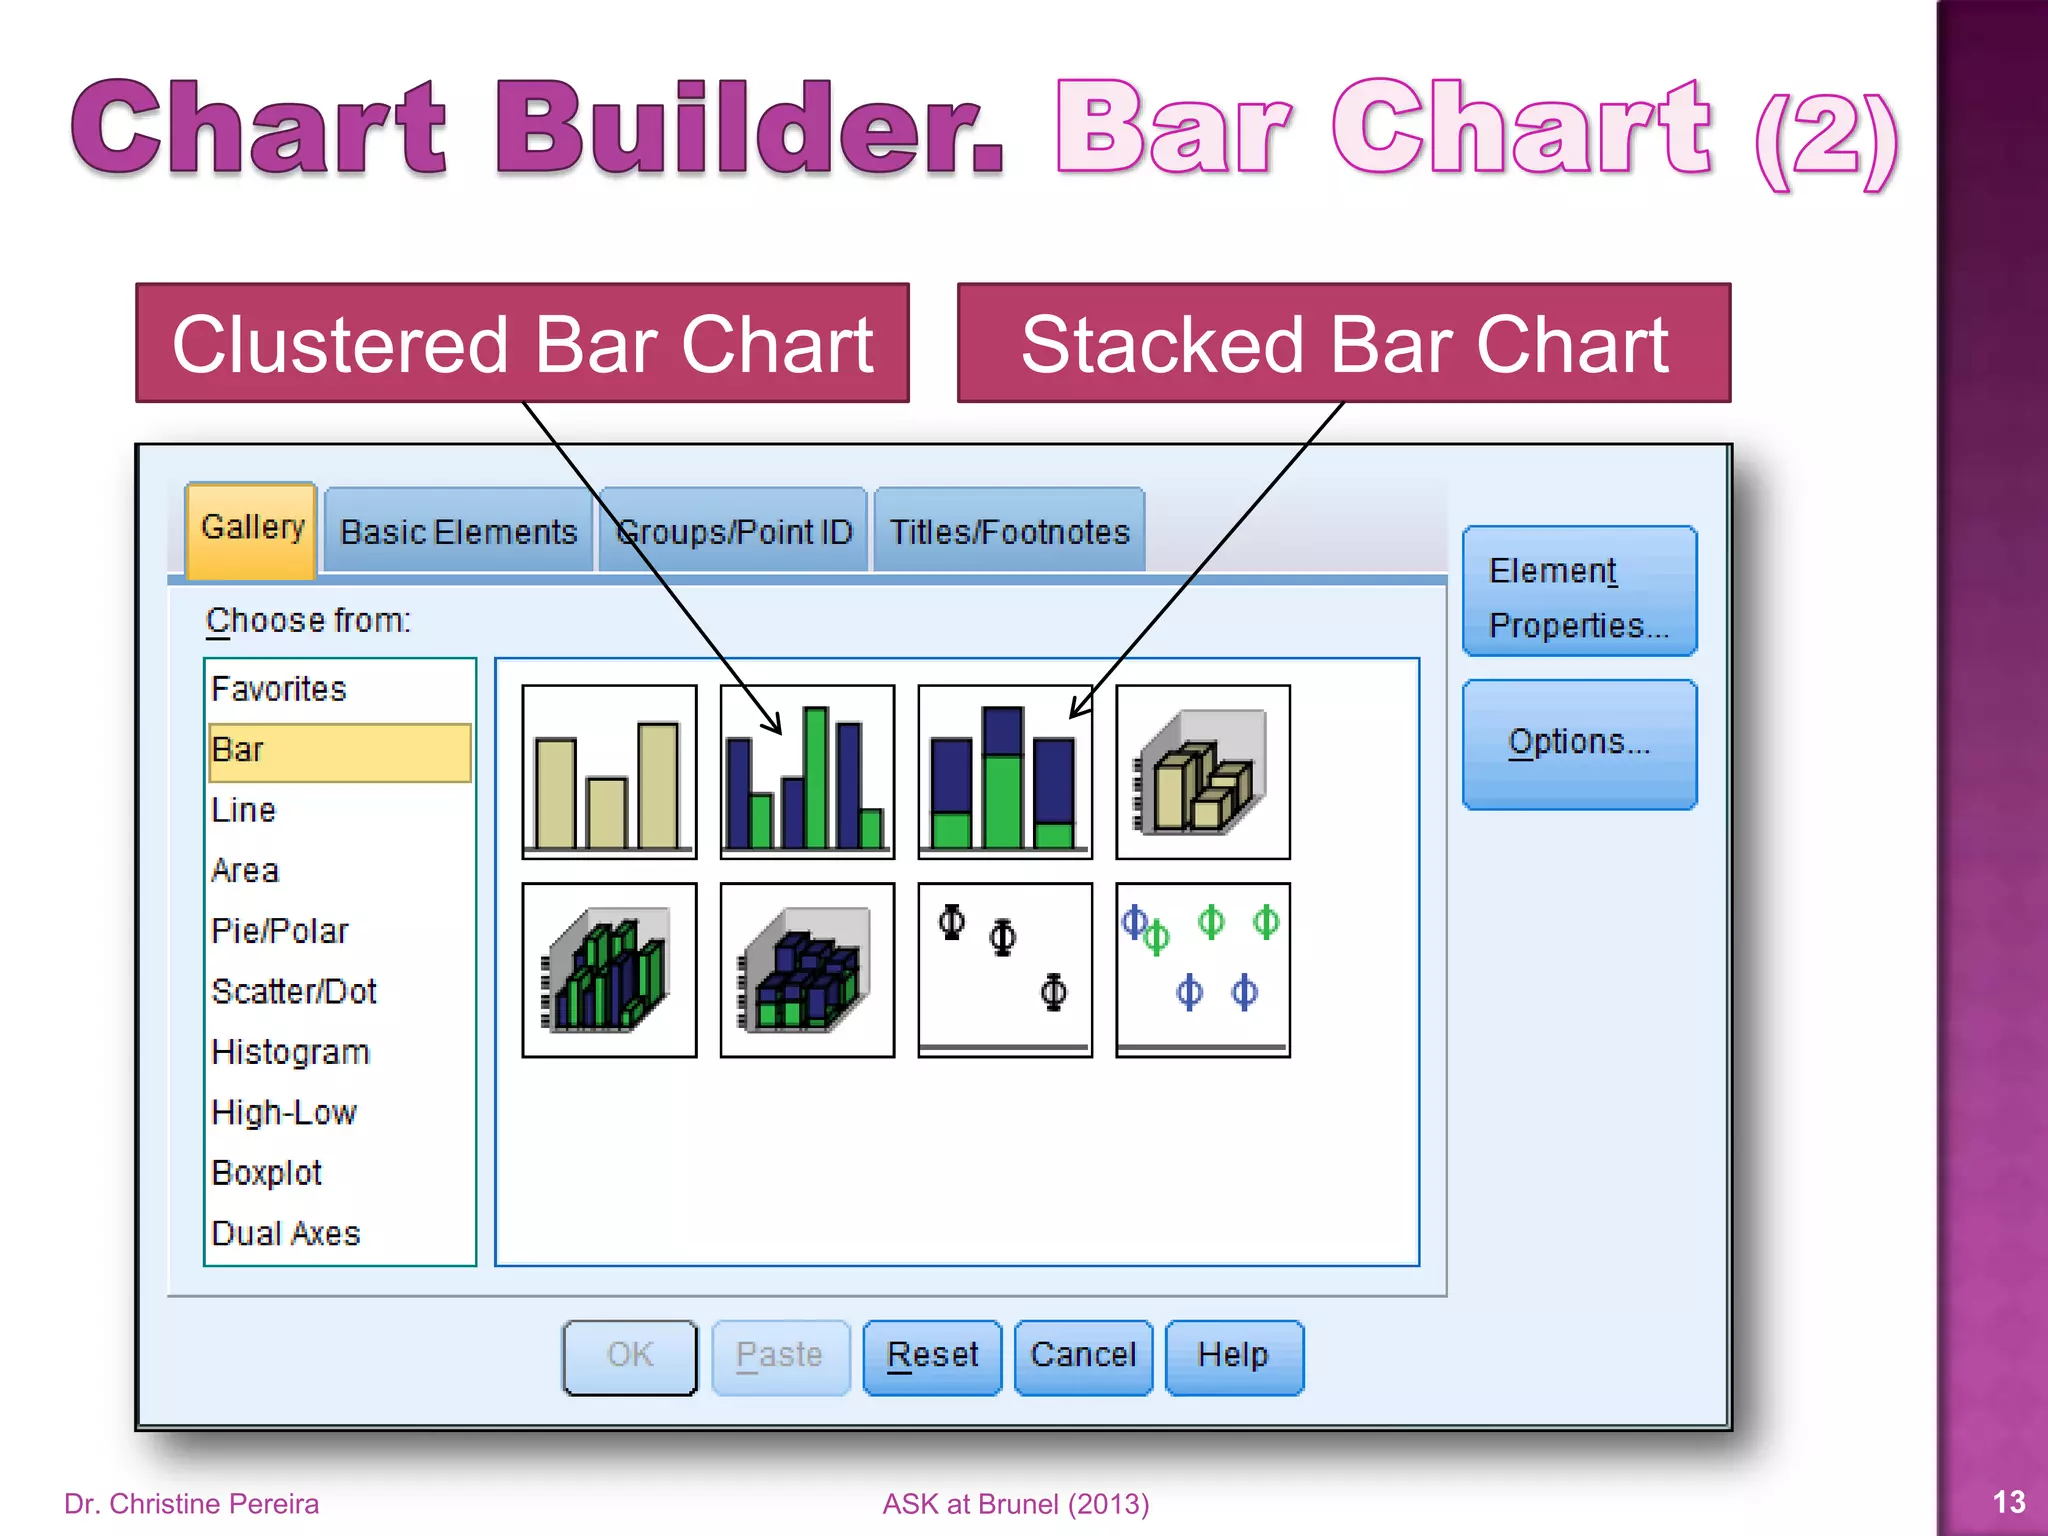
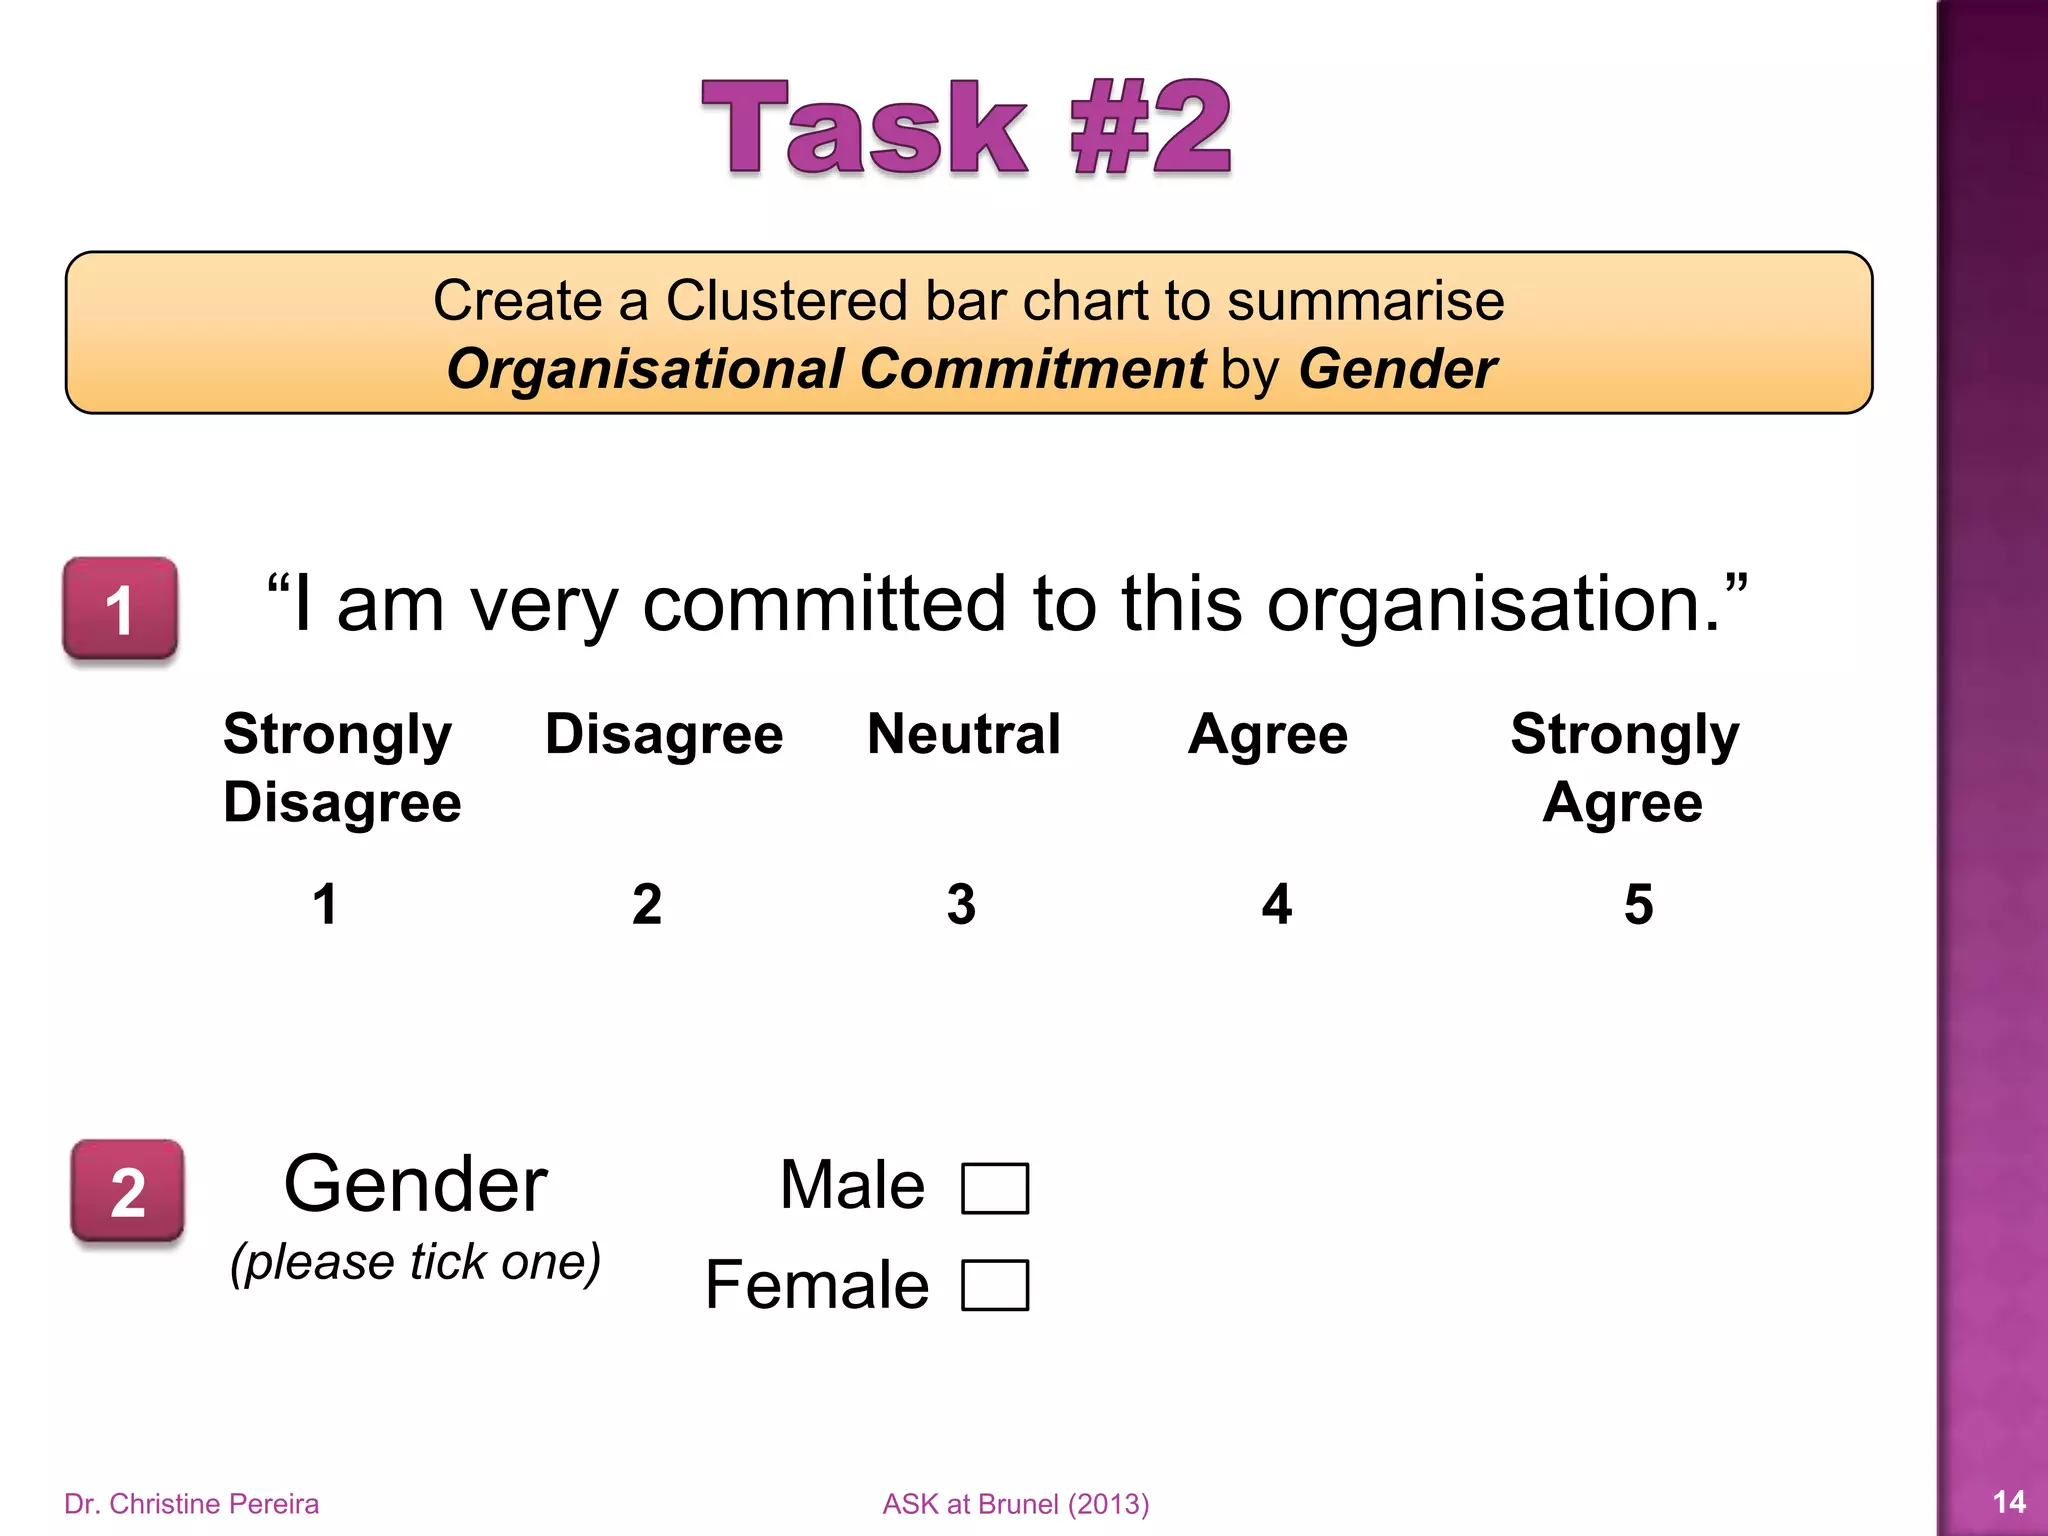
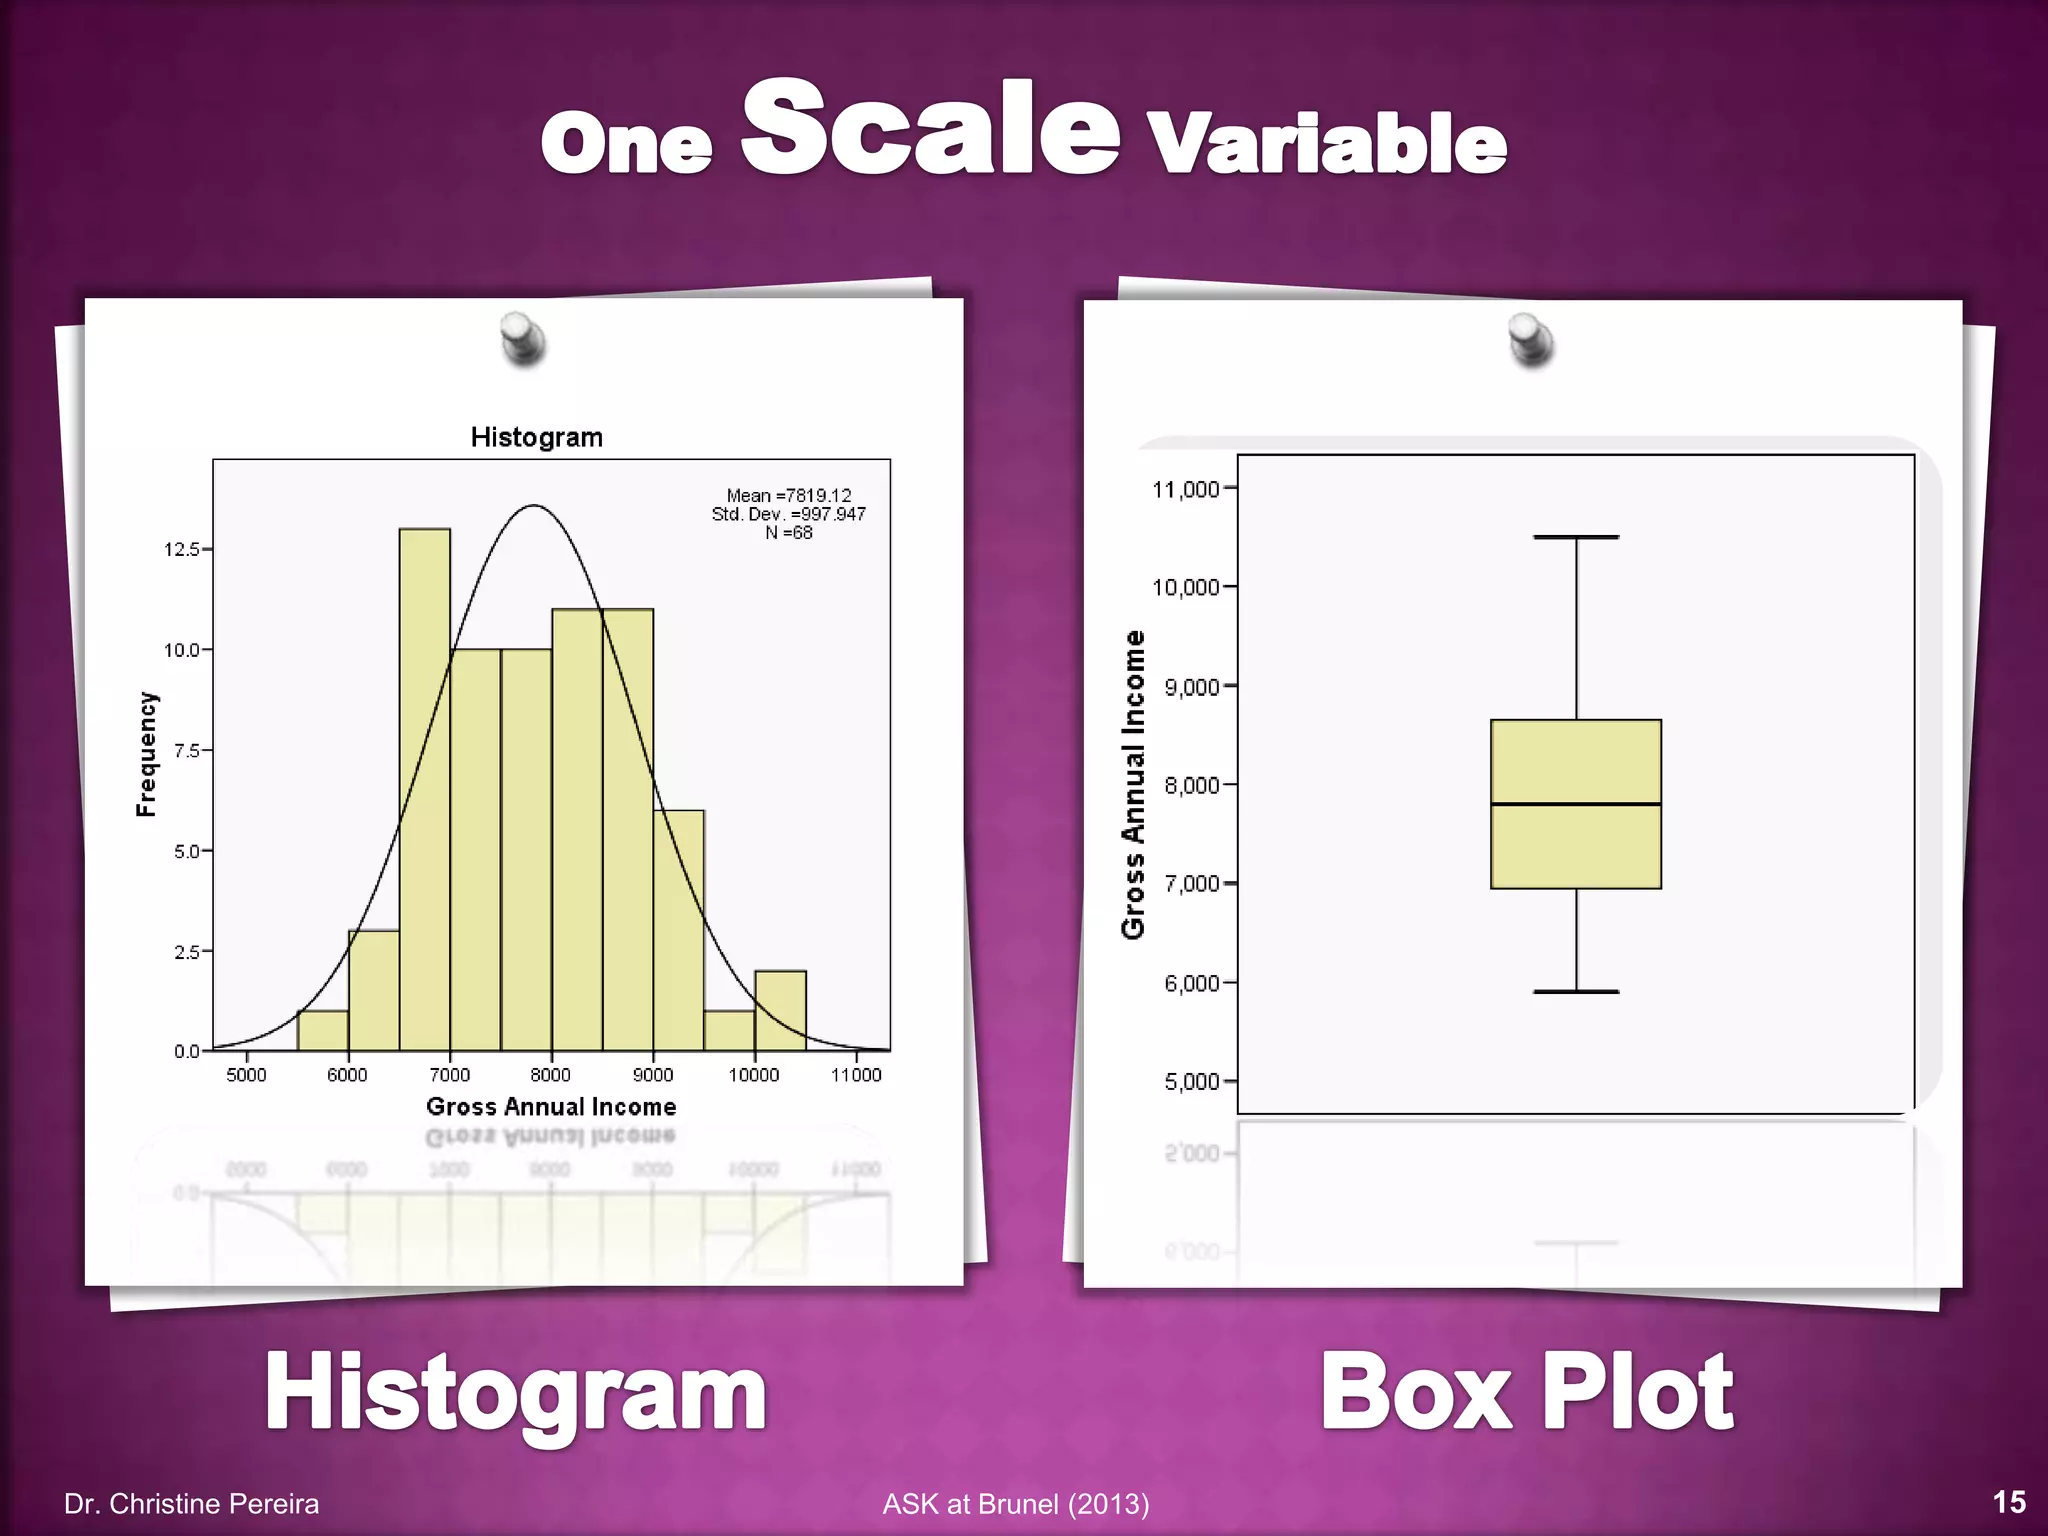
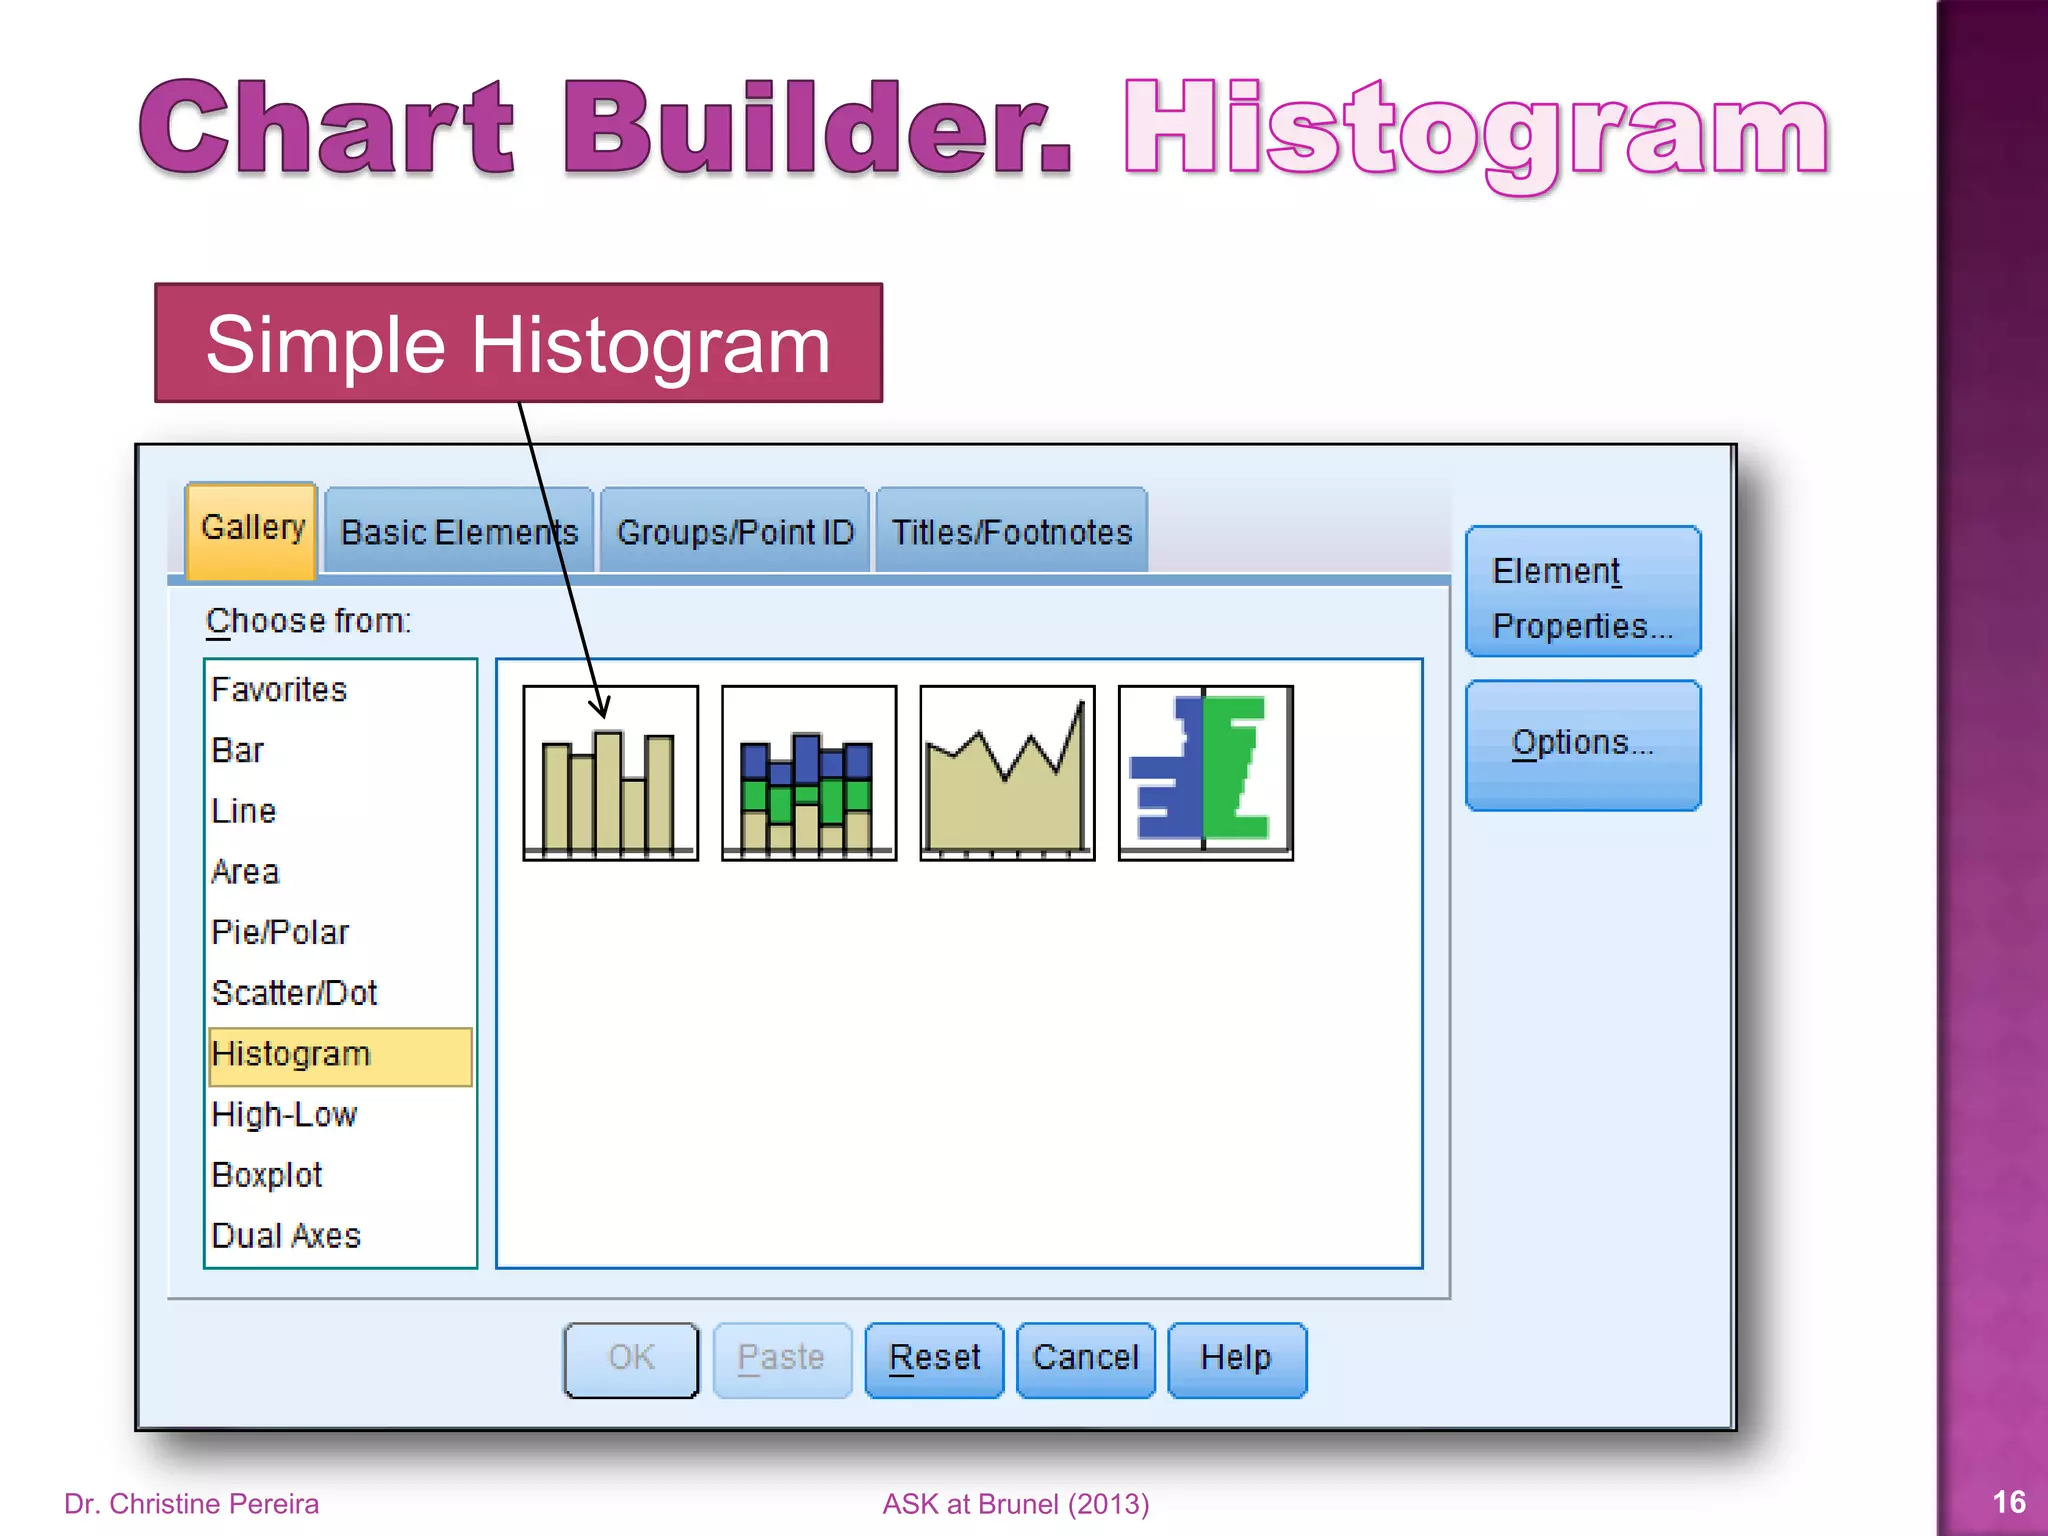
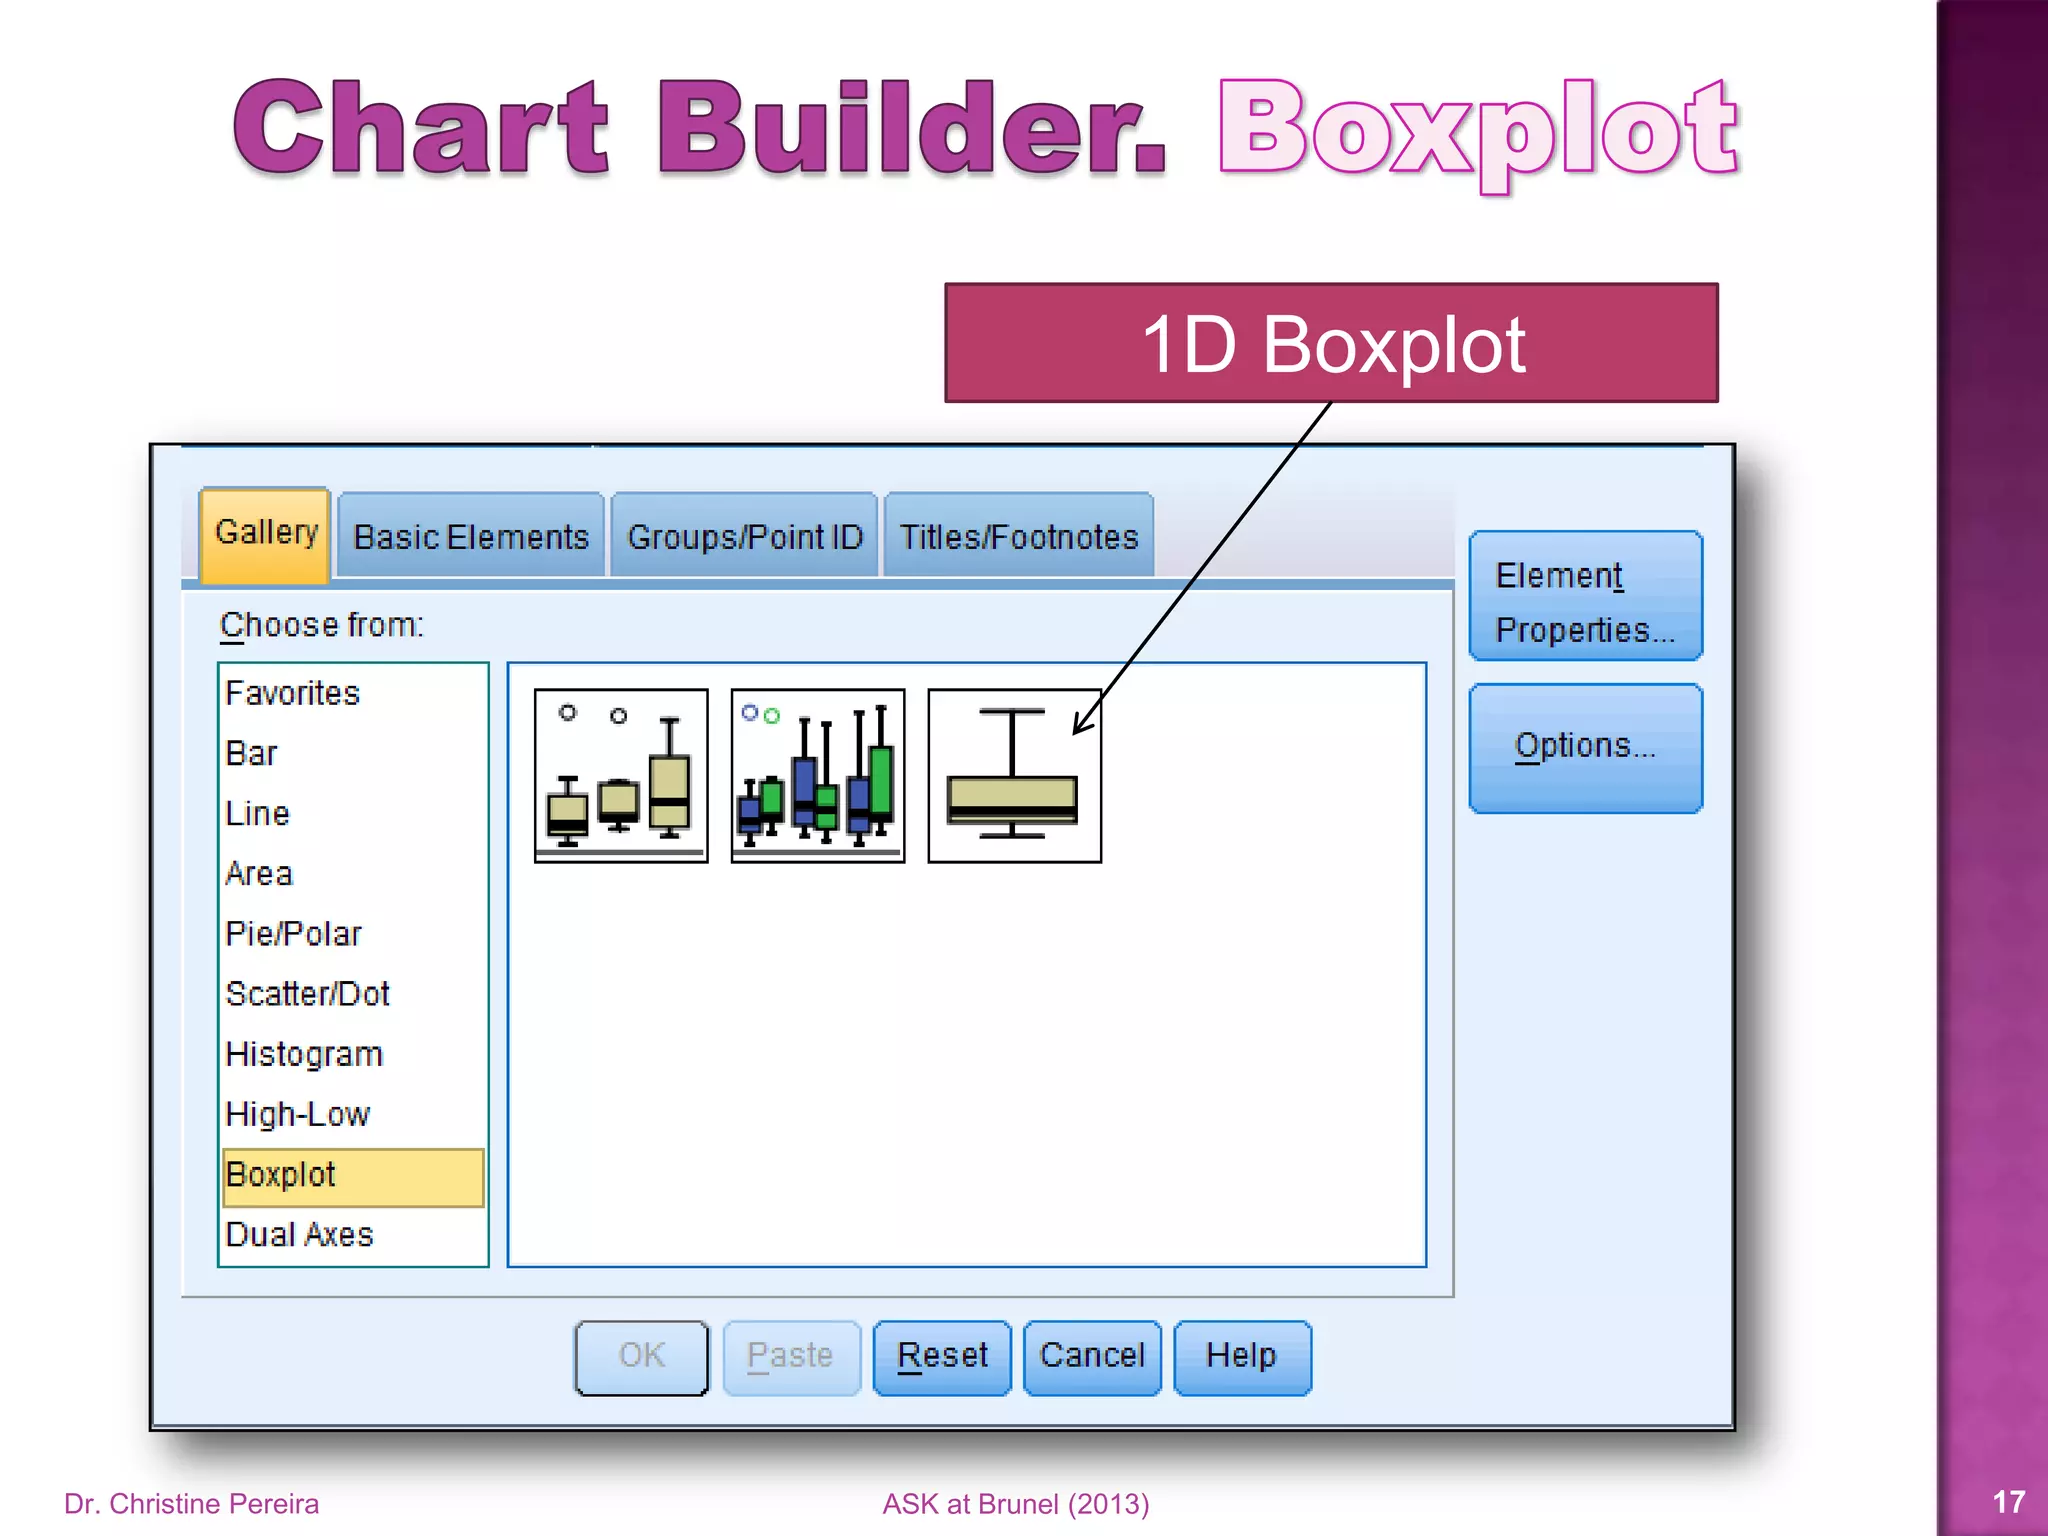
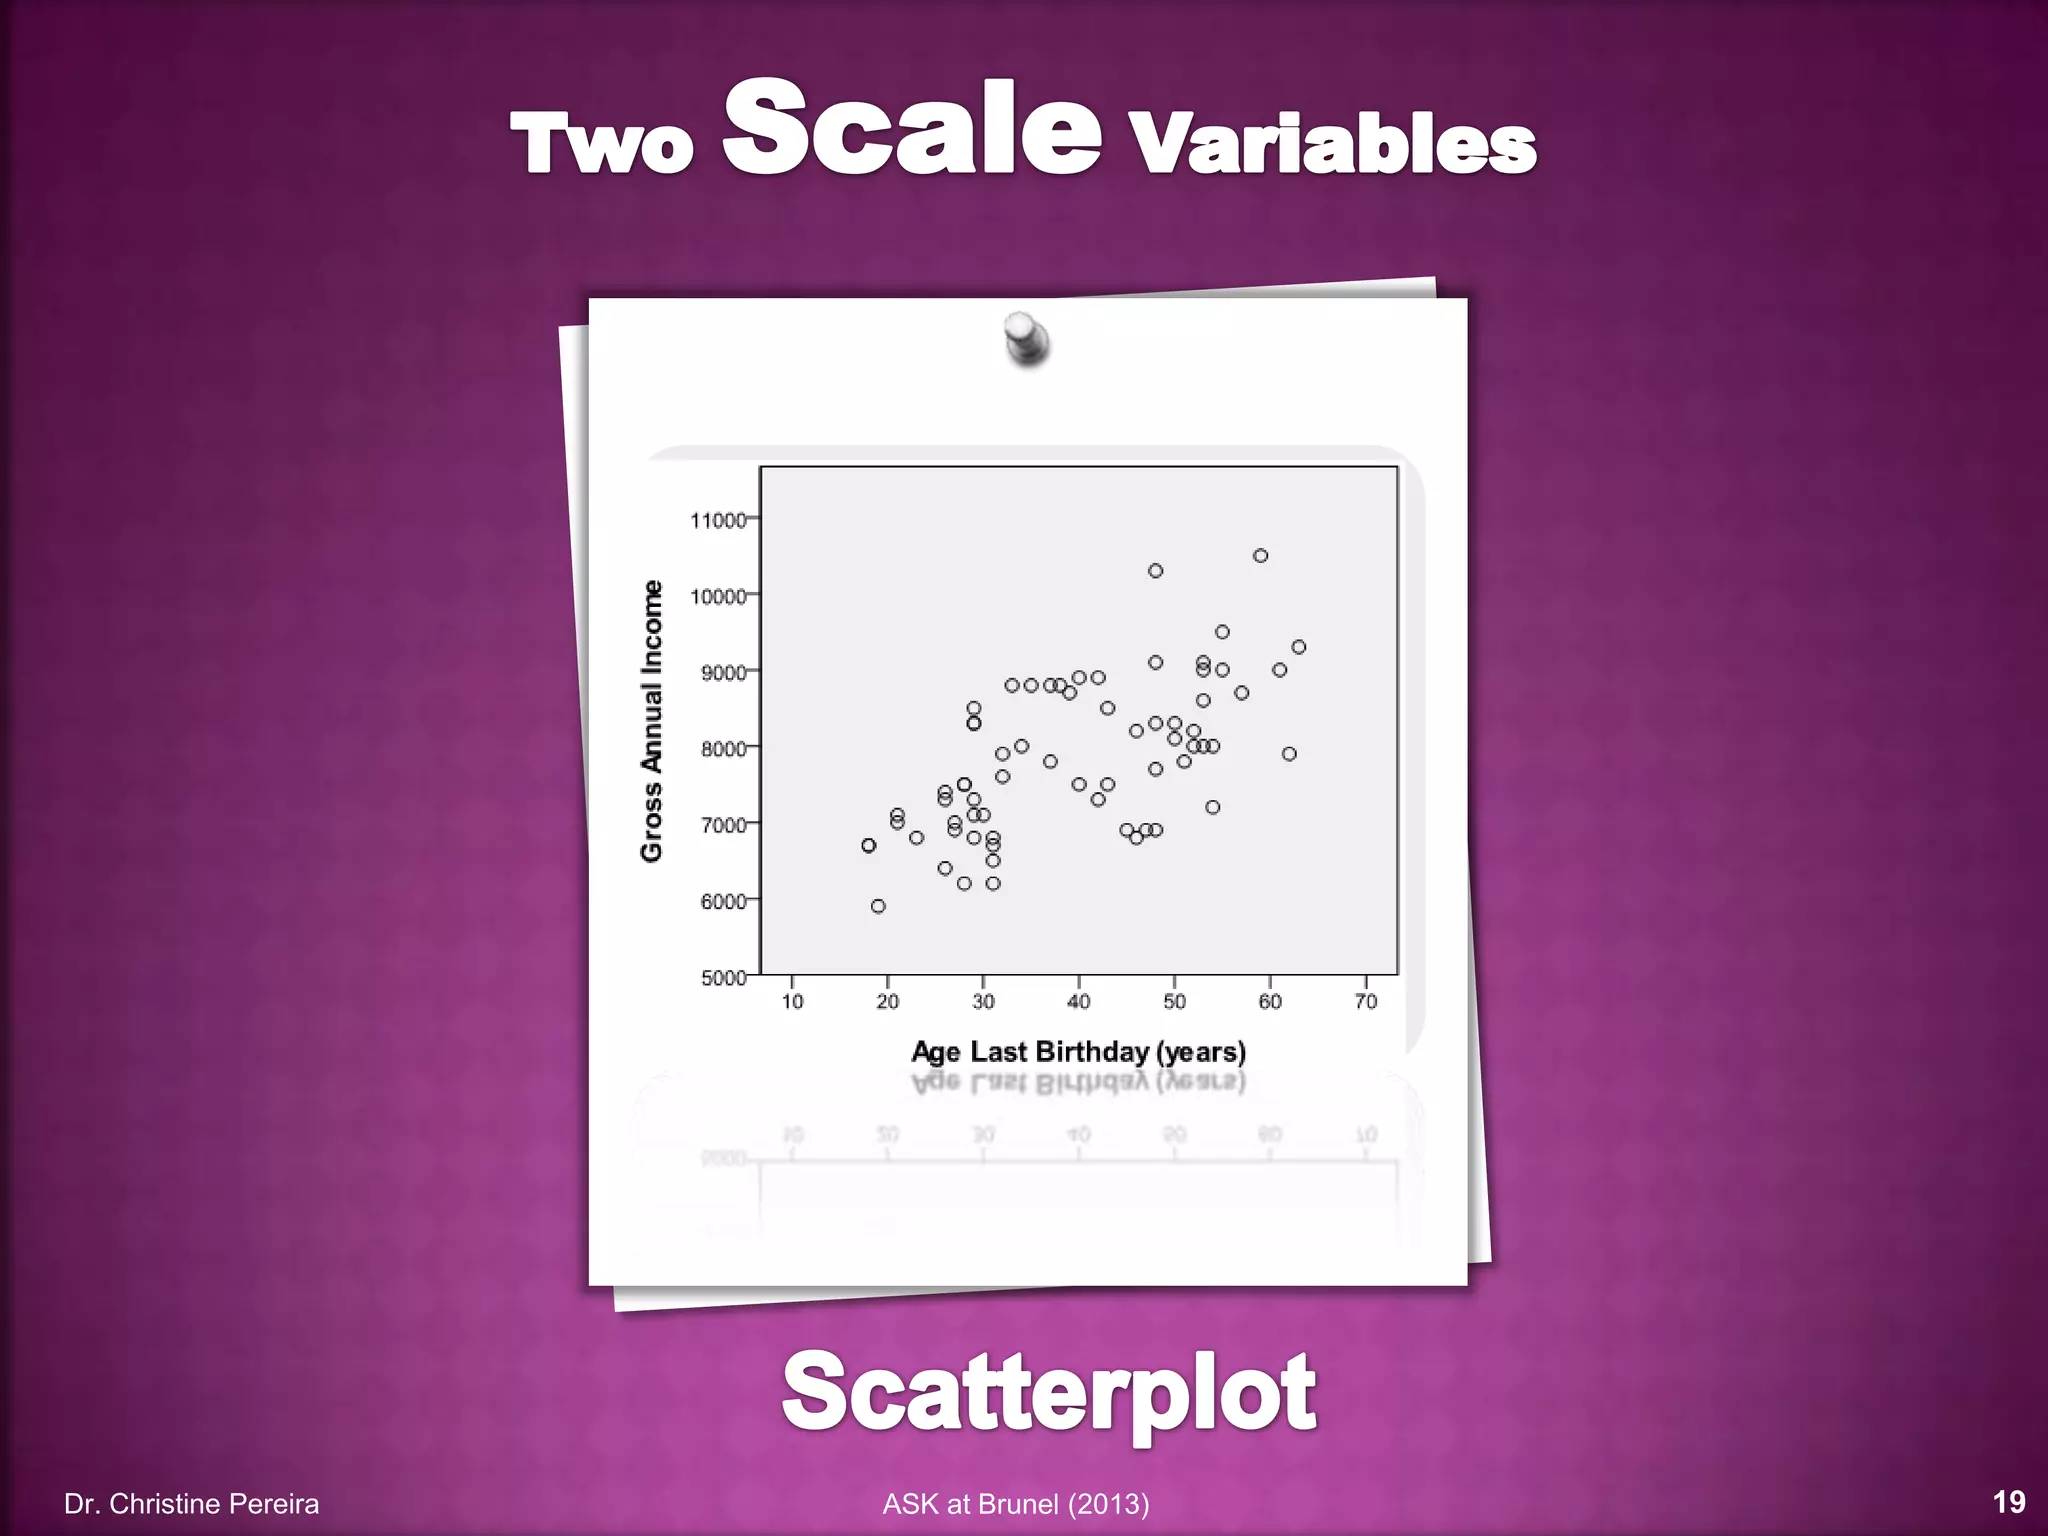
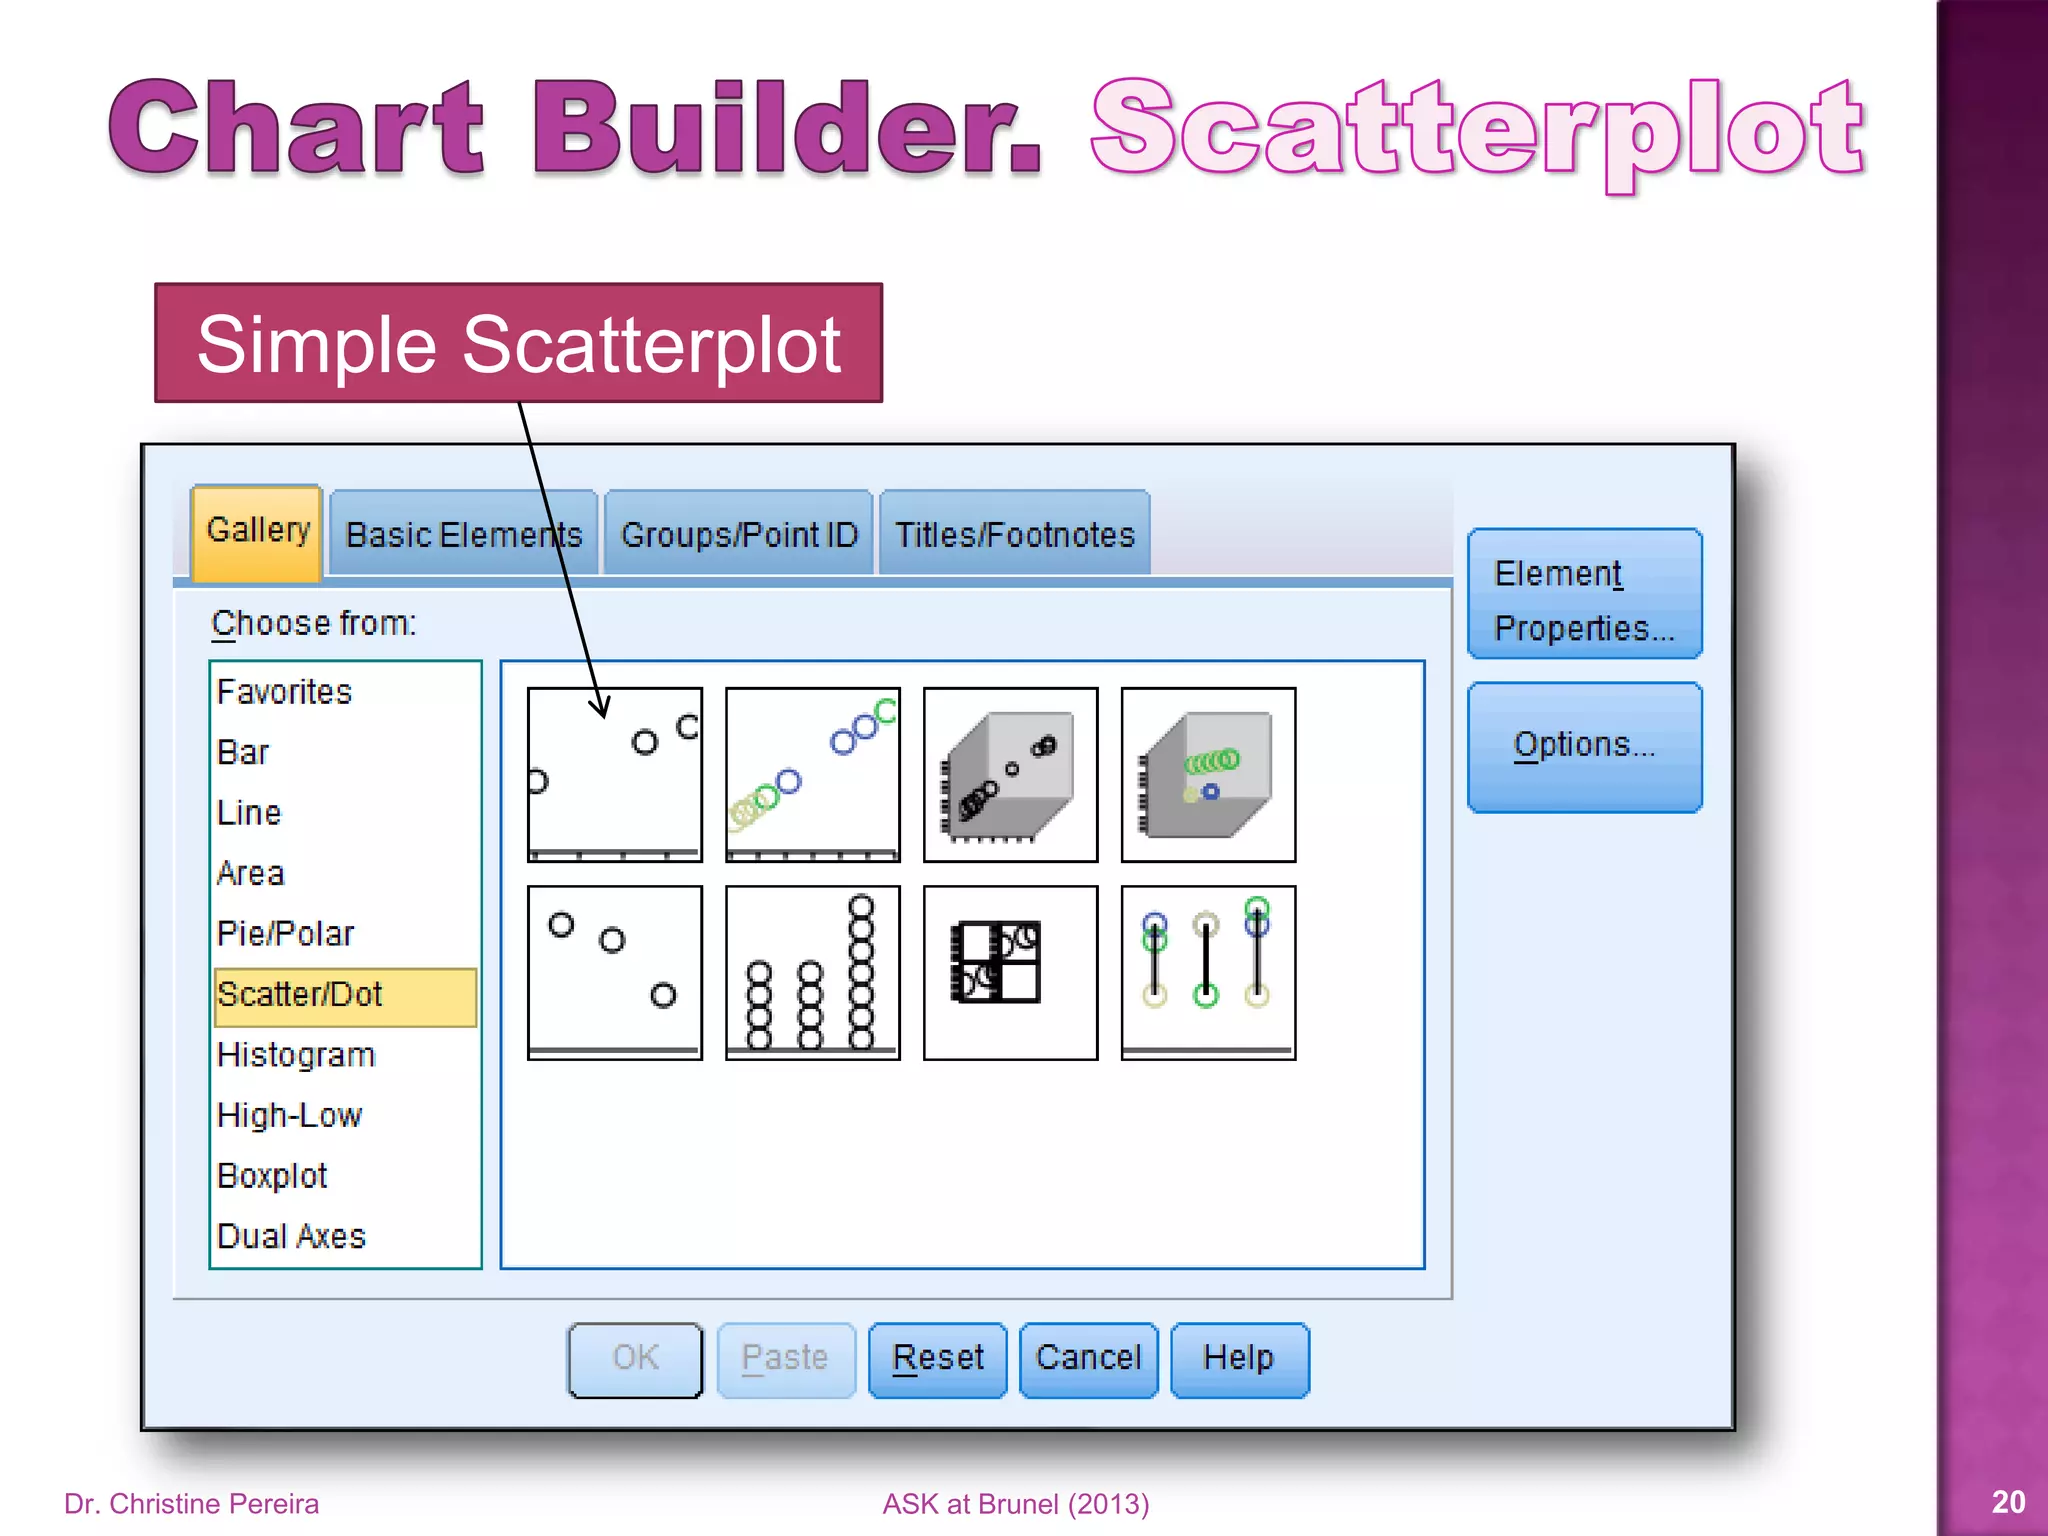
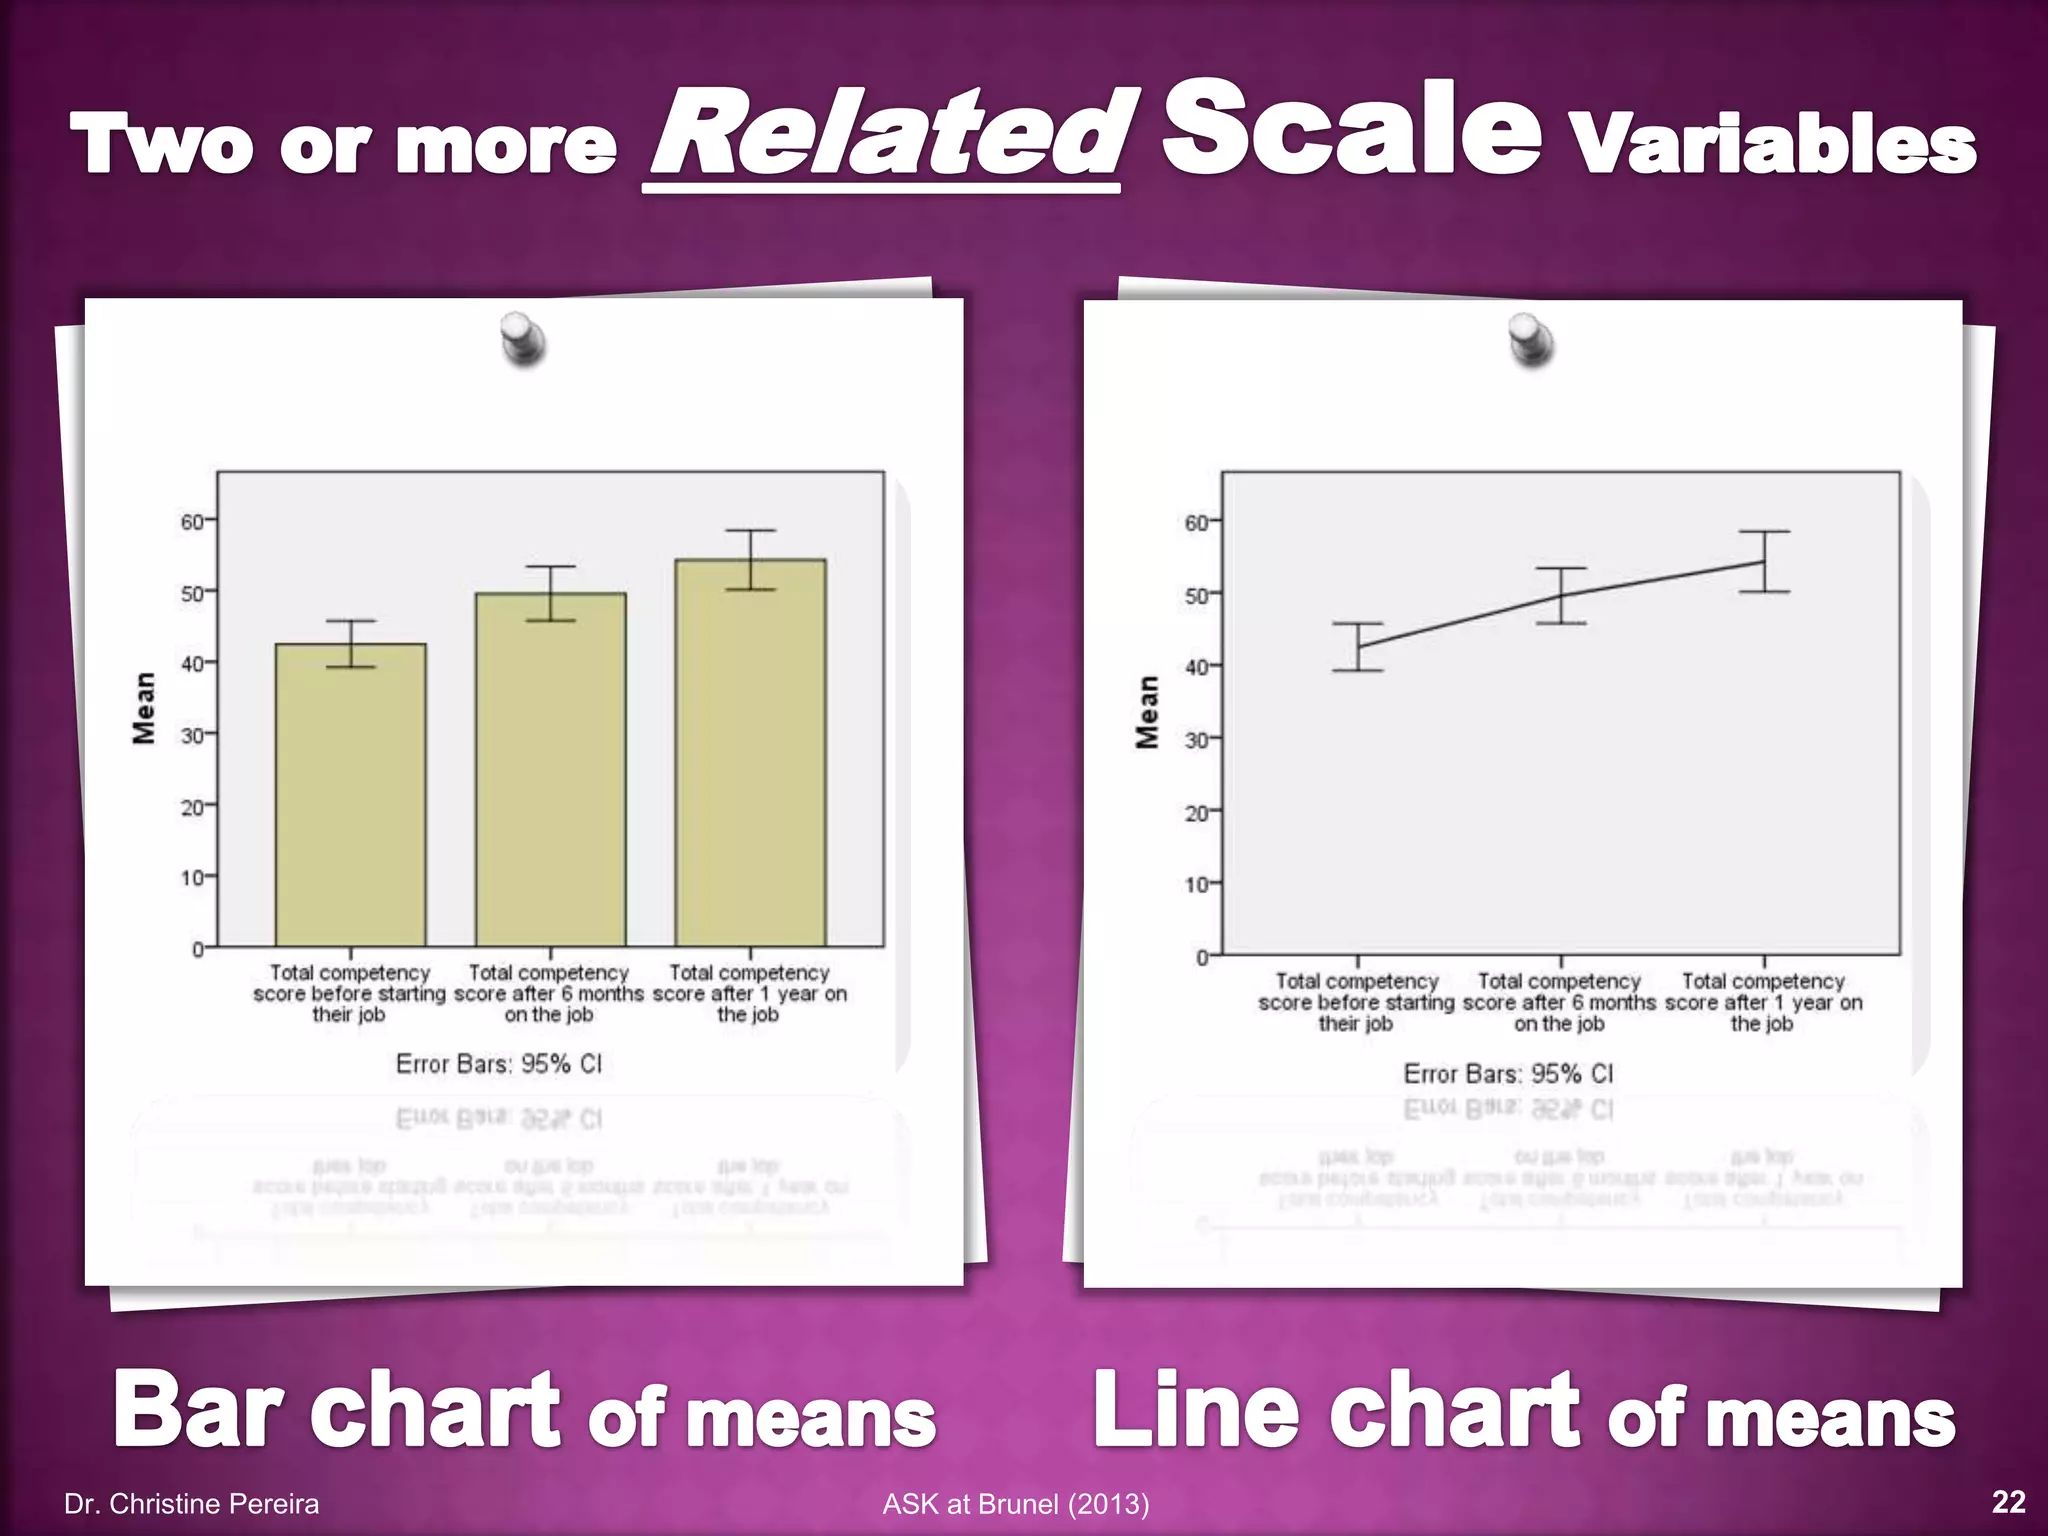

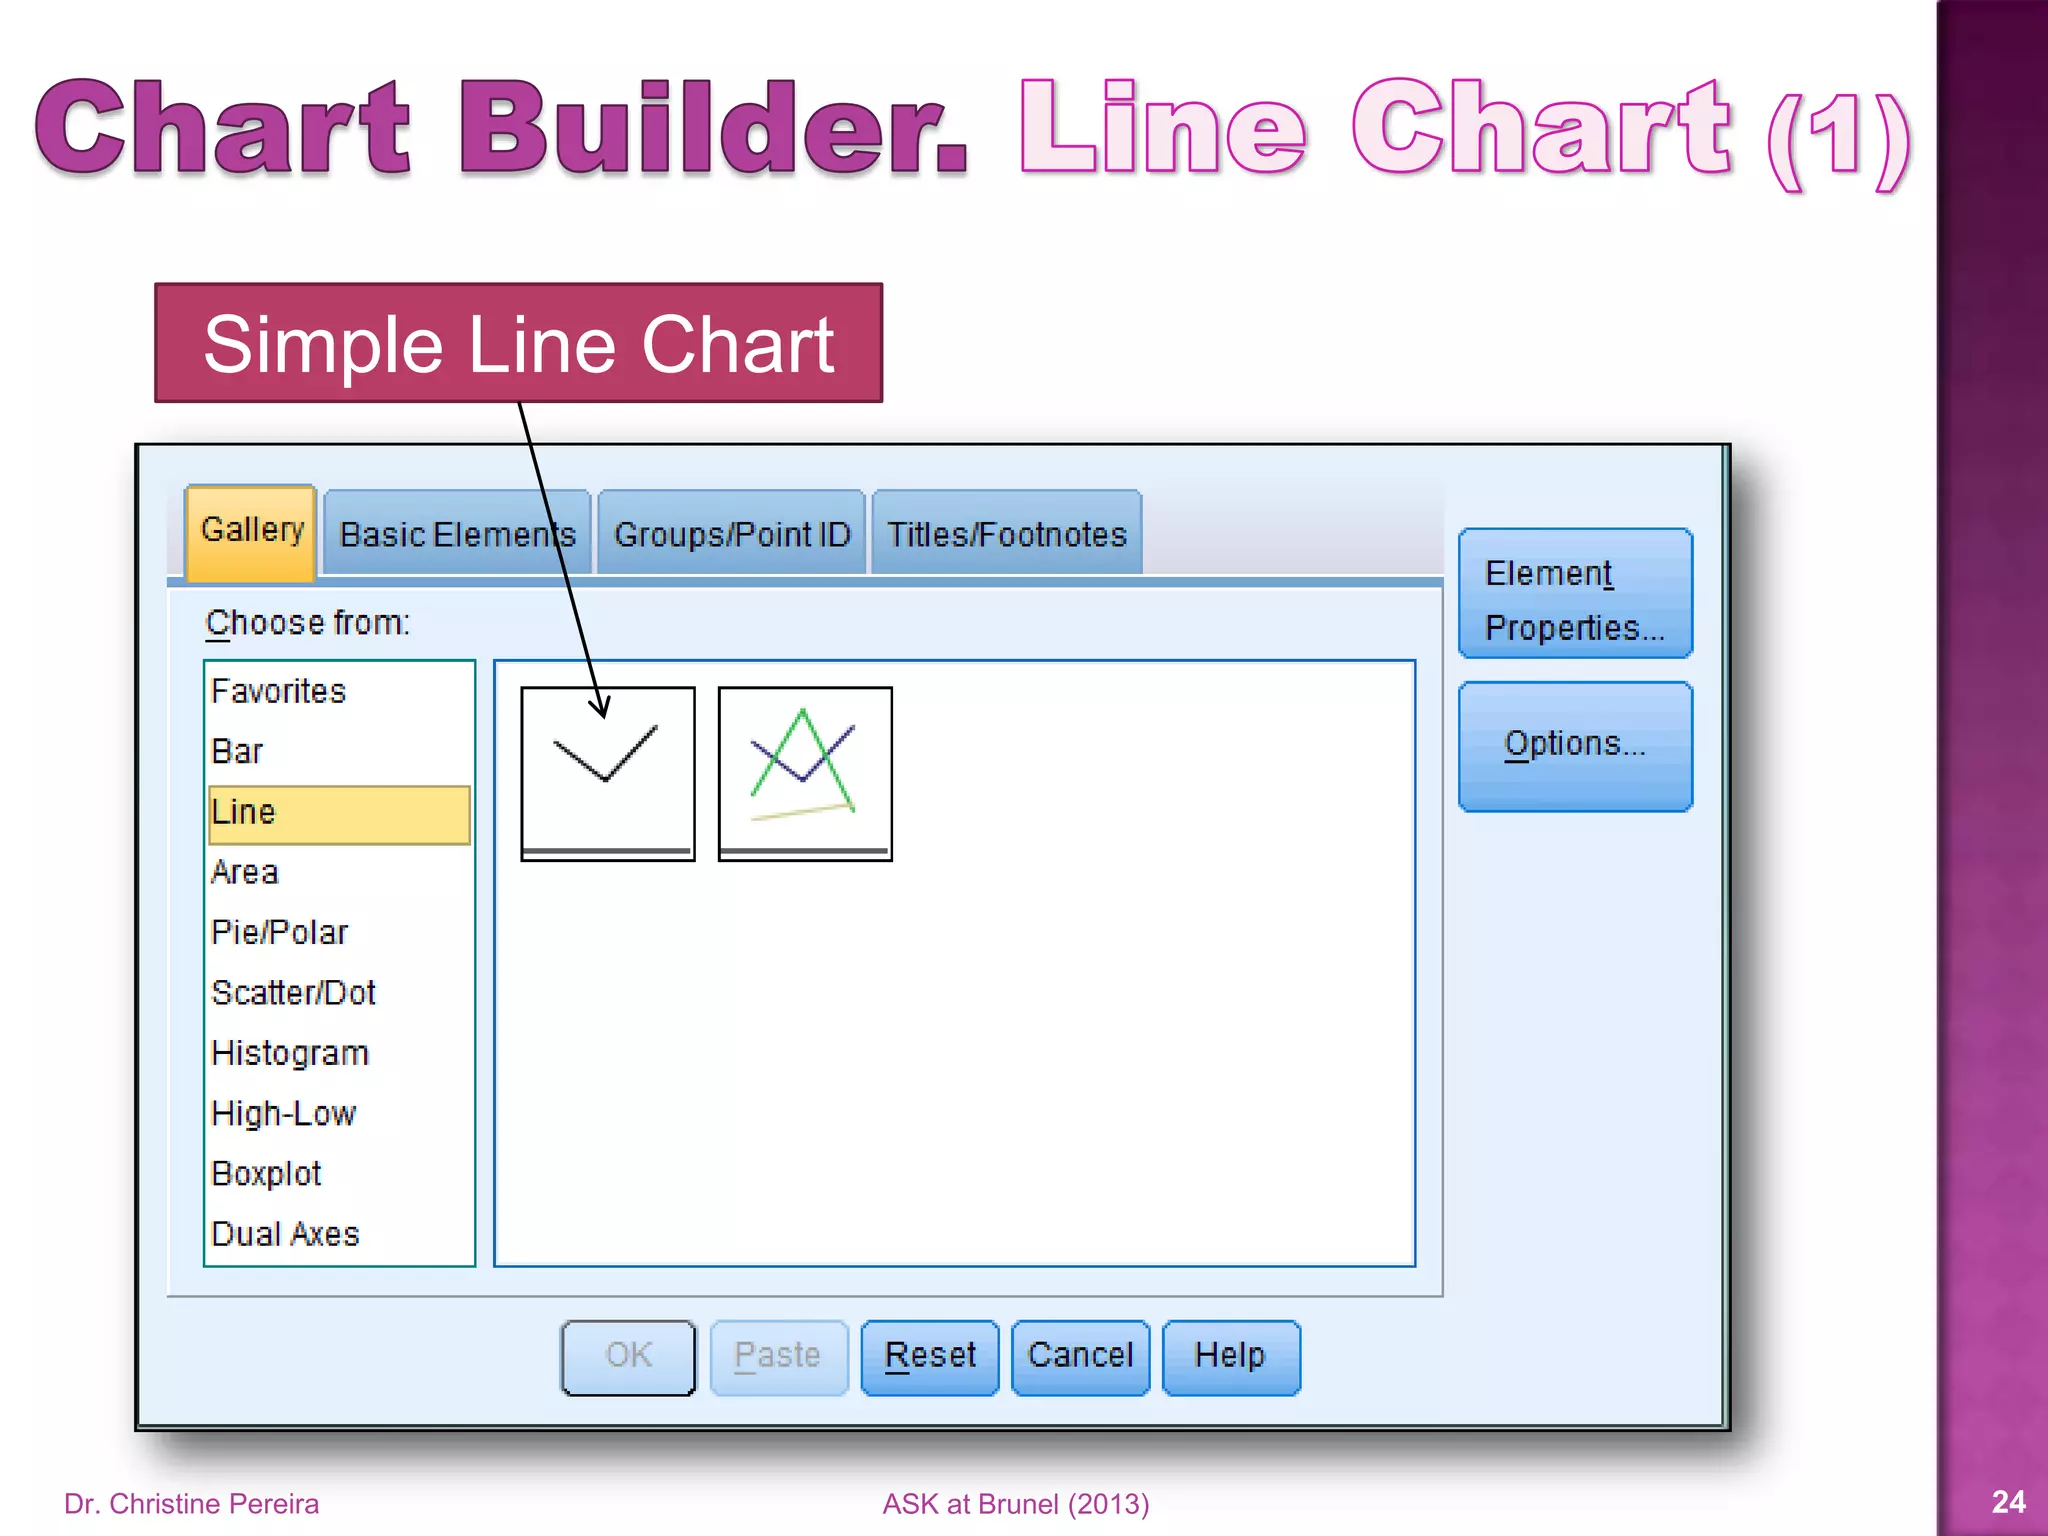

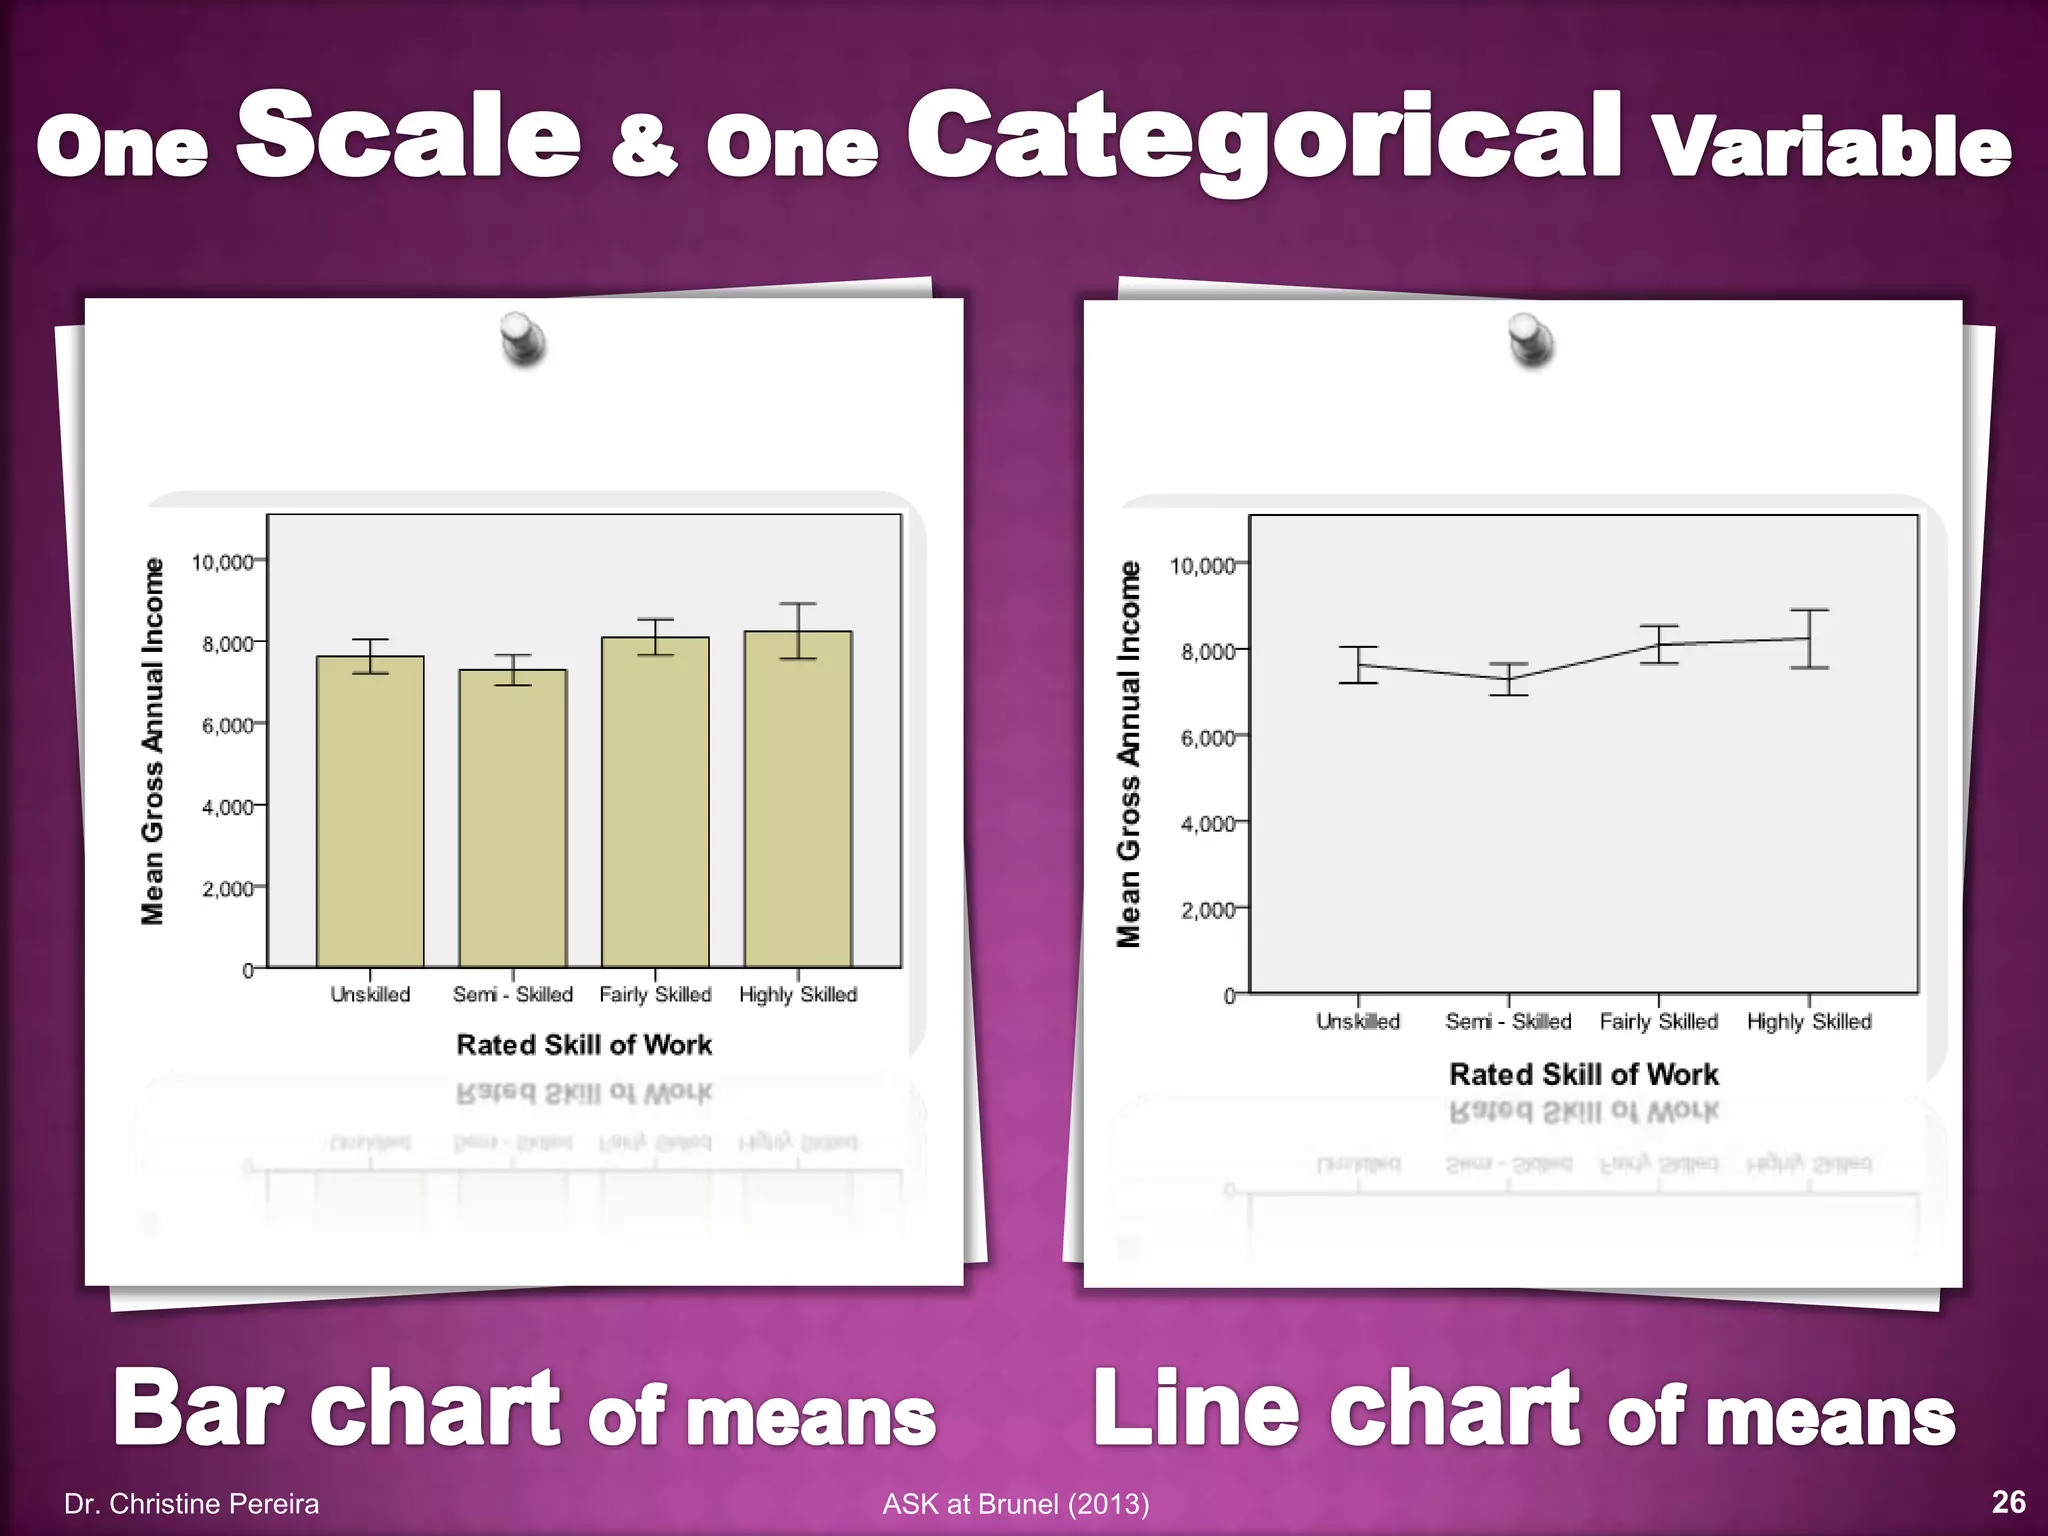
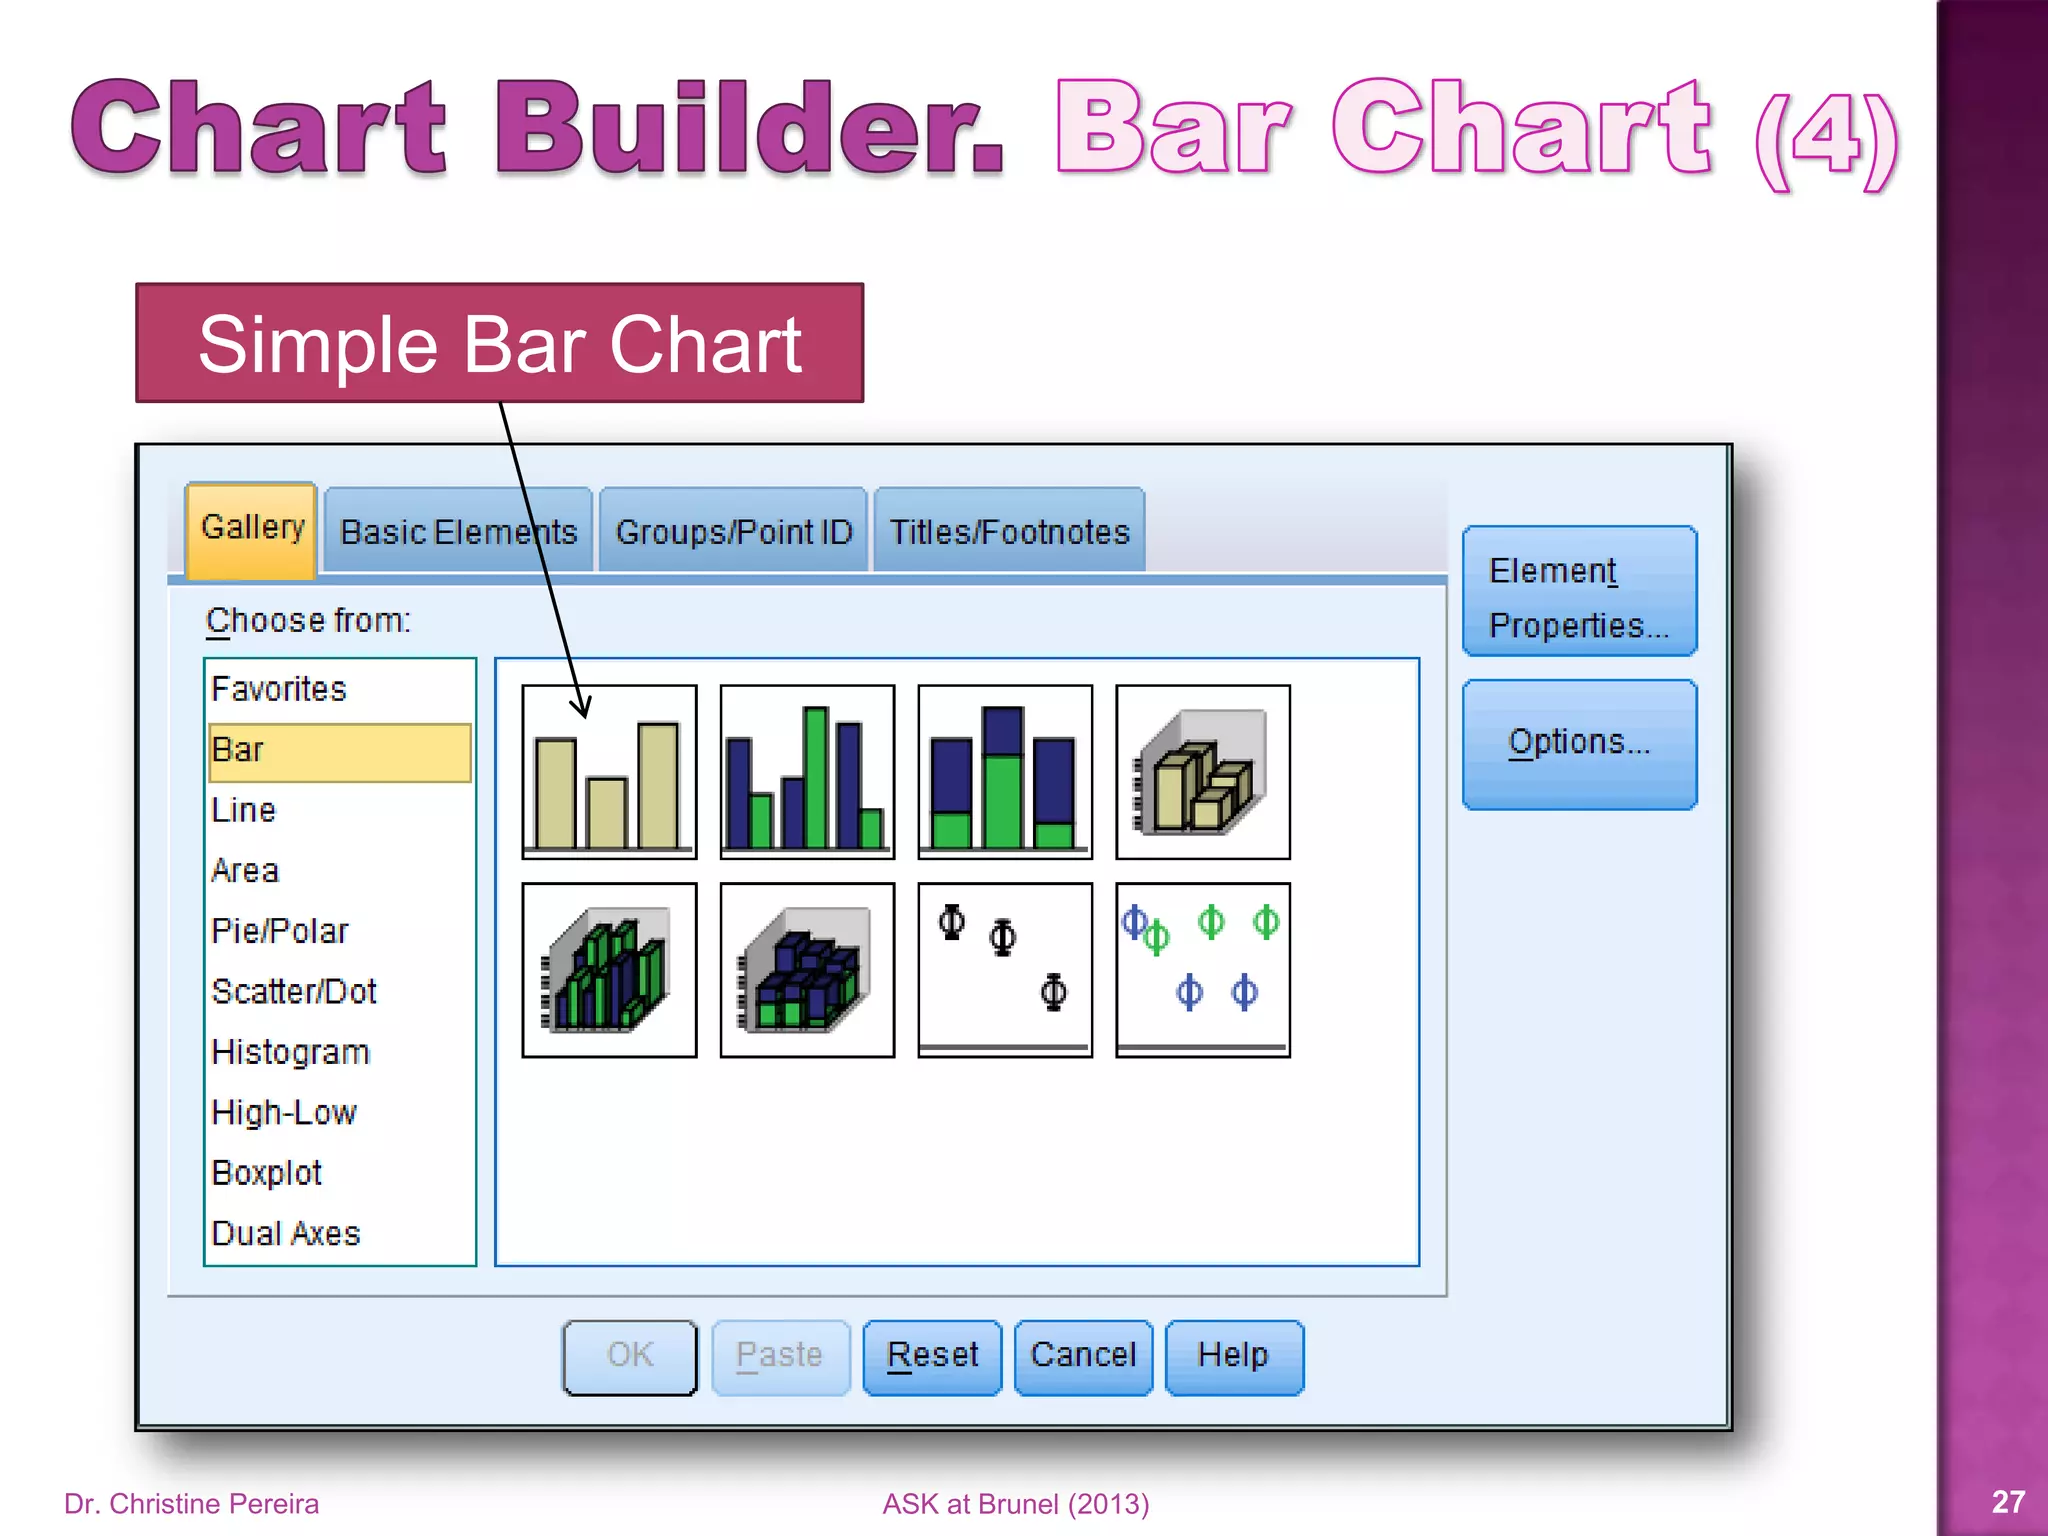

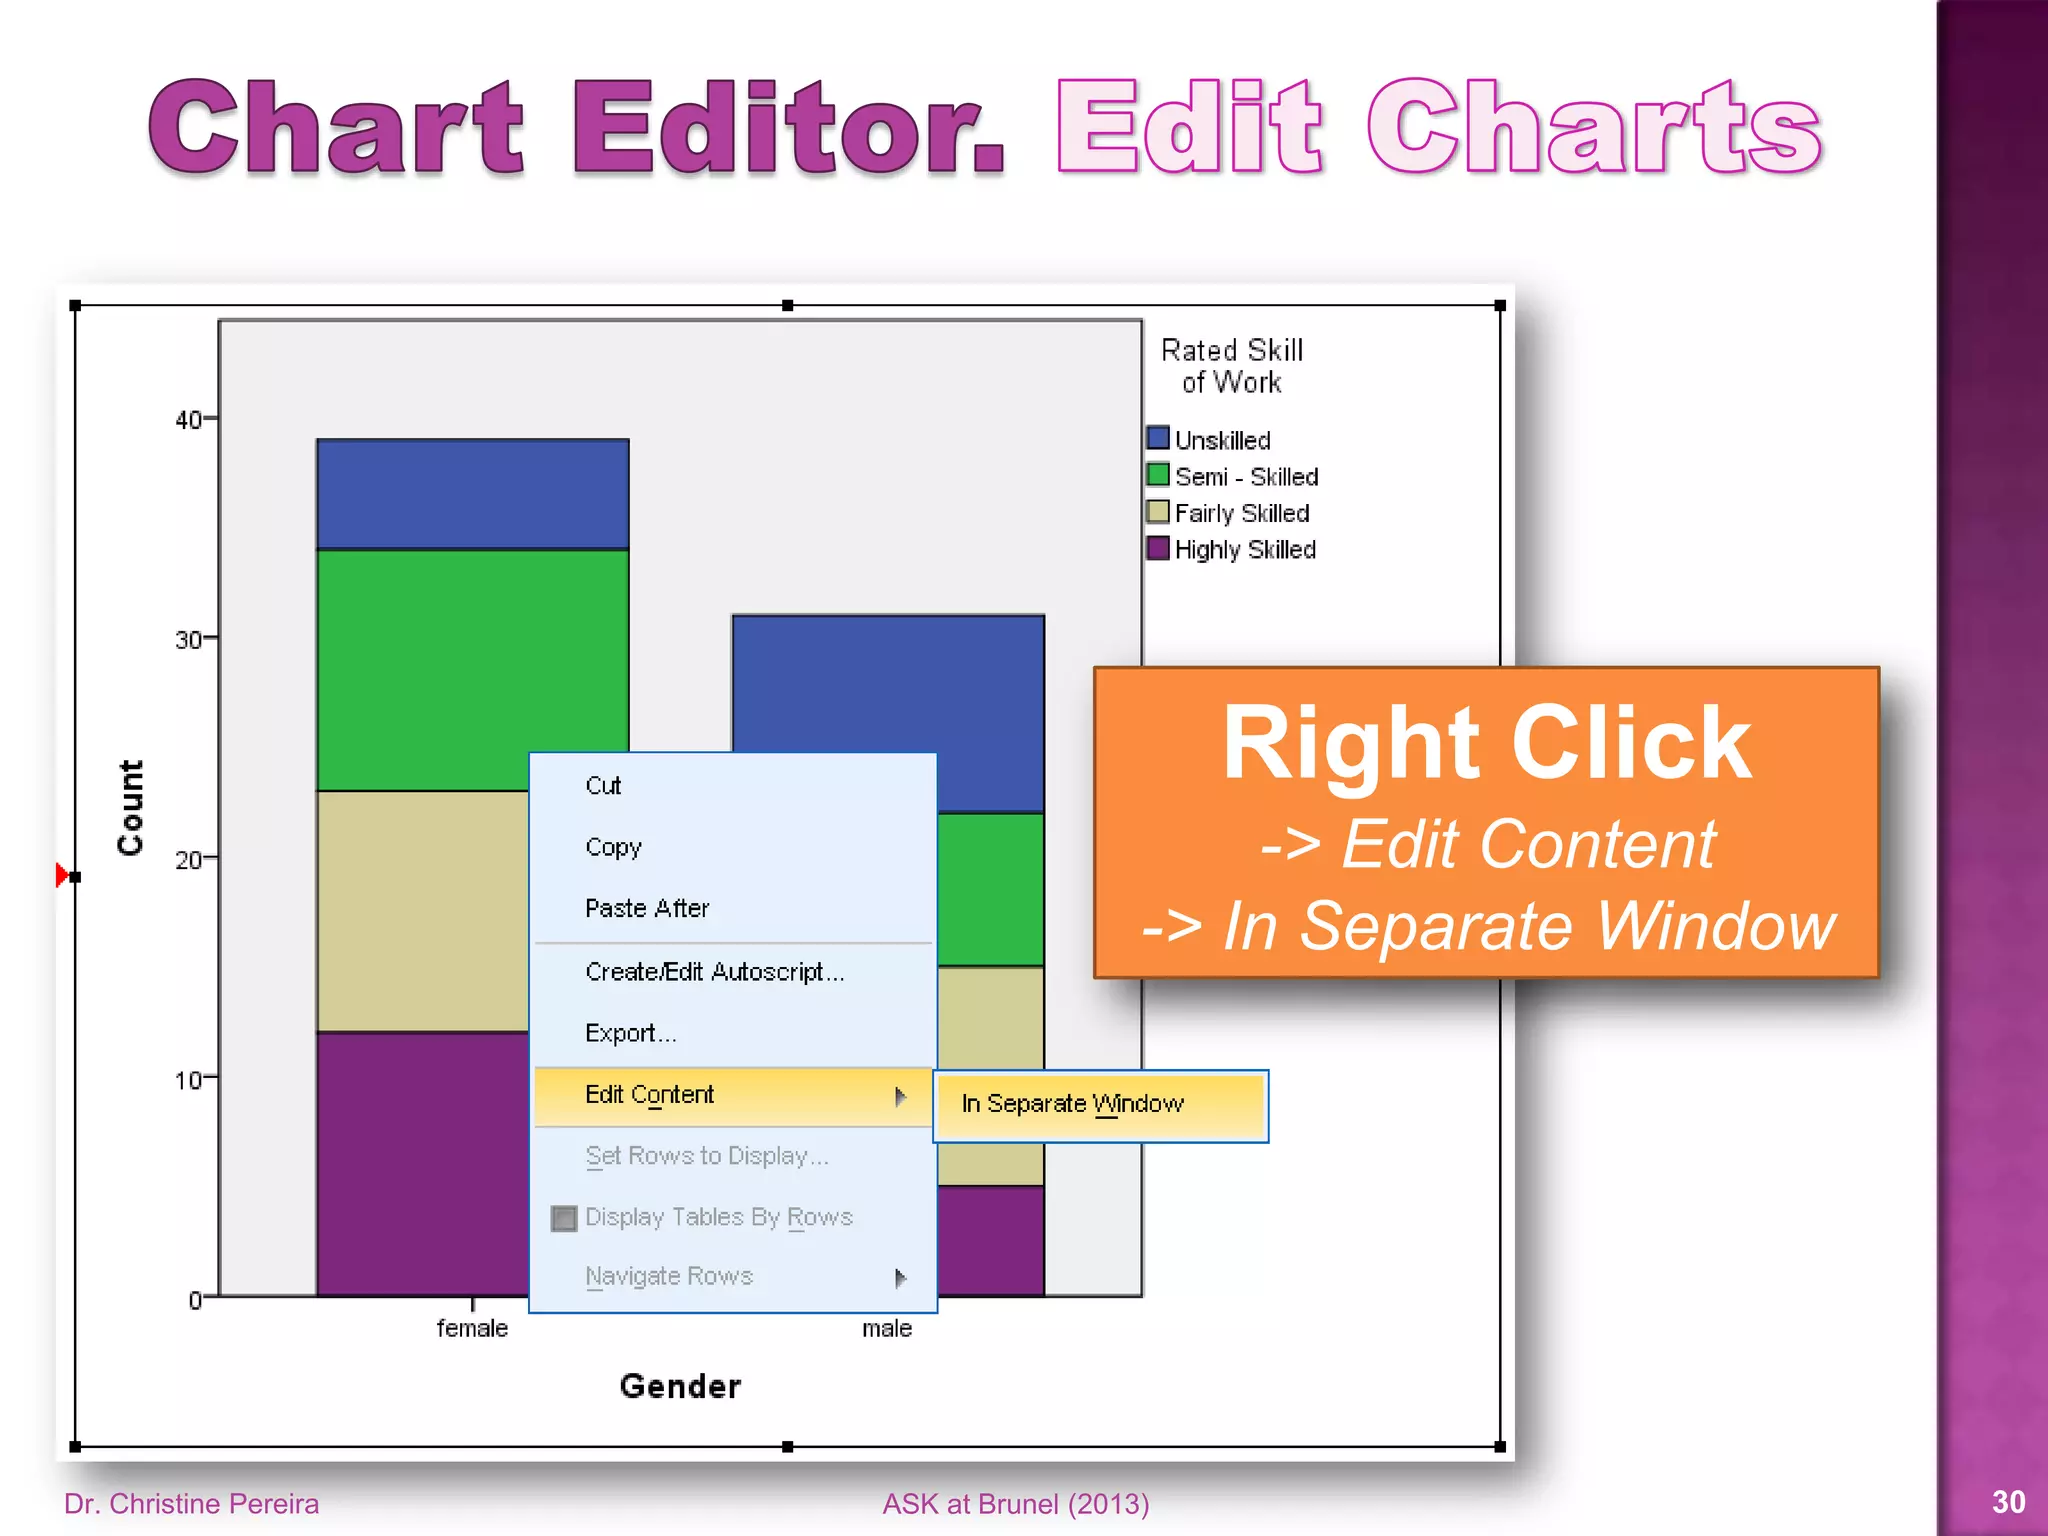
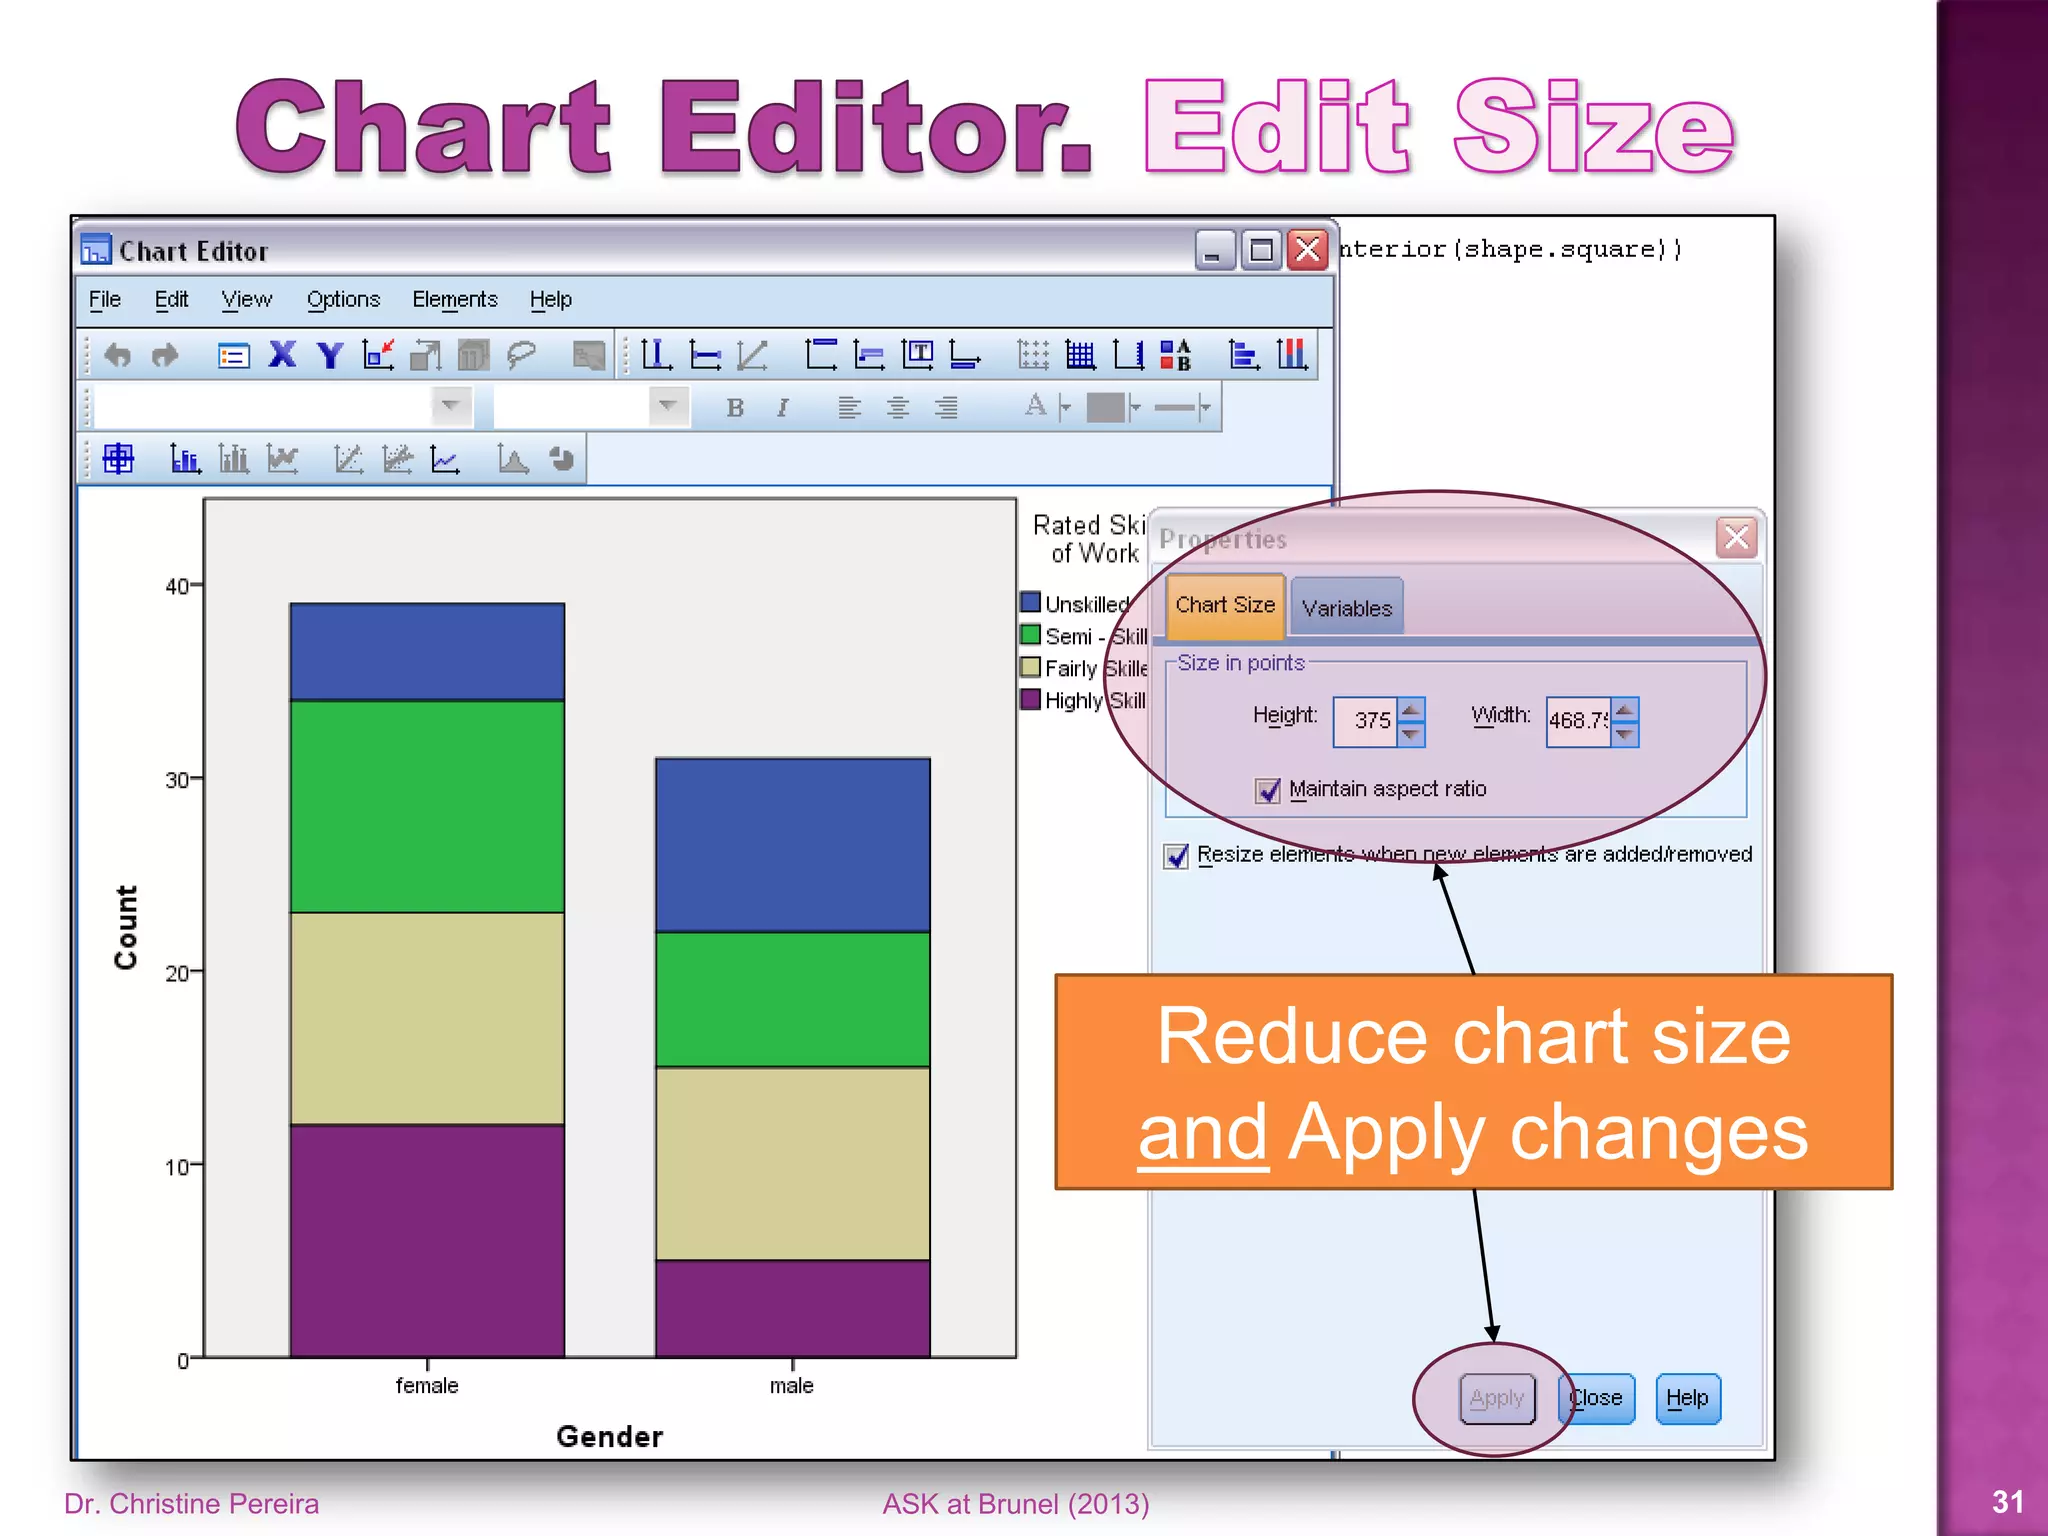
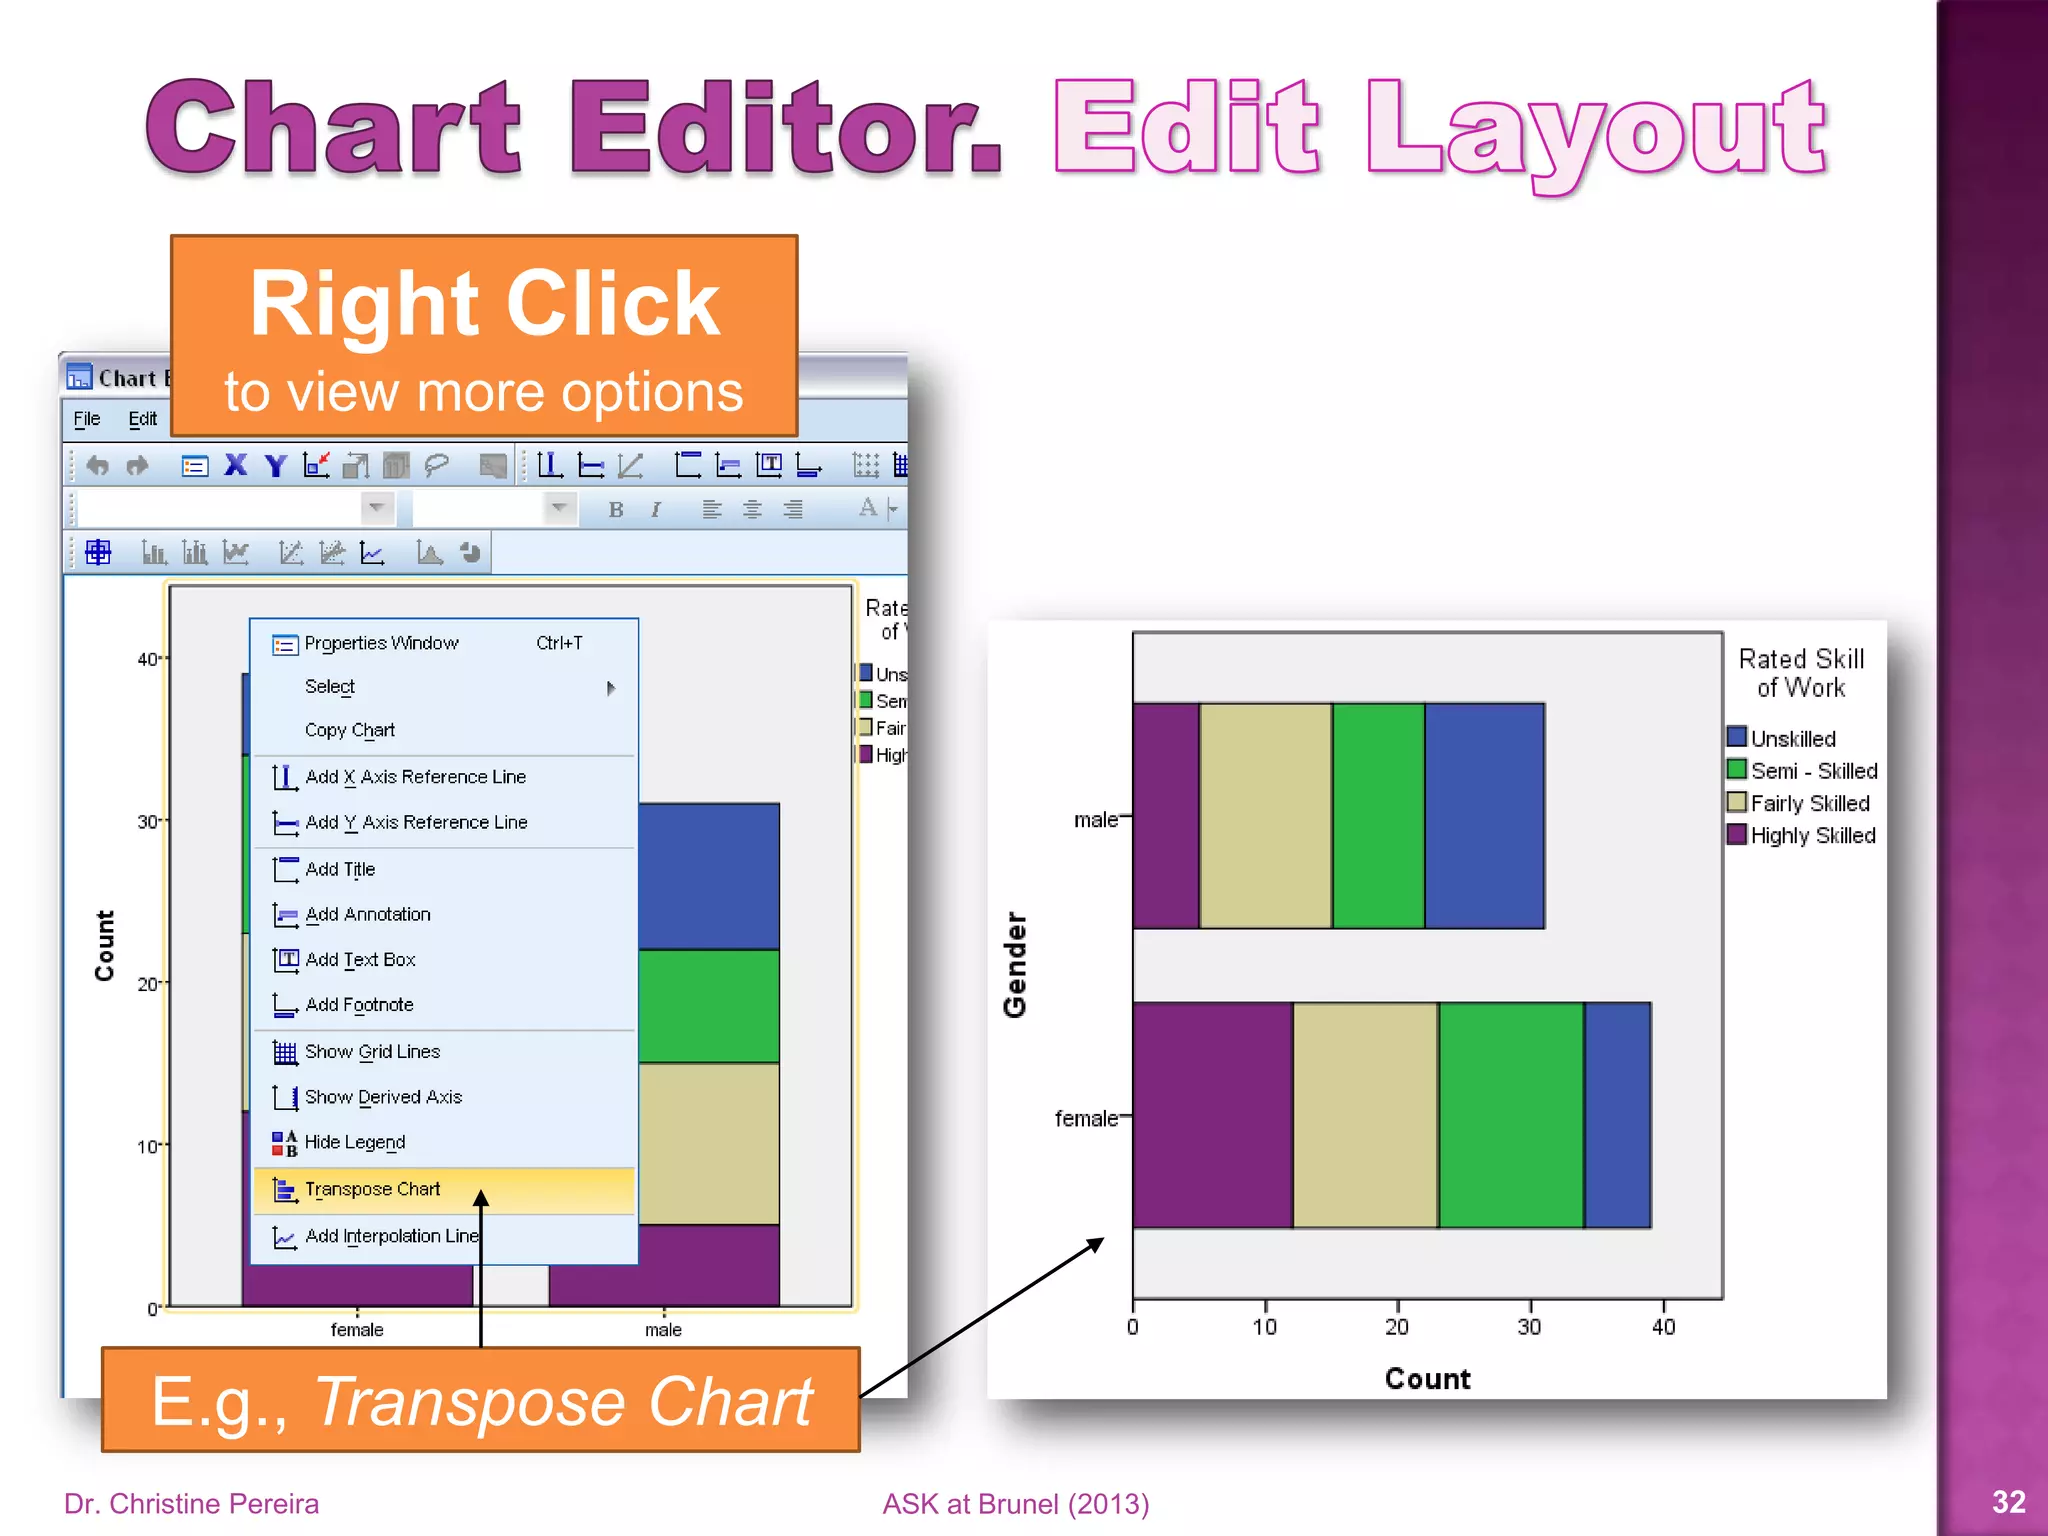

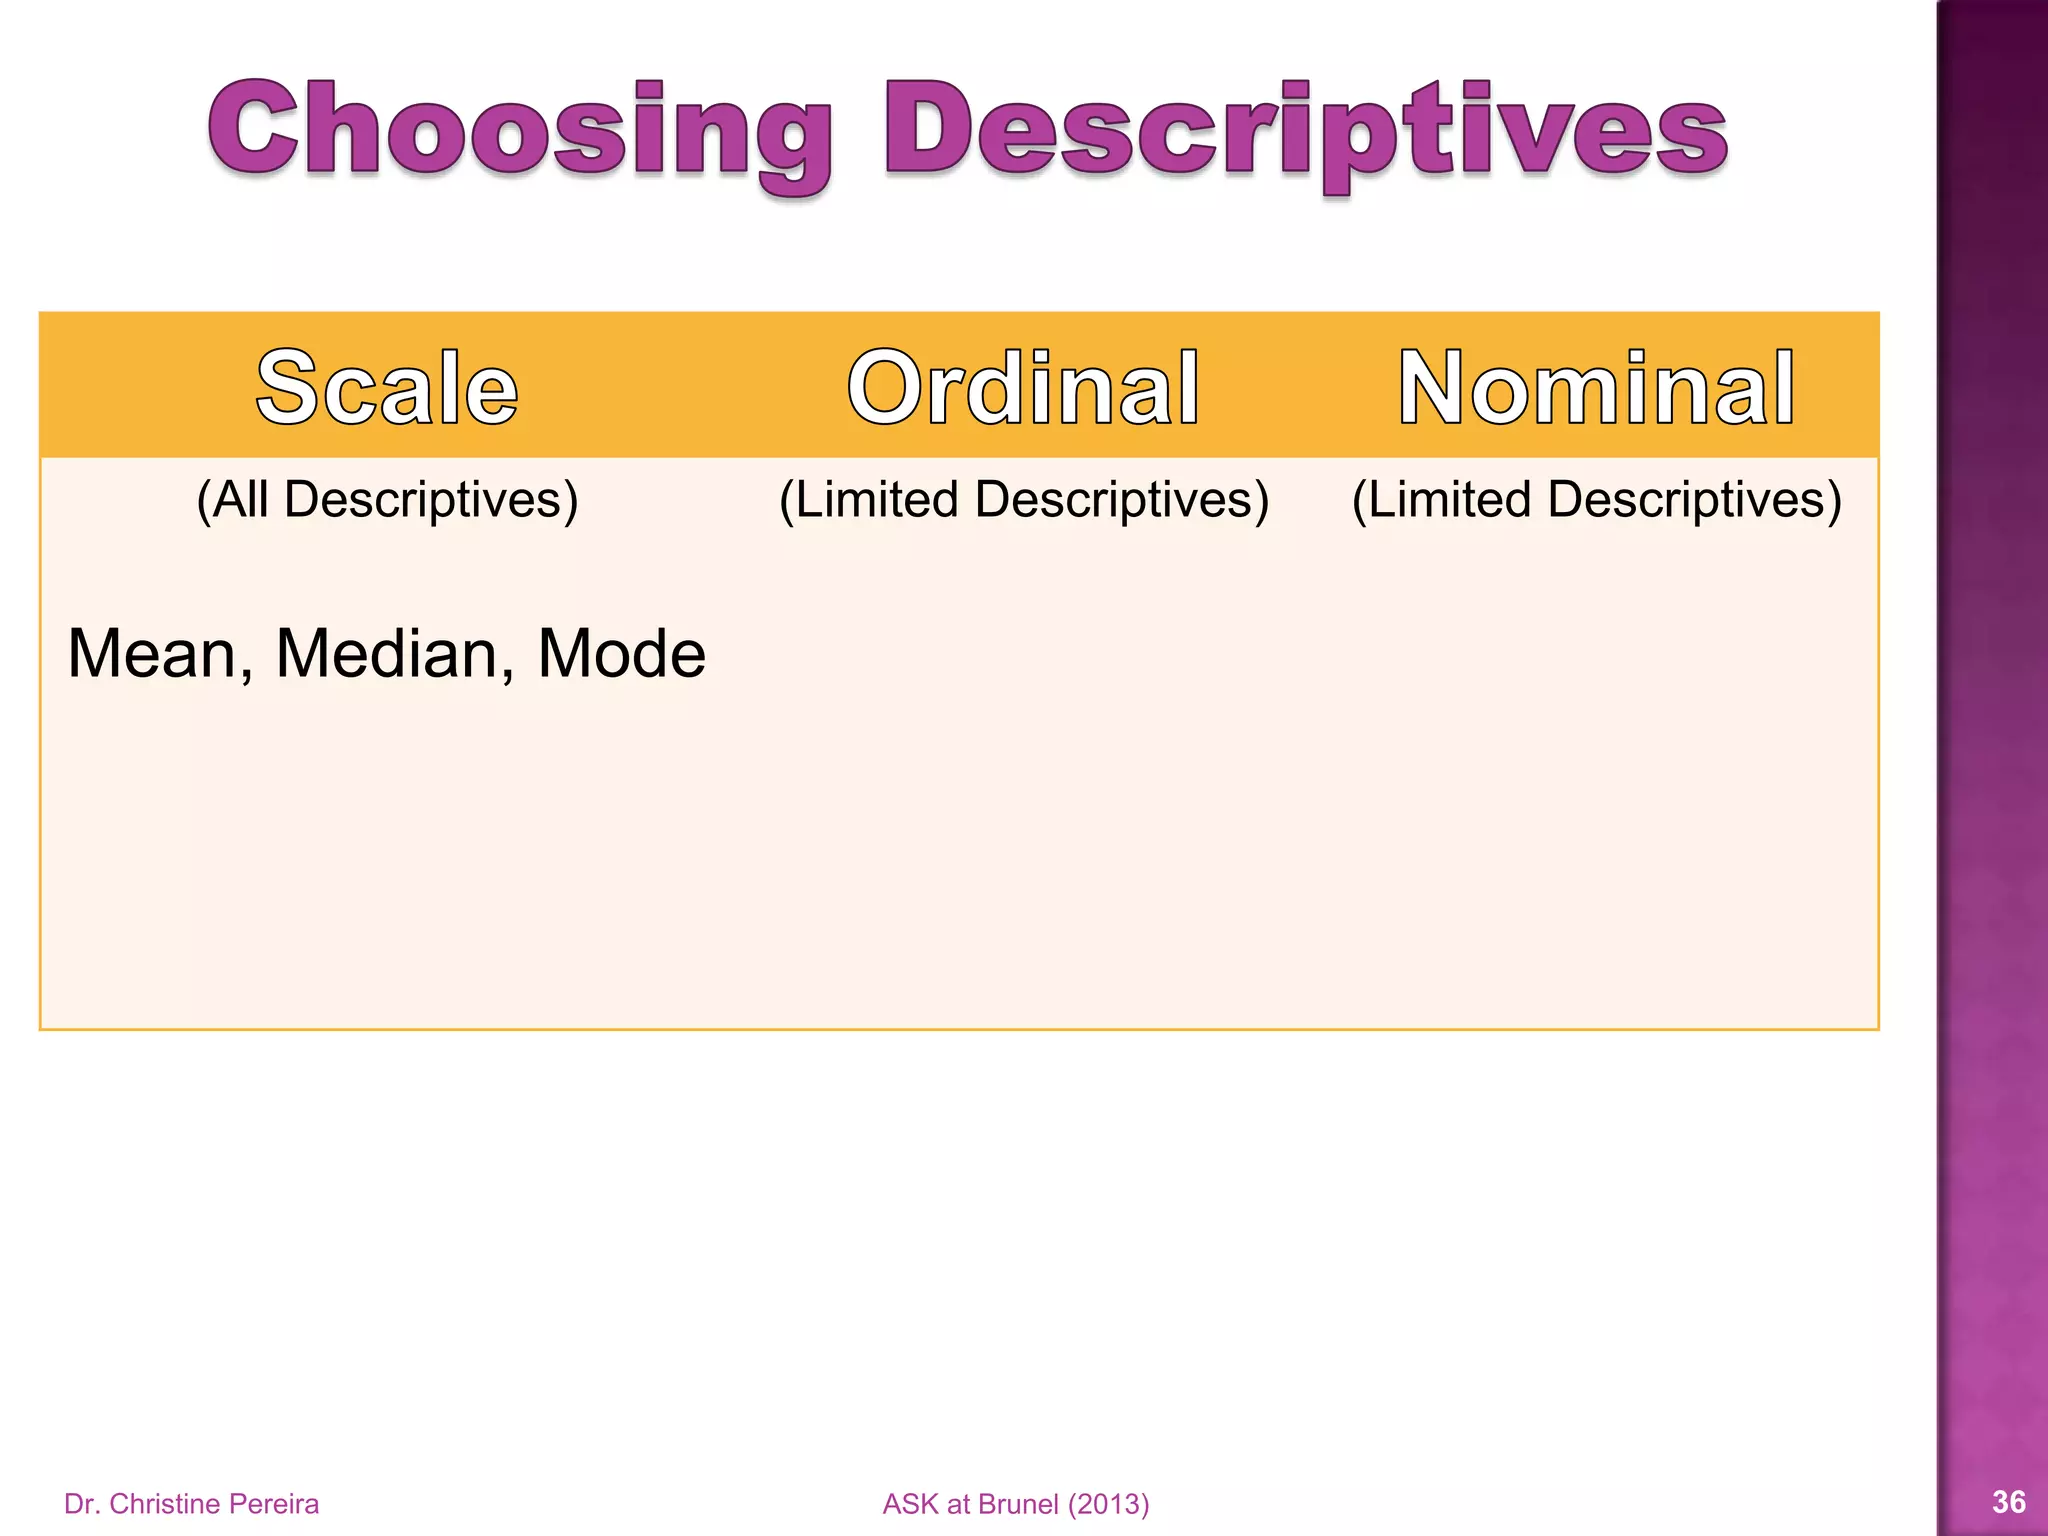
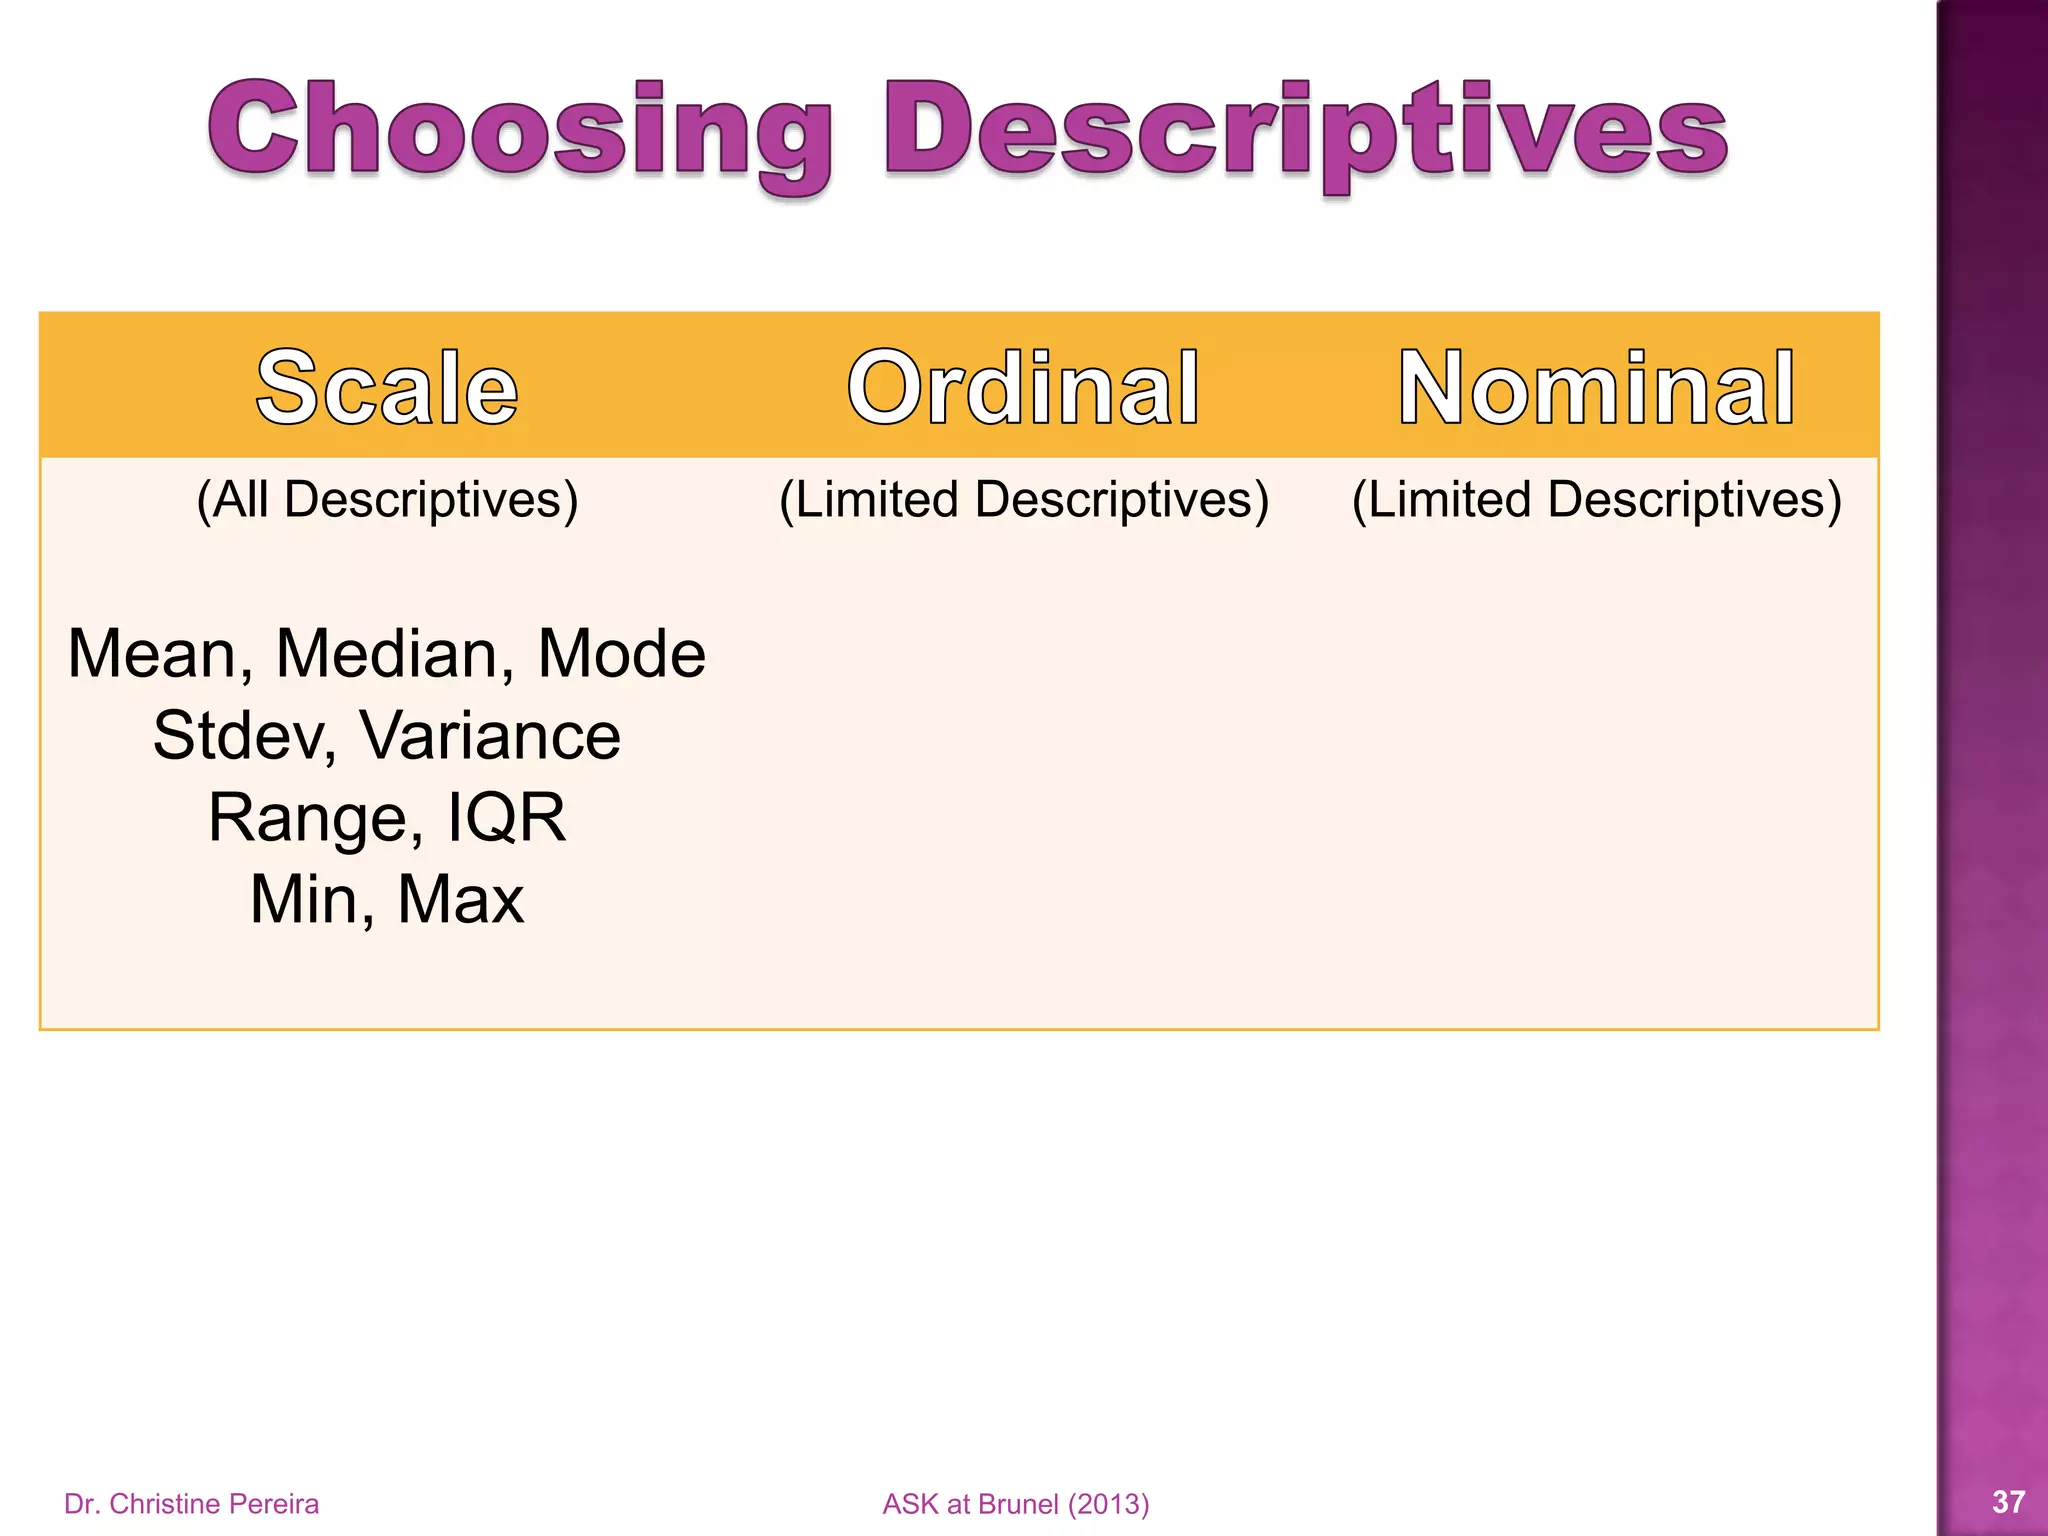
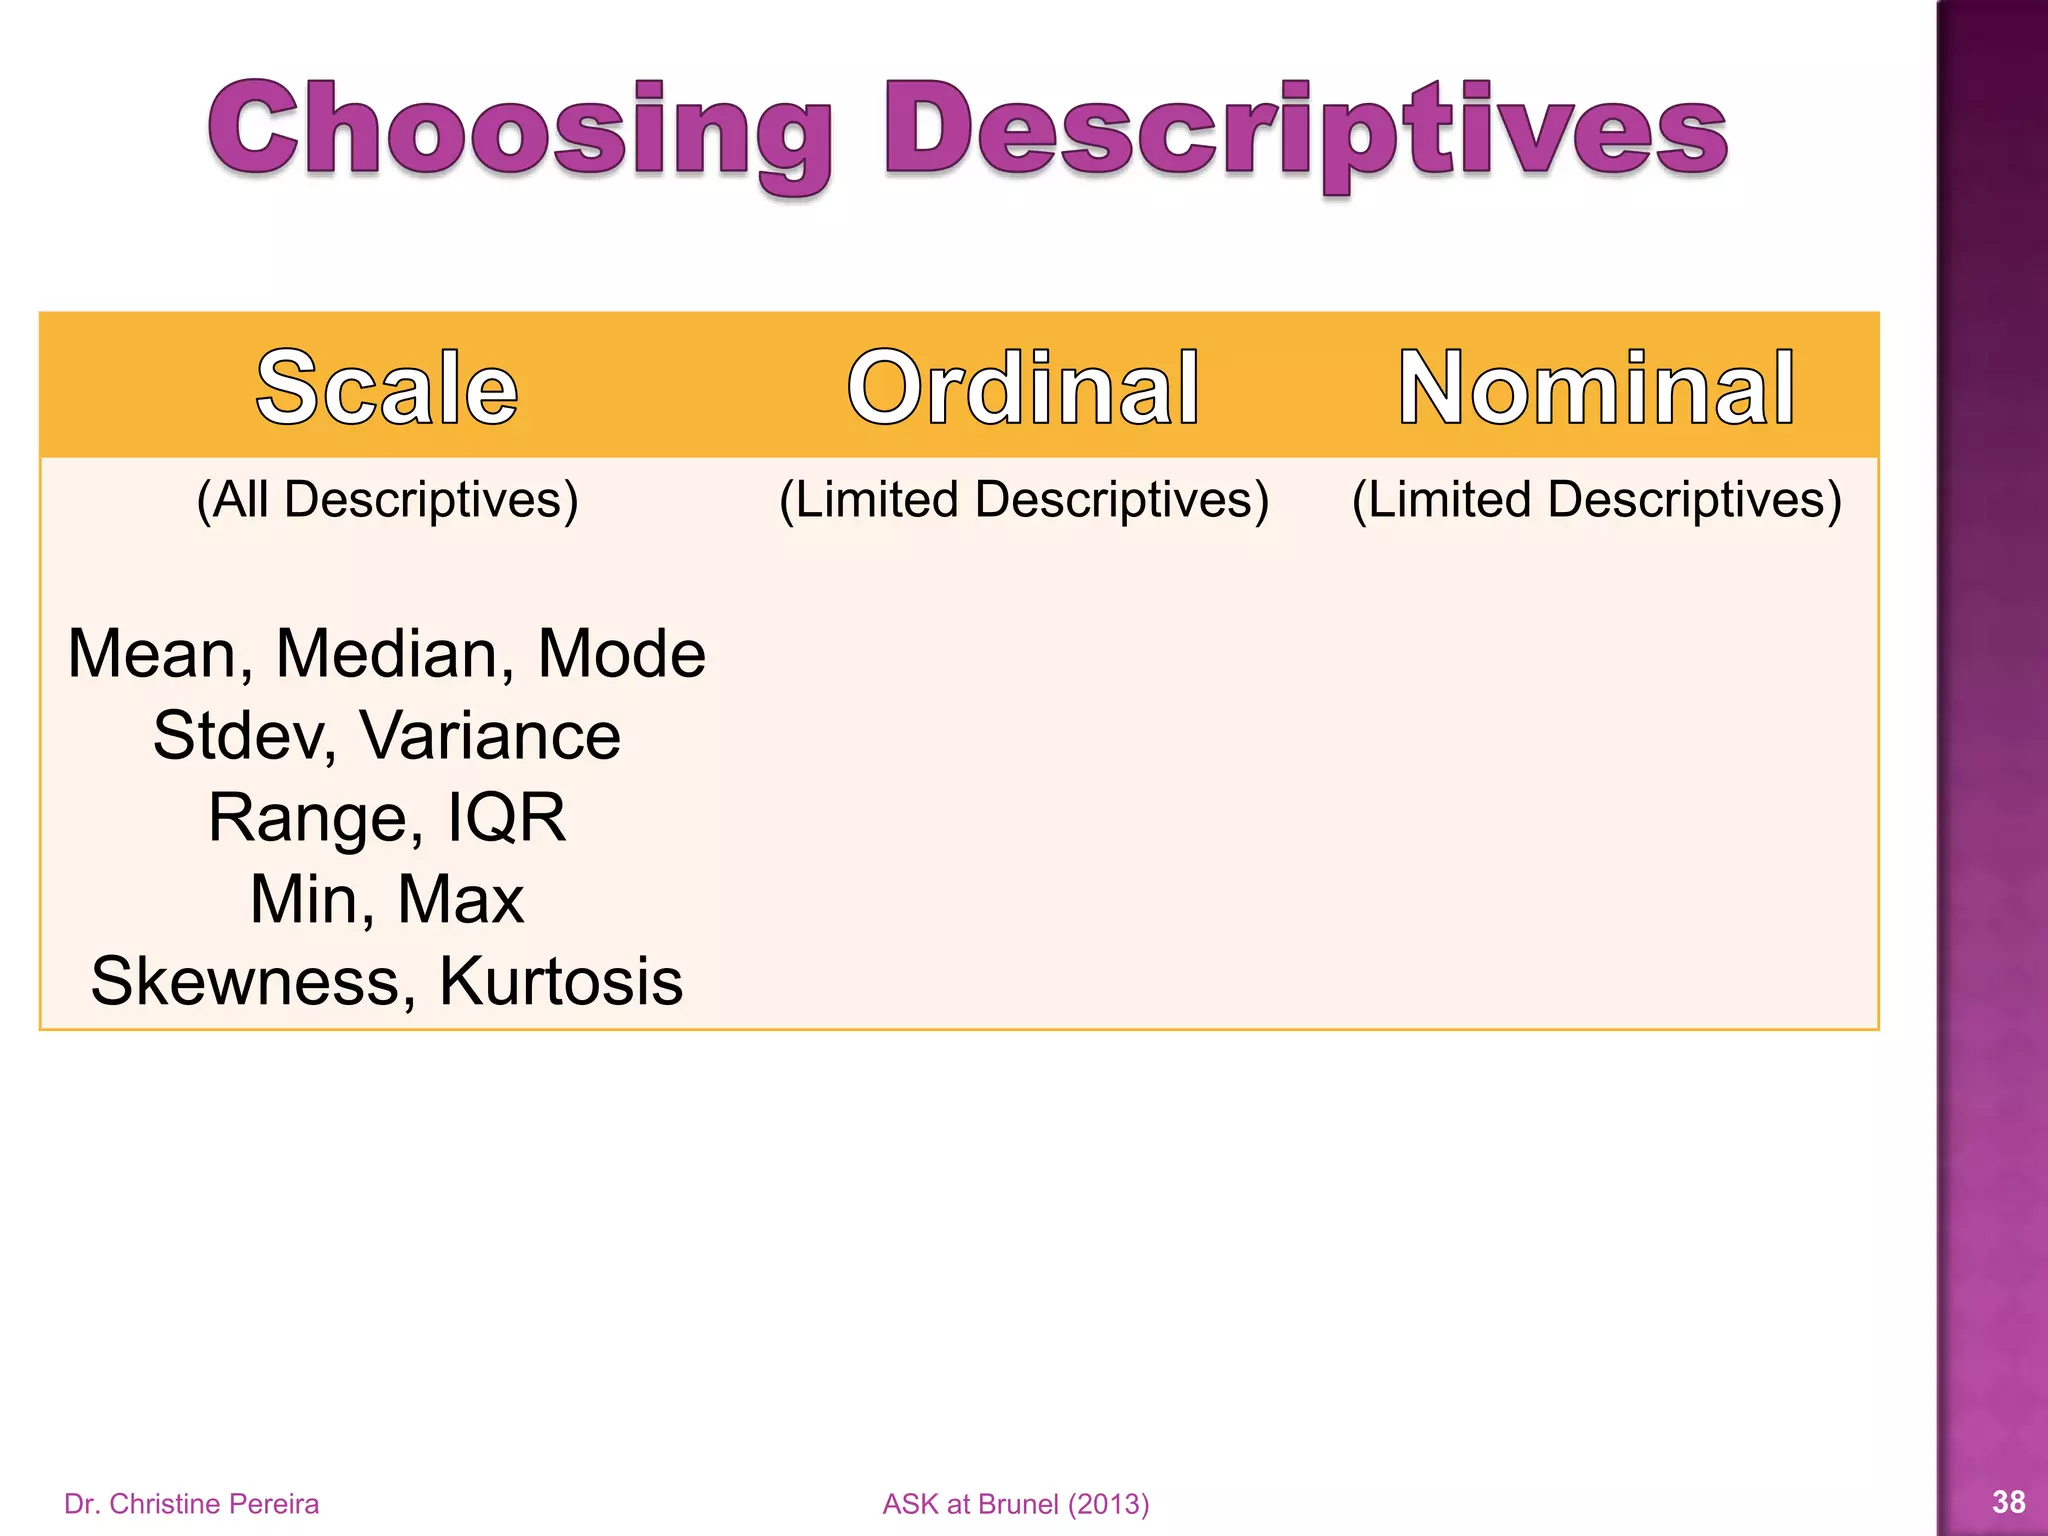
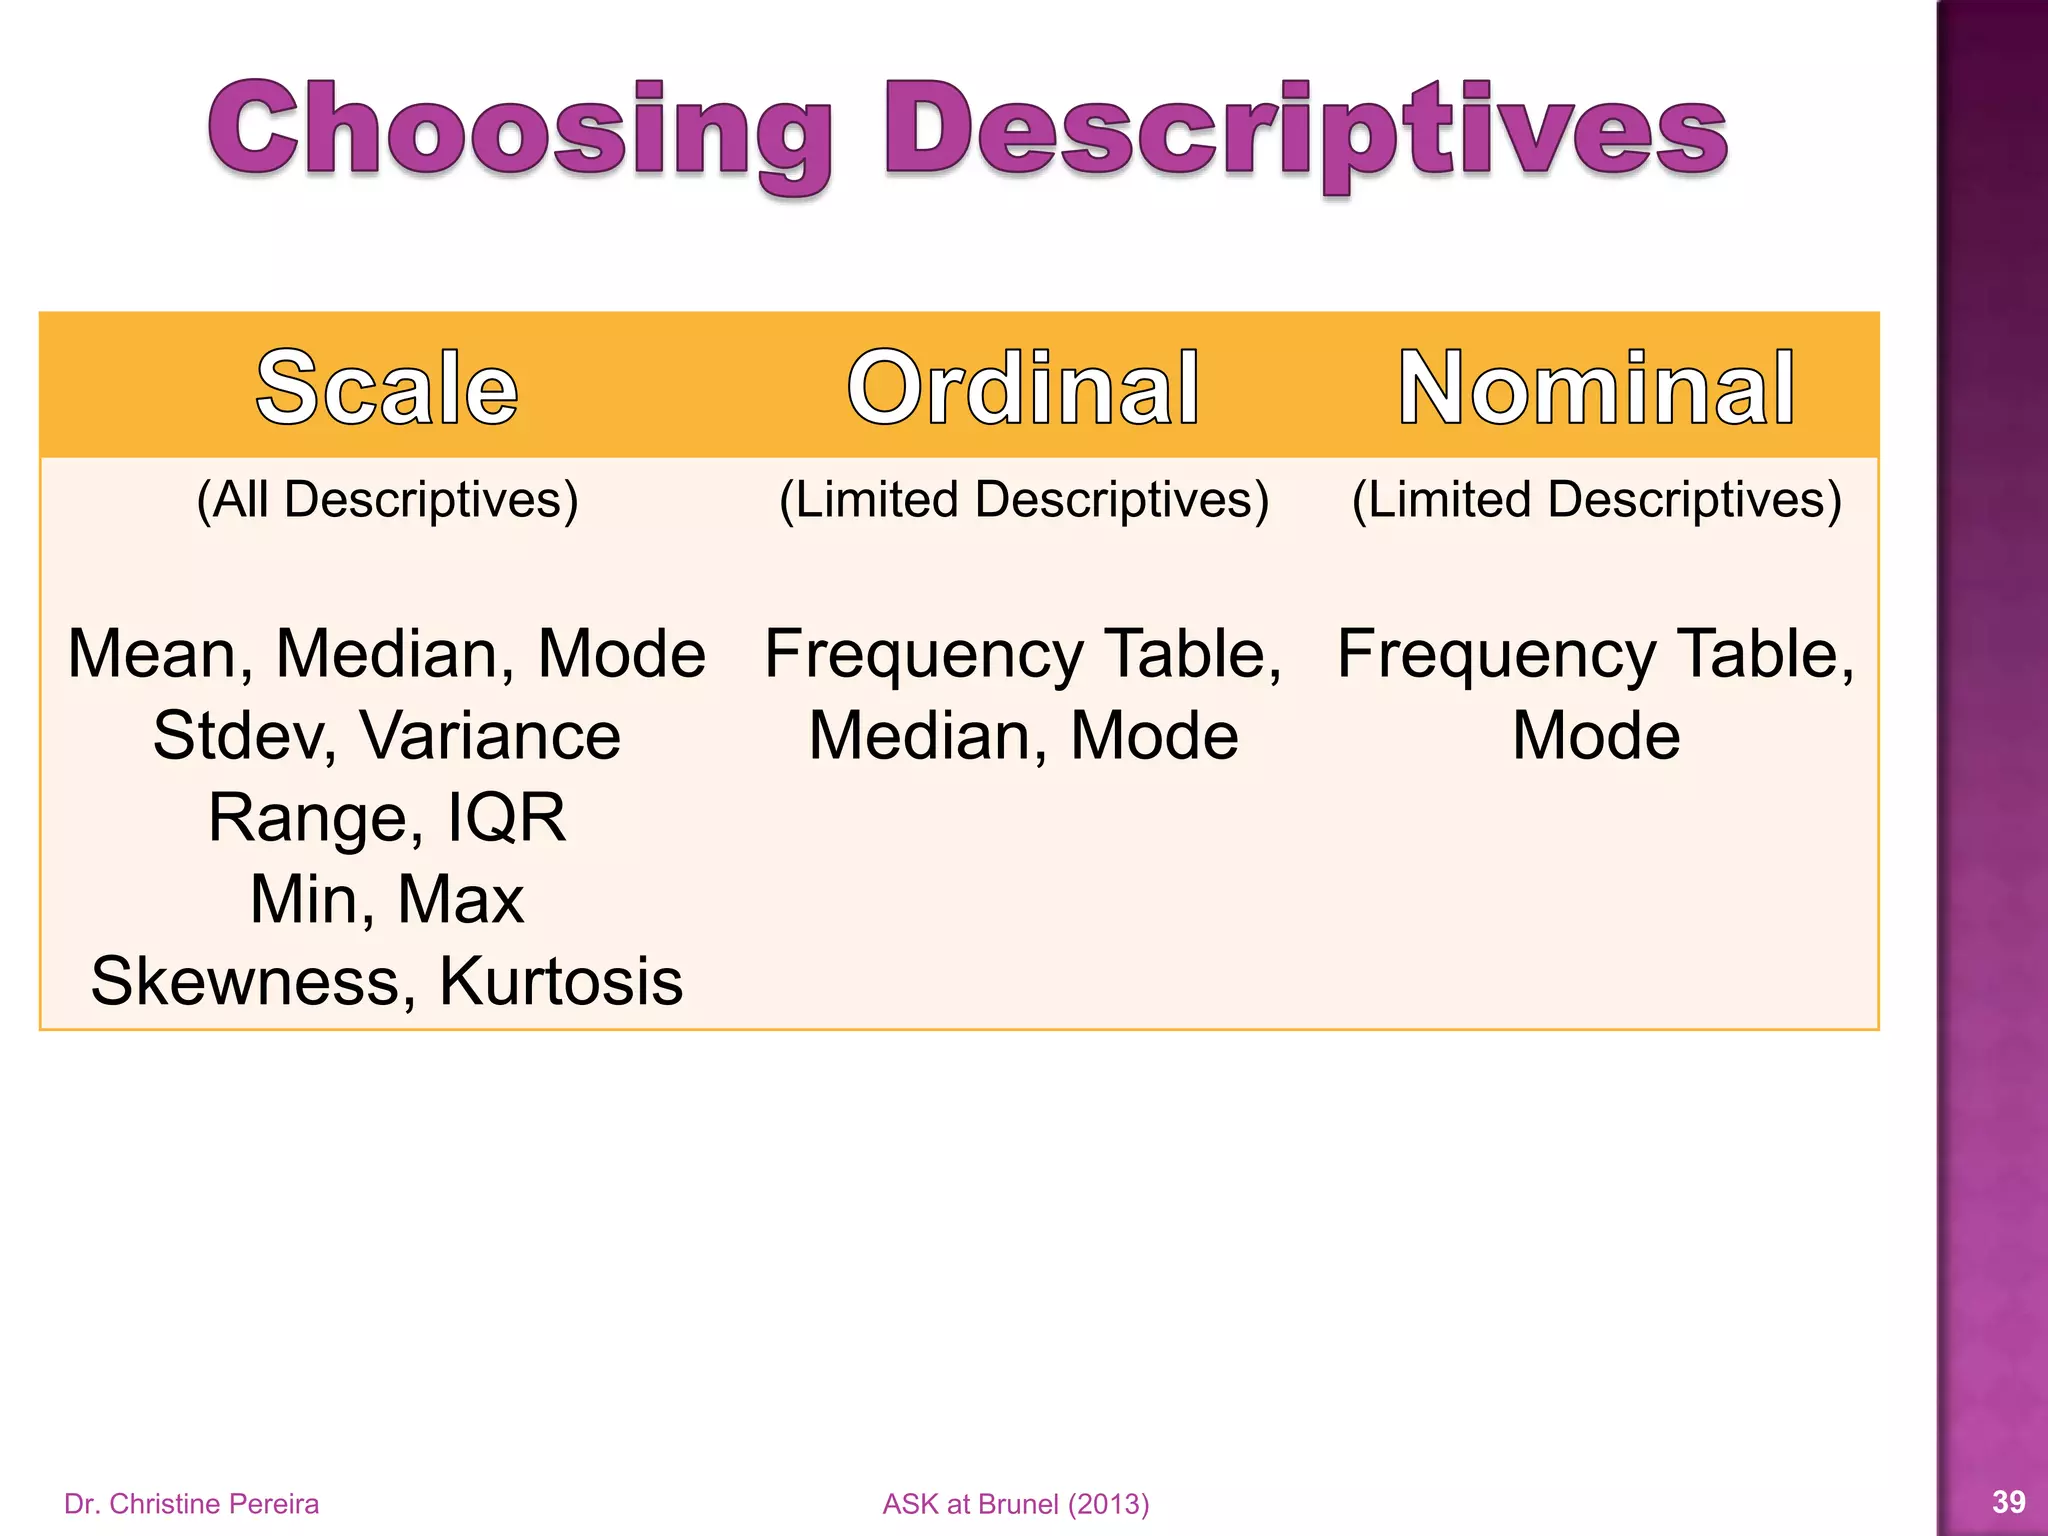


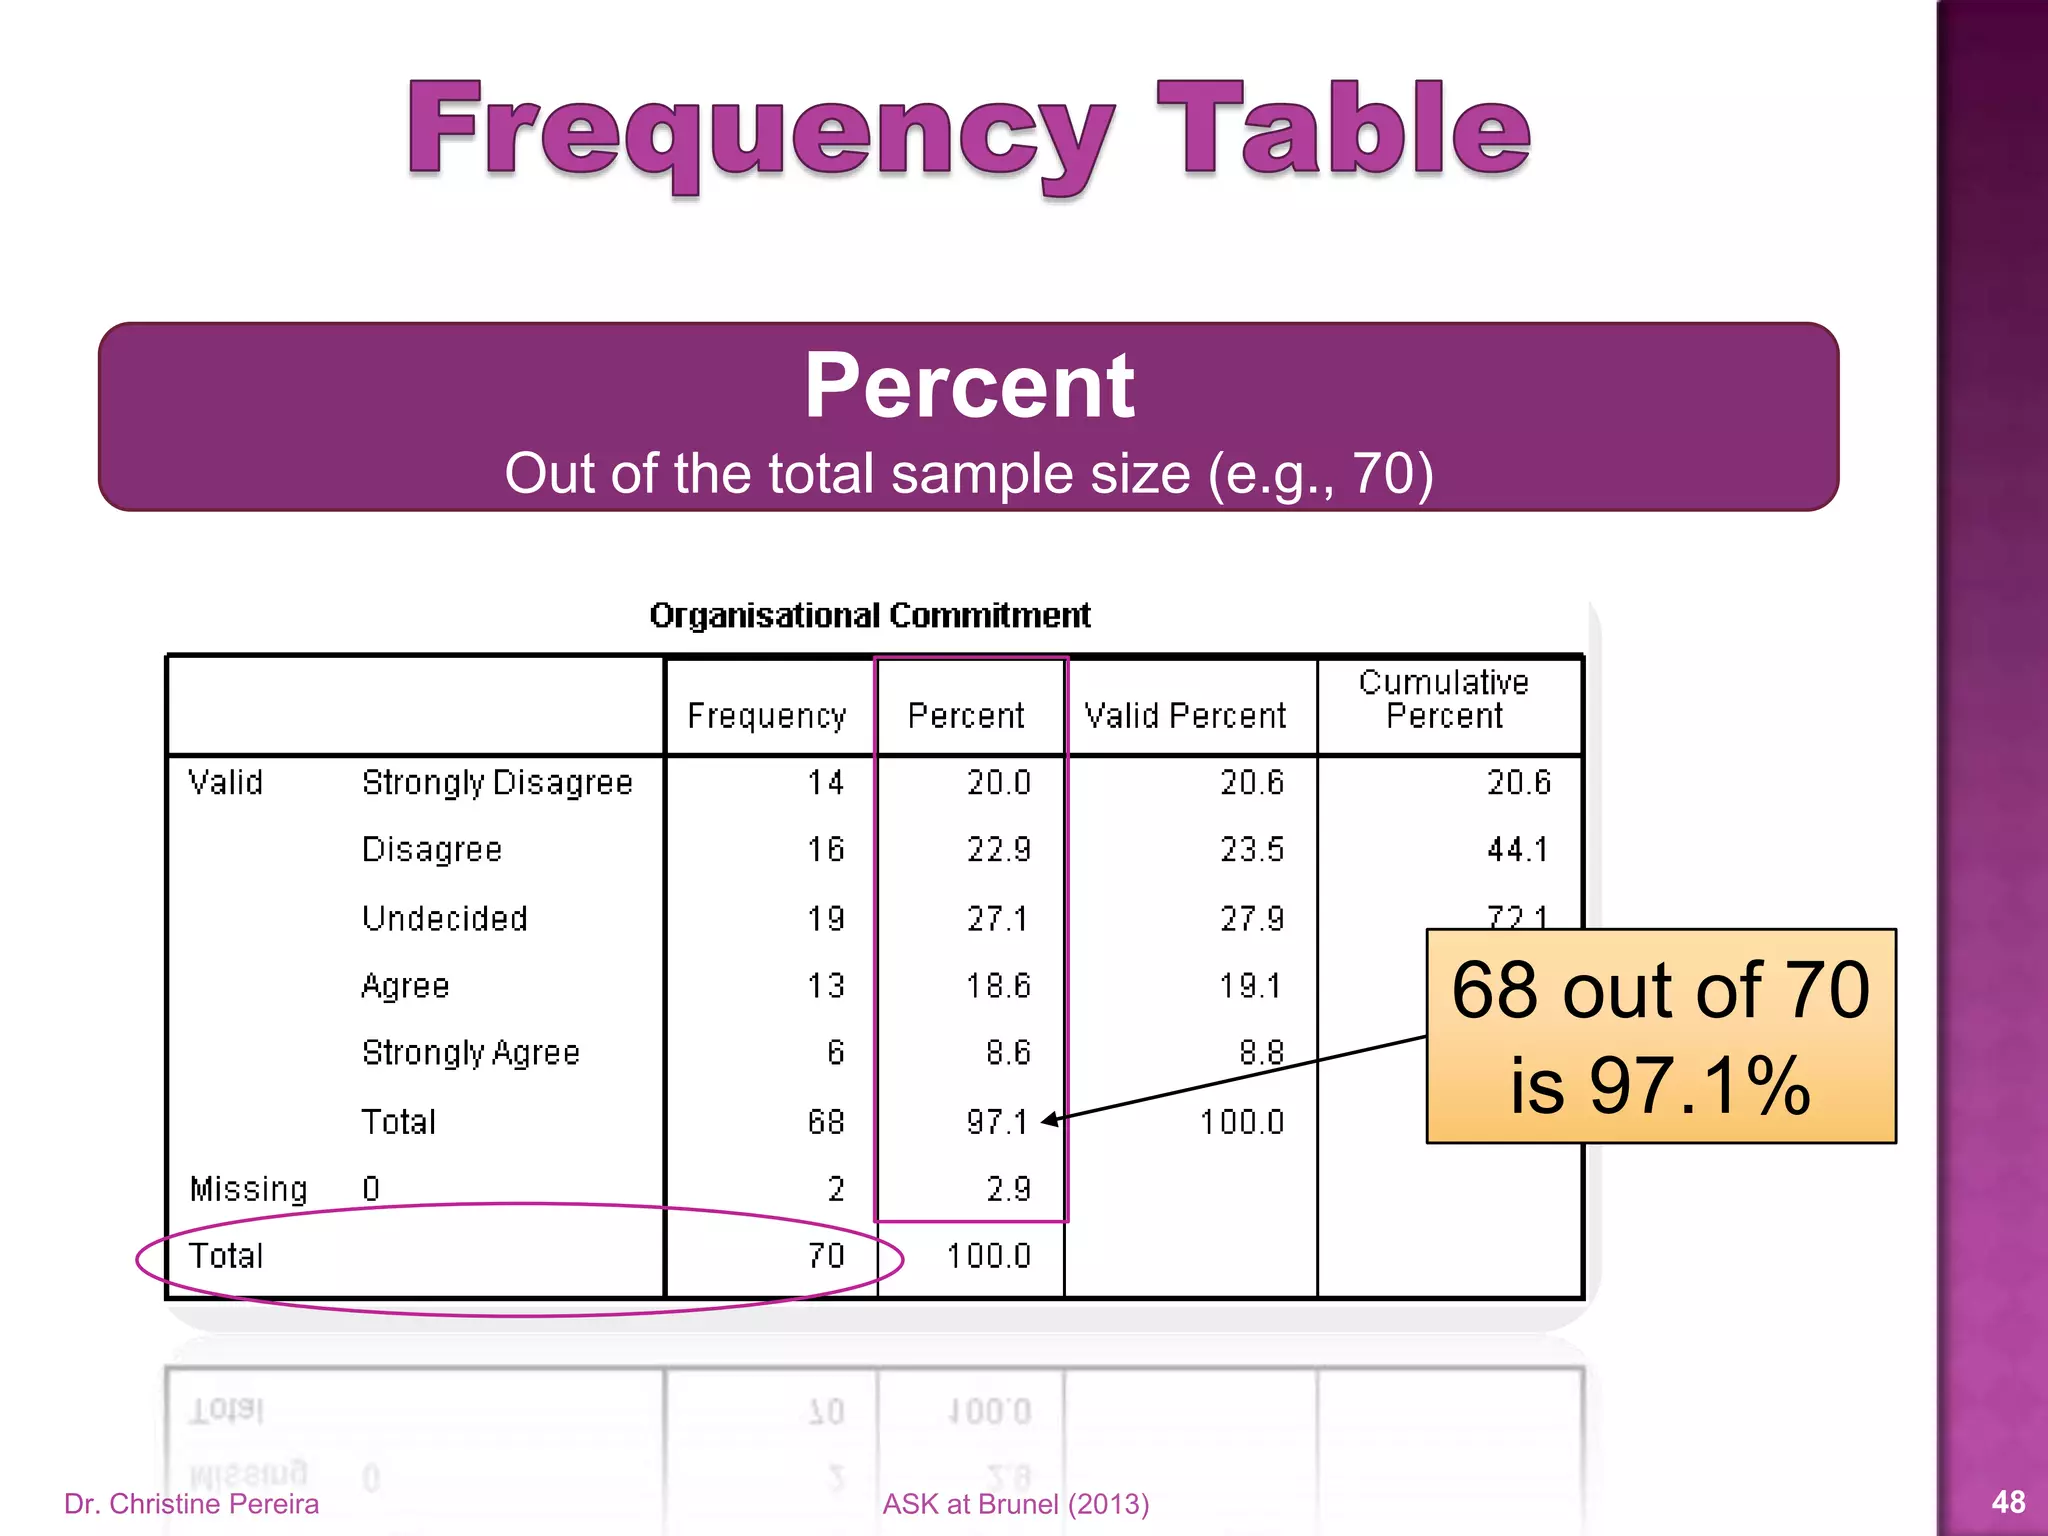

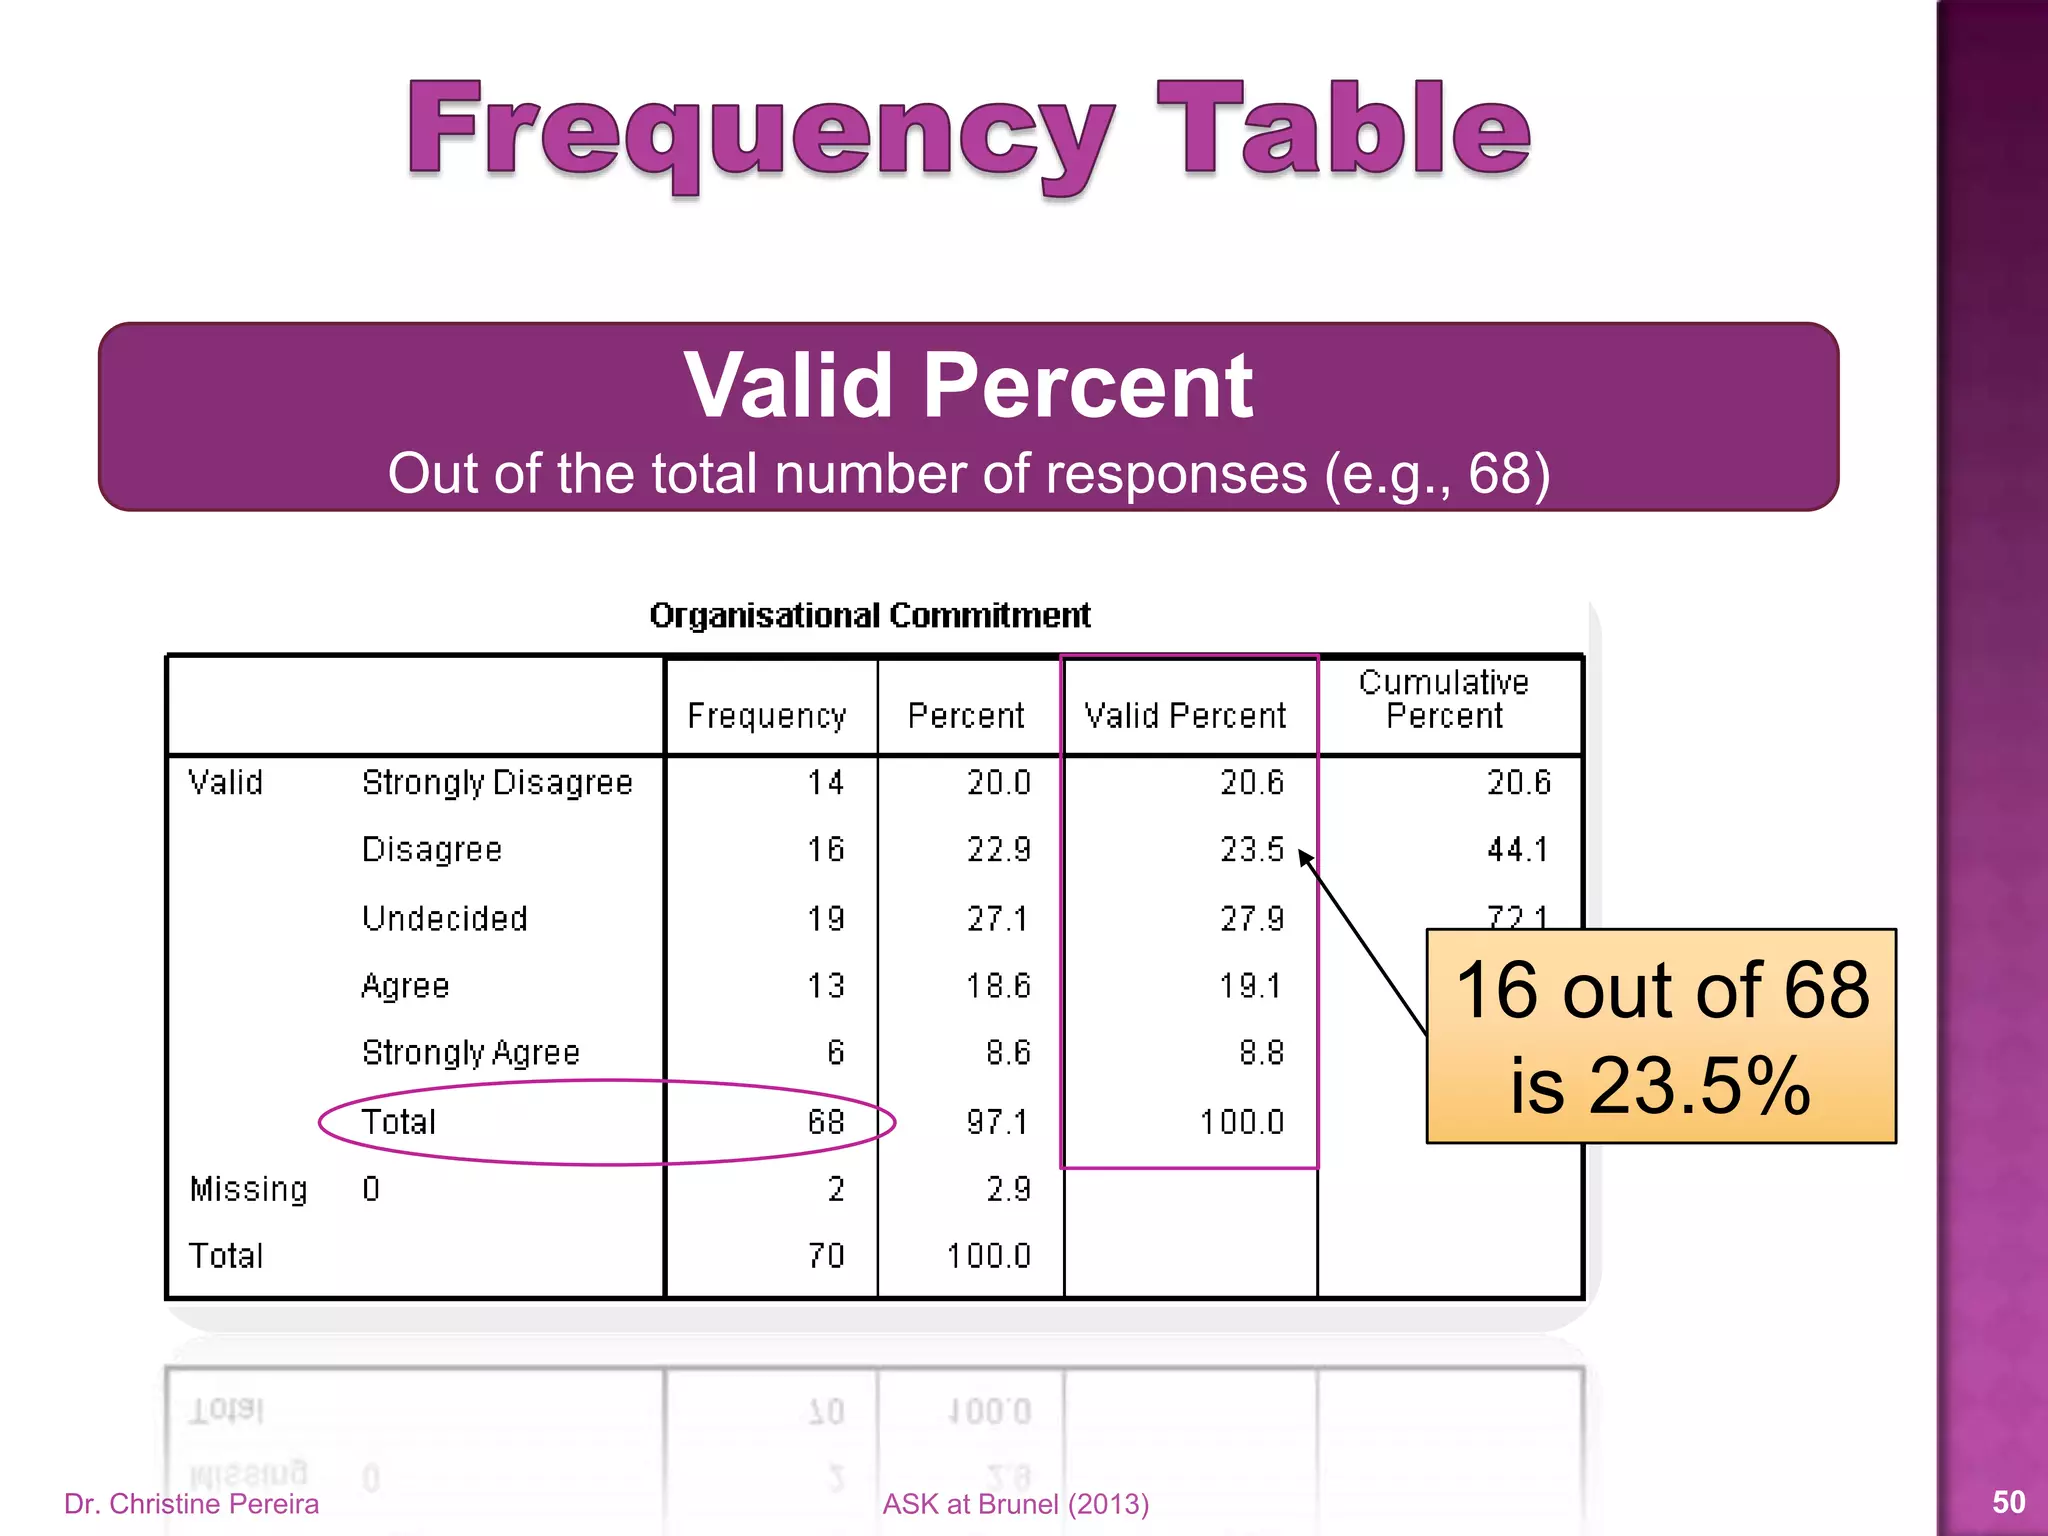

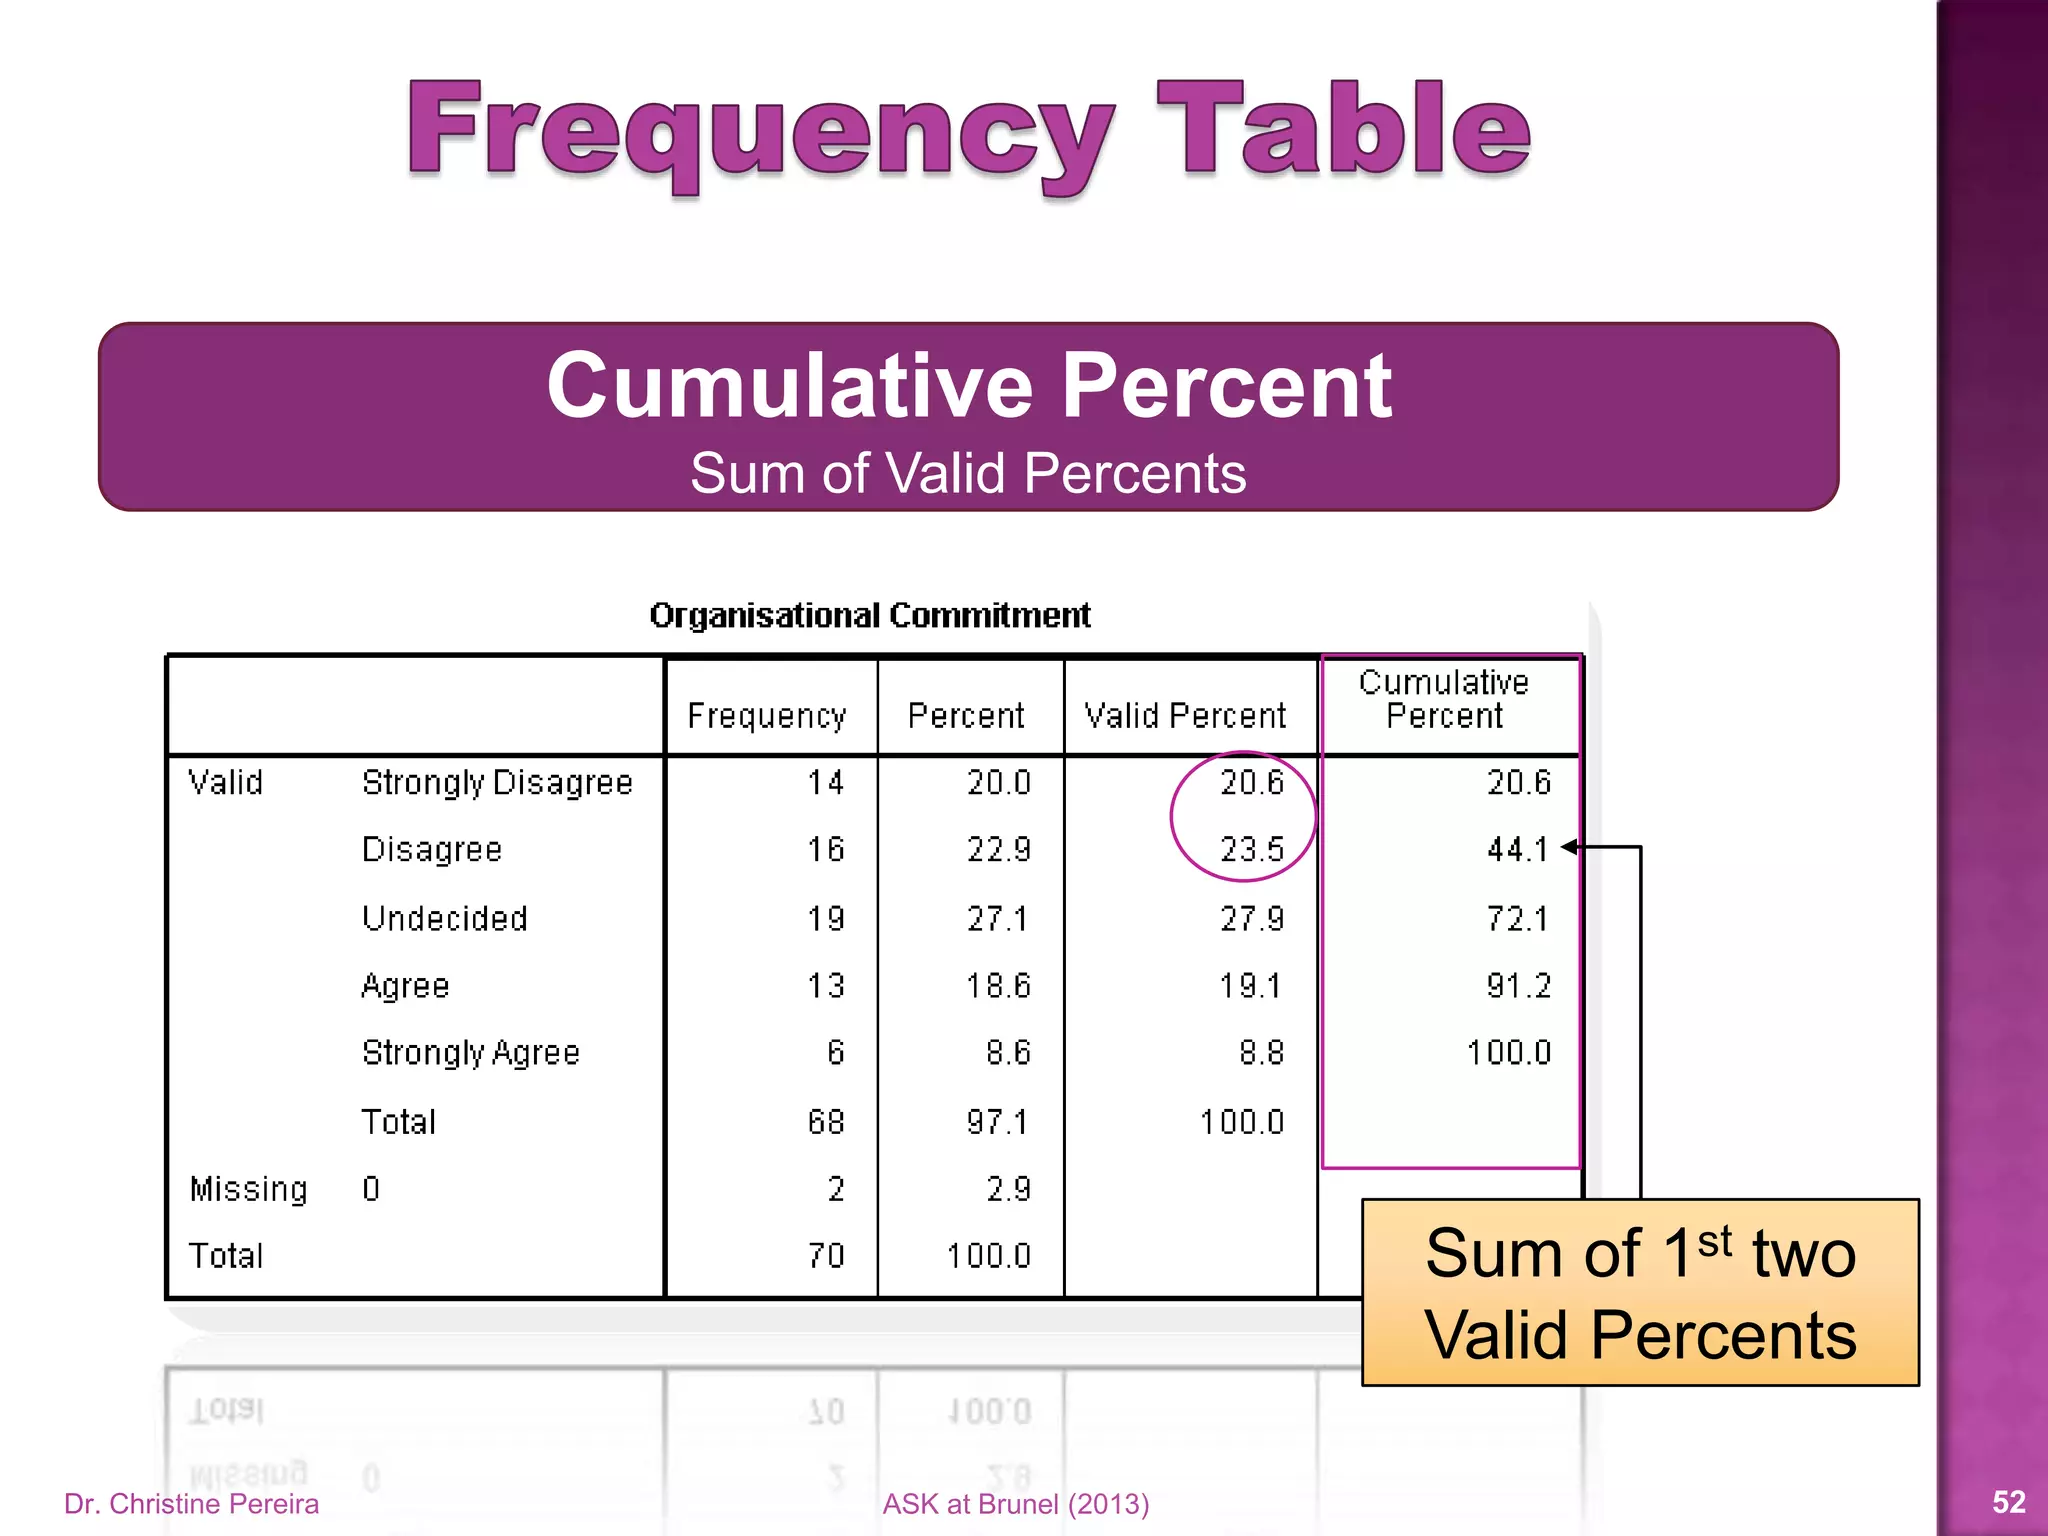
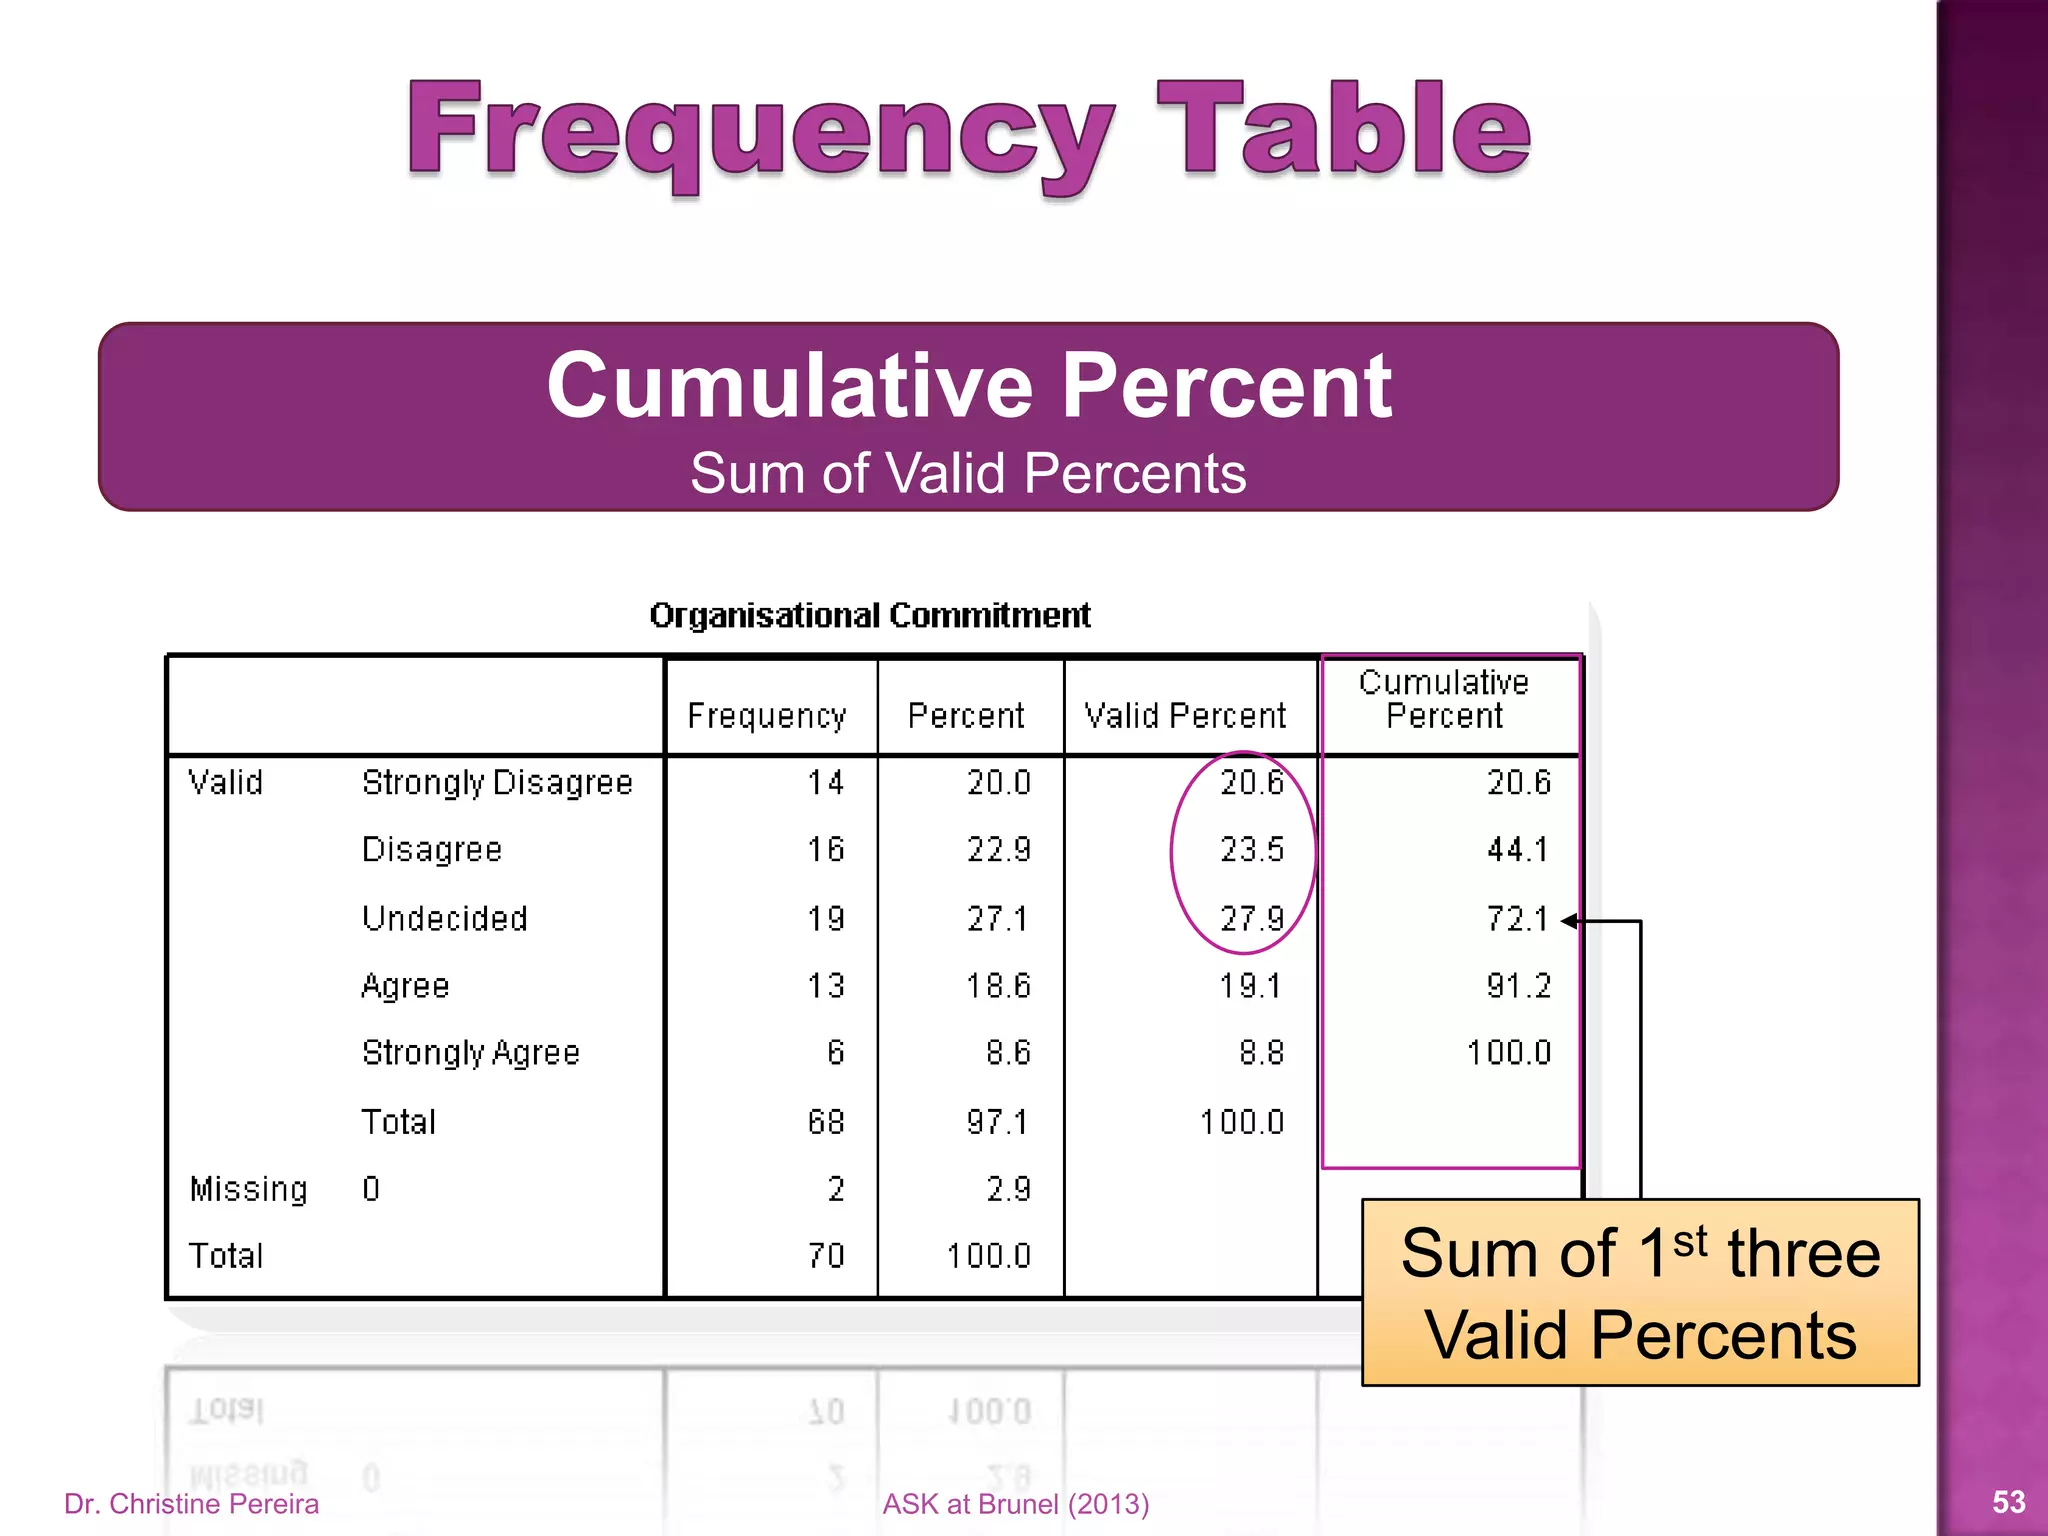
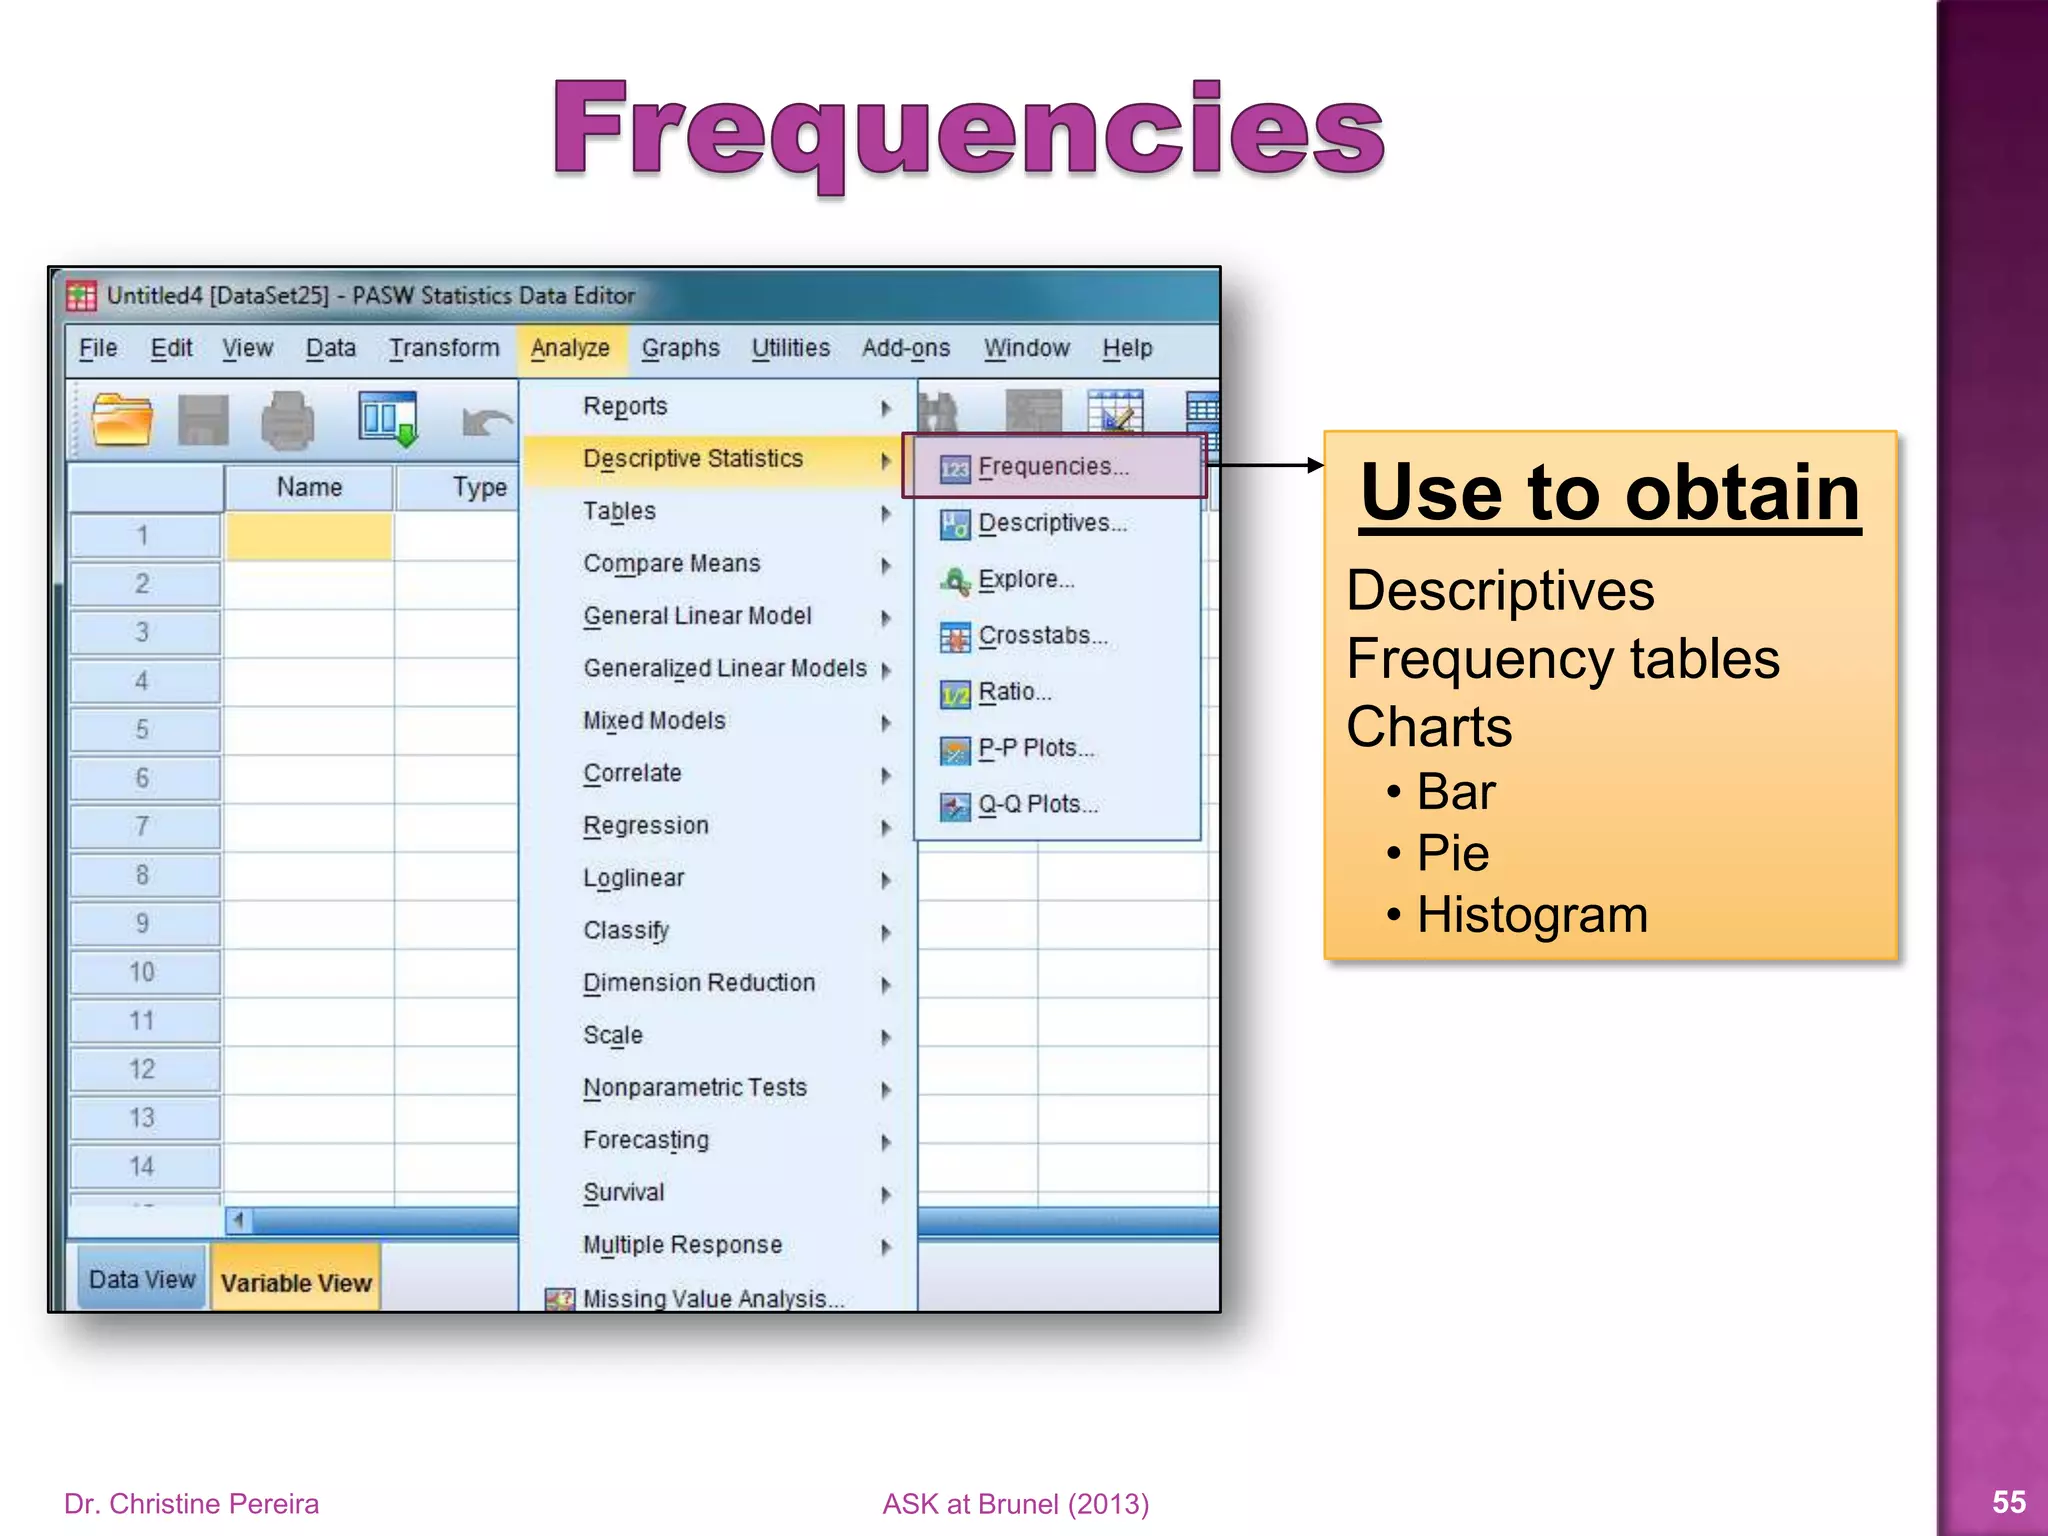

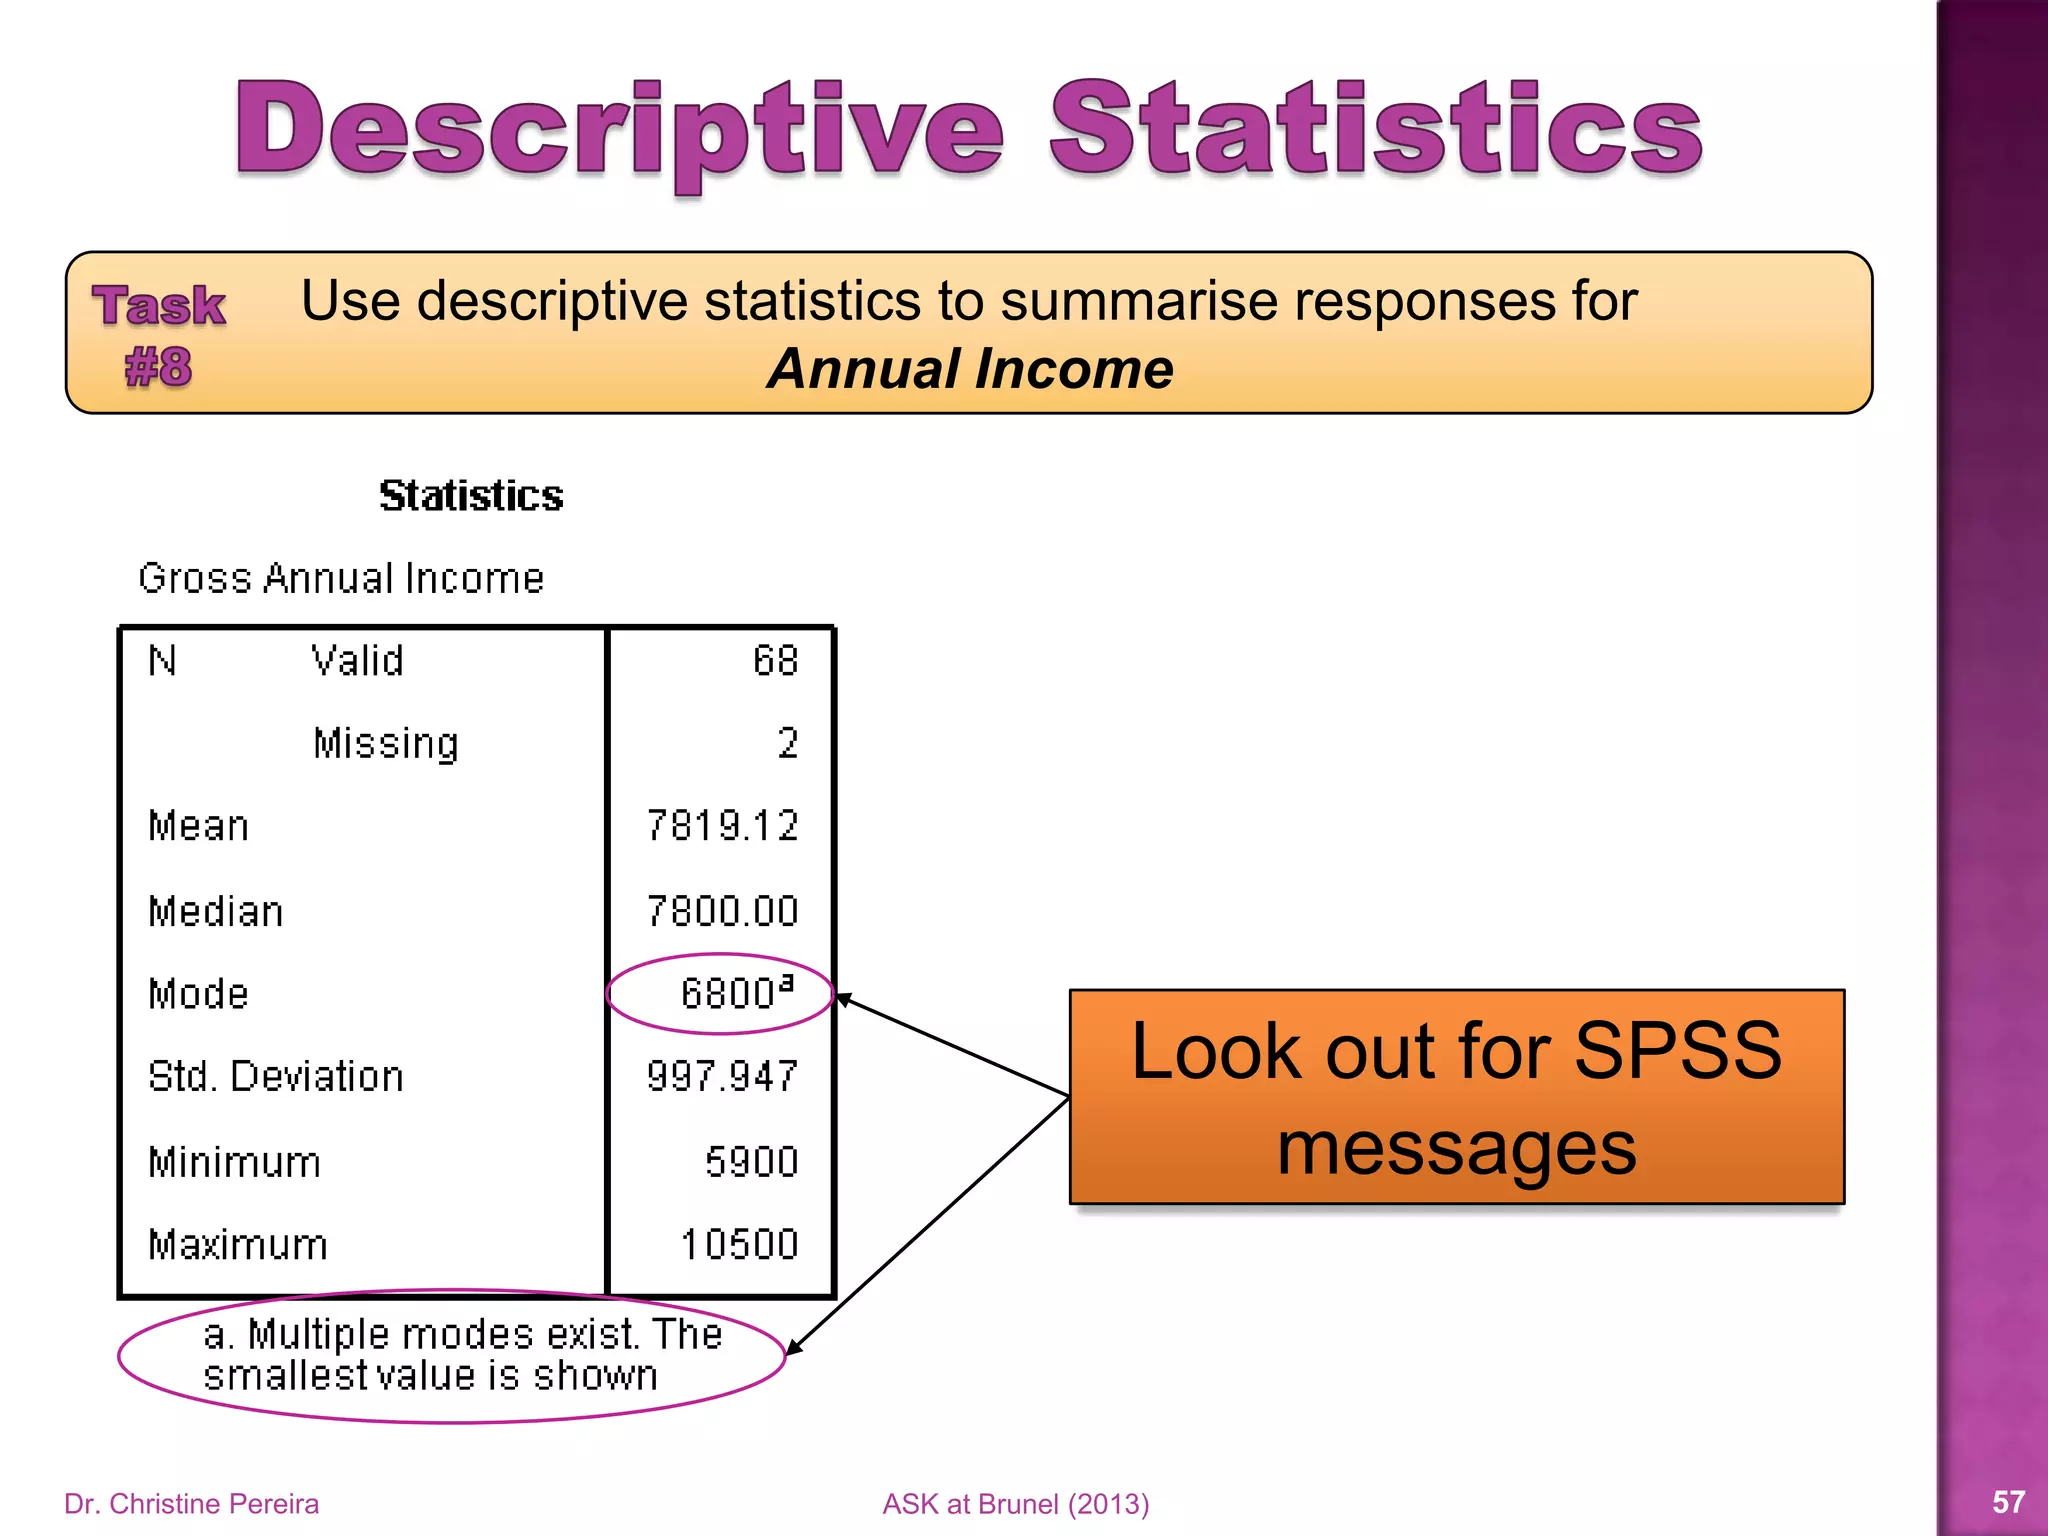
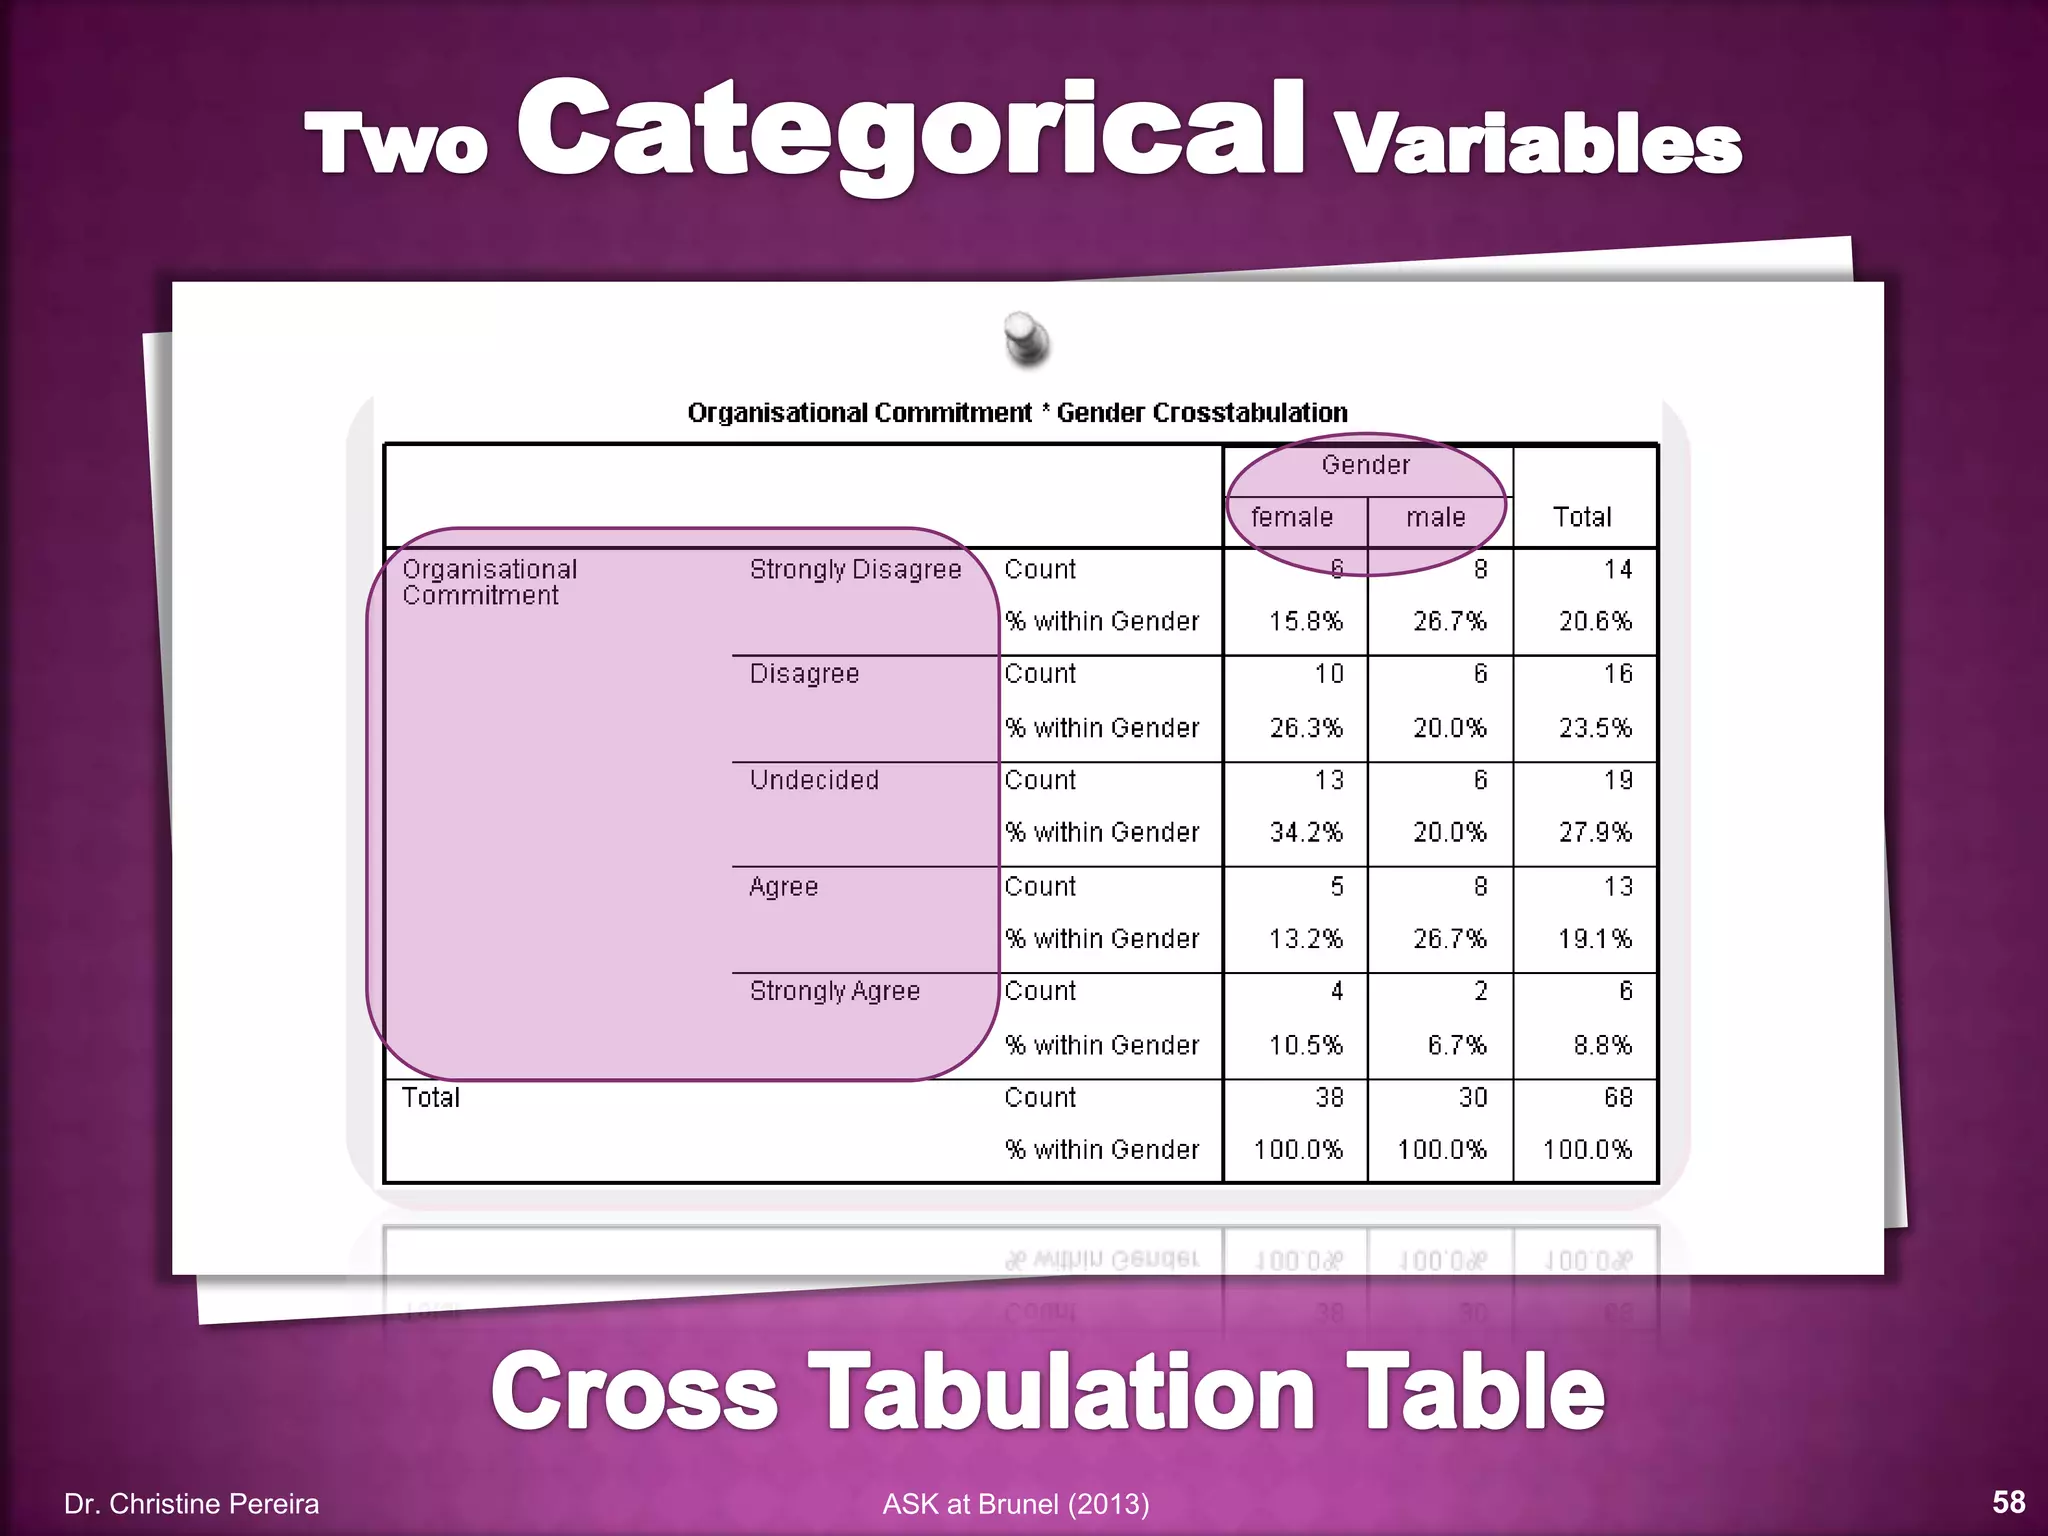
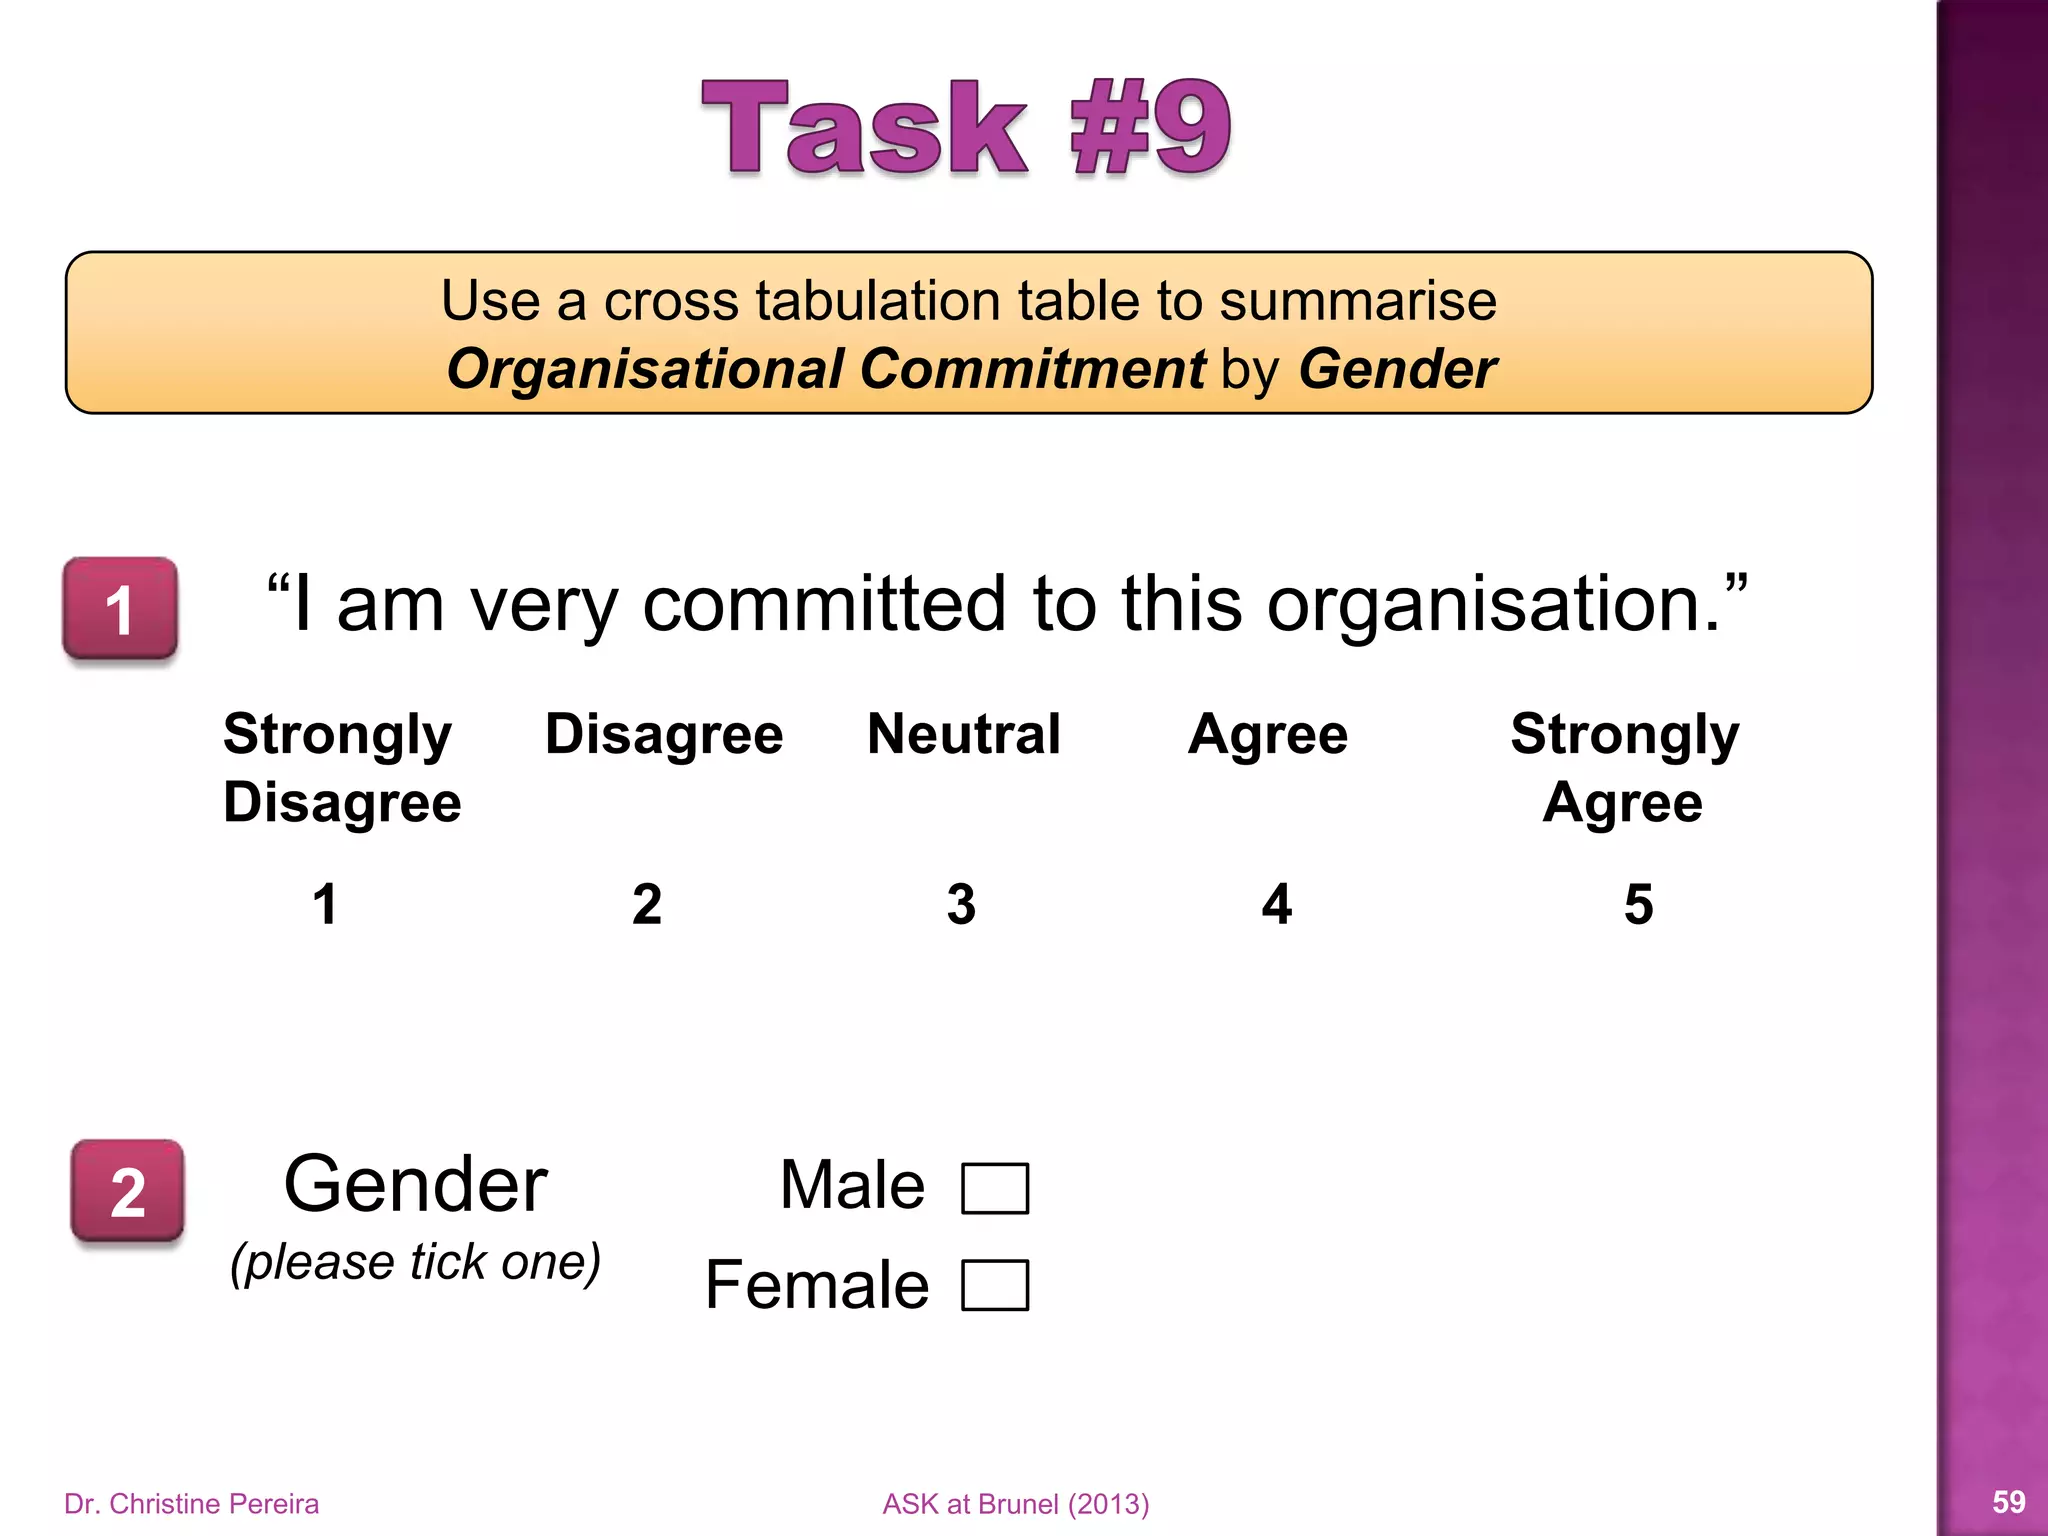
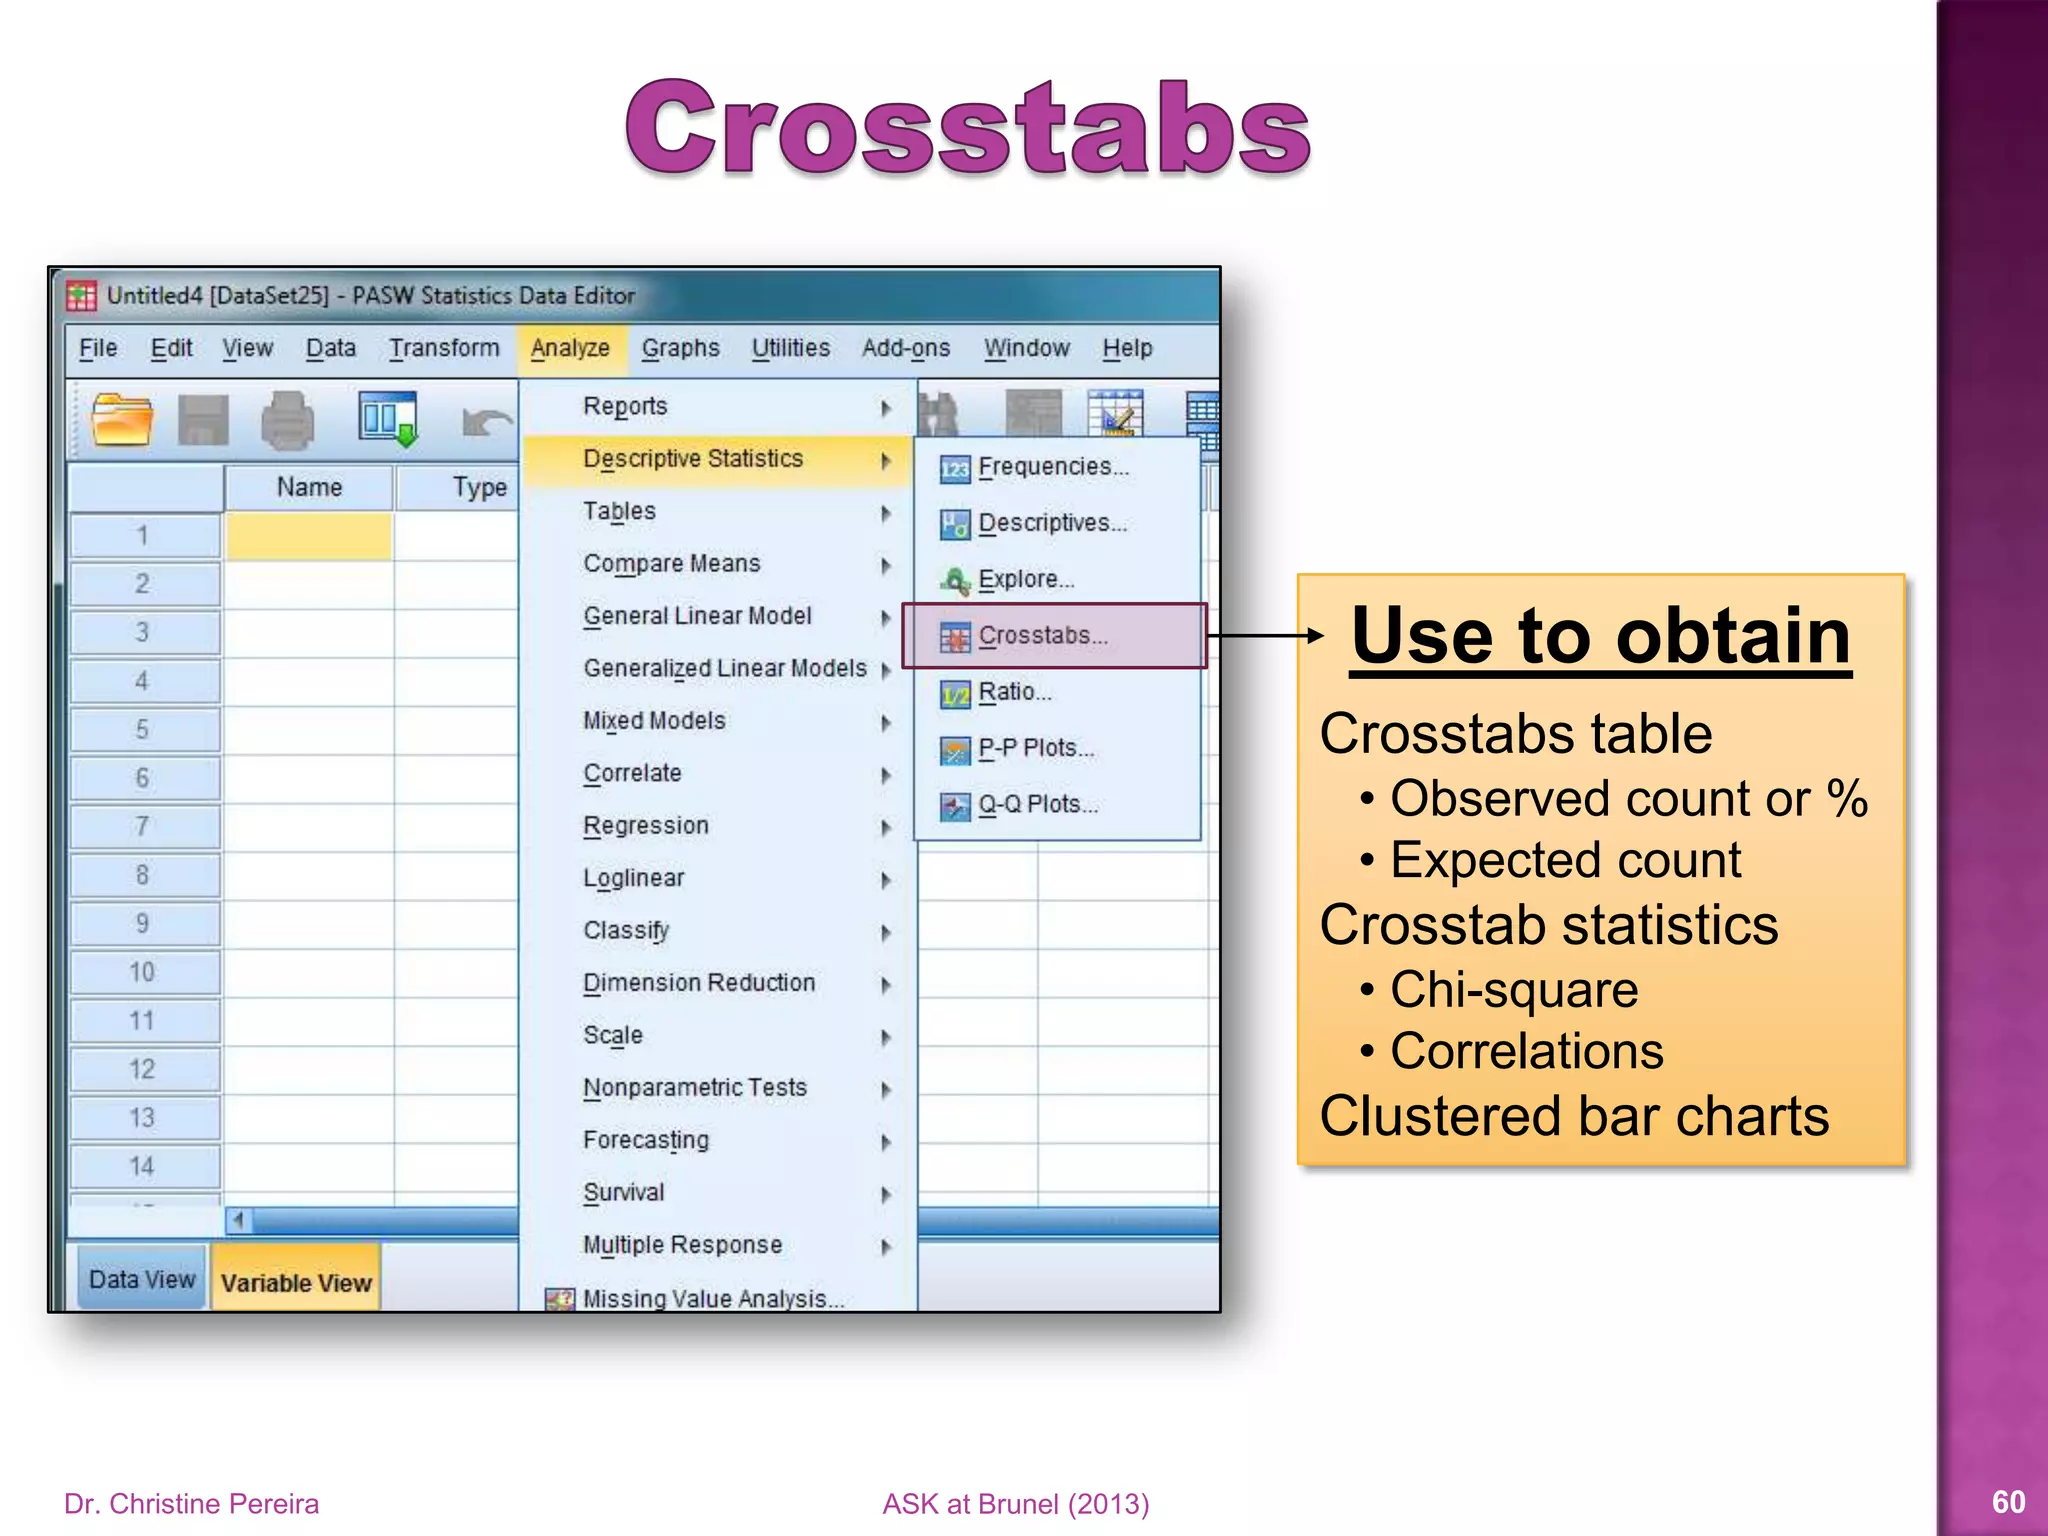
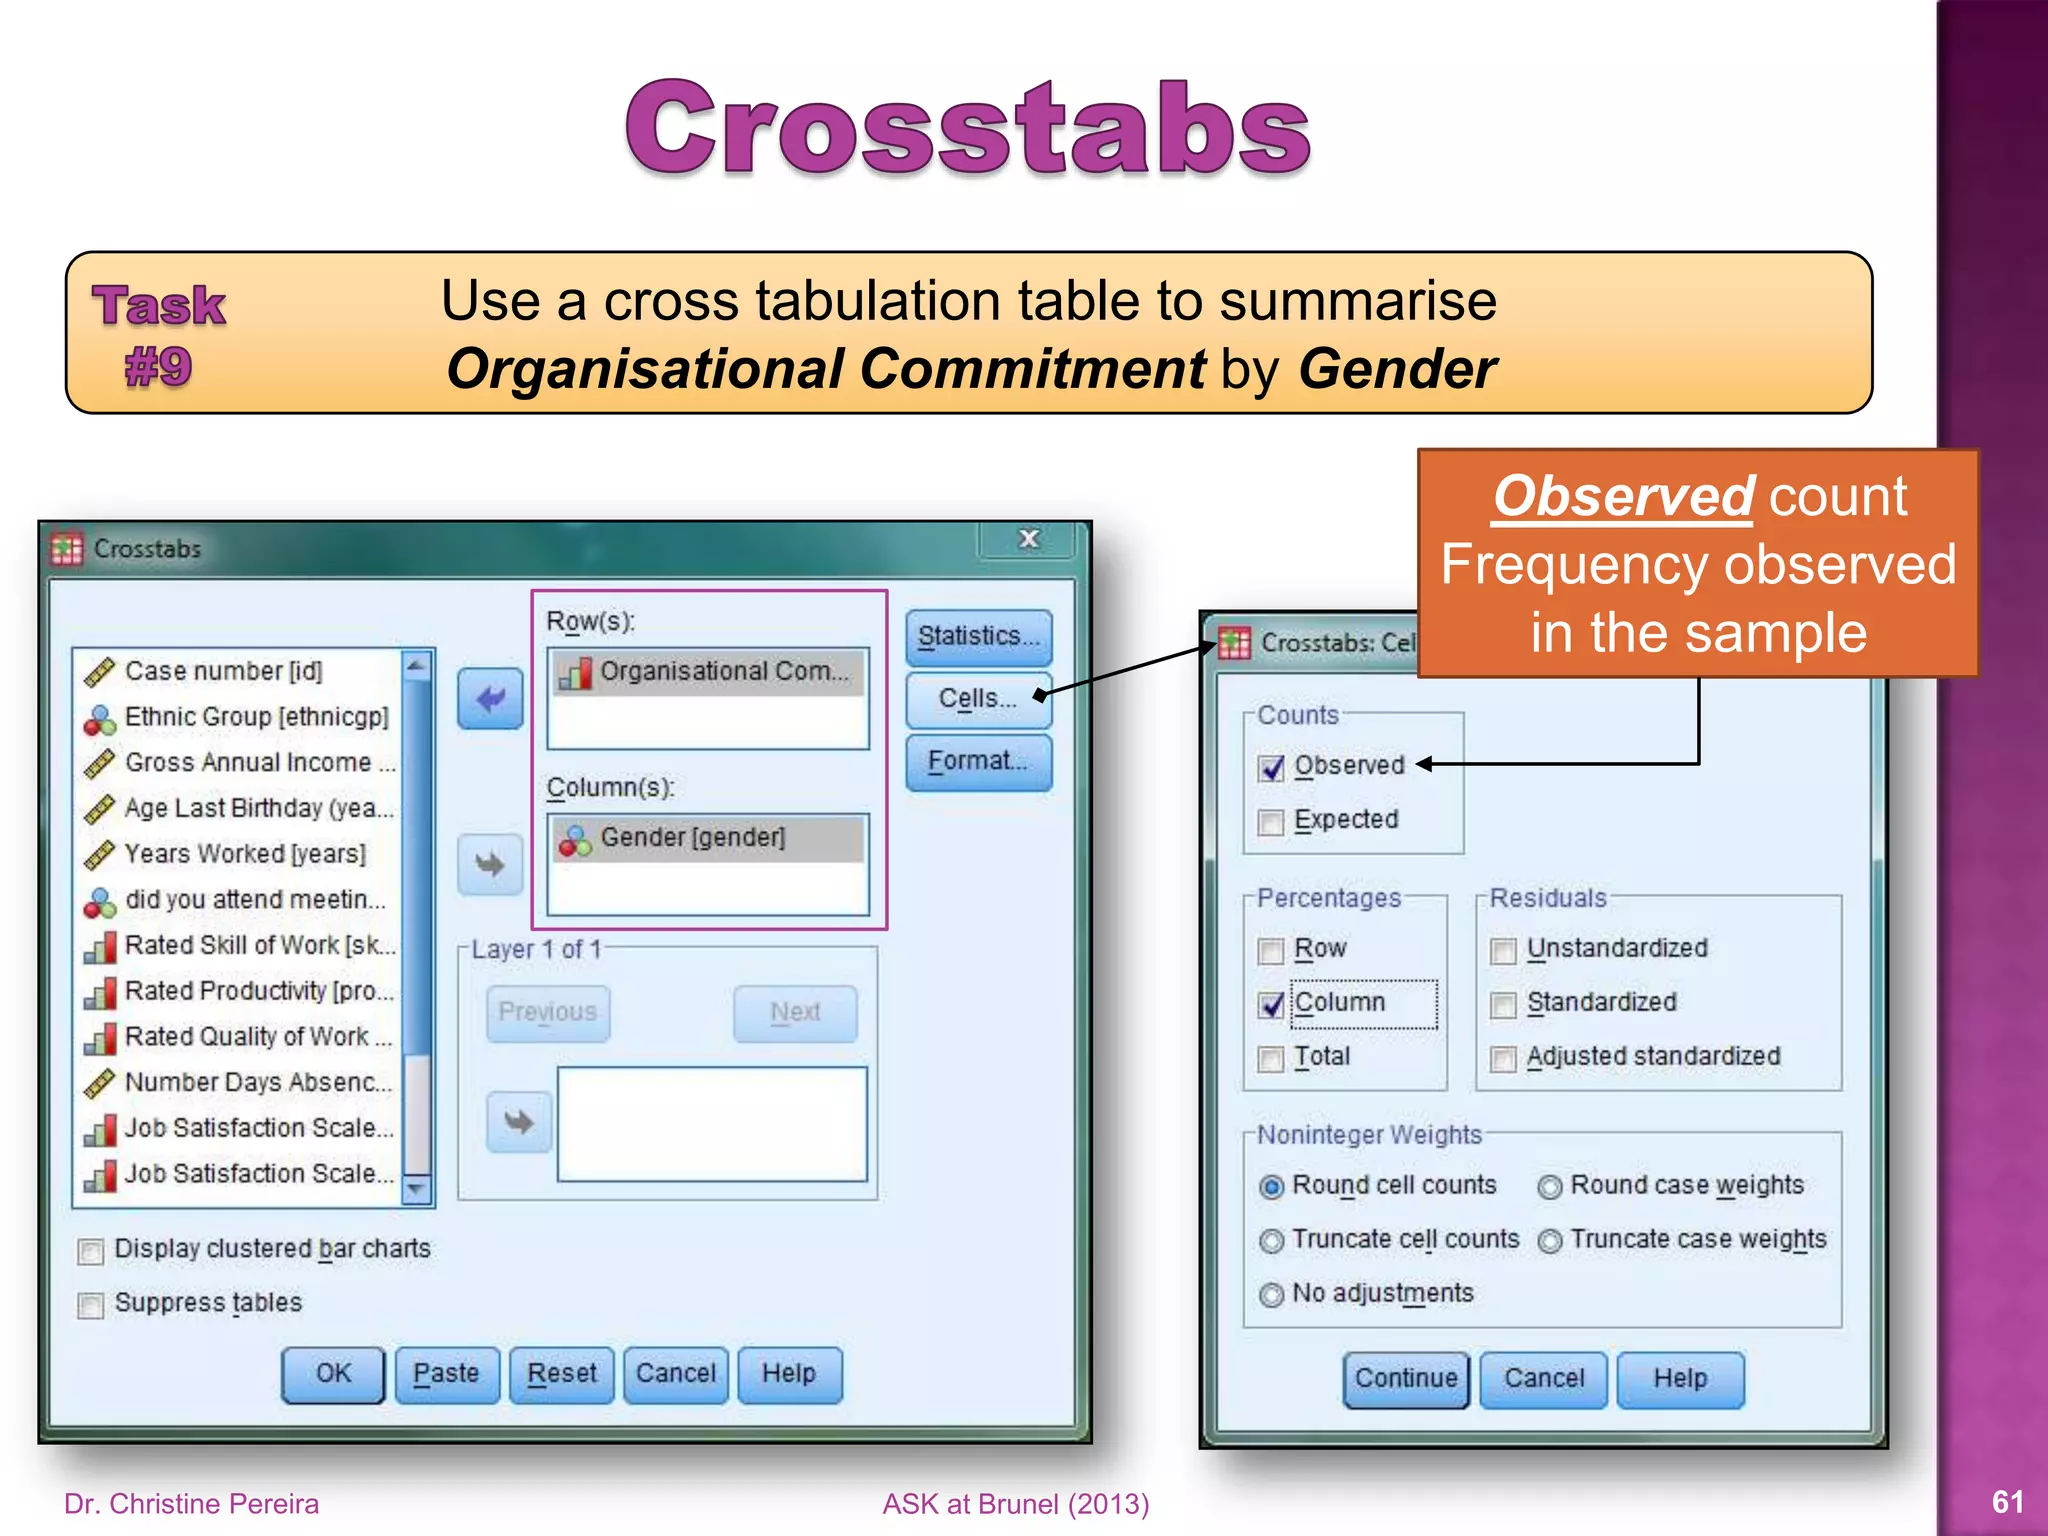
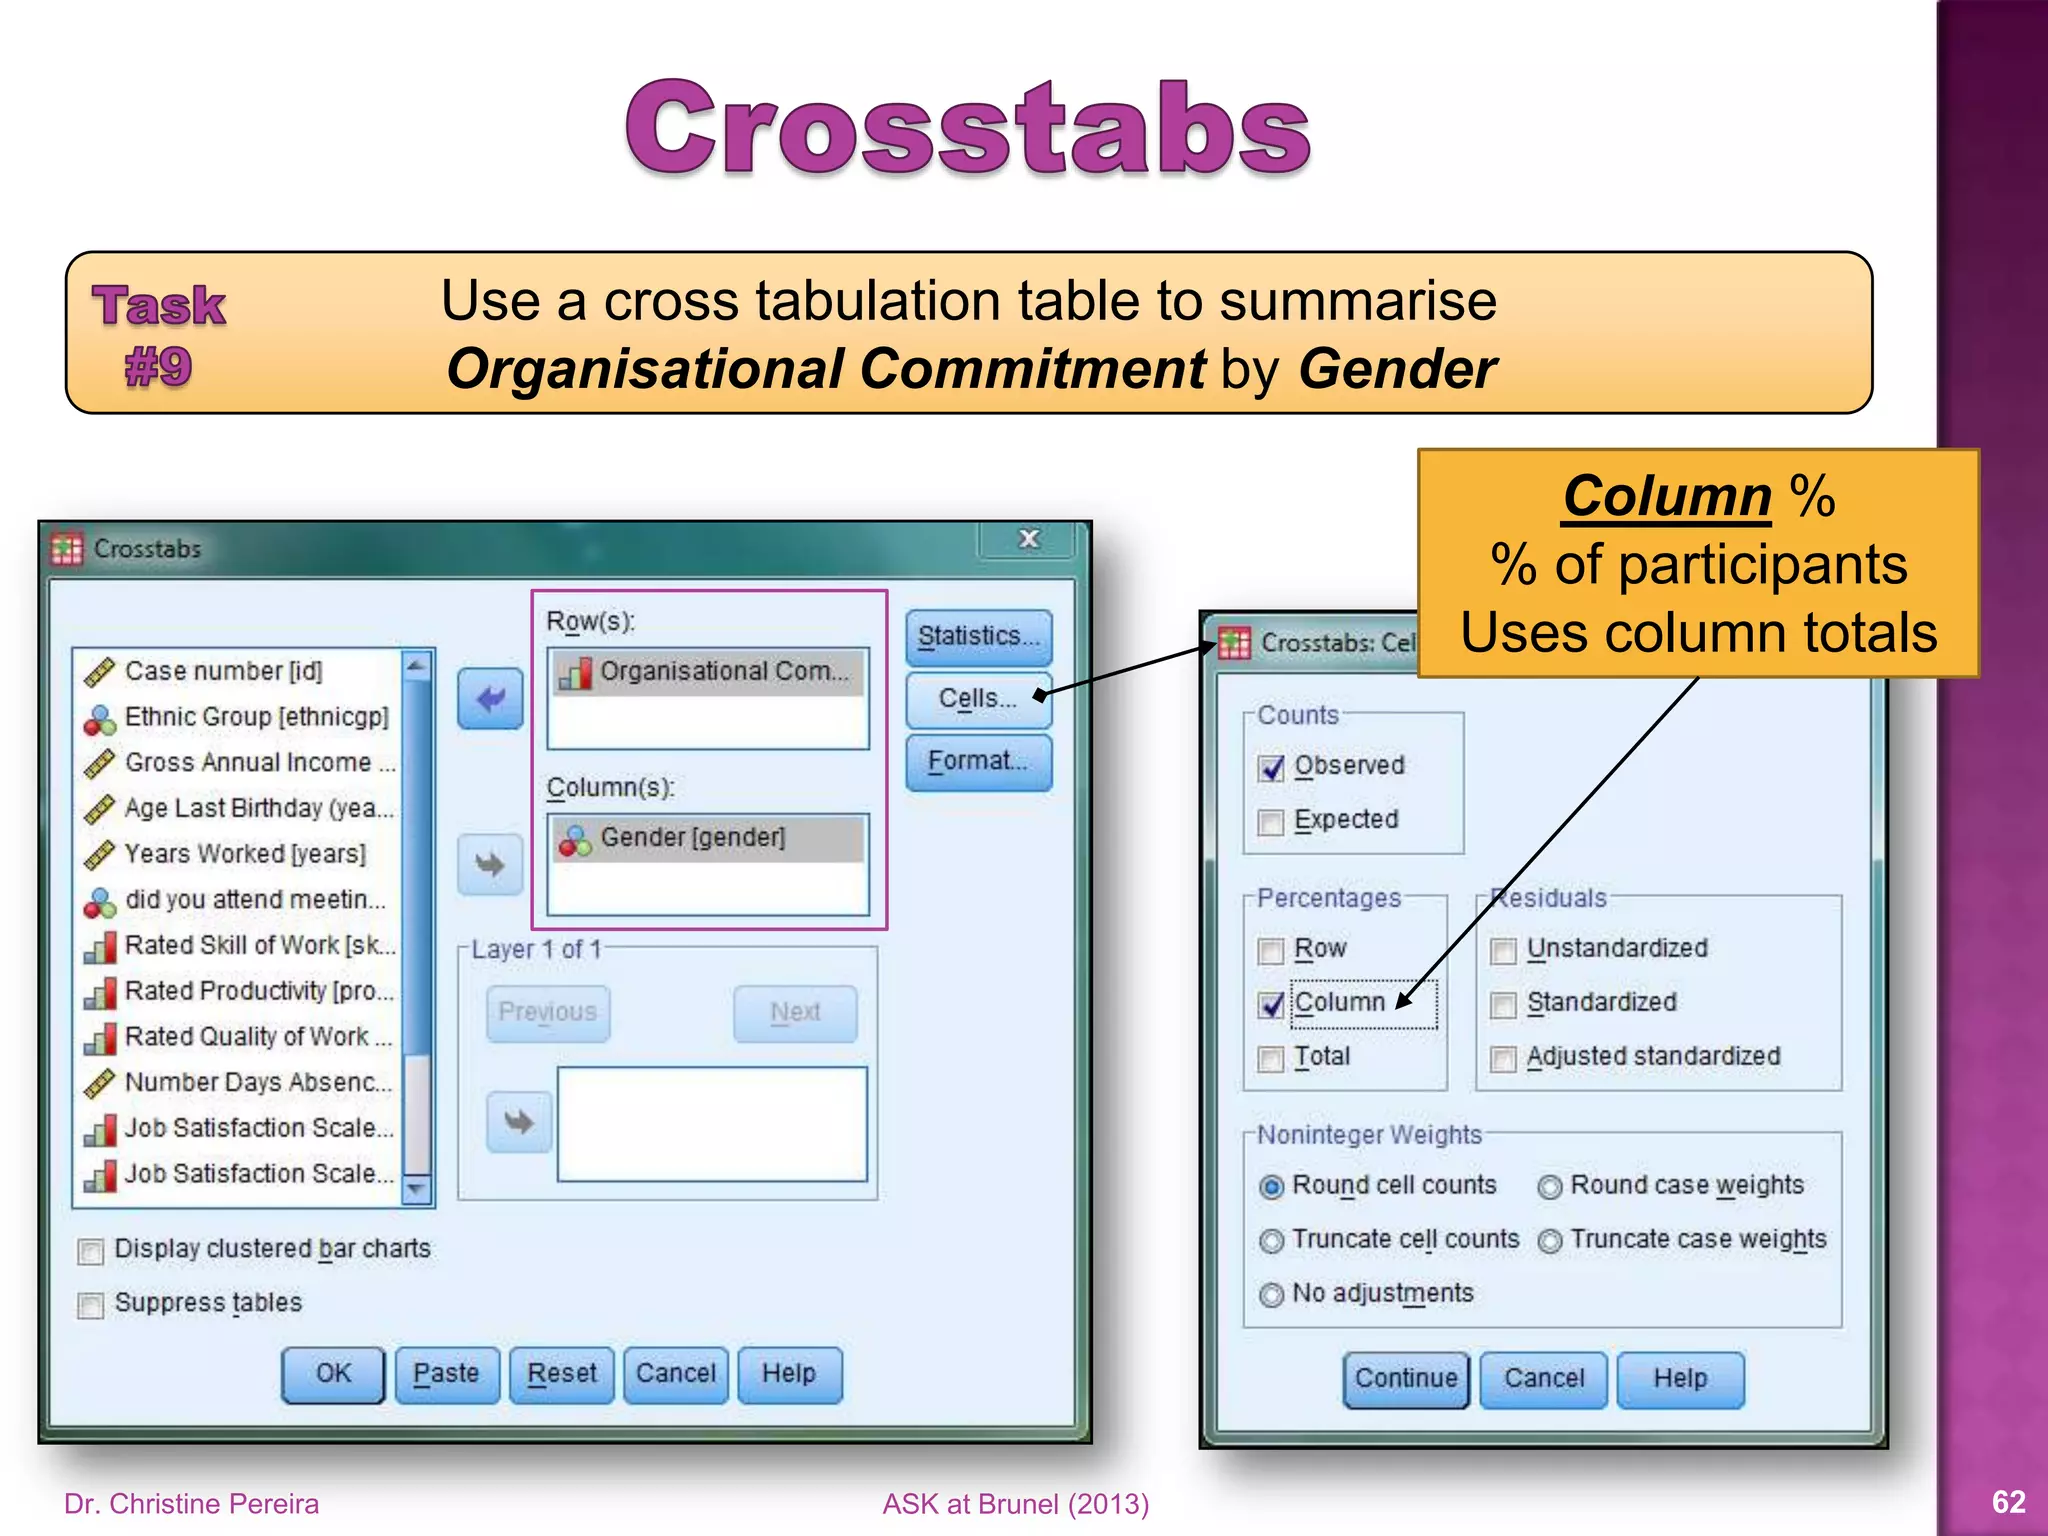
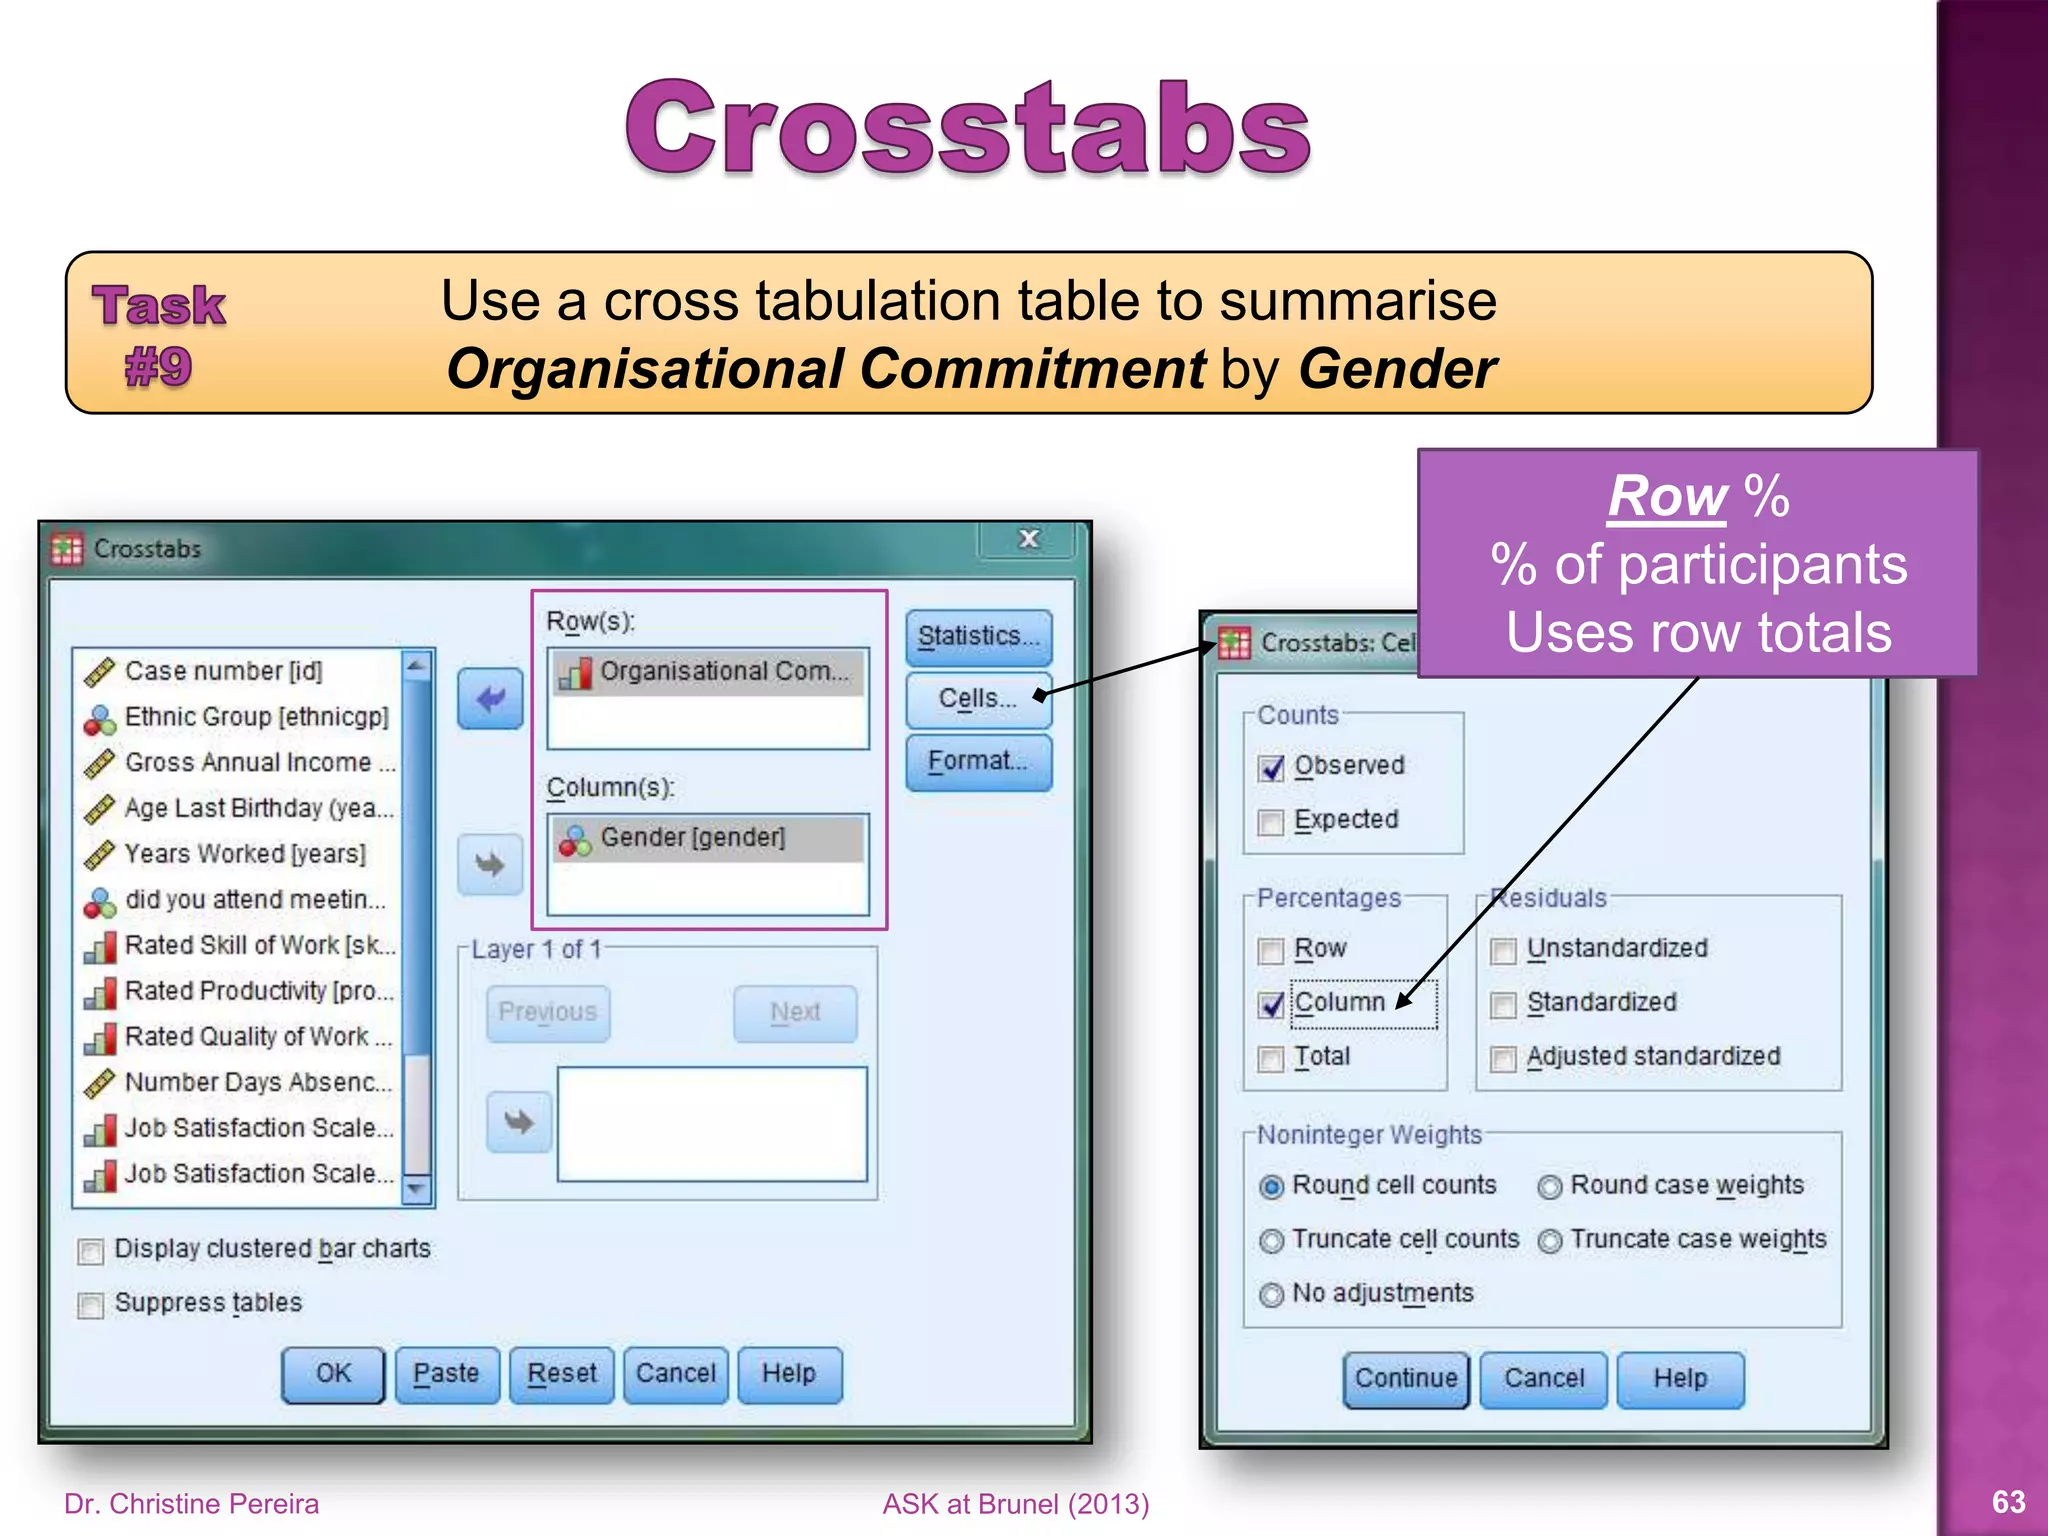
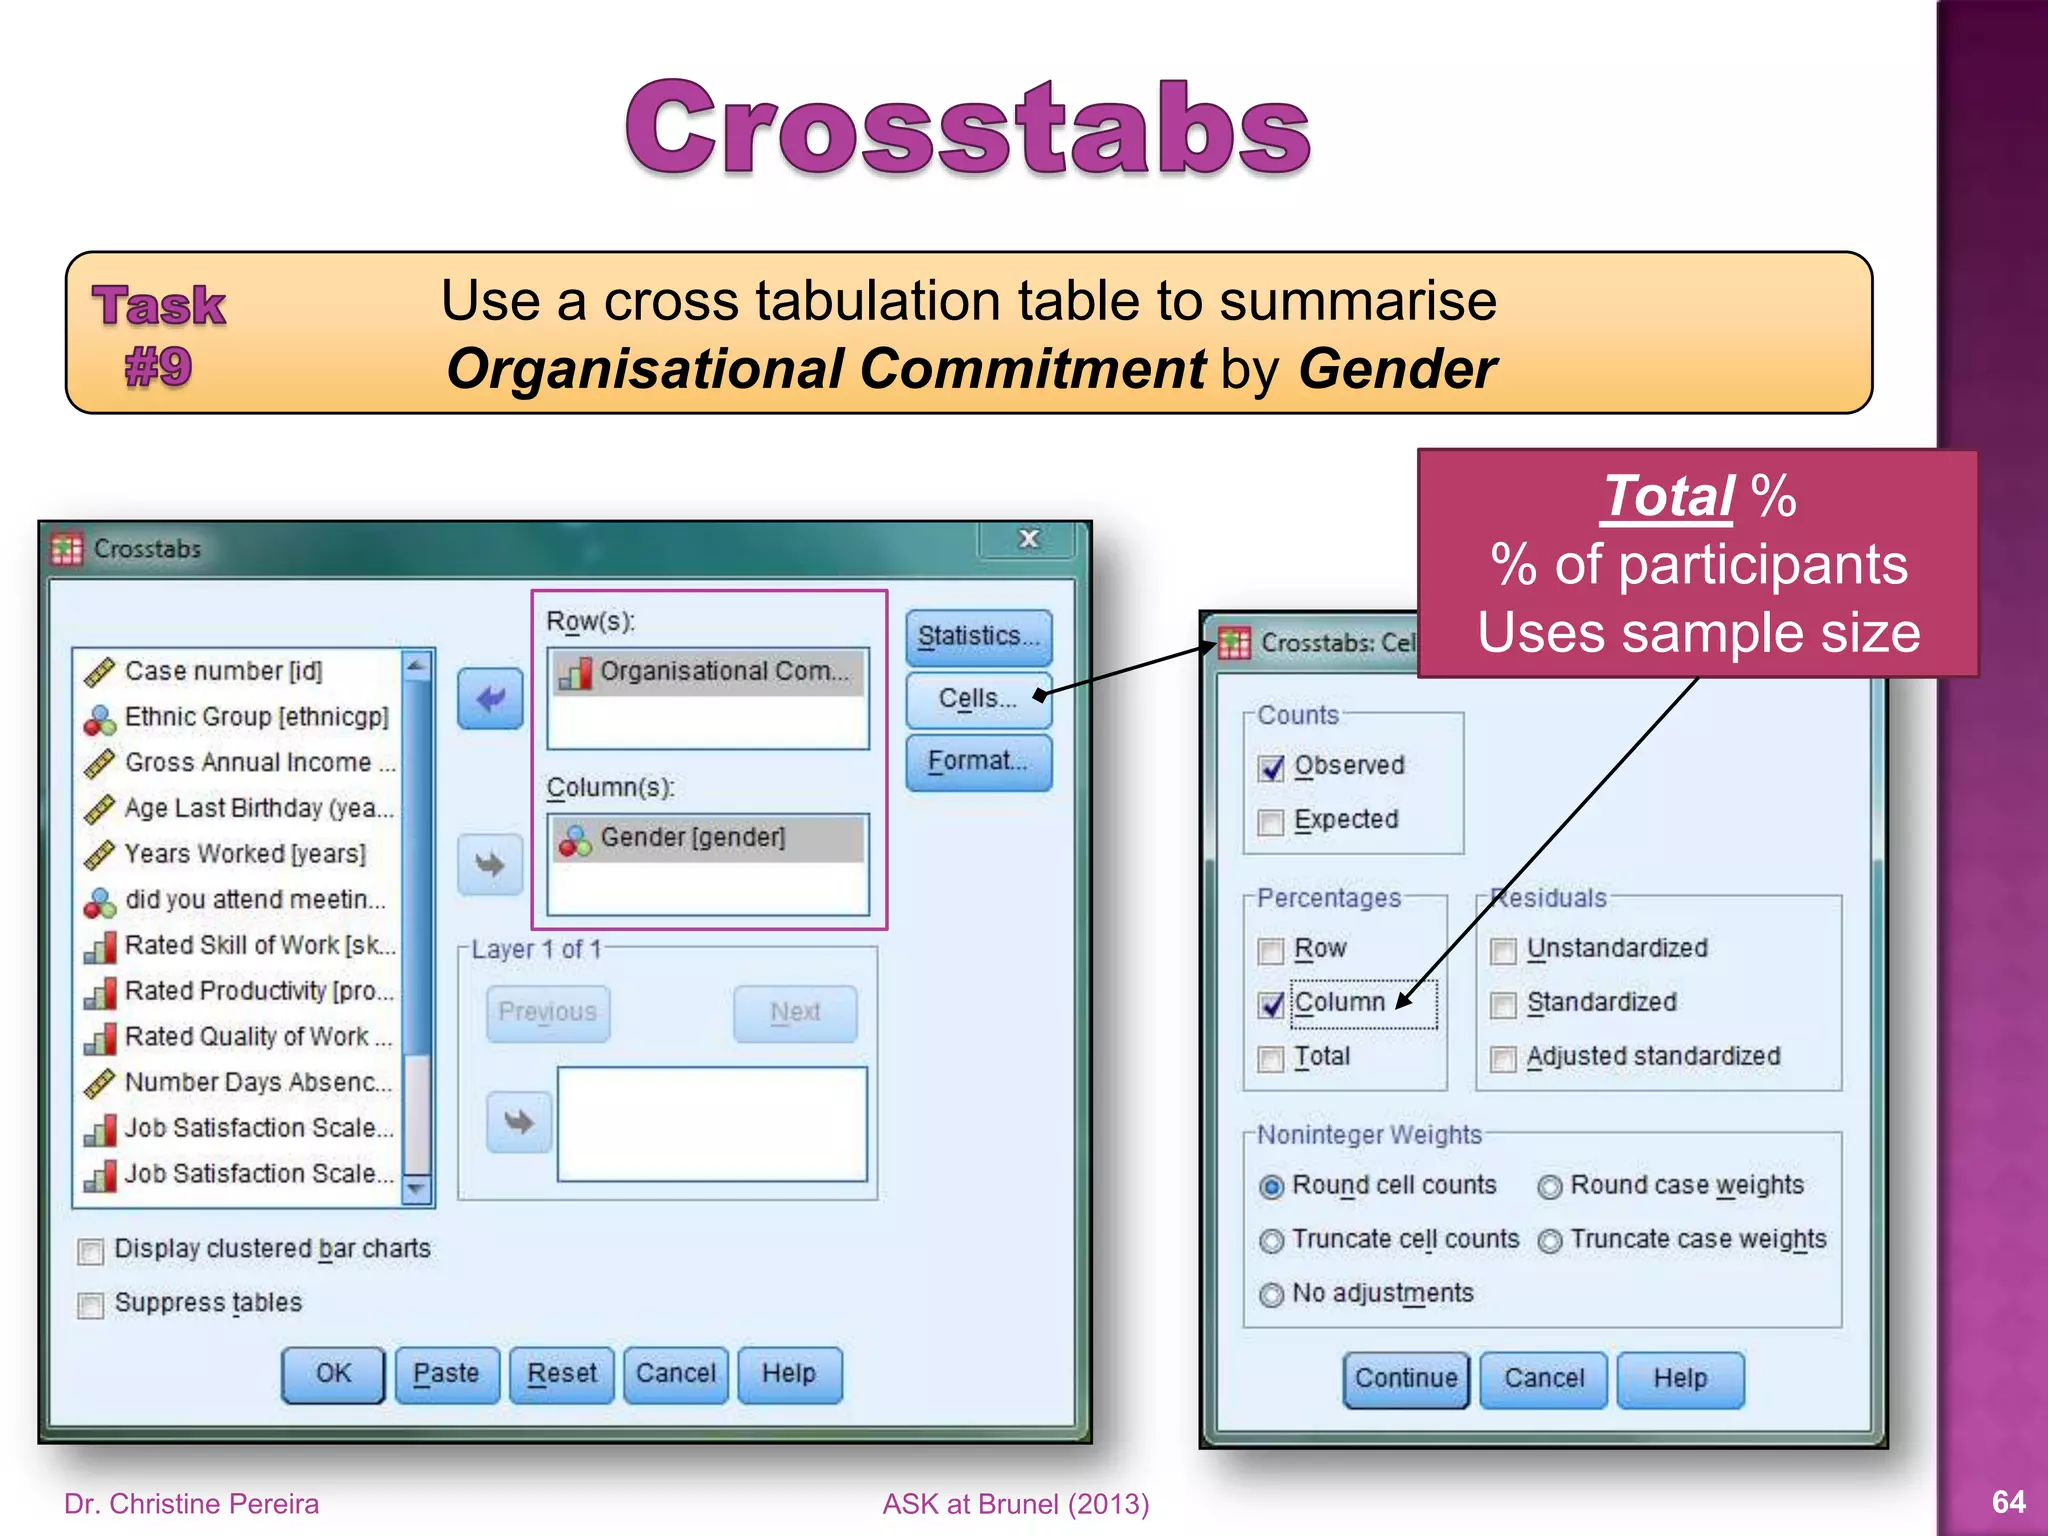
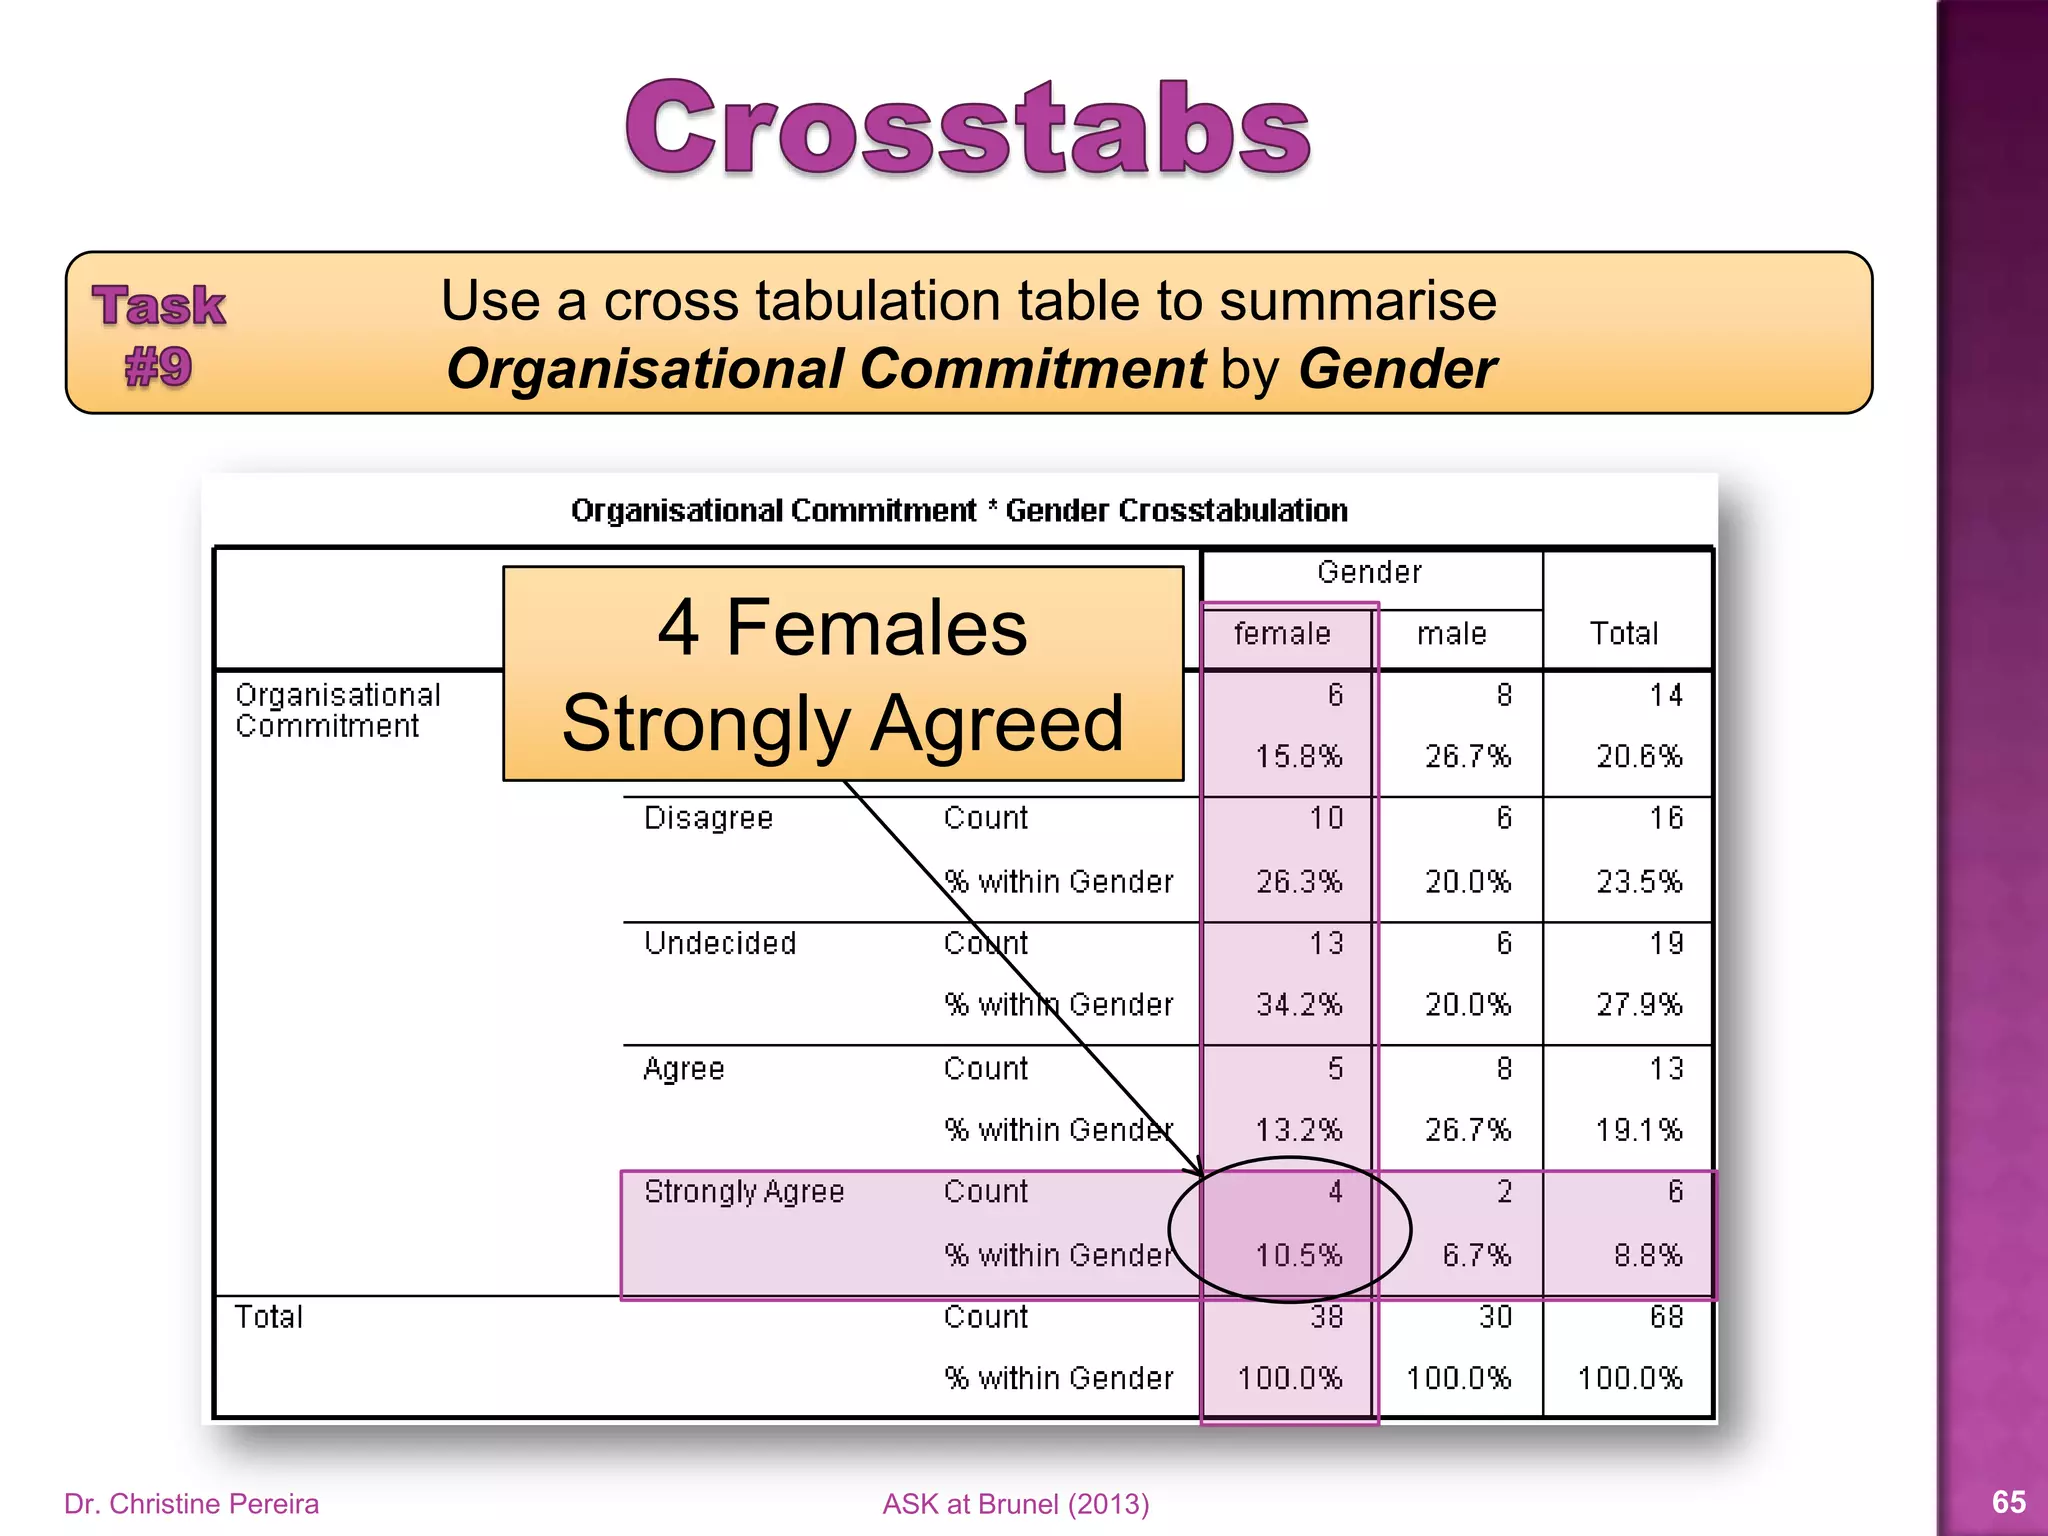
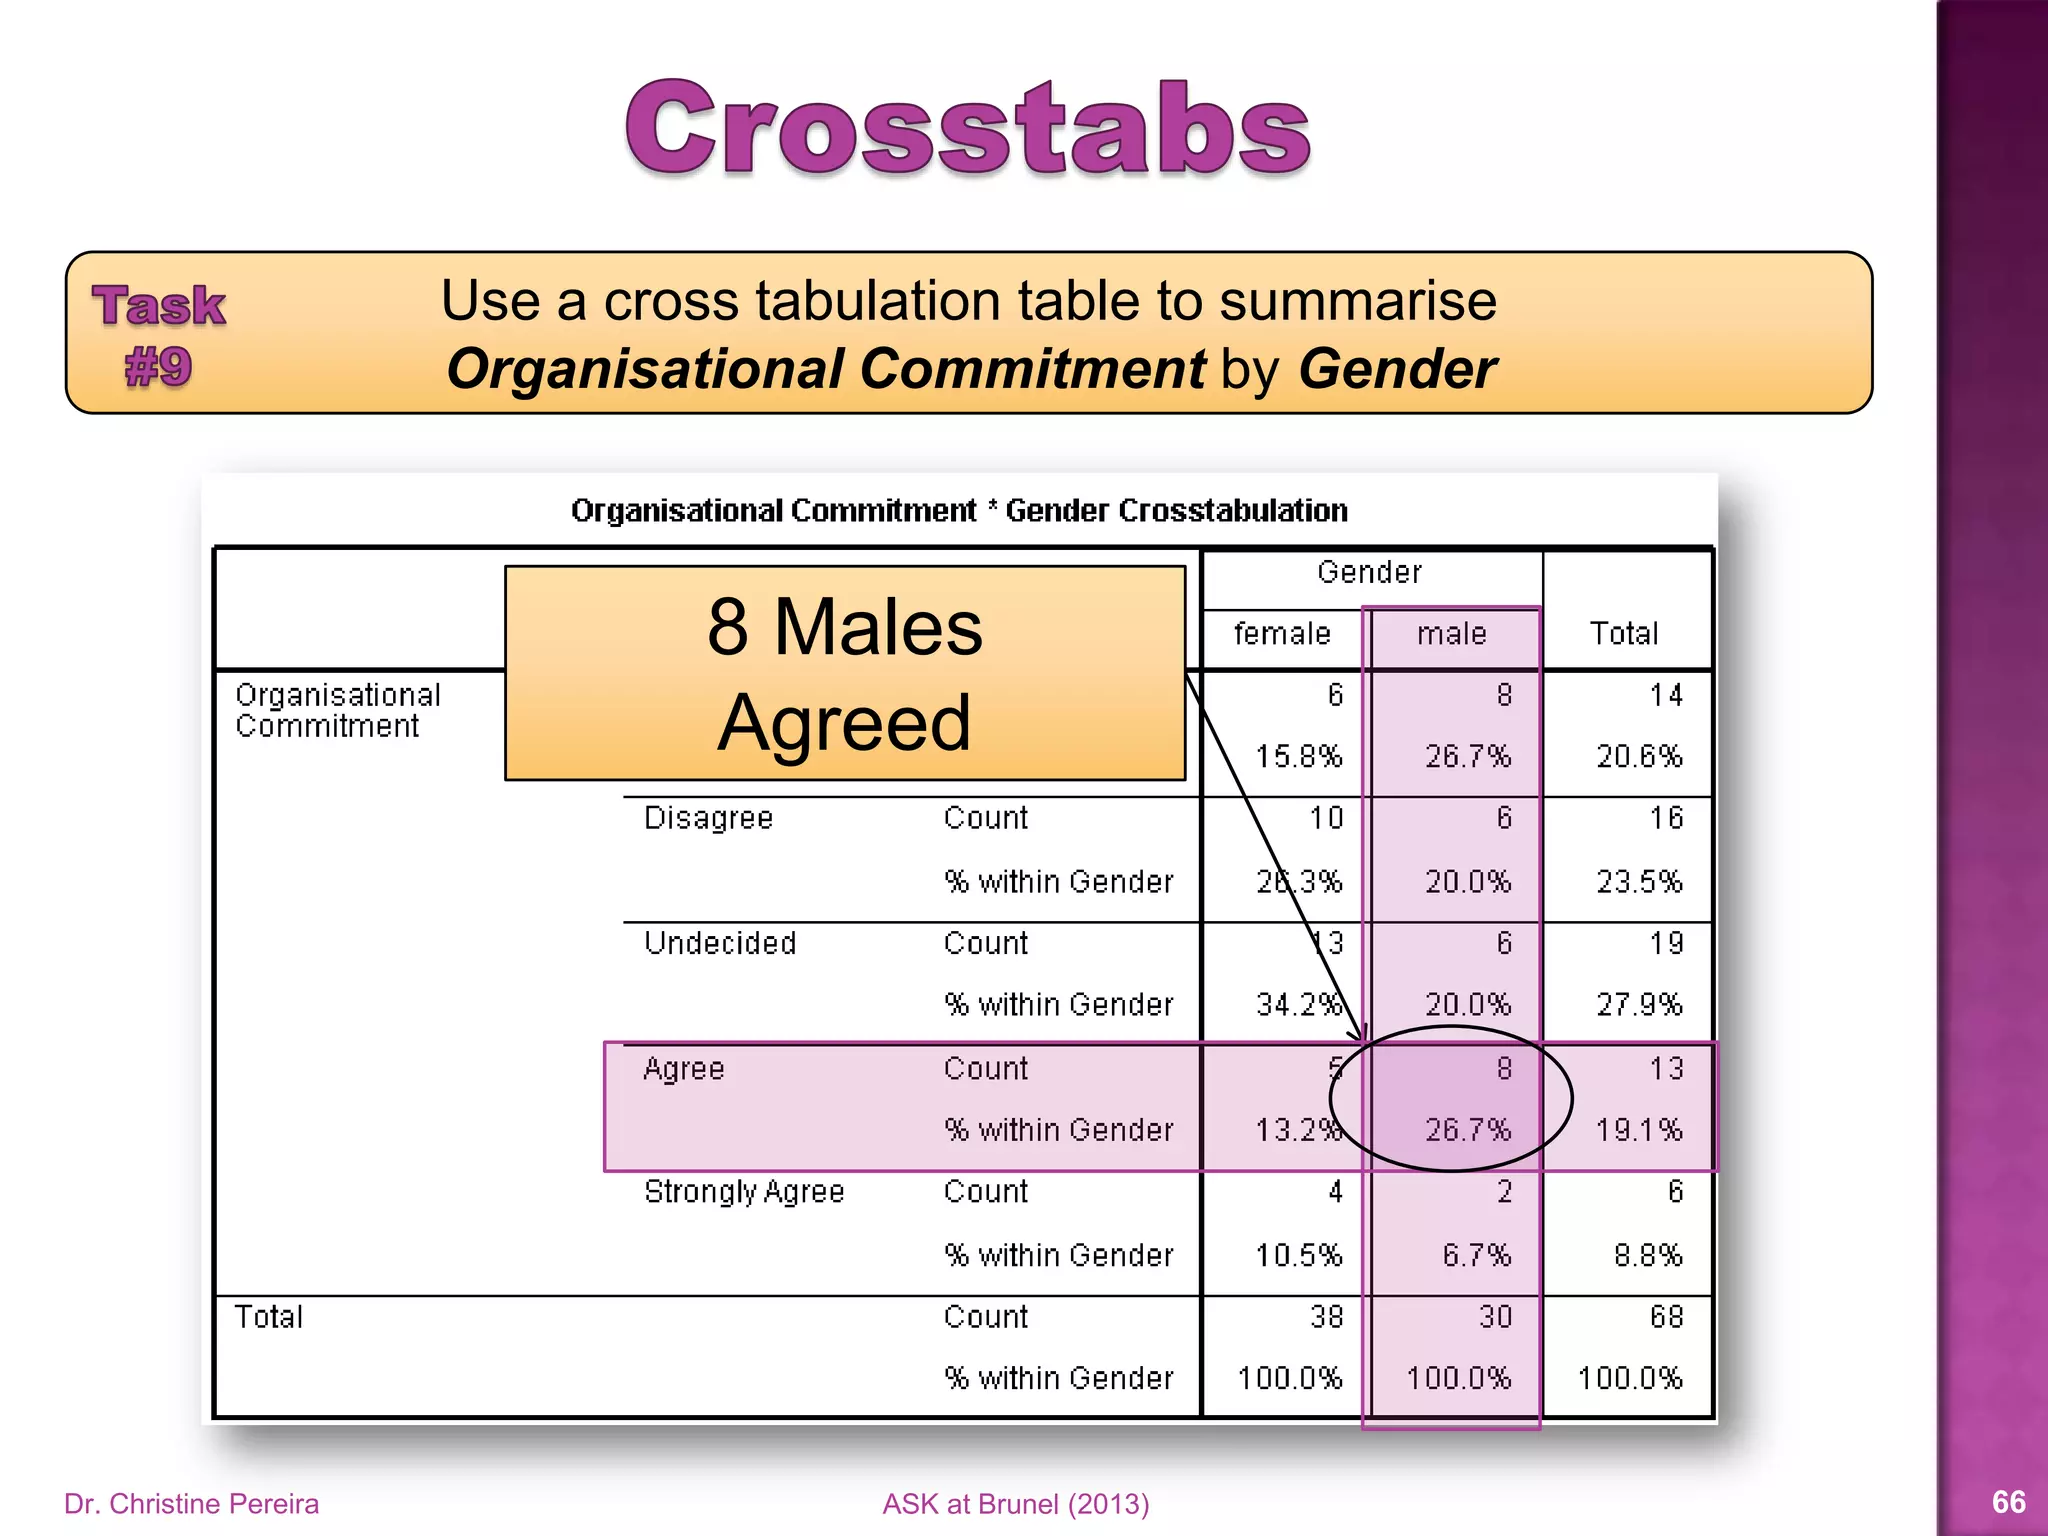
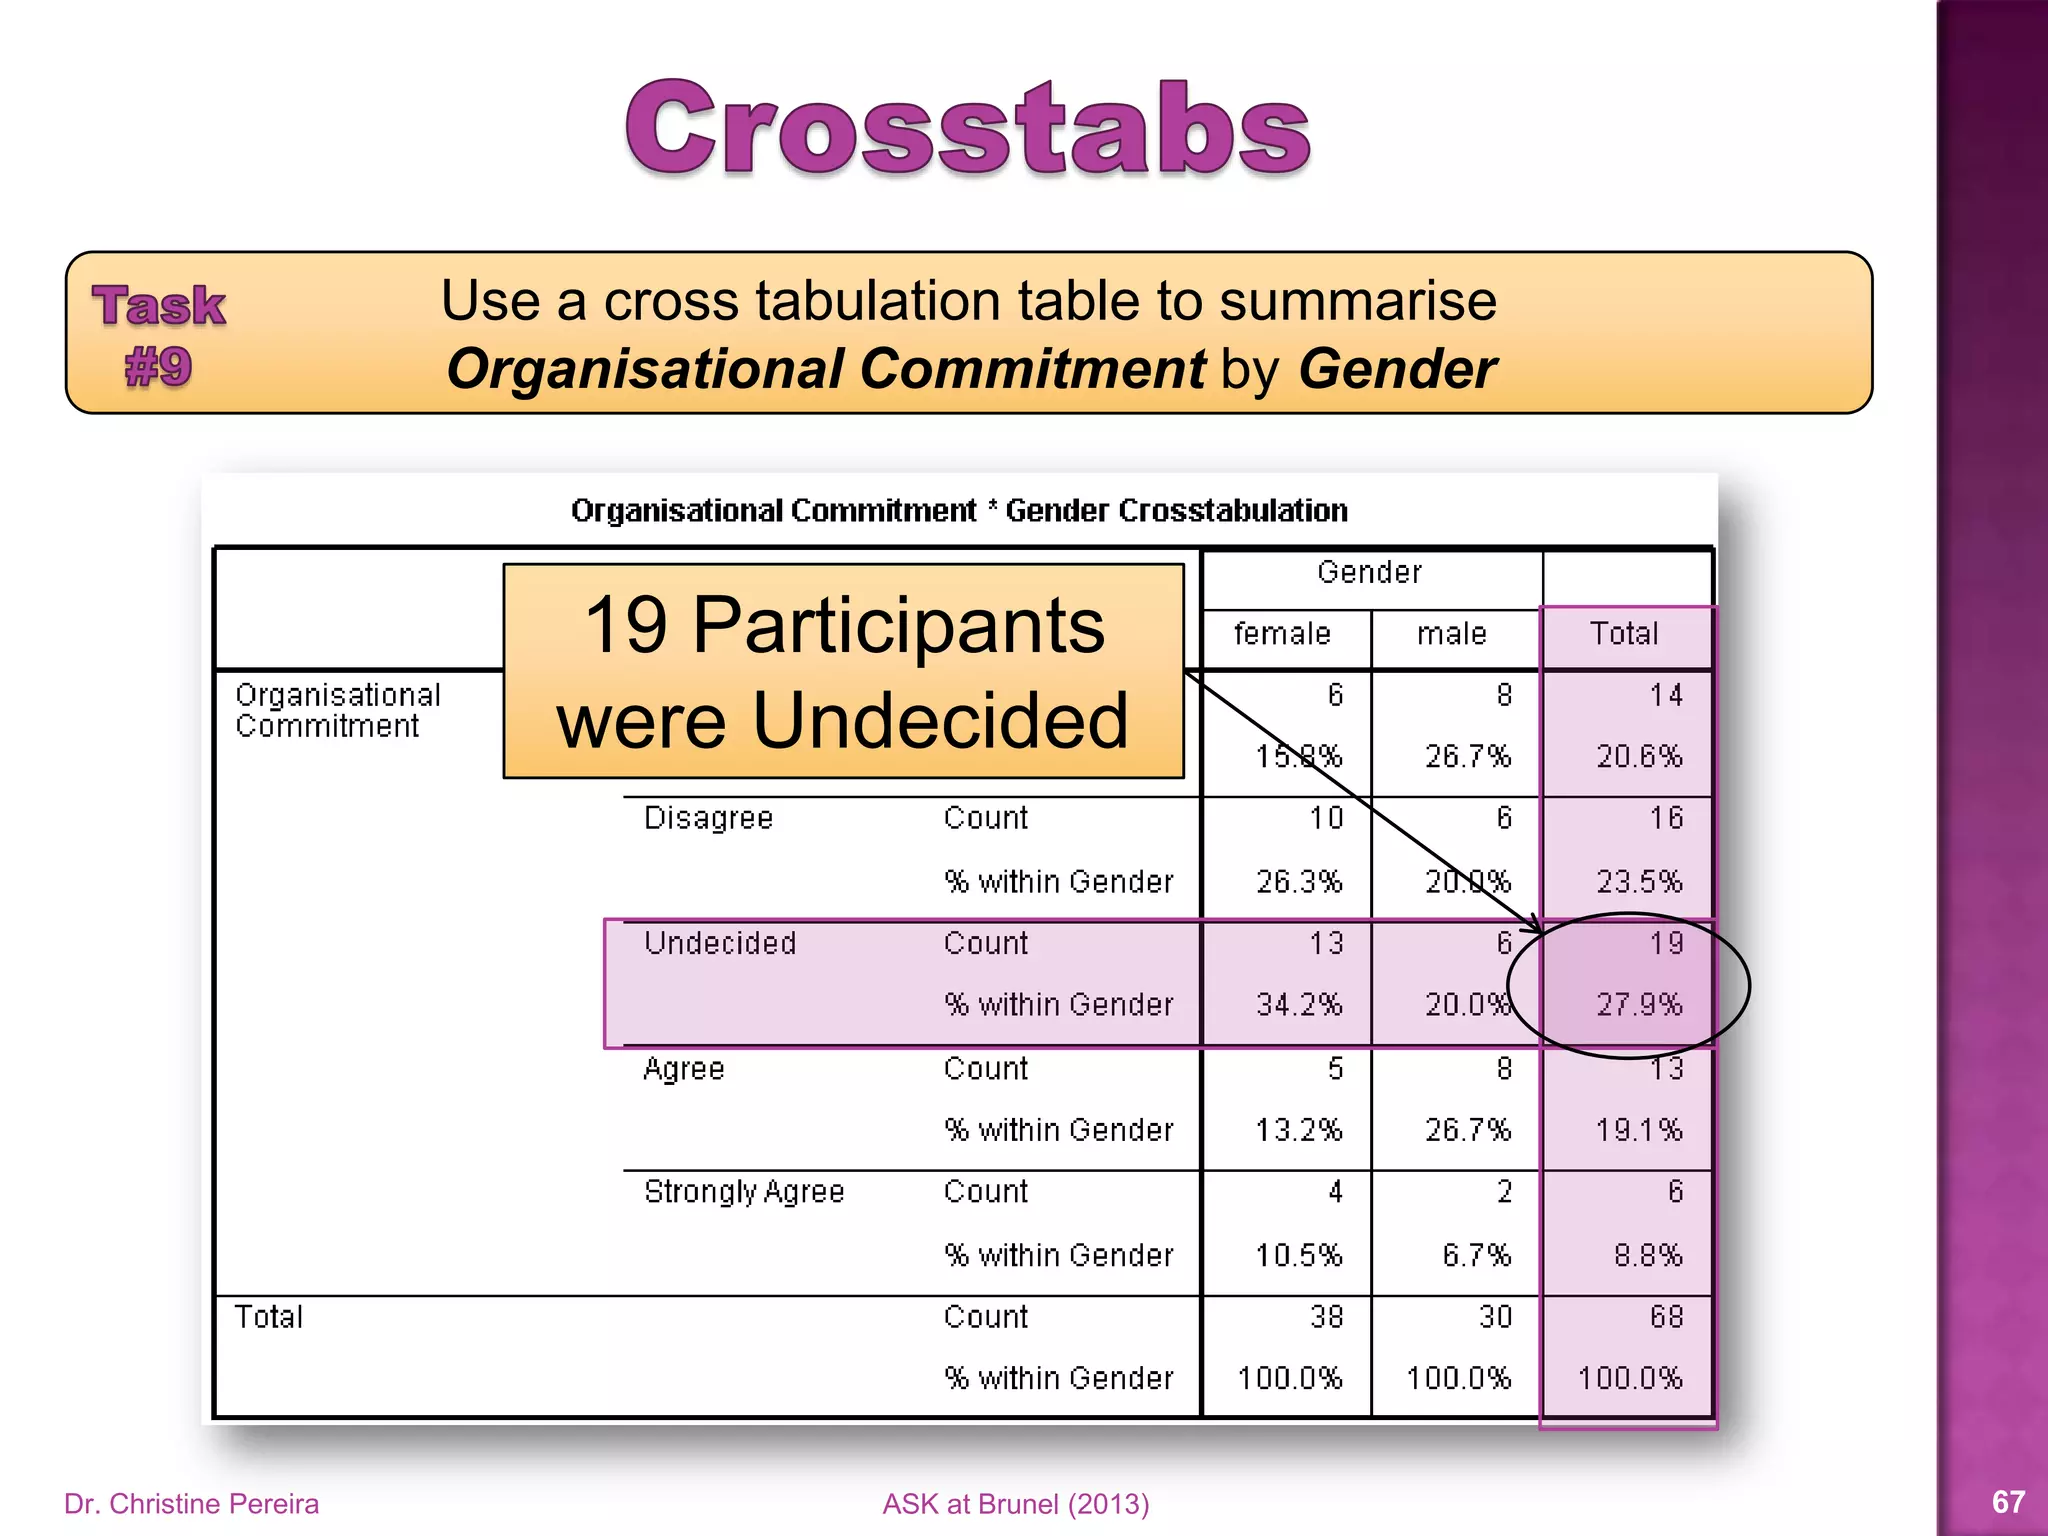
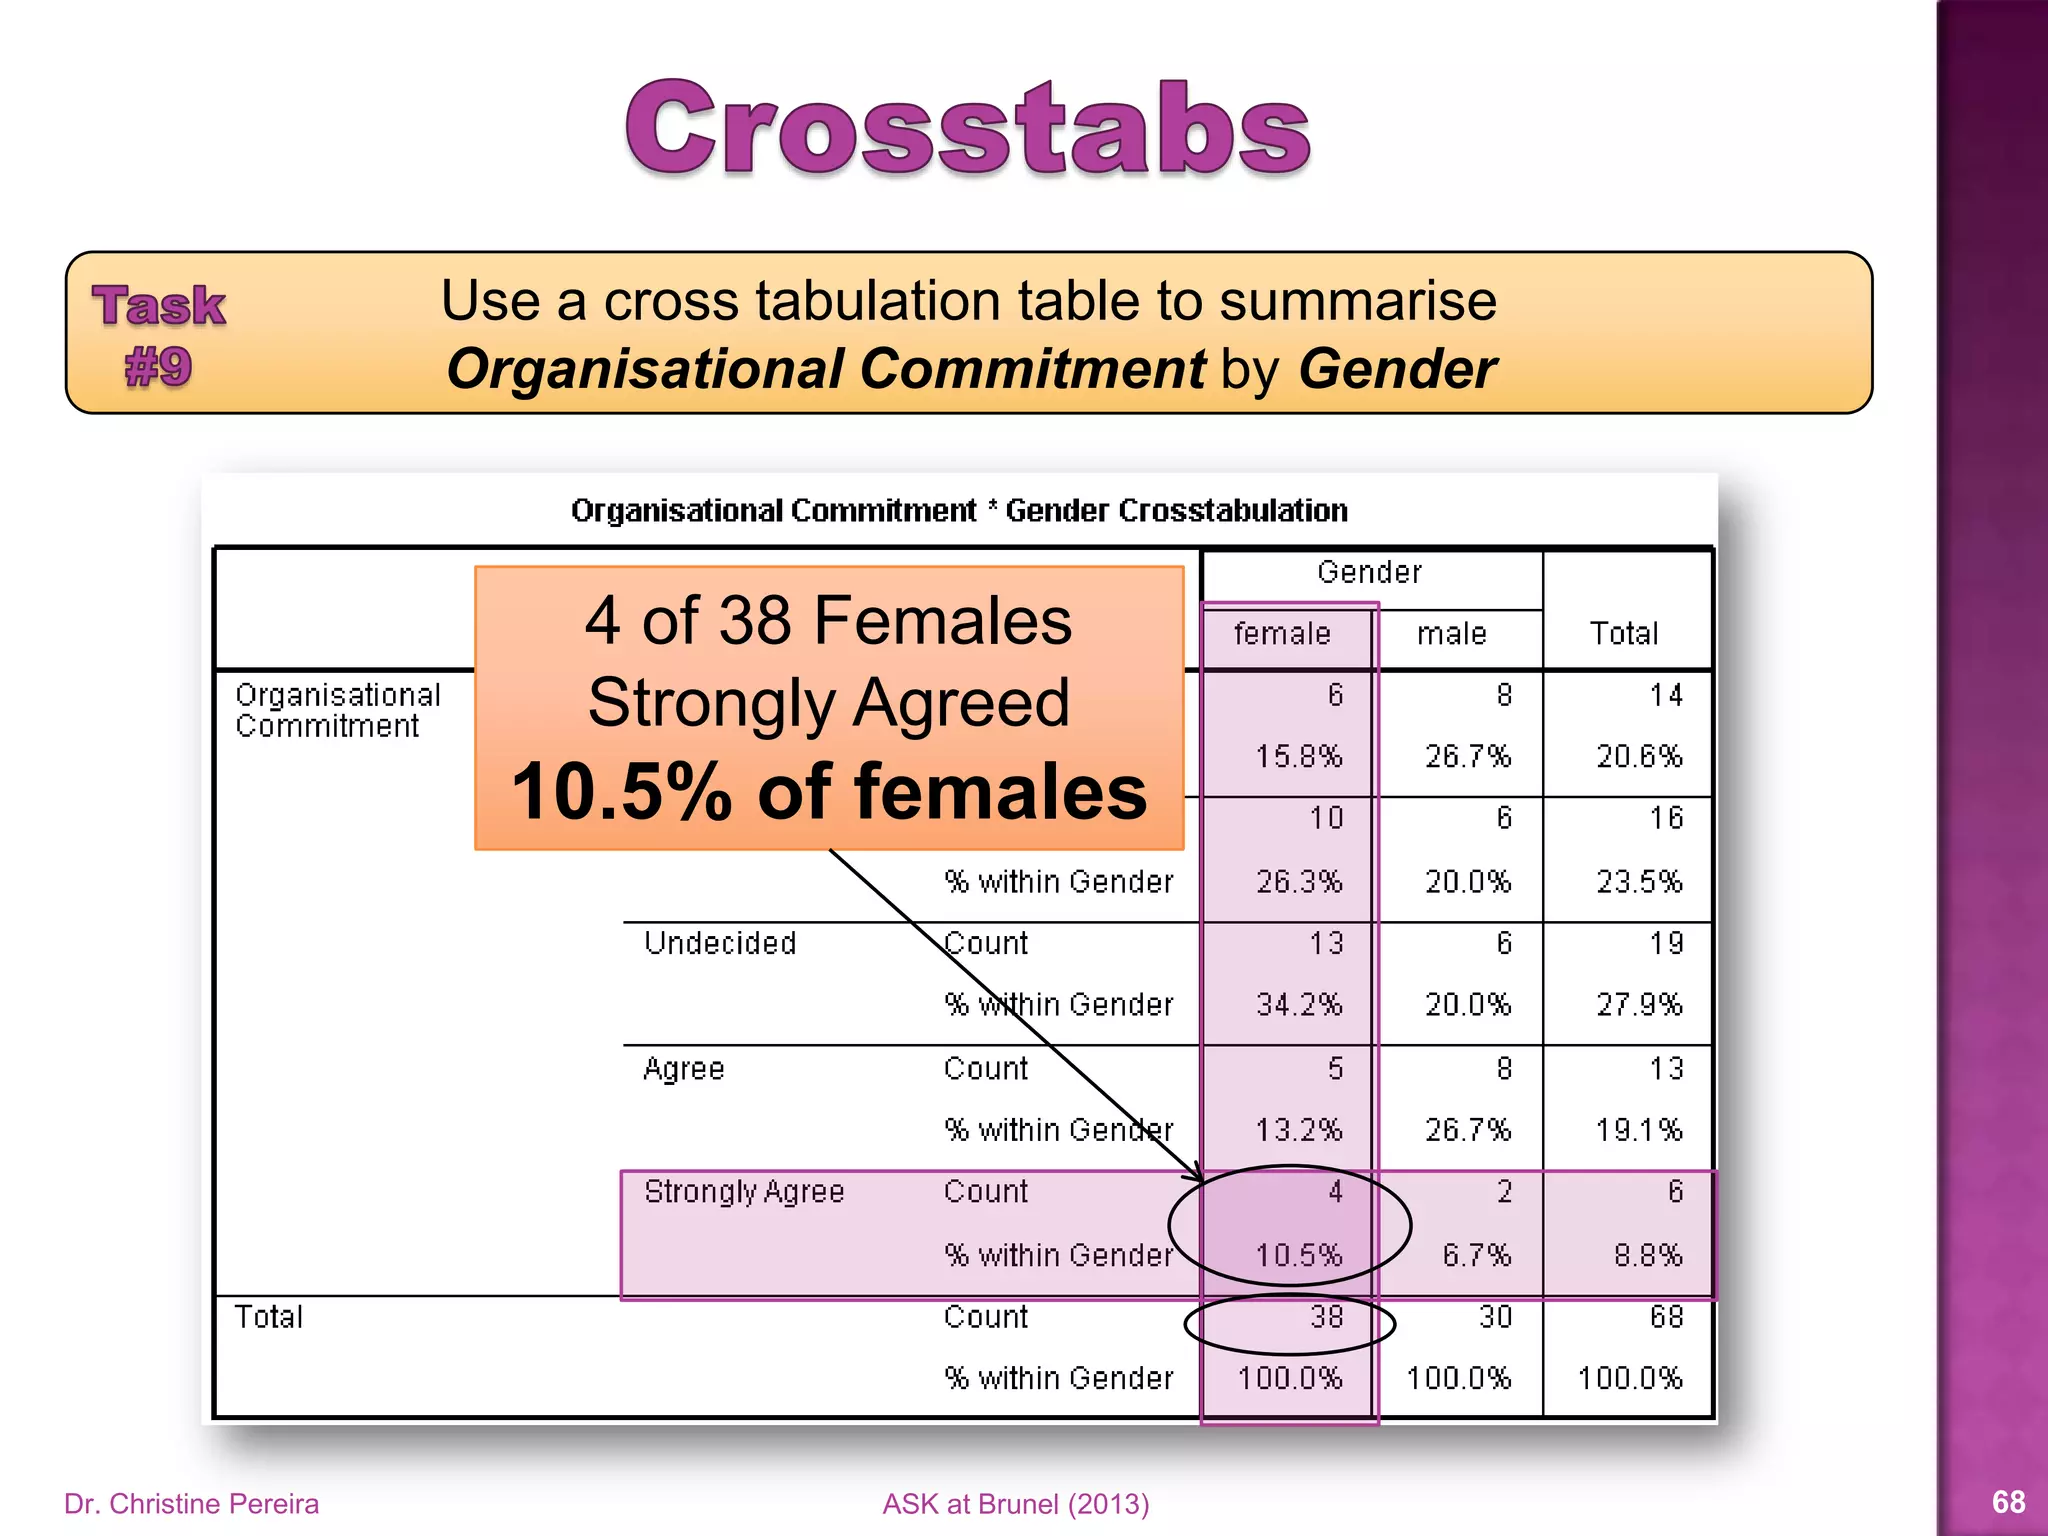
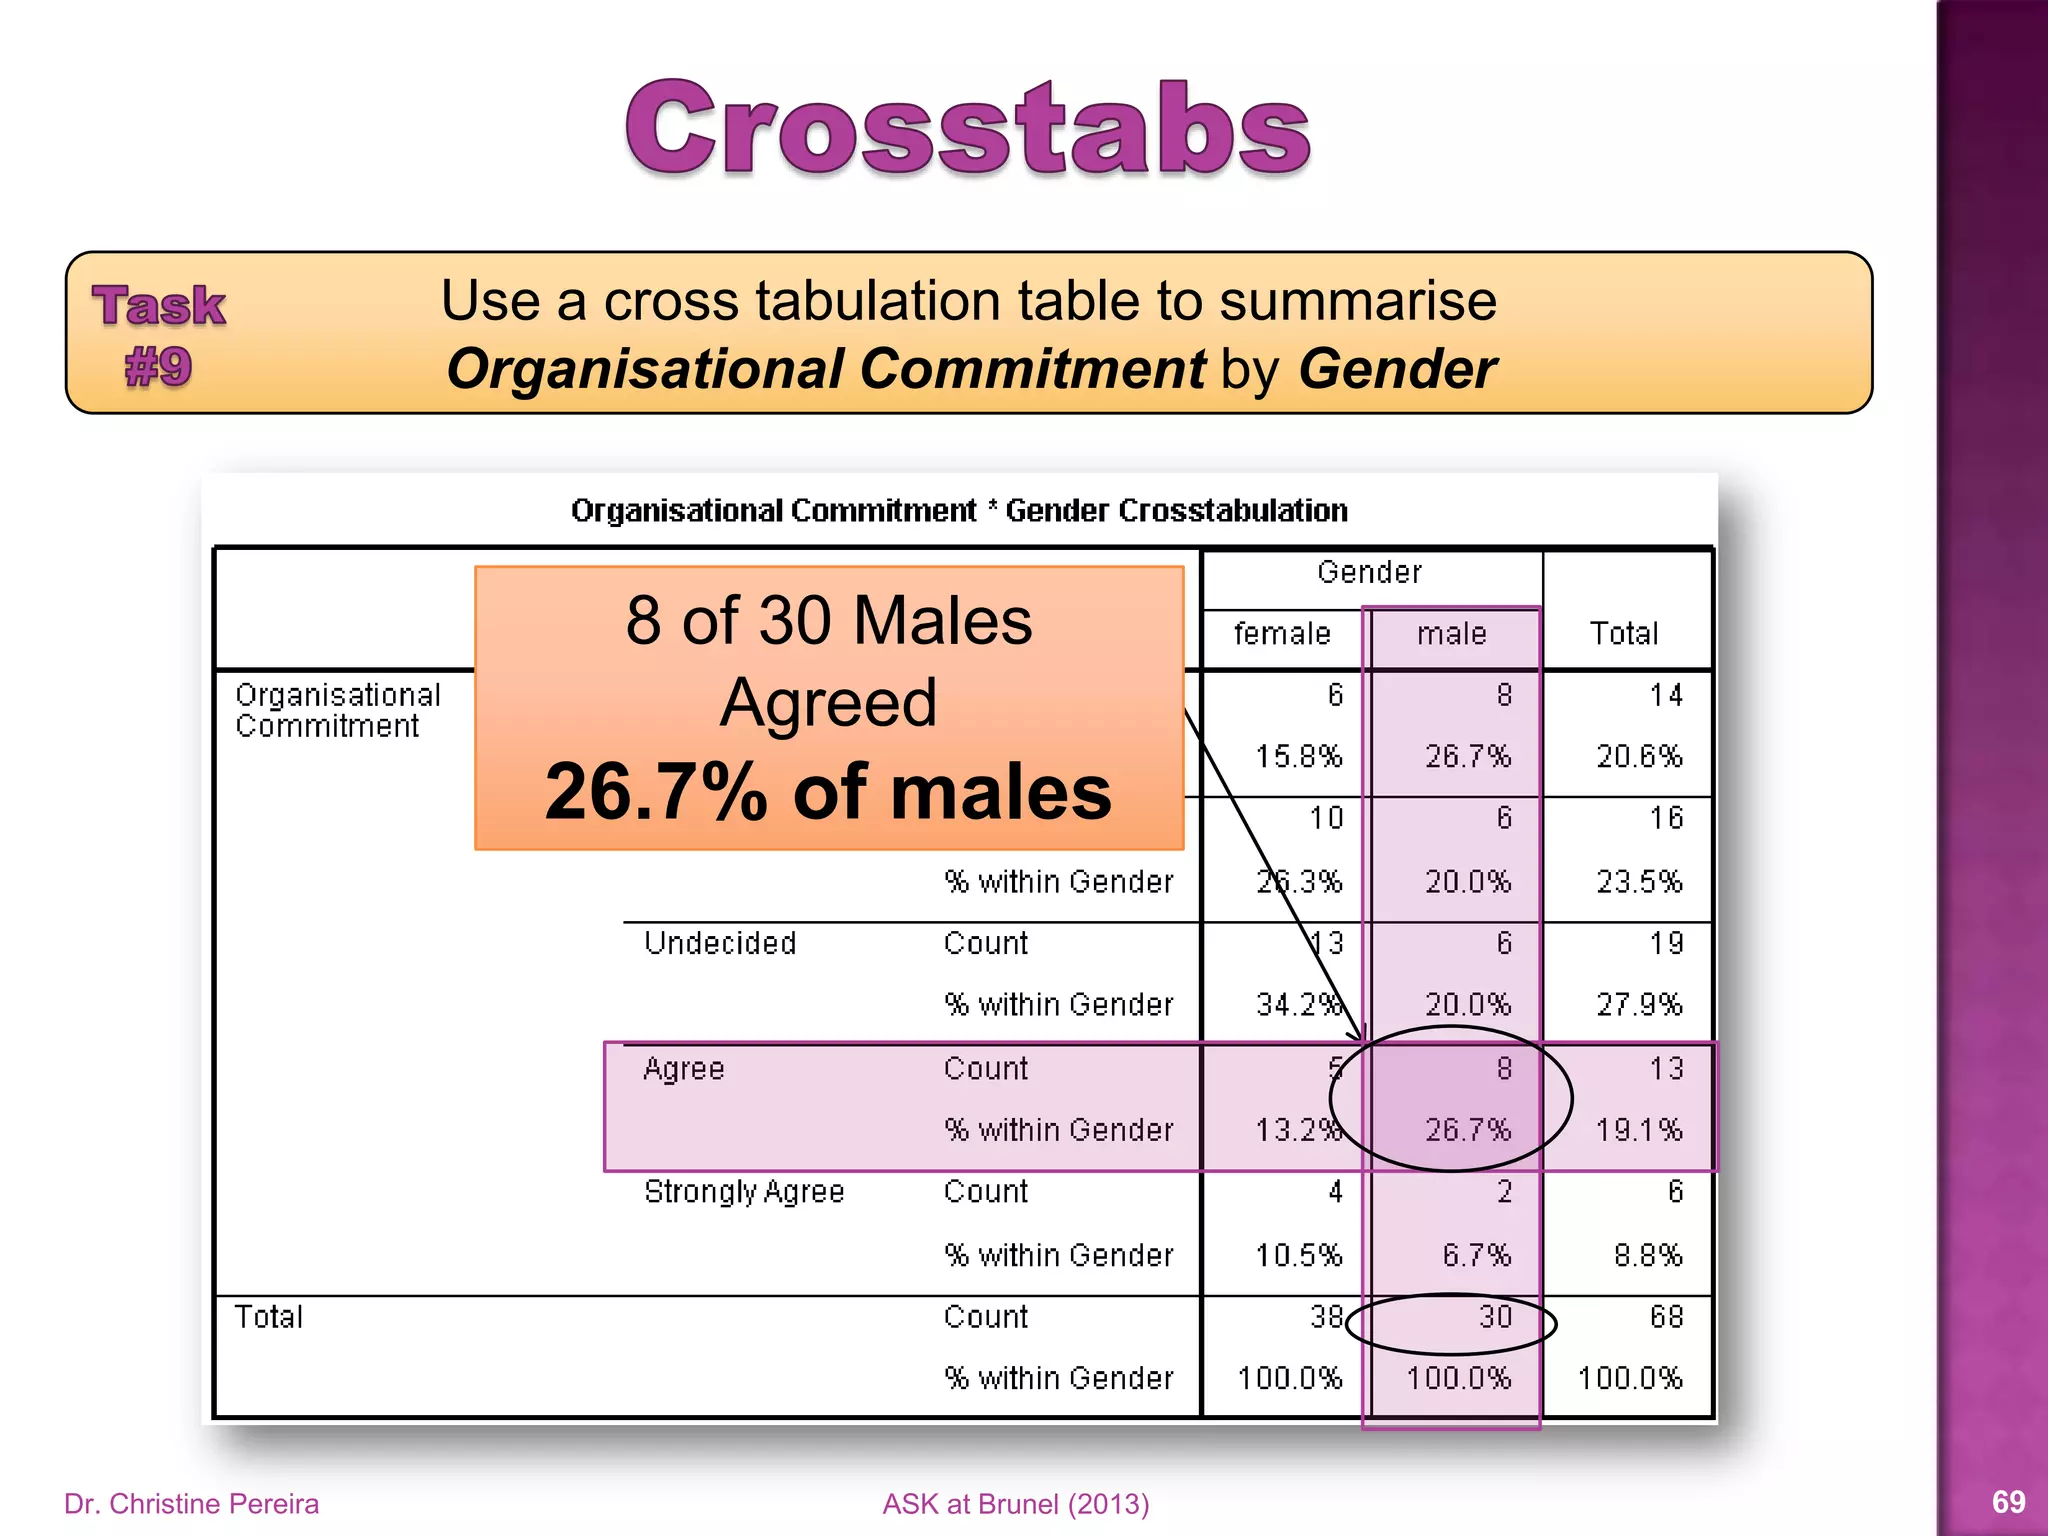
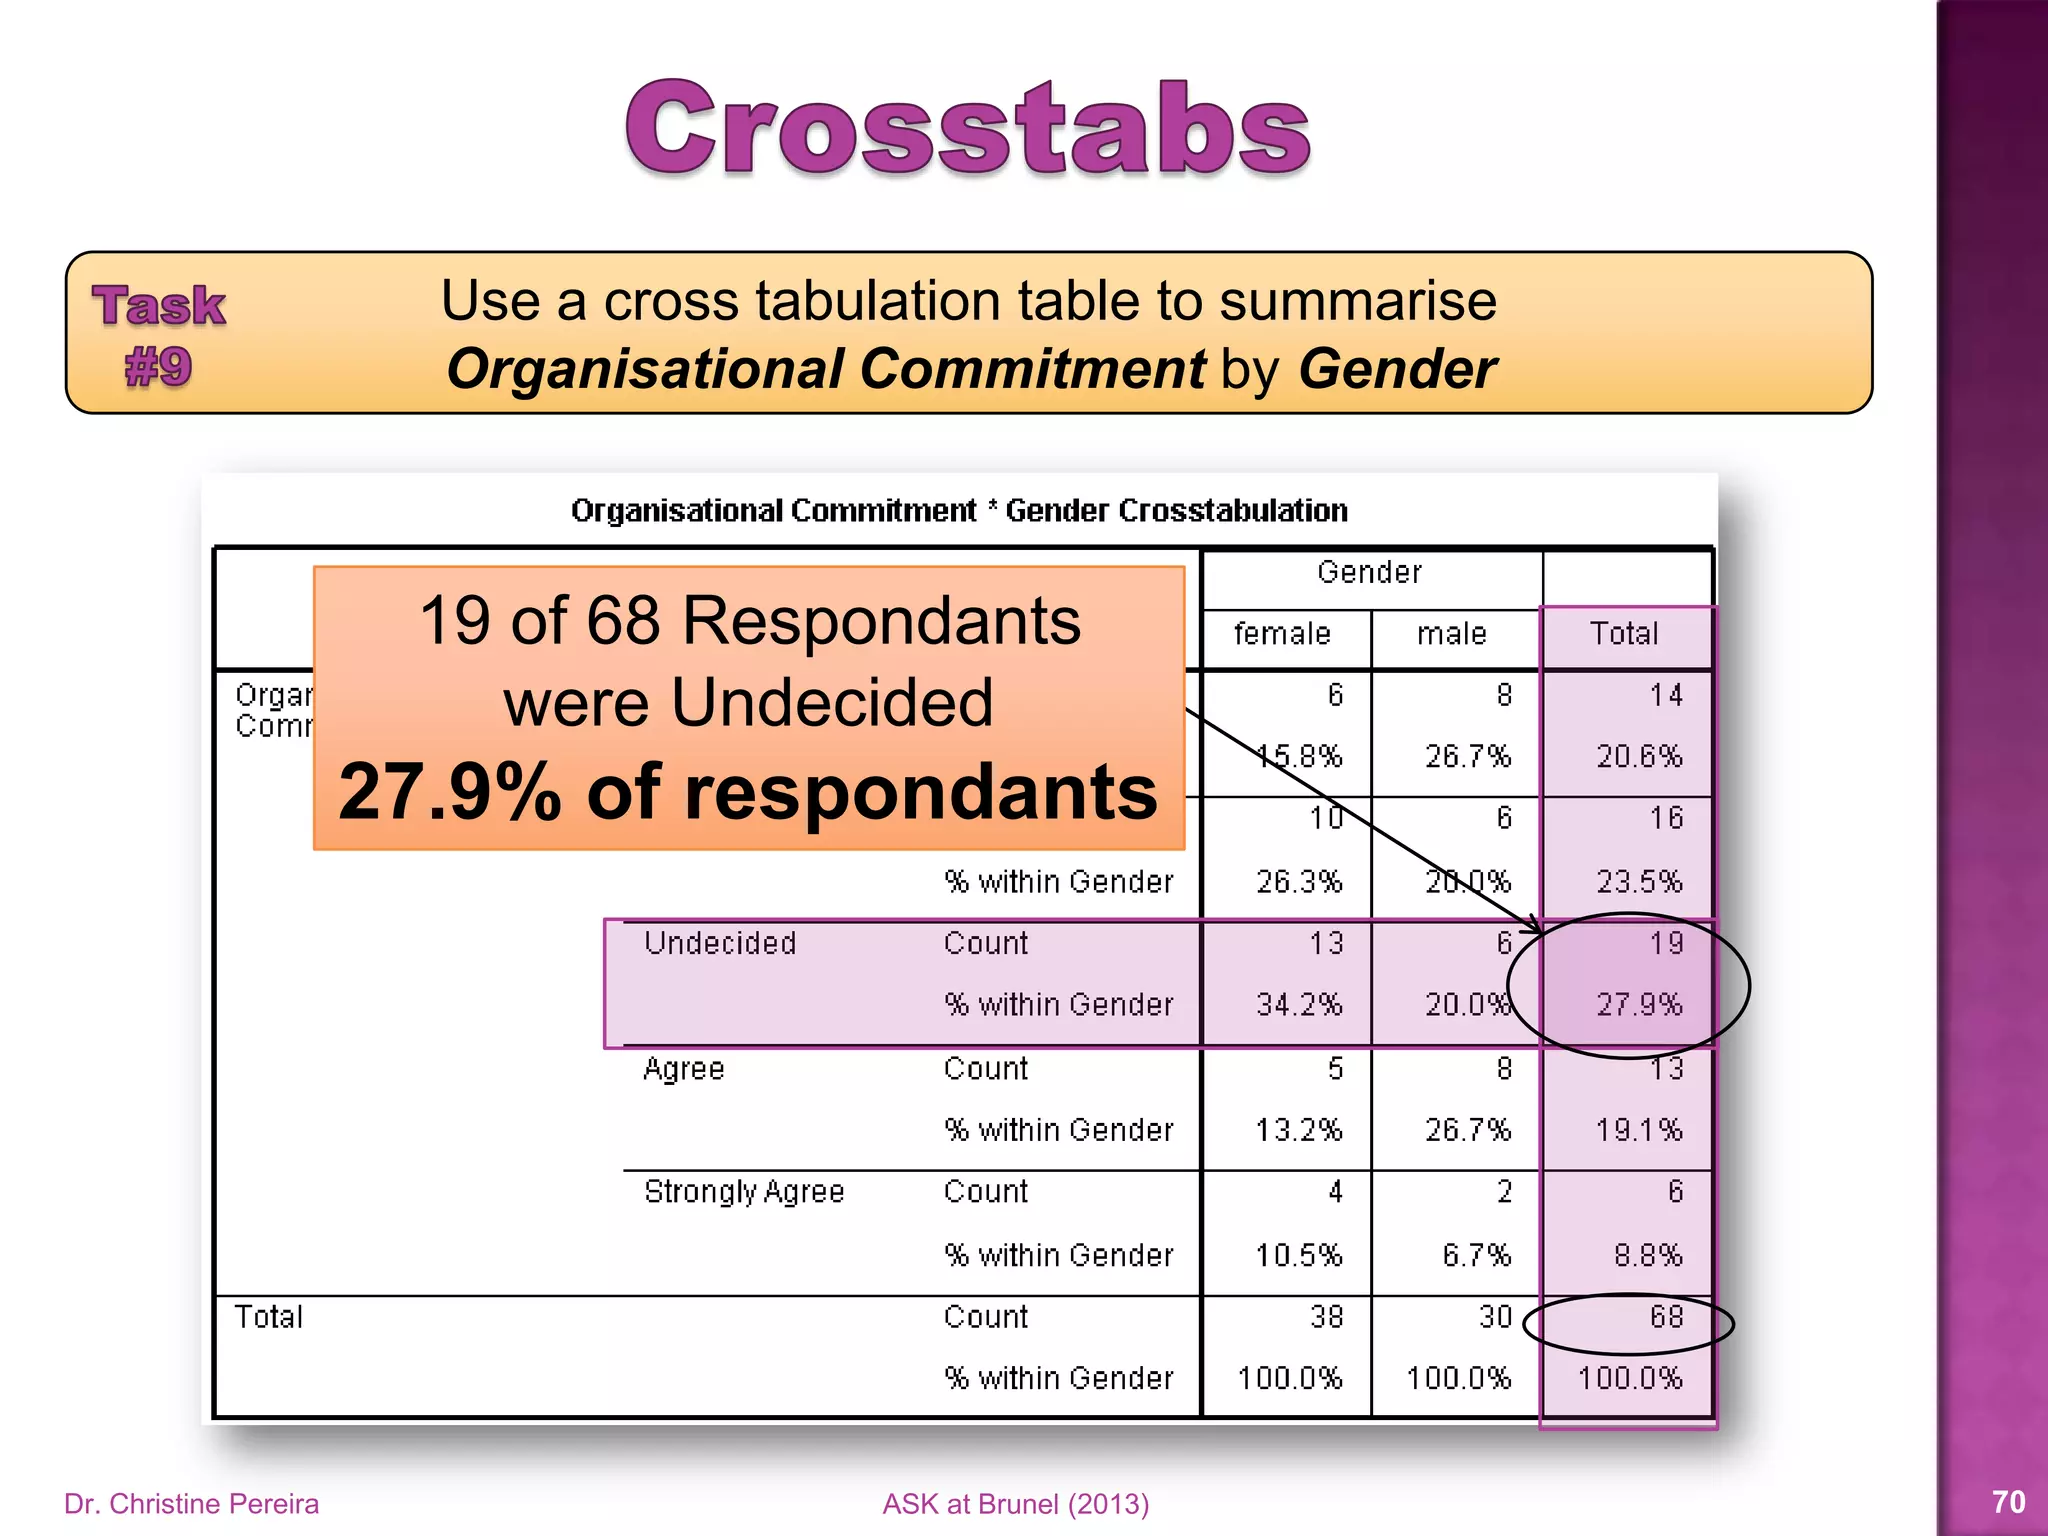
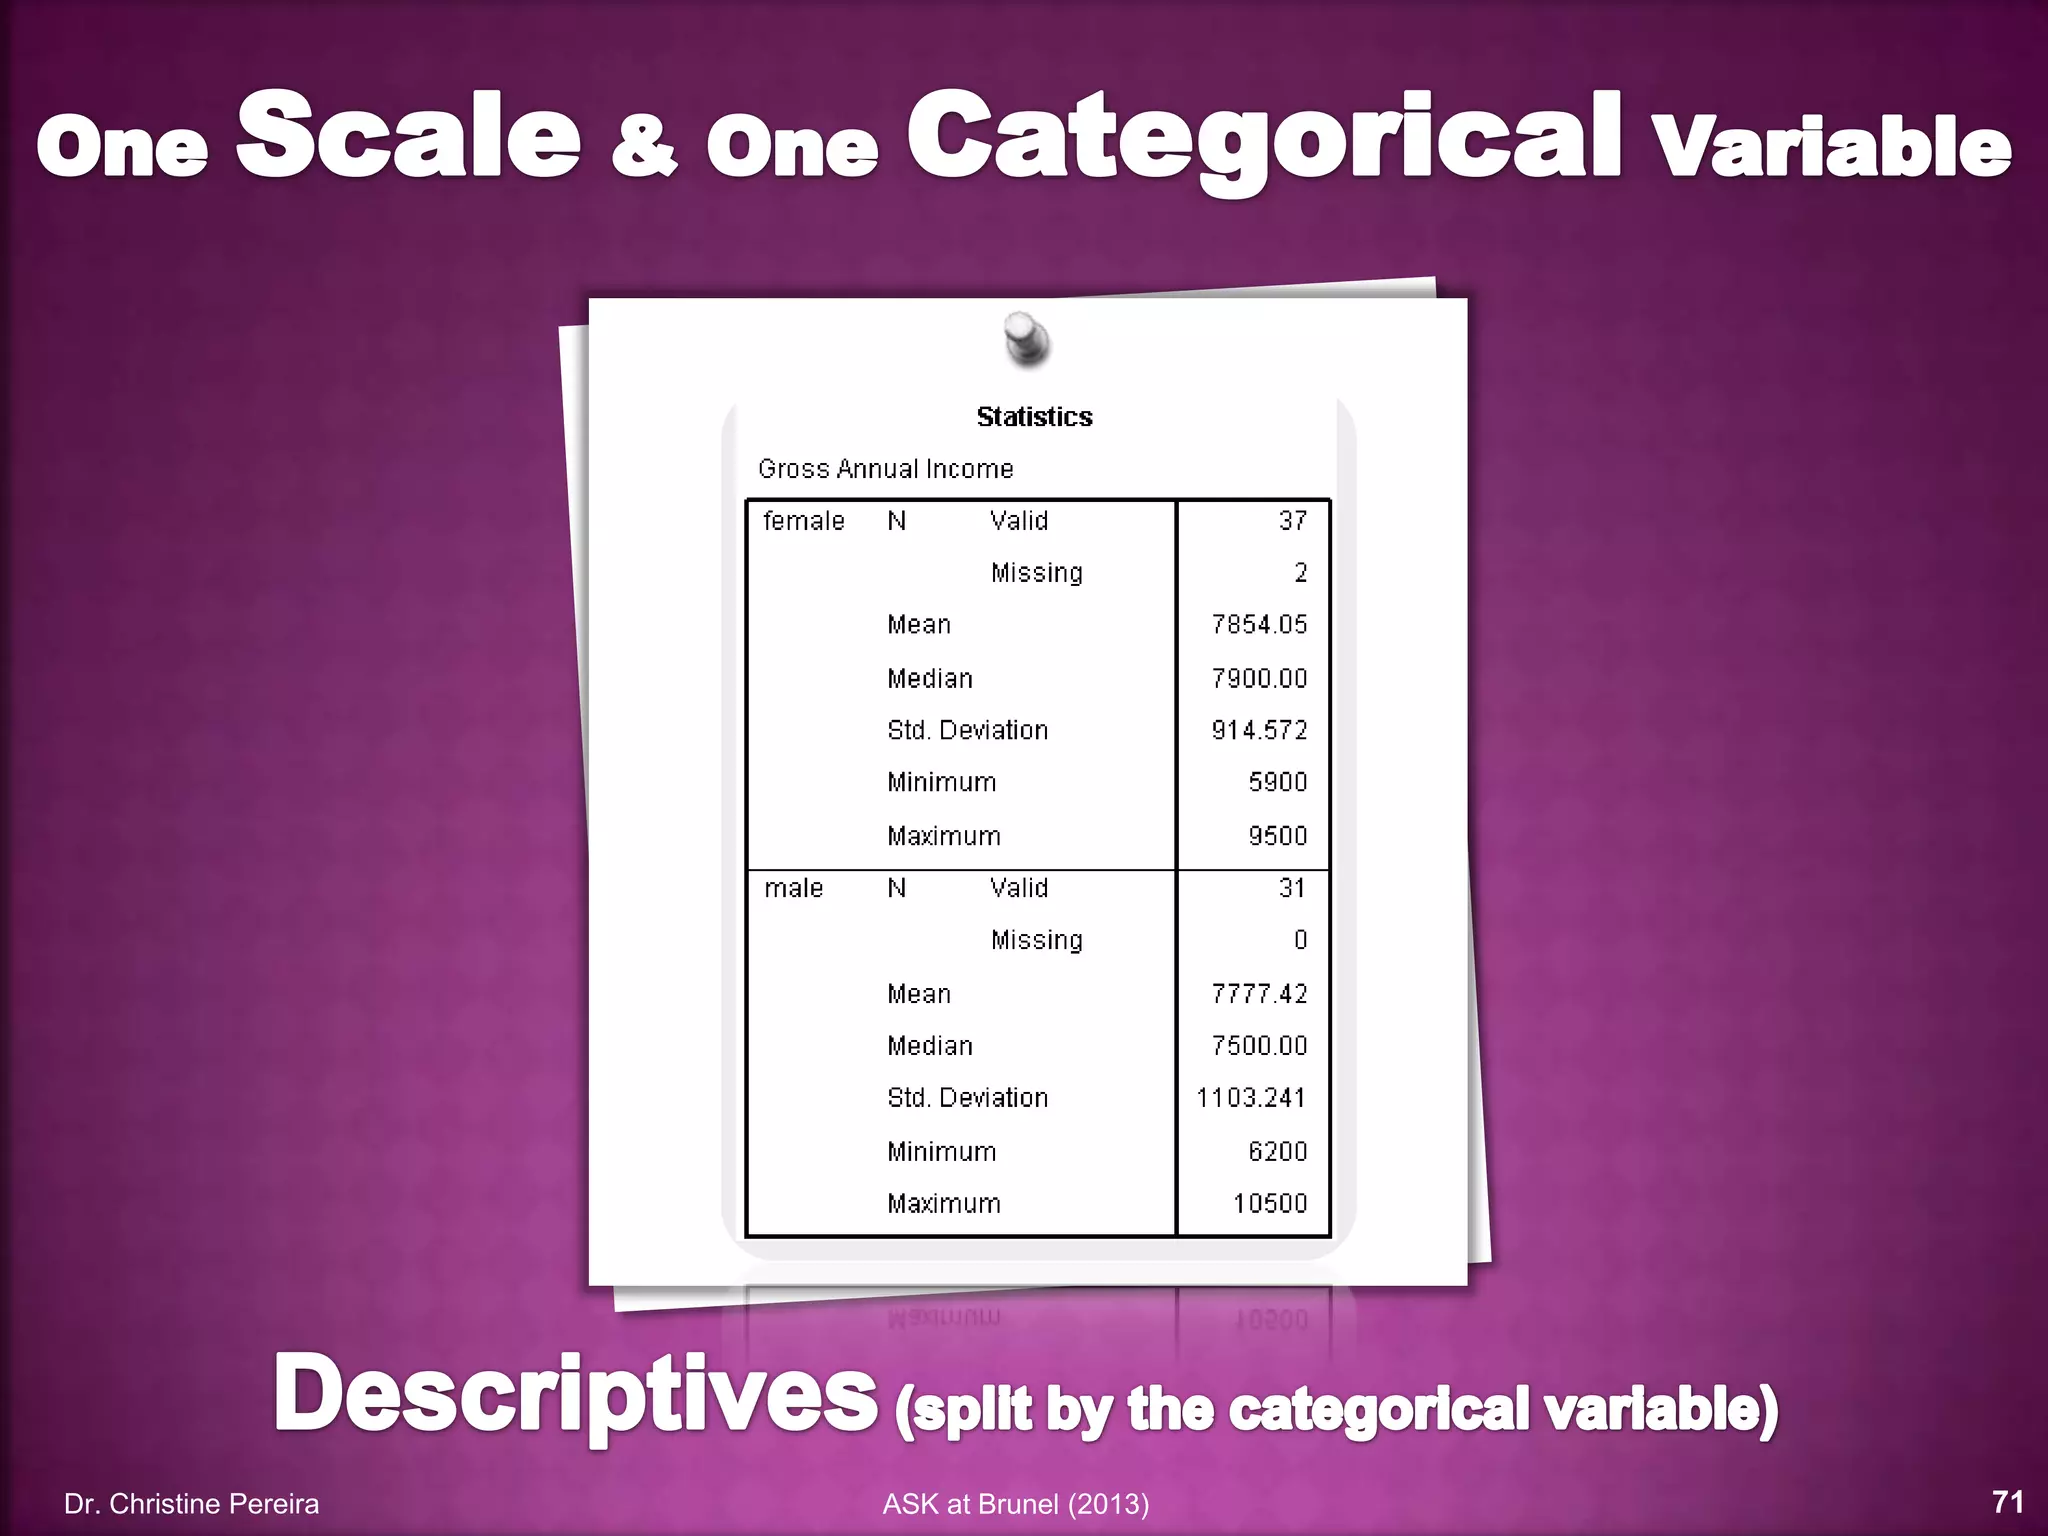
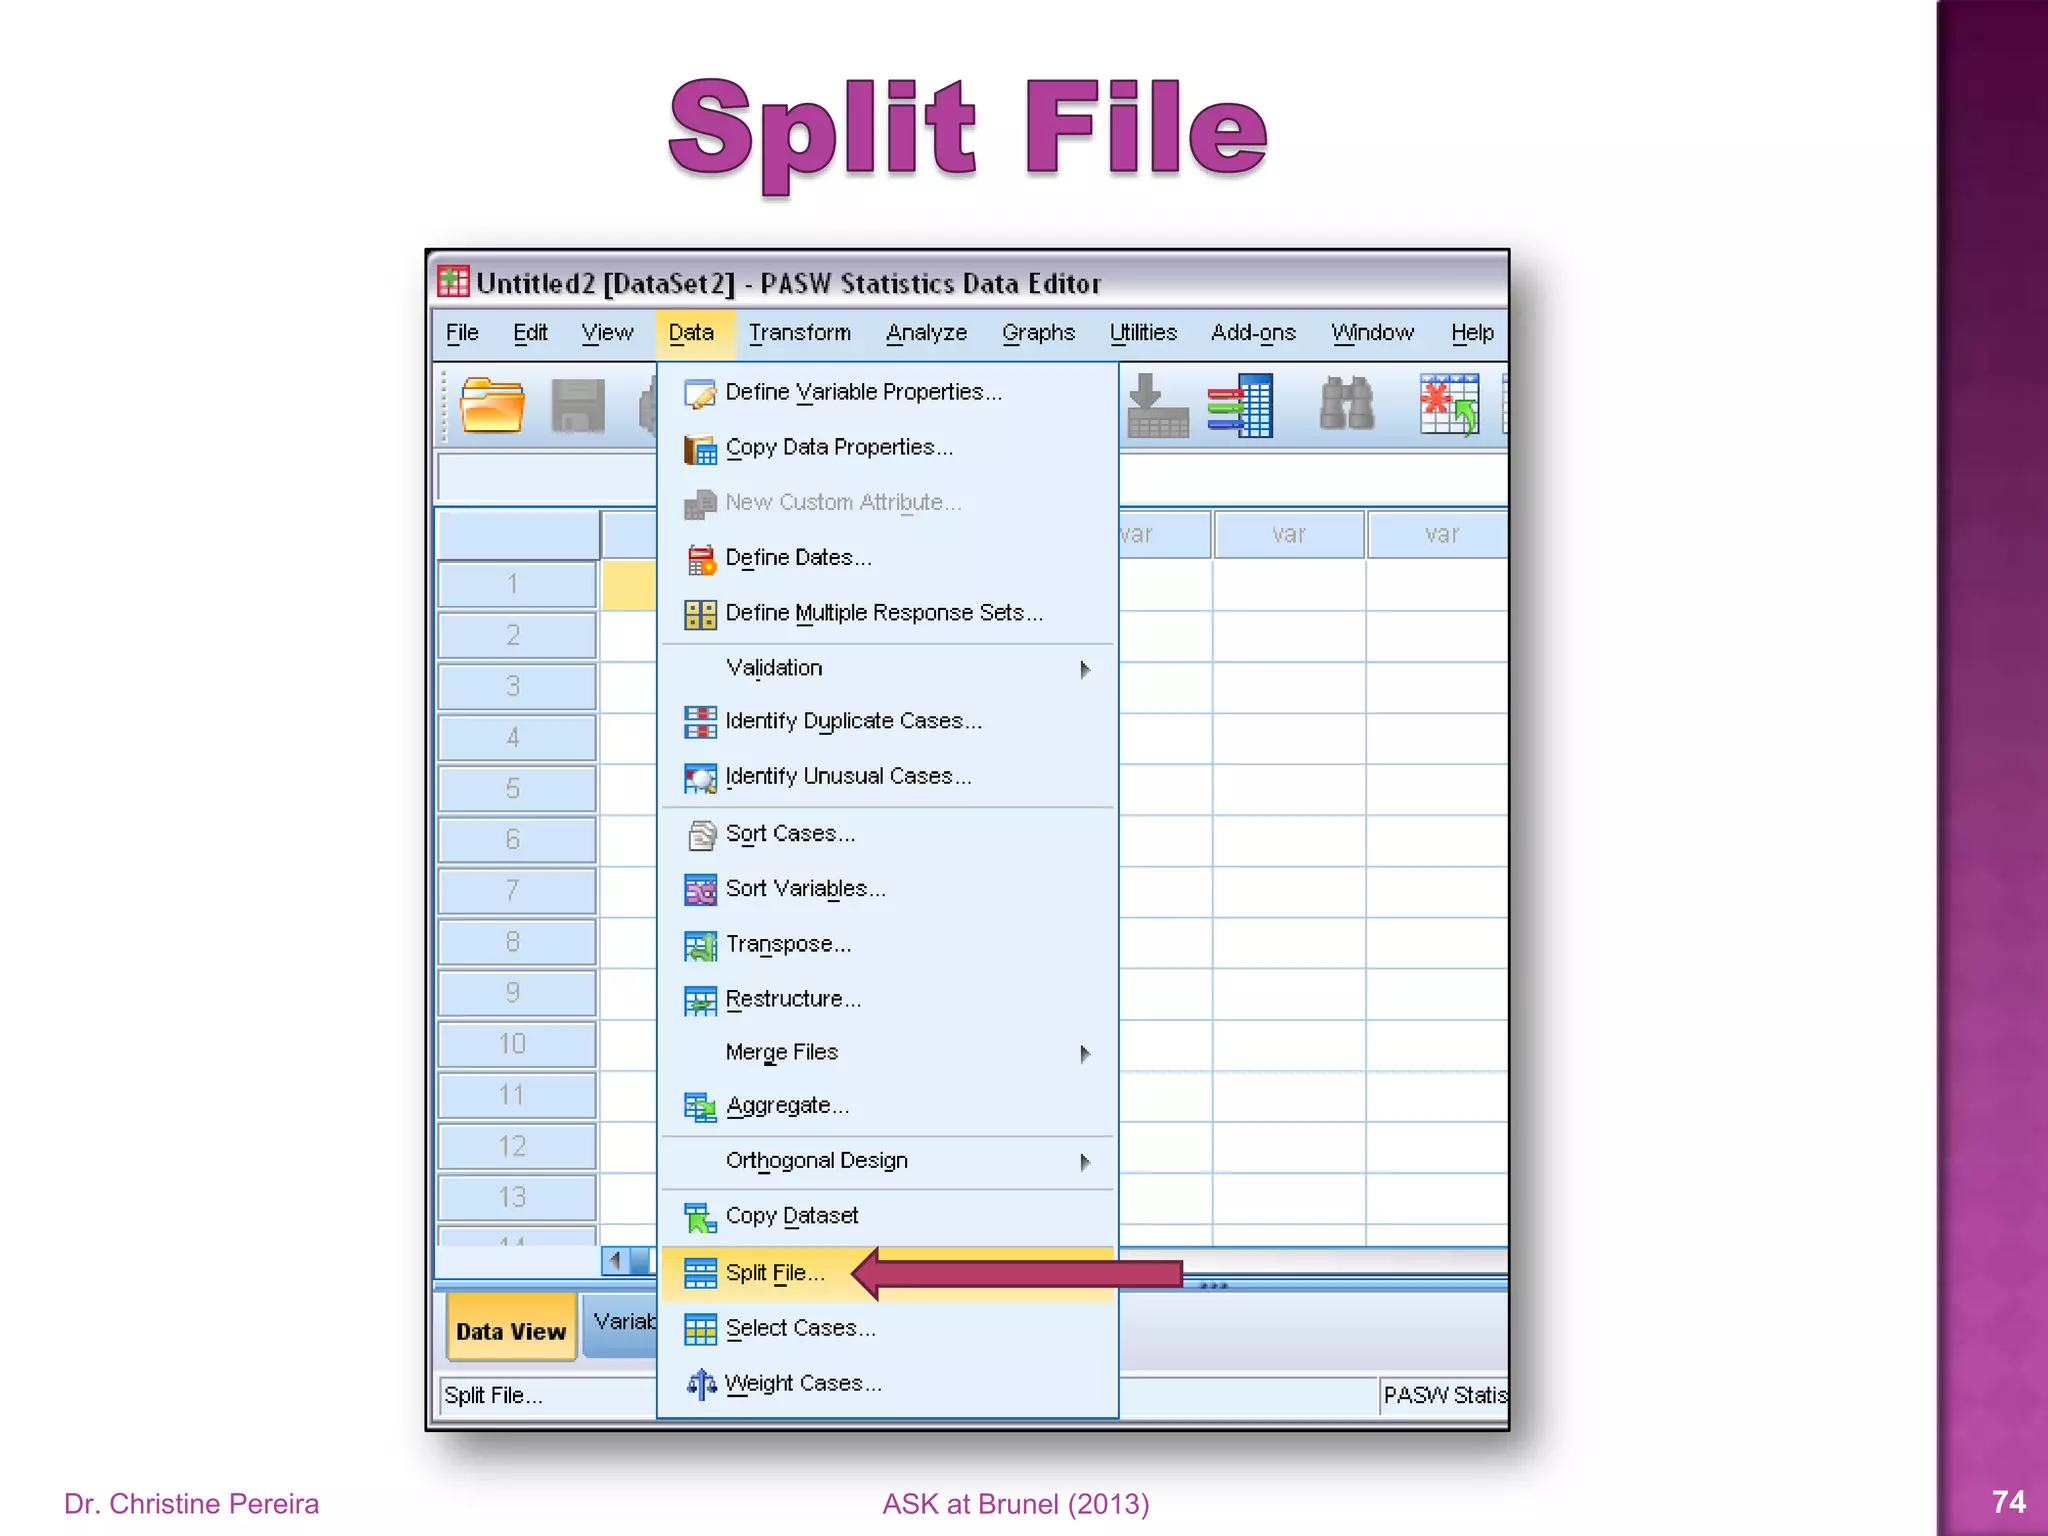
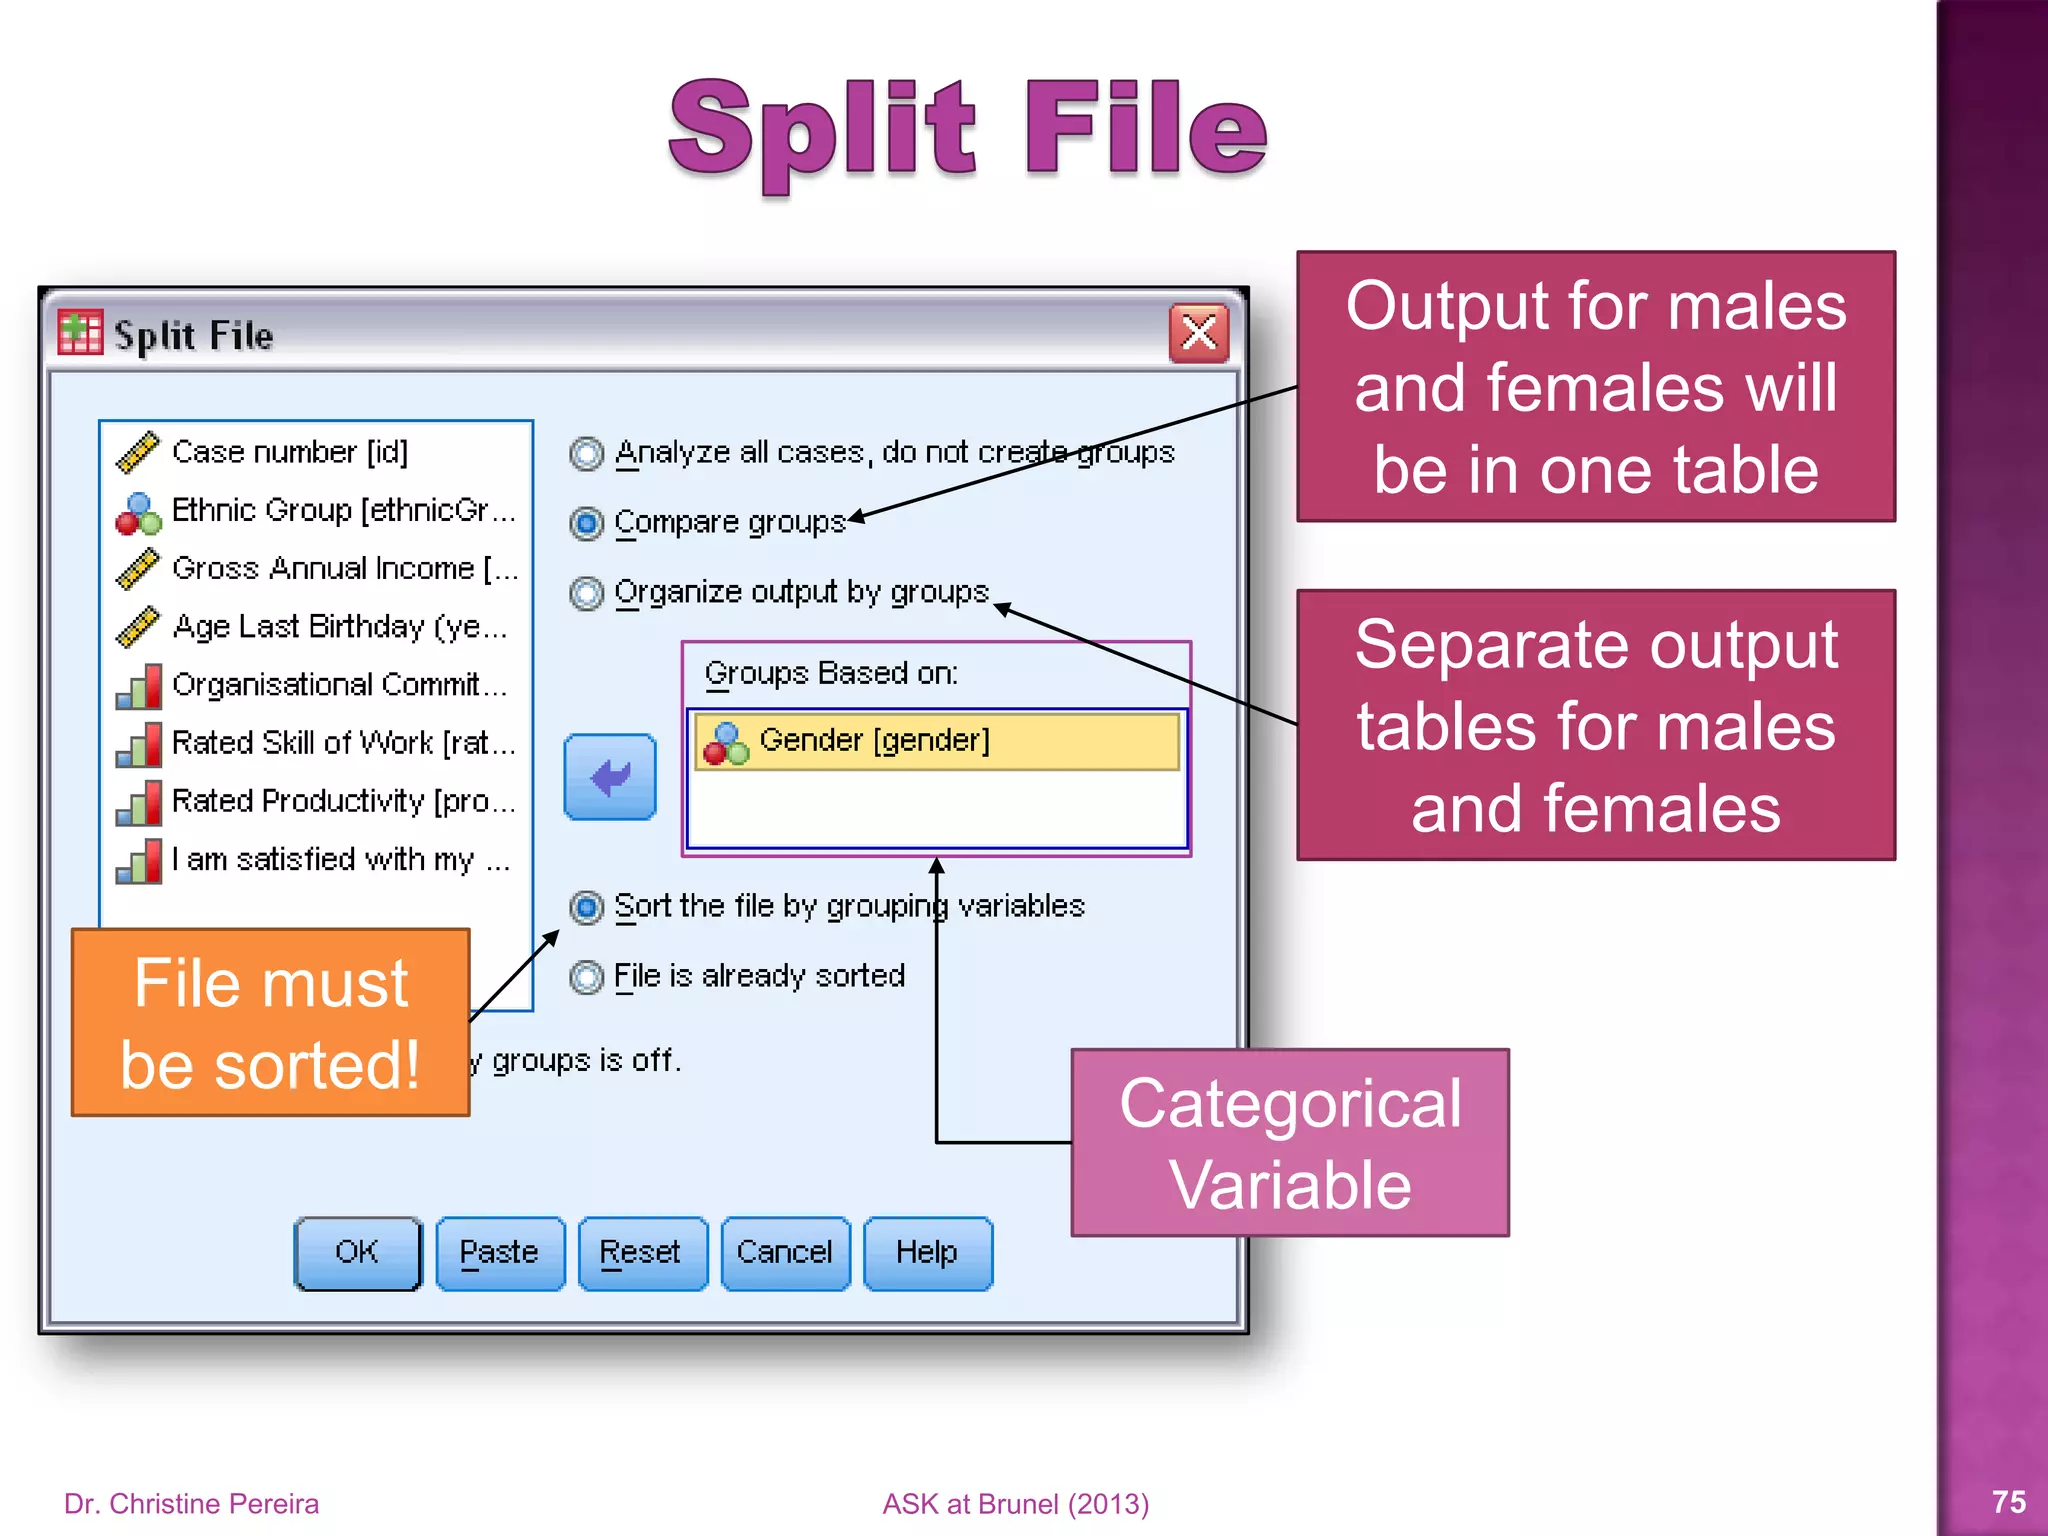
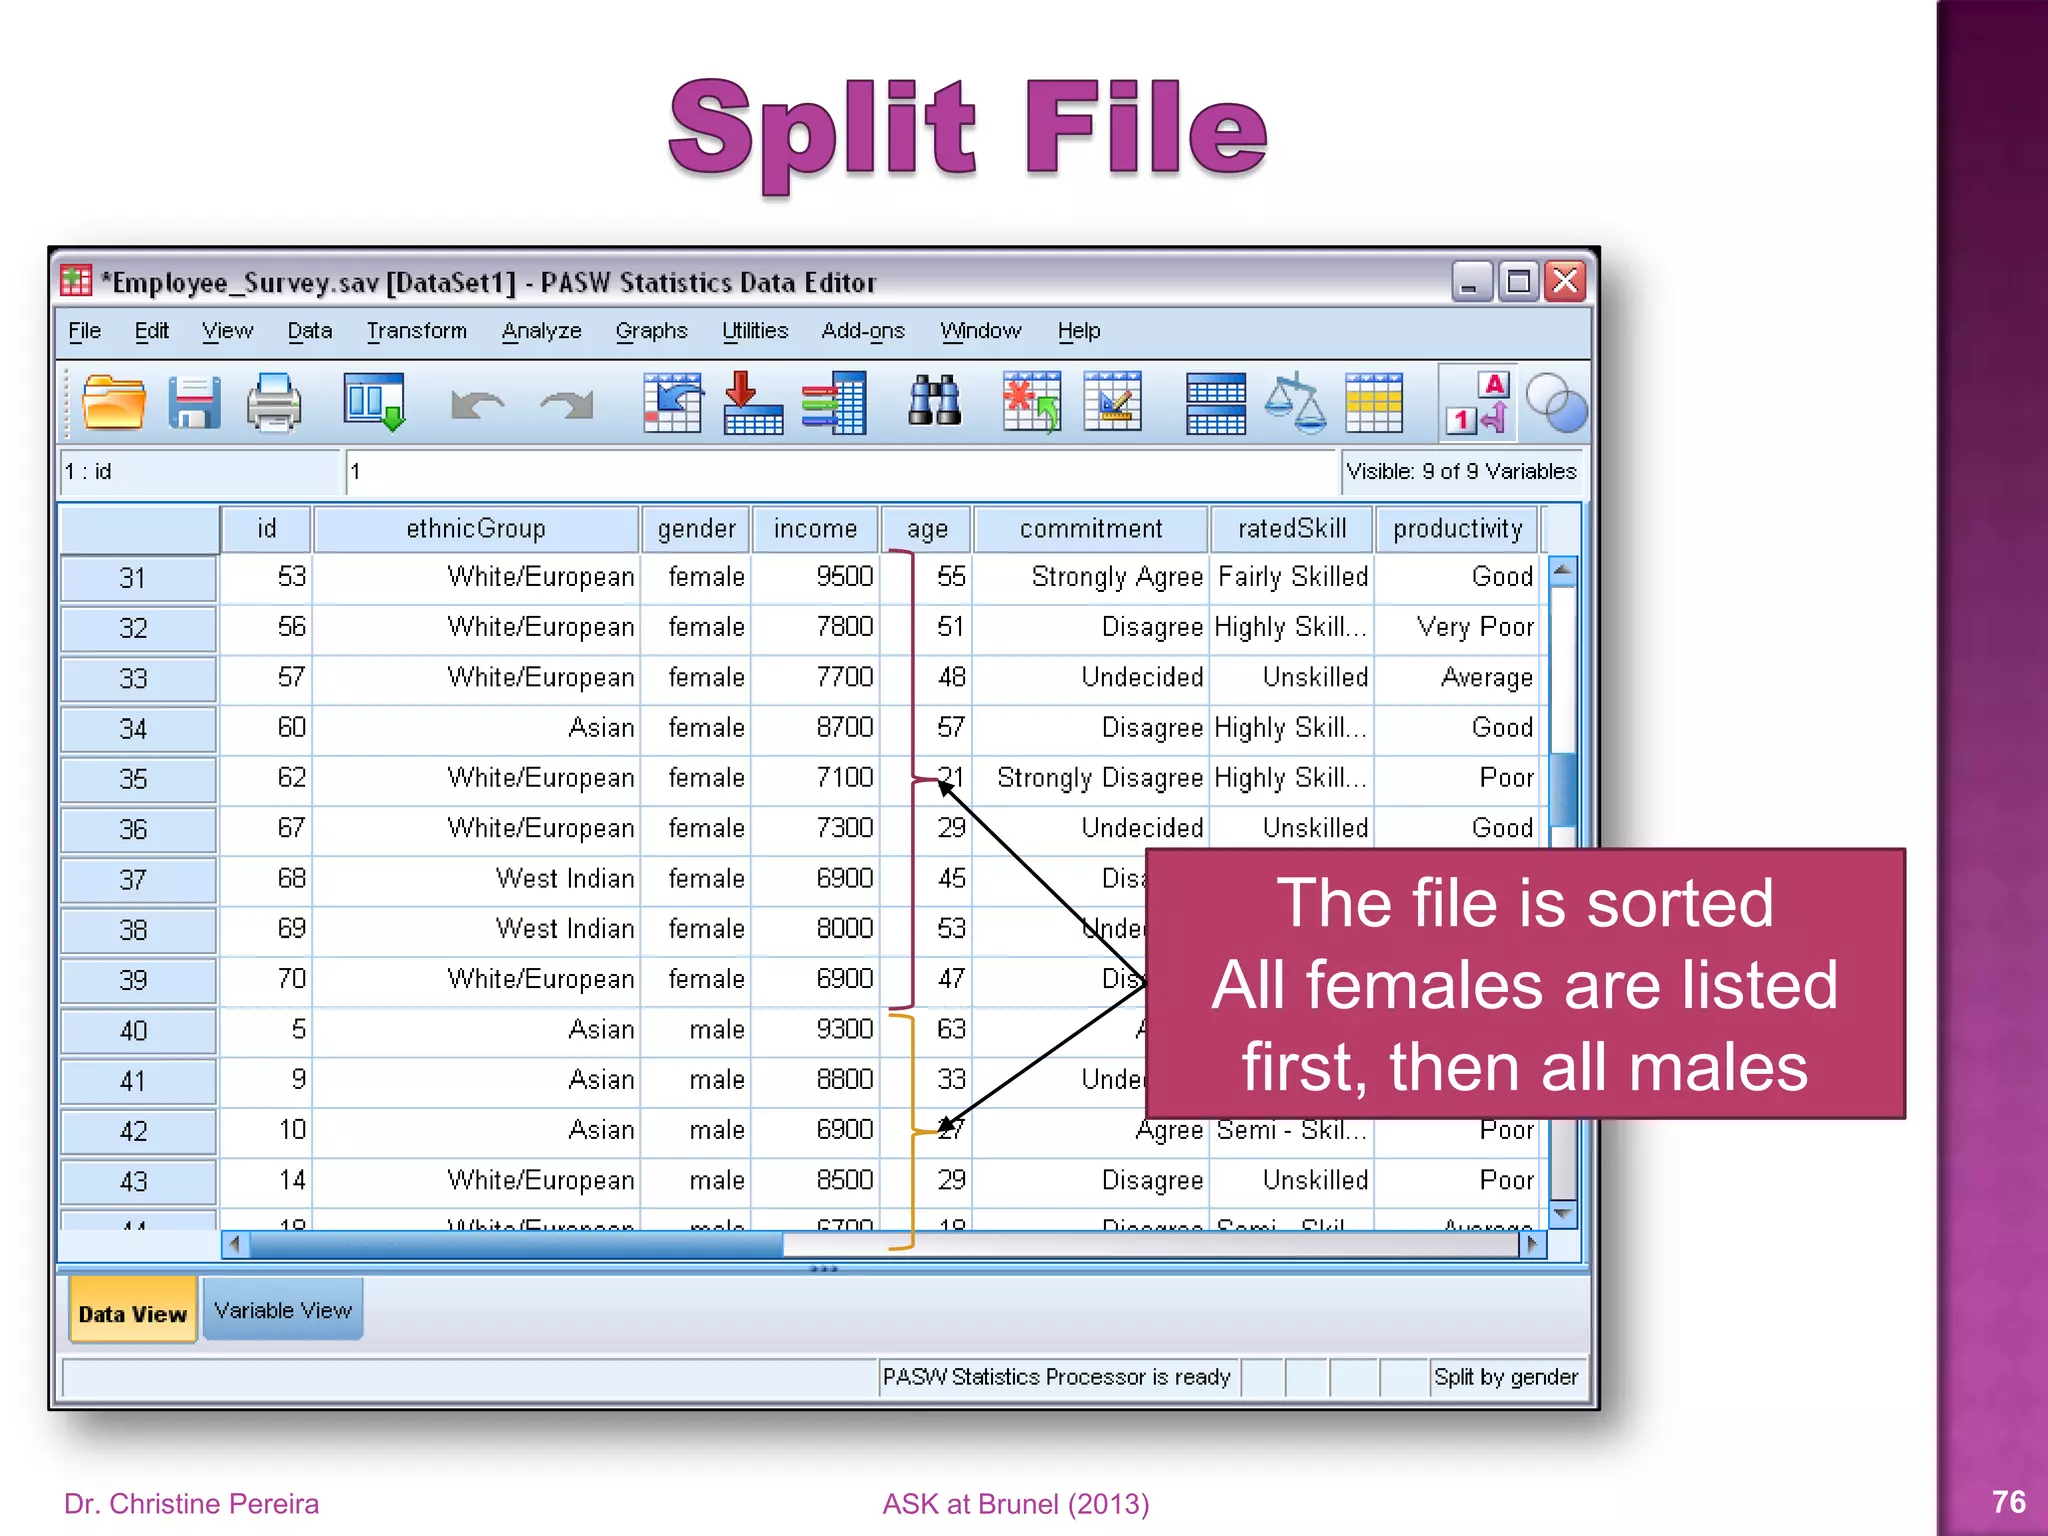
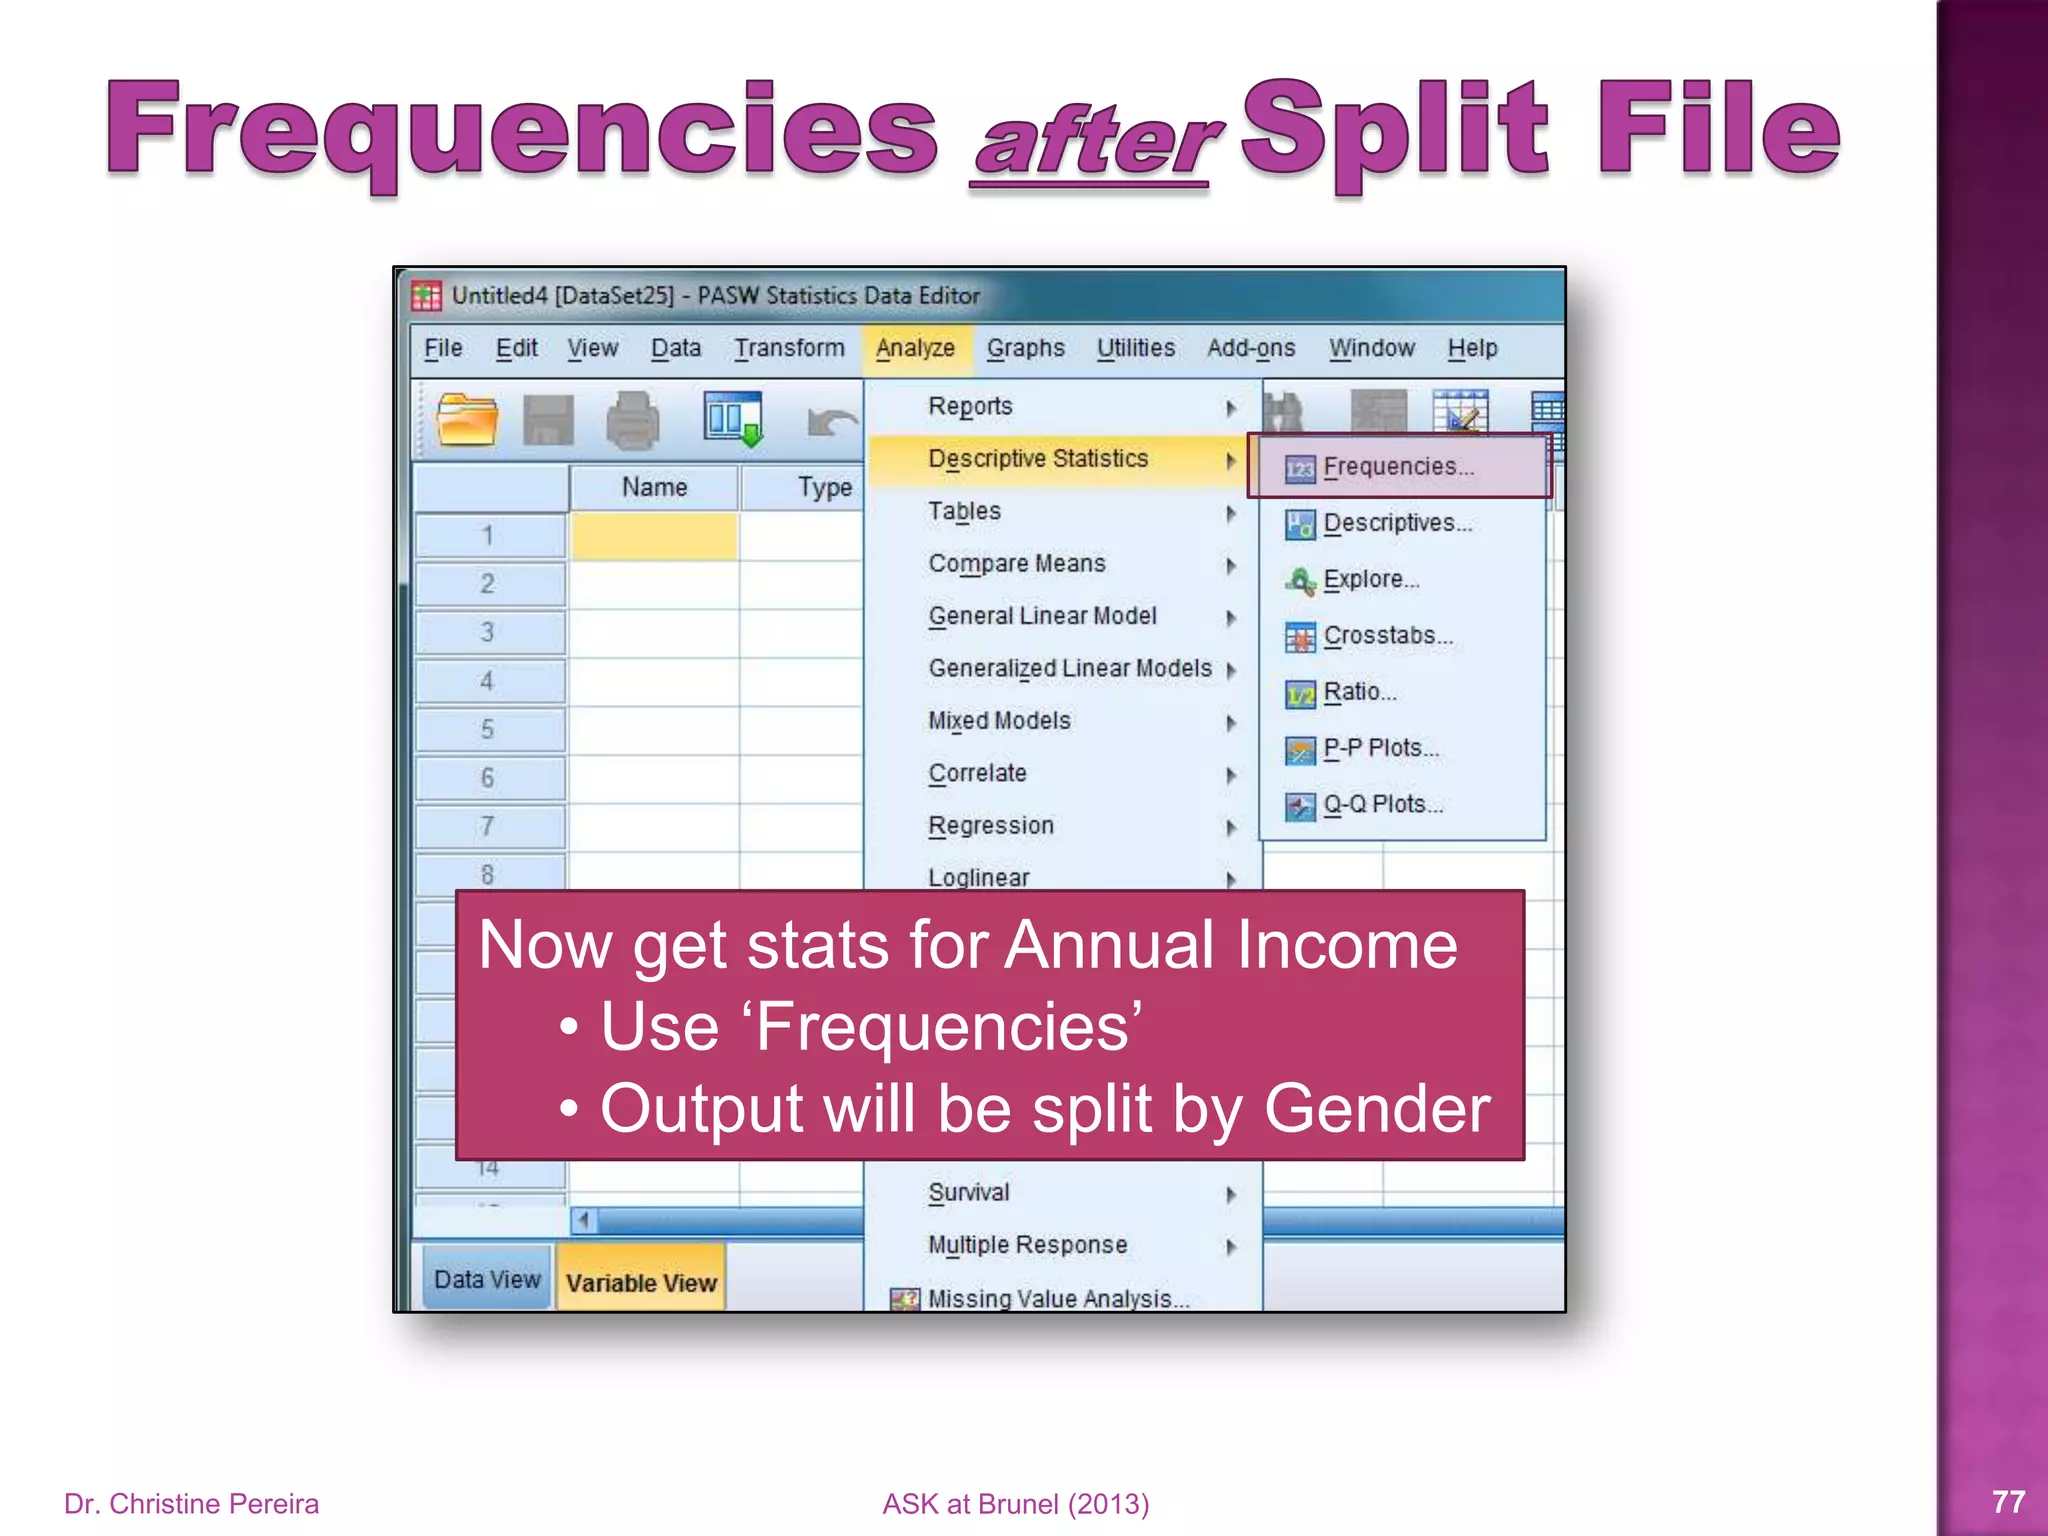
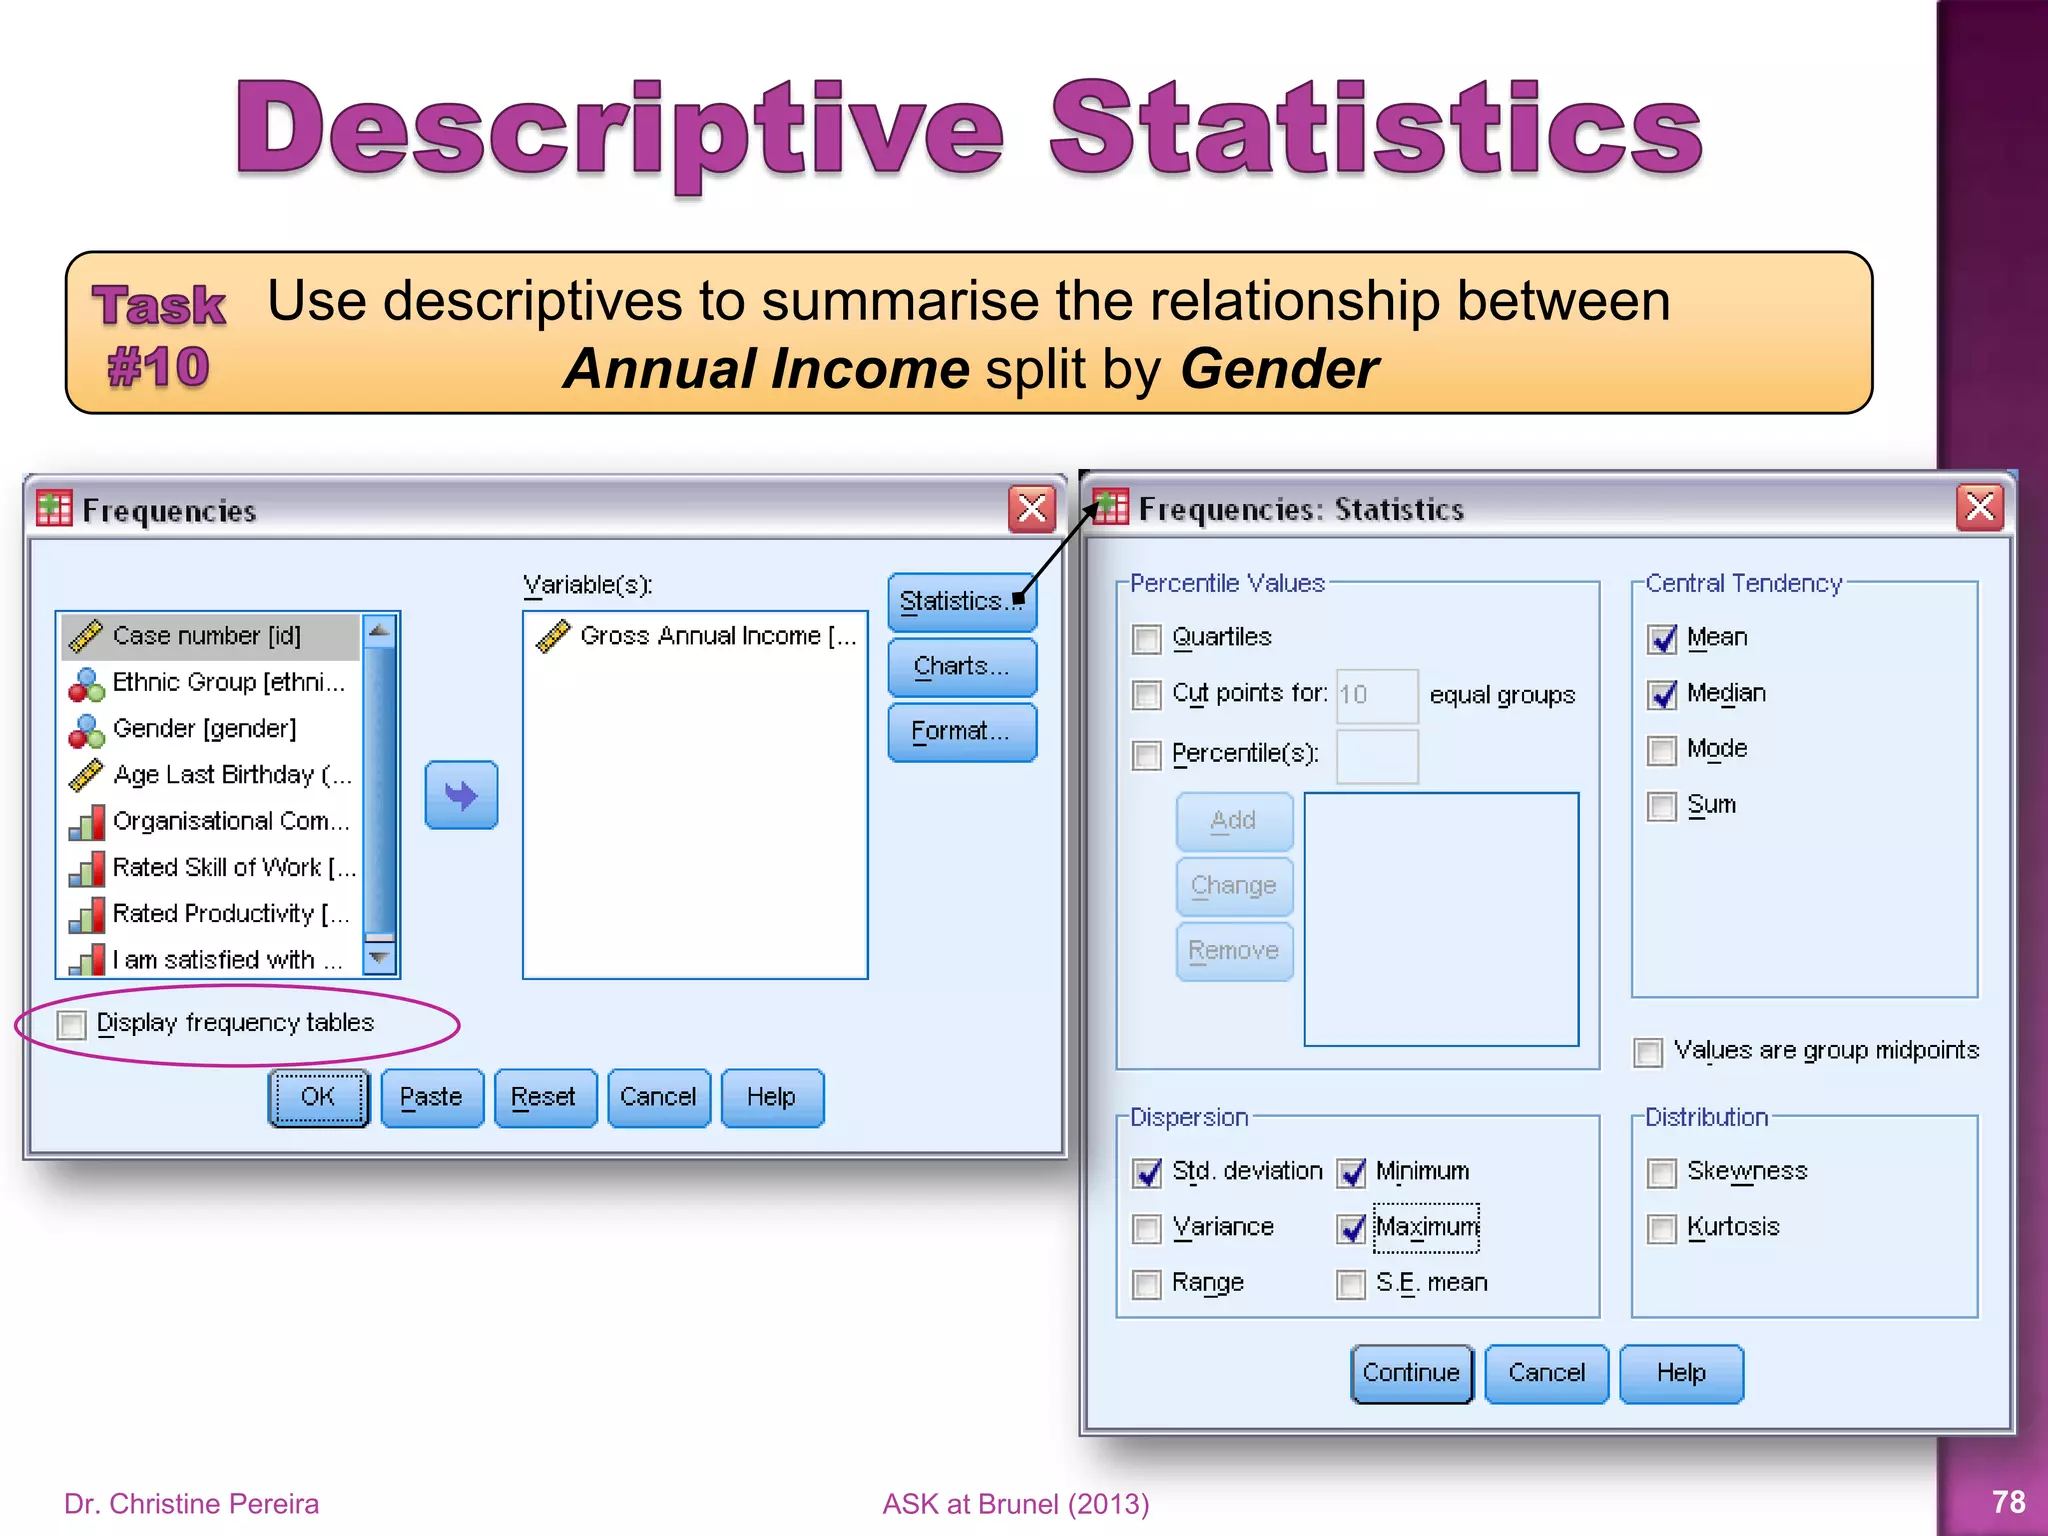
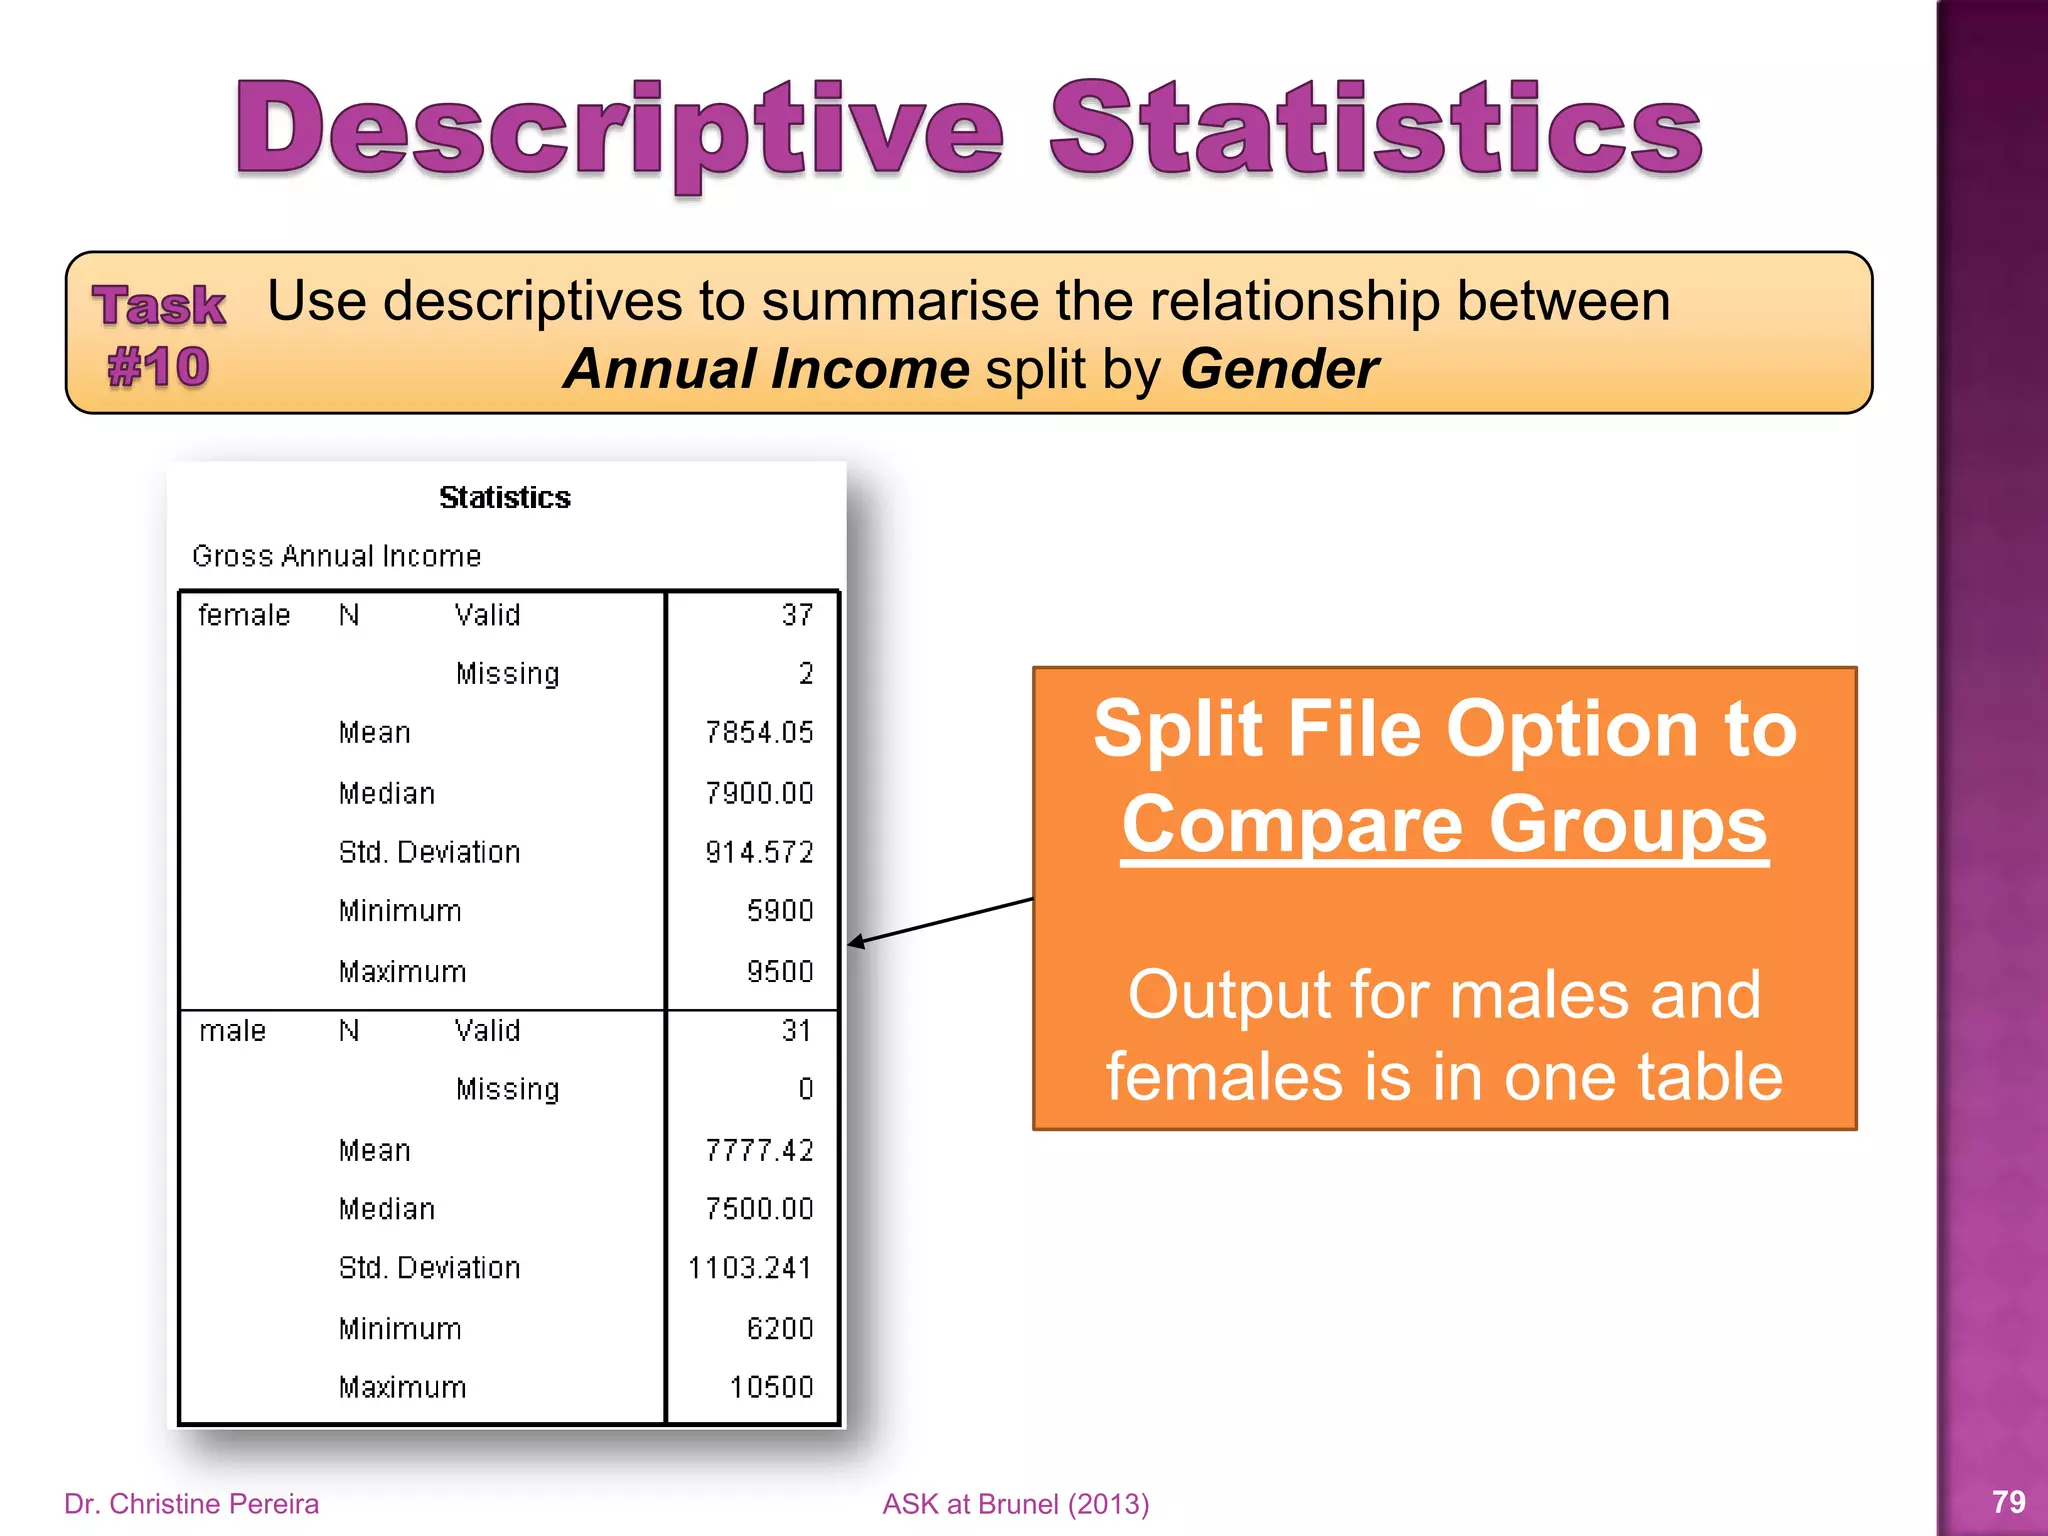
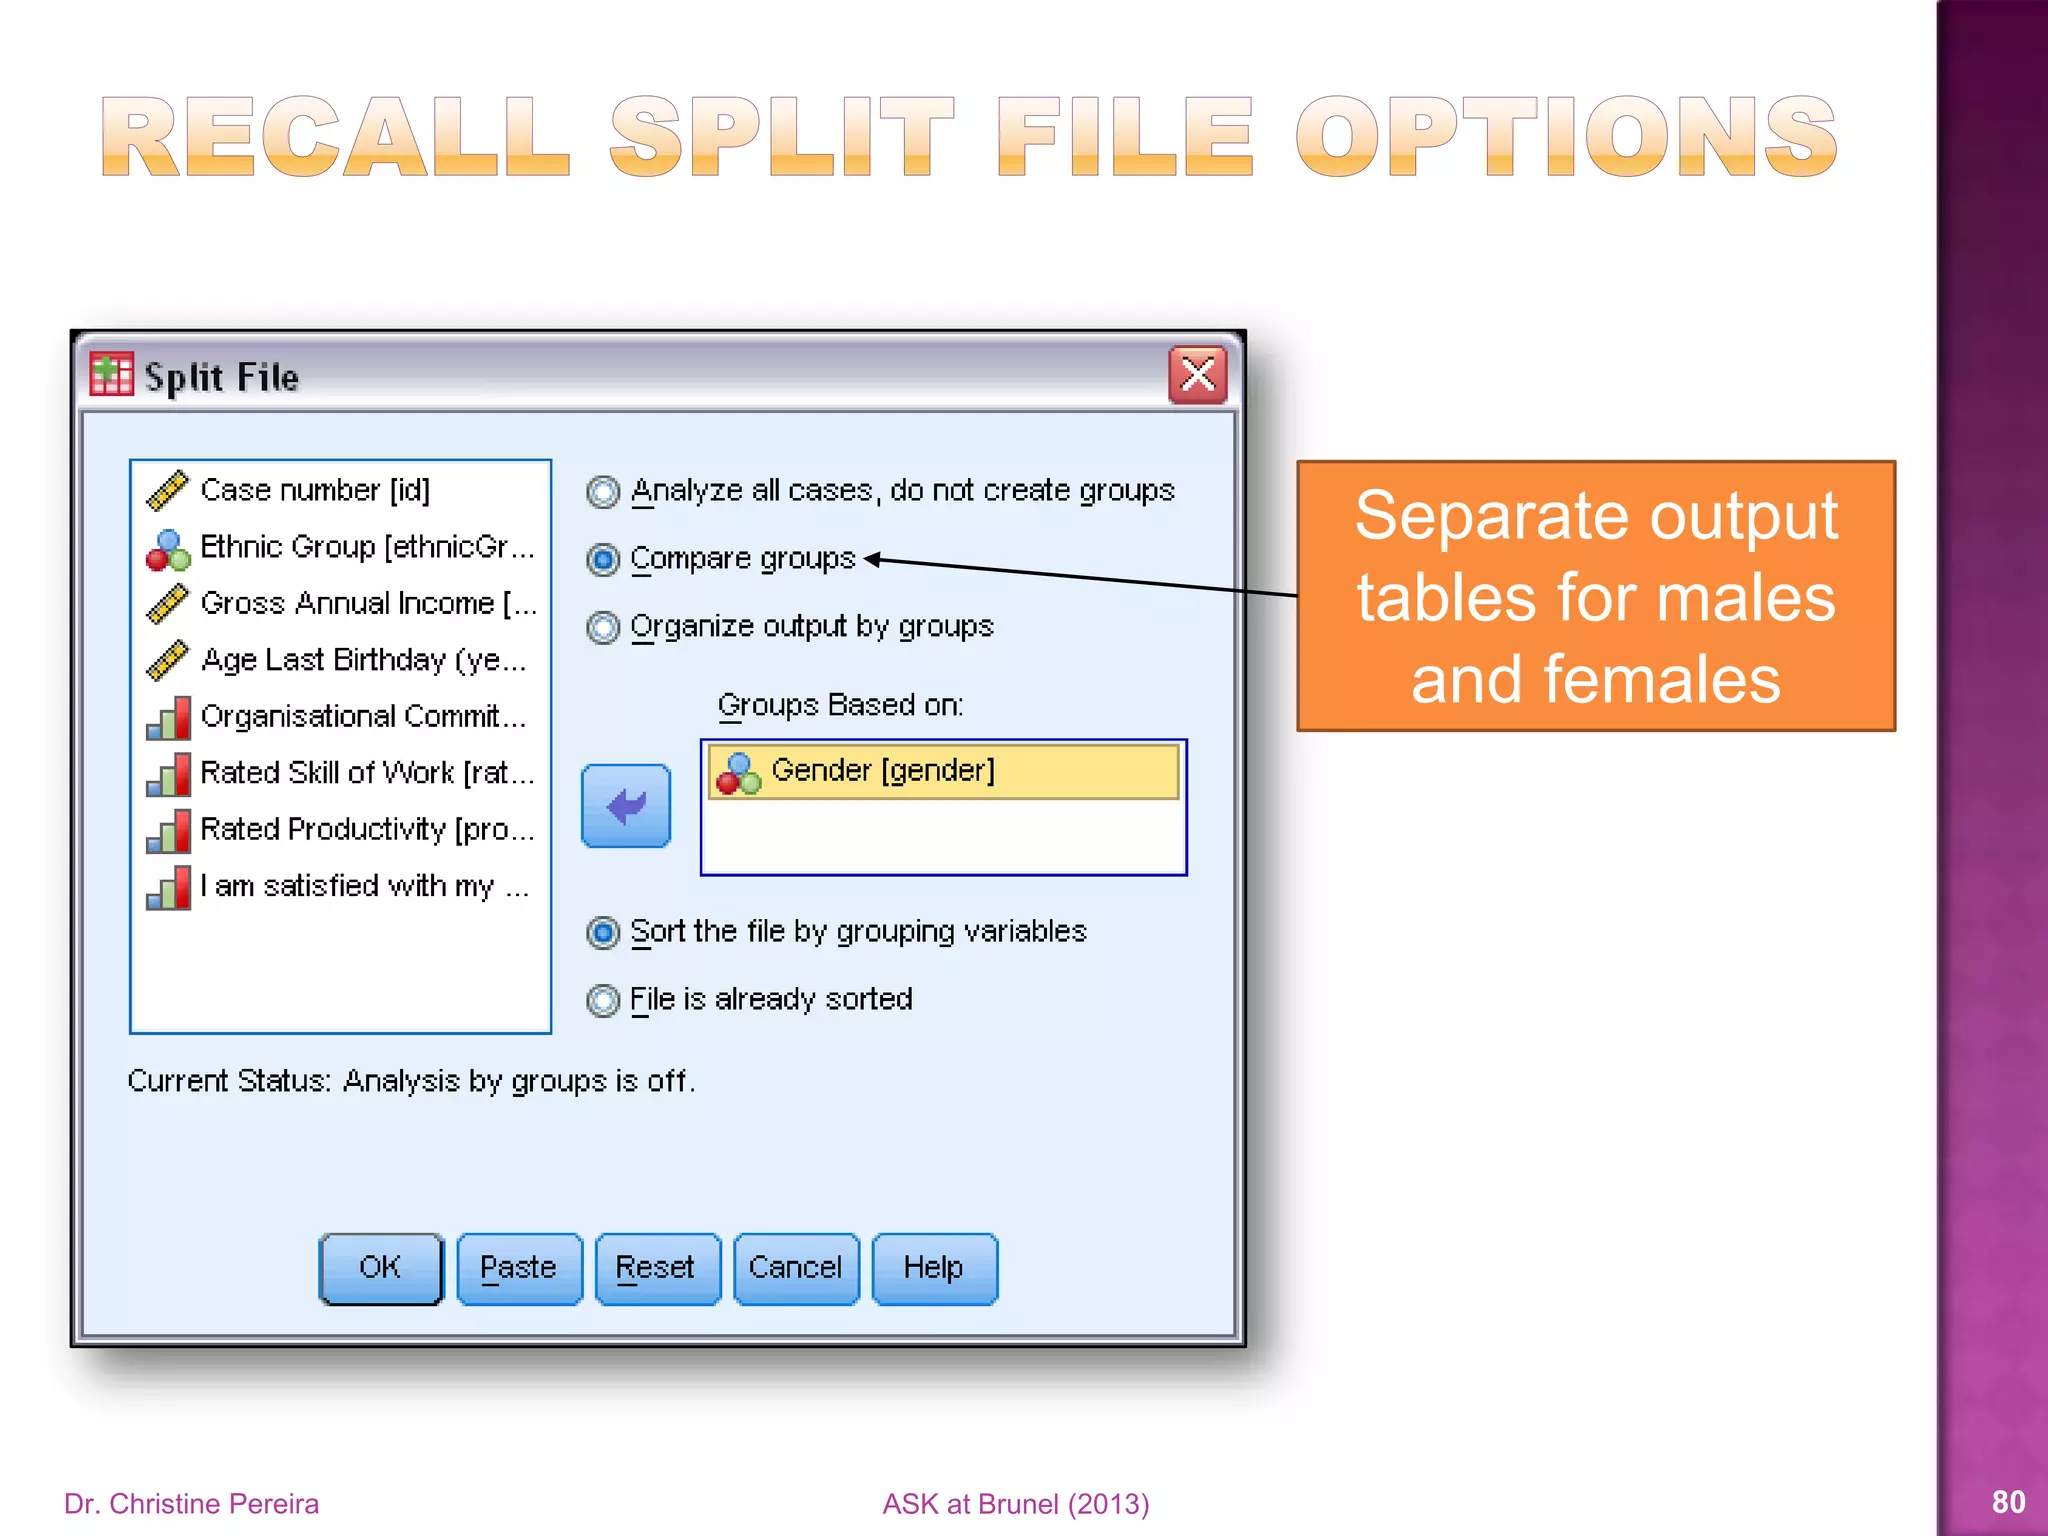
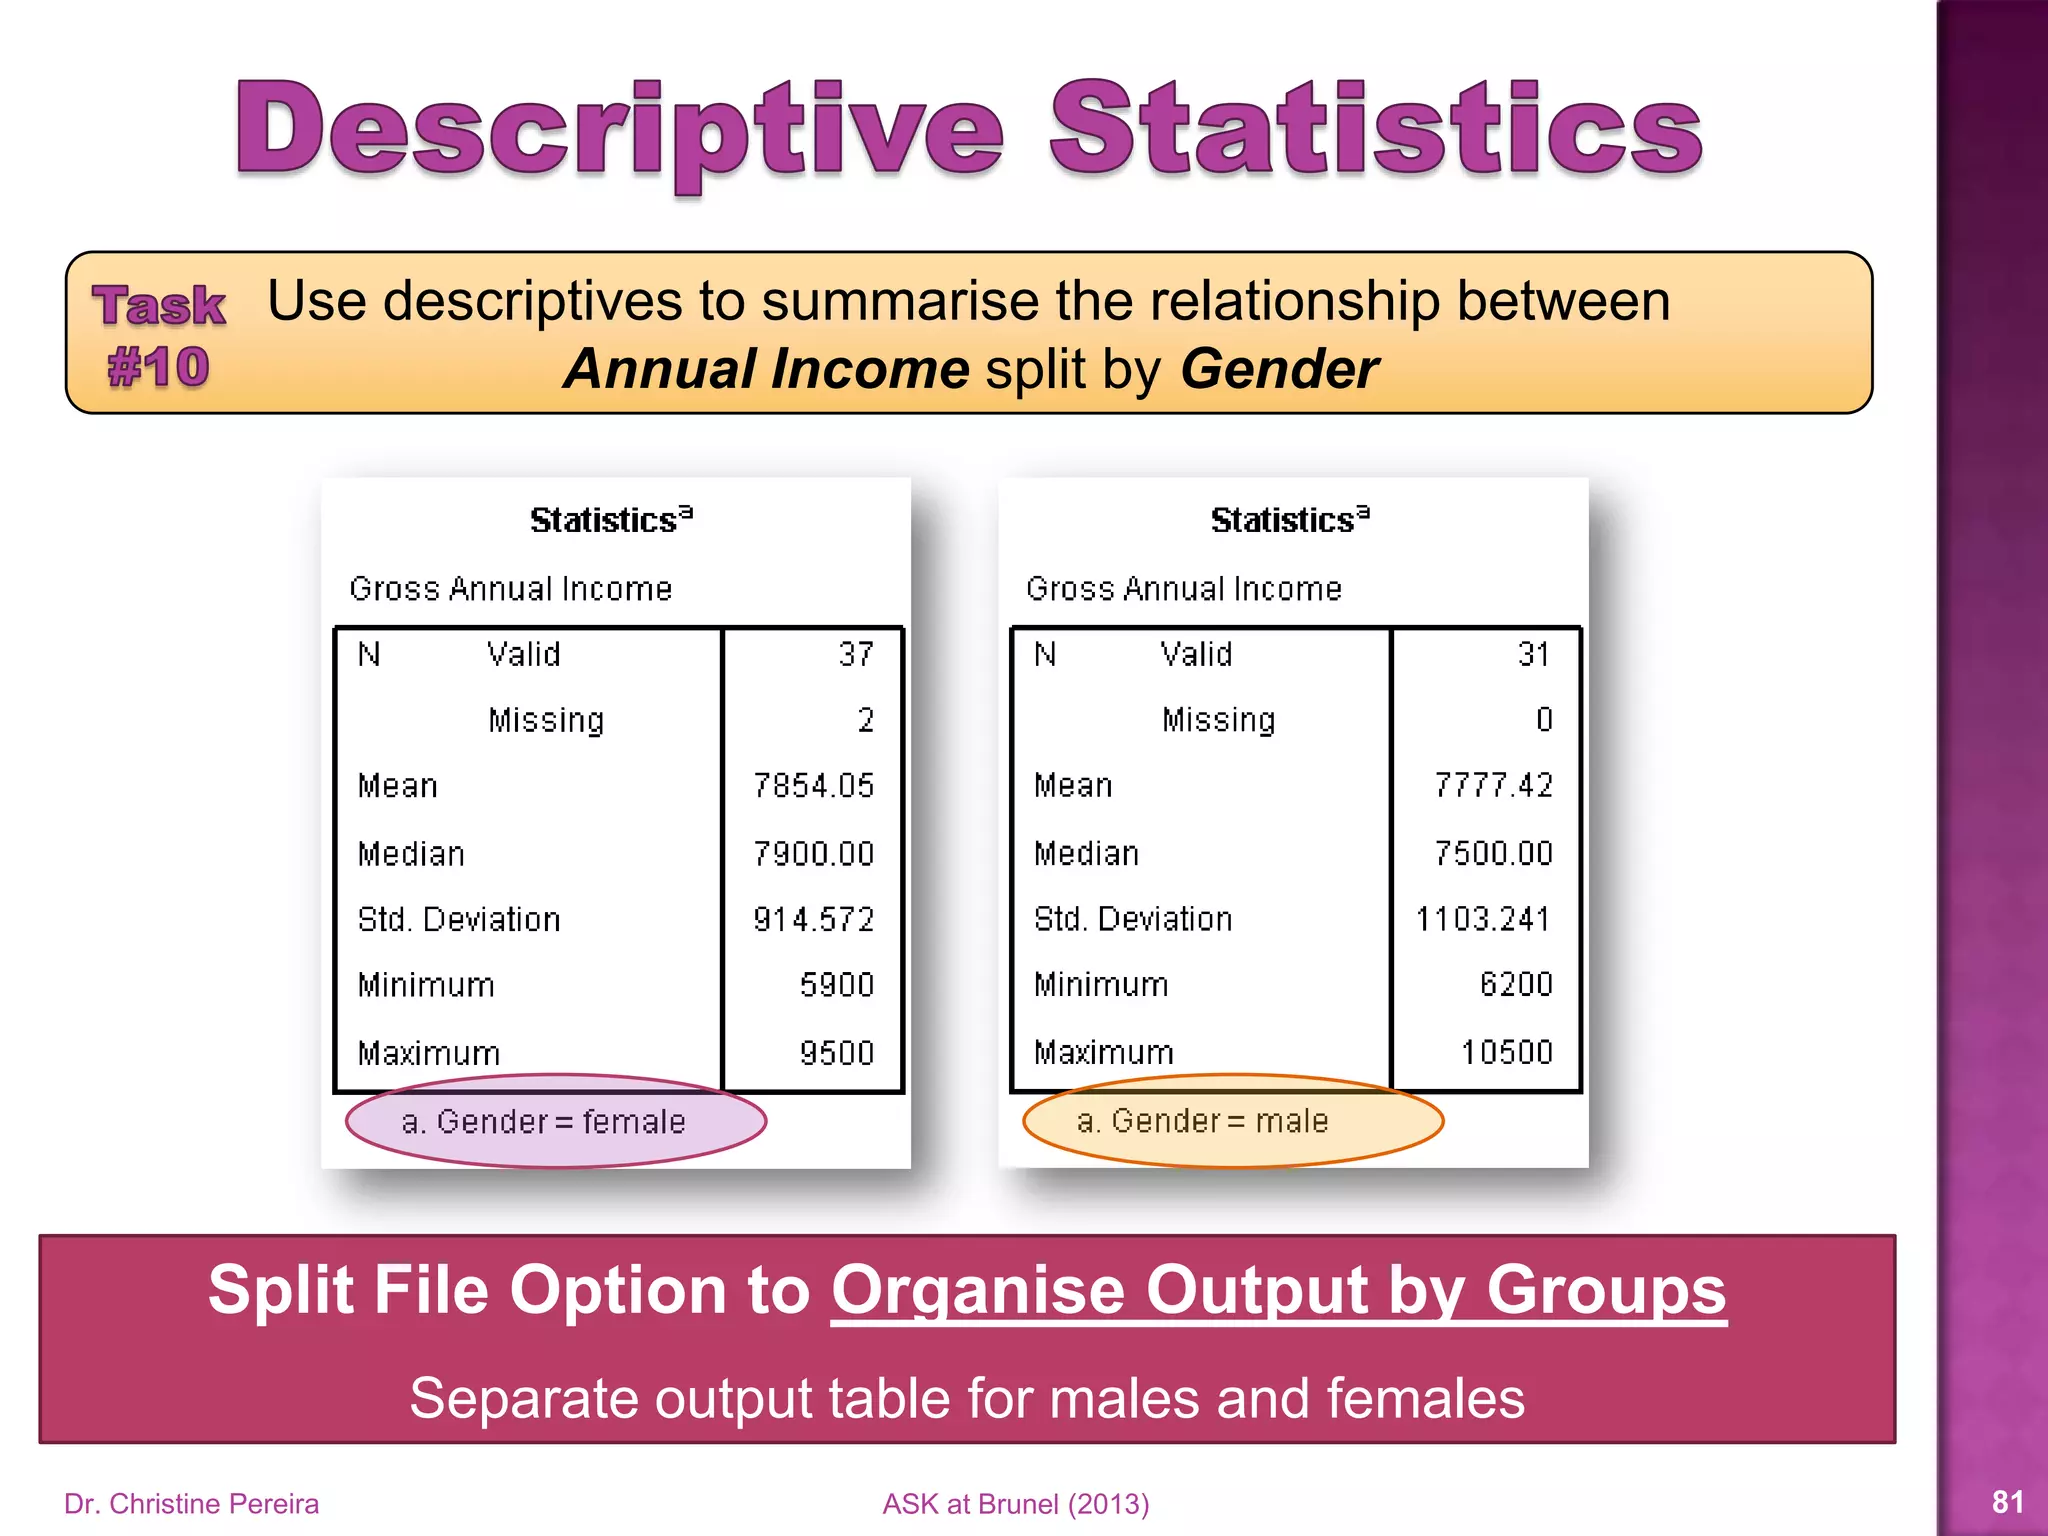
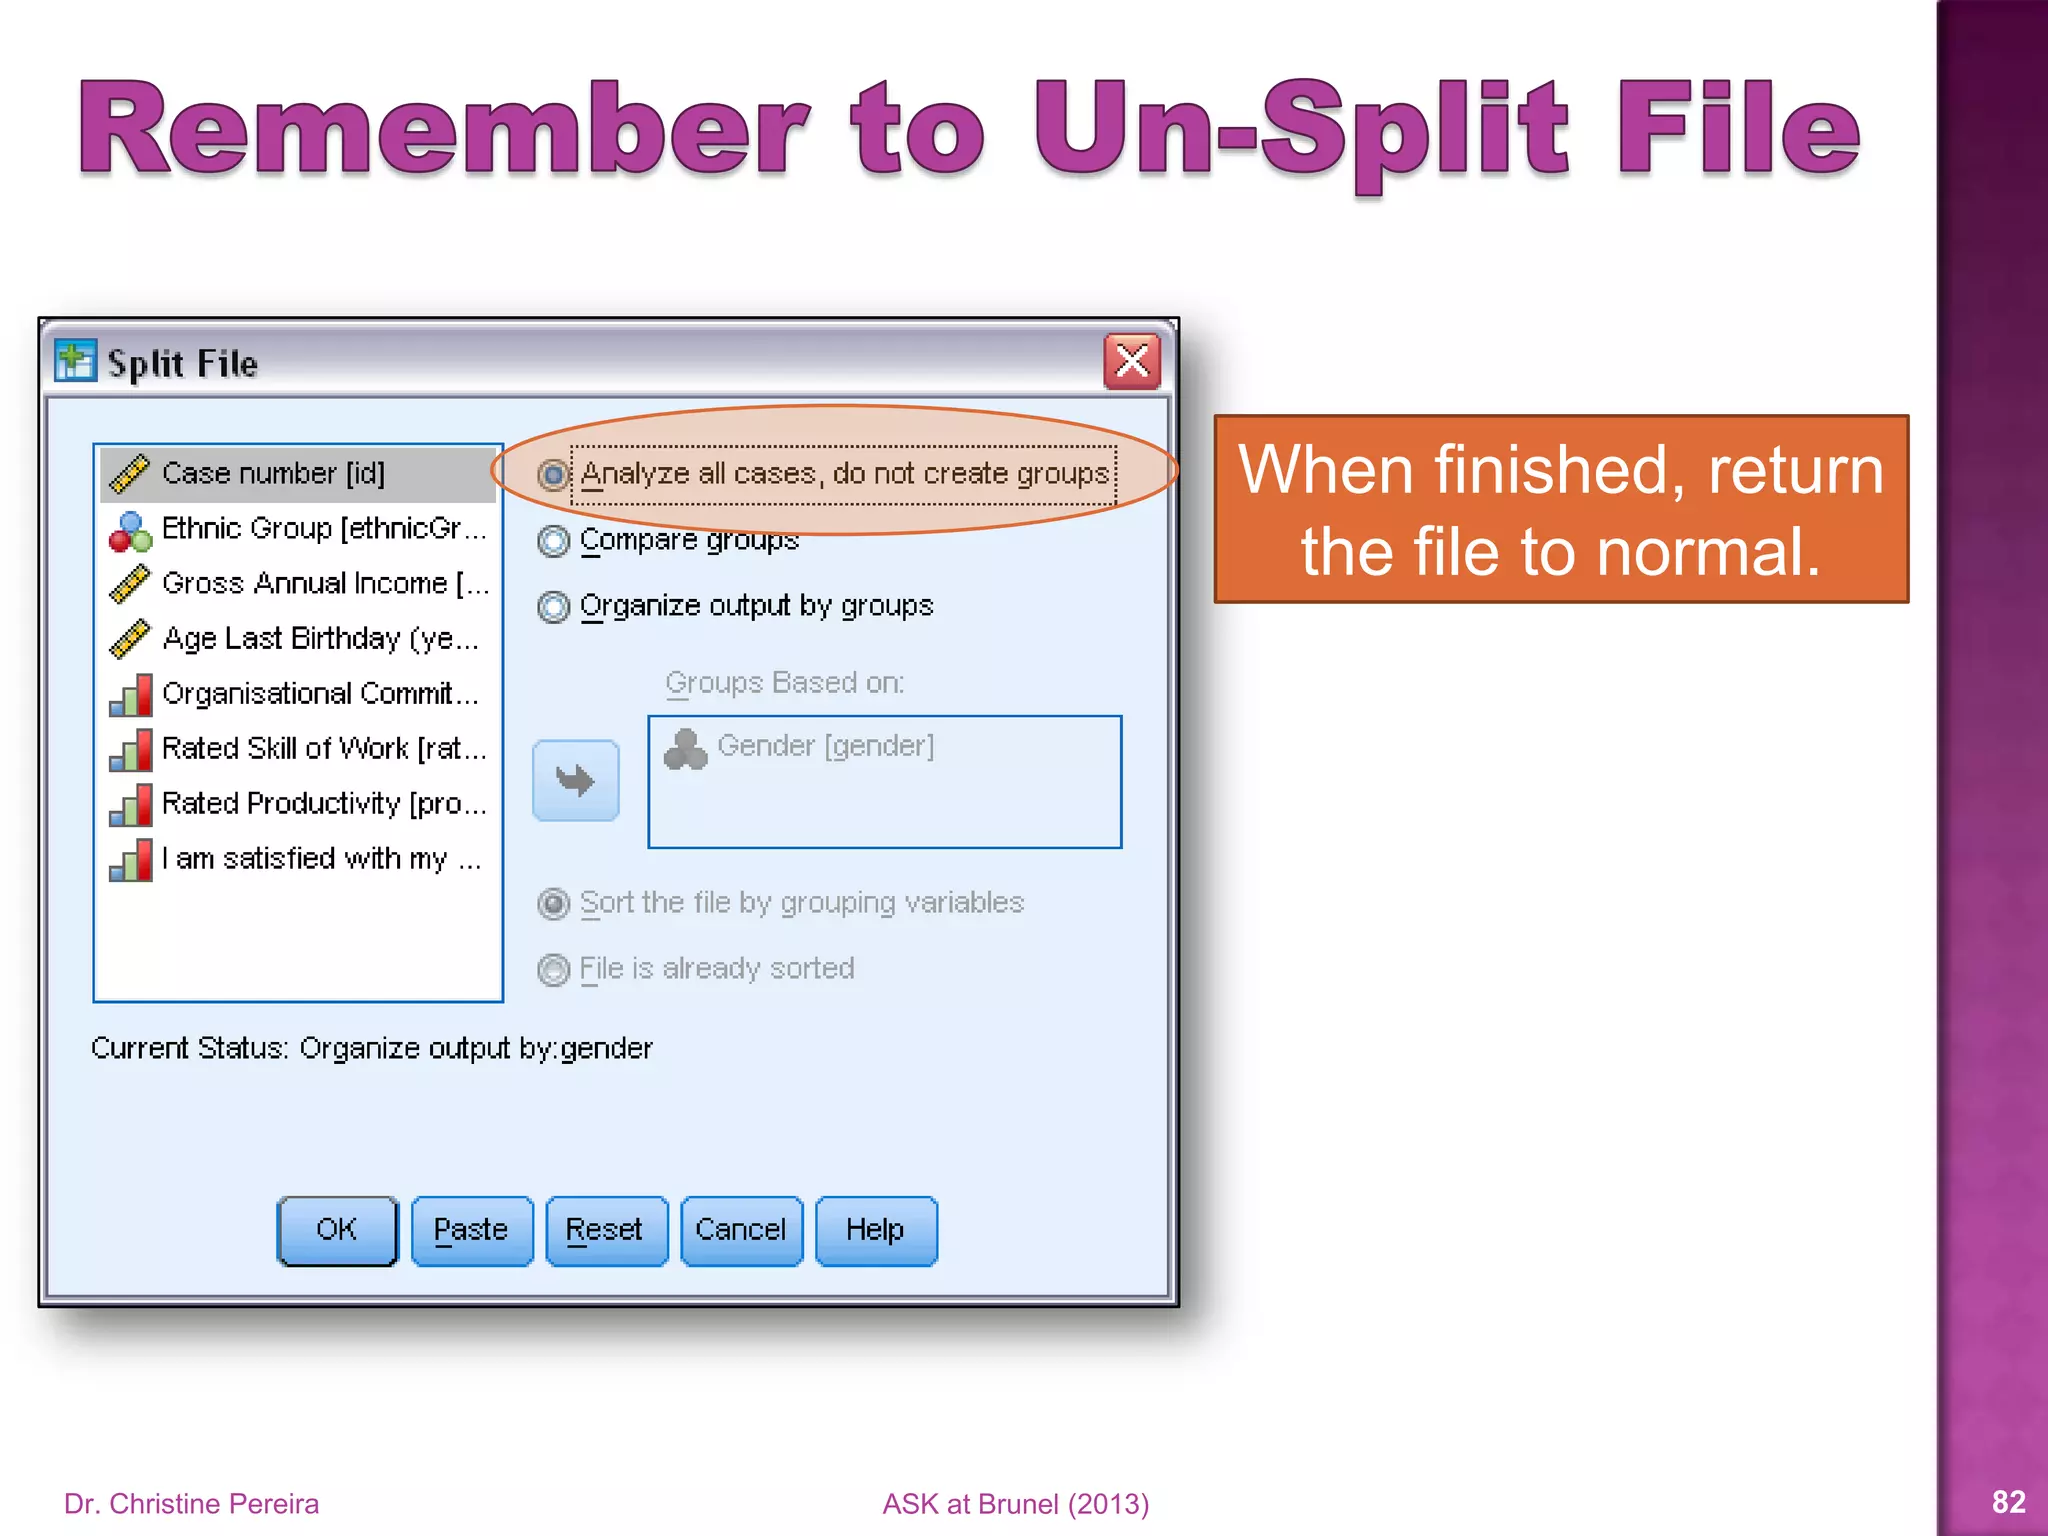
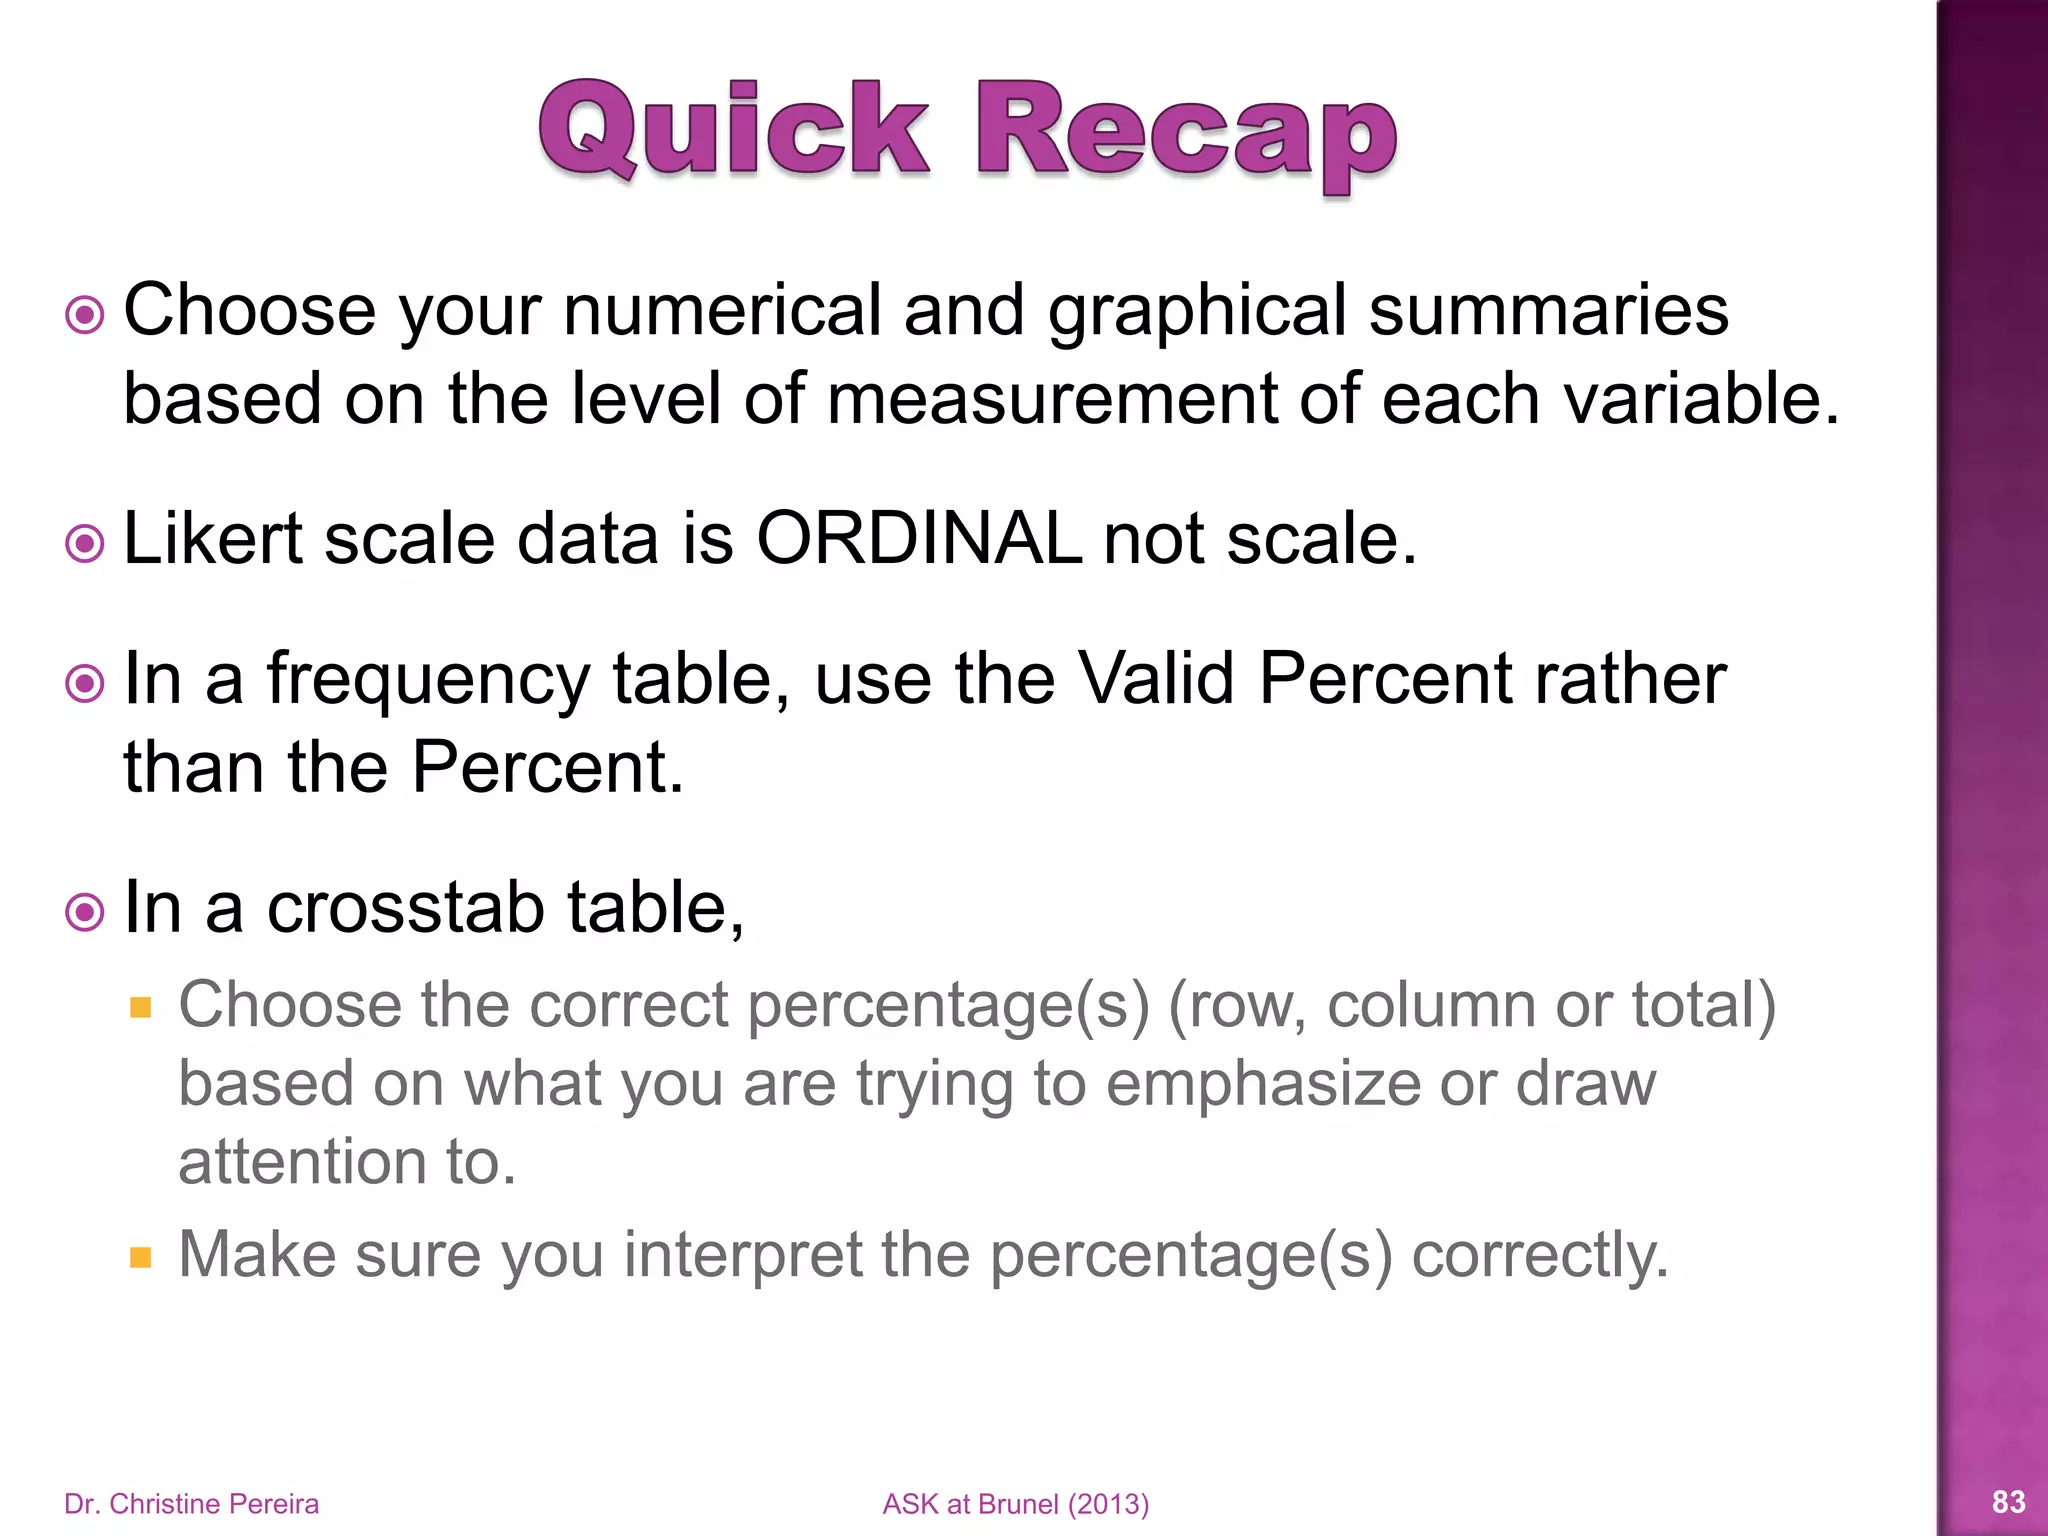


This document provides guidance on using descriptive statistics and graphical summaries to represent data in SPSS. It discusses choosing appropriate charts, graphs, and numerical summaries based on the type of variable. Specifically, it covers how to create bar charts, pie charts, histograms, boxplots and scatterplots in SPSS. The document also discusses descriptive statistics like means, medians, and frequencies and how to interpret percentages in cross tabulation tables. Overall, the document aims to help users appropriately summarize and represent their data through graphical and numerical methods in SPSS.