Downloaded 75 times


![Since the test uses a .05 alpha value, that is what we
will use to determine if the probability of a meaningful
difference is rare or common.
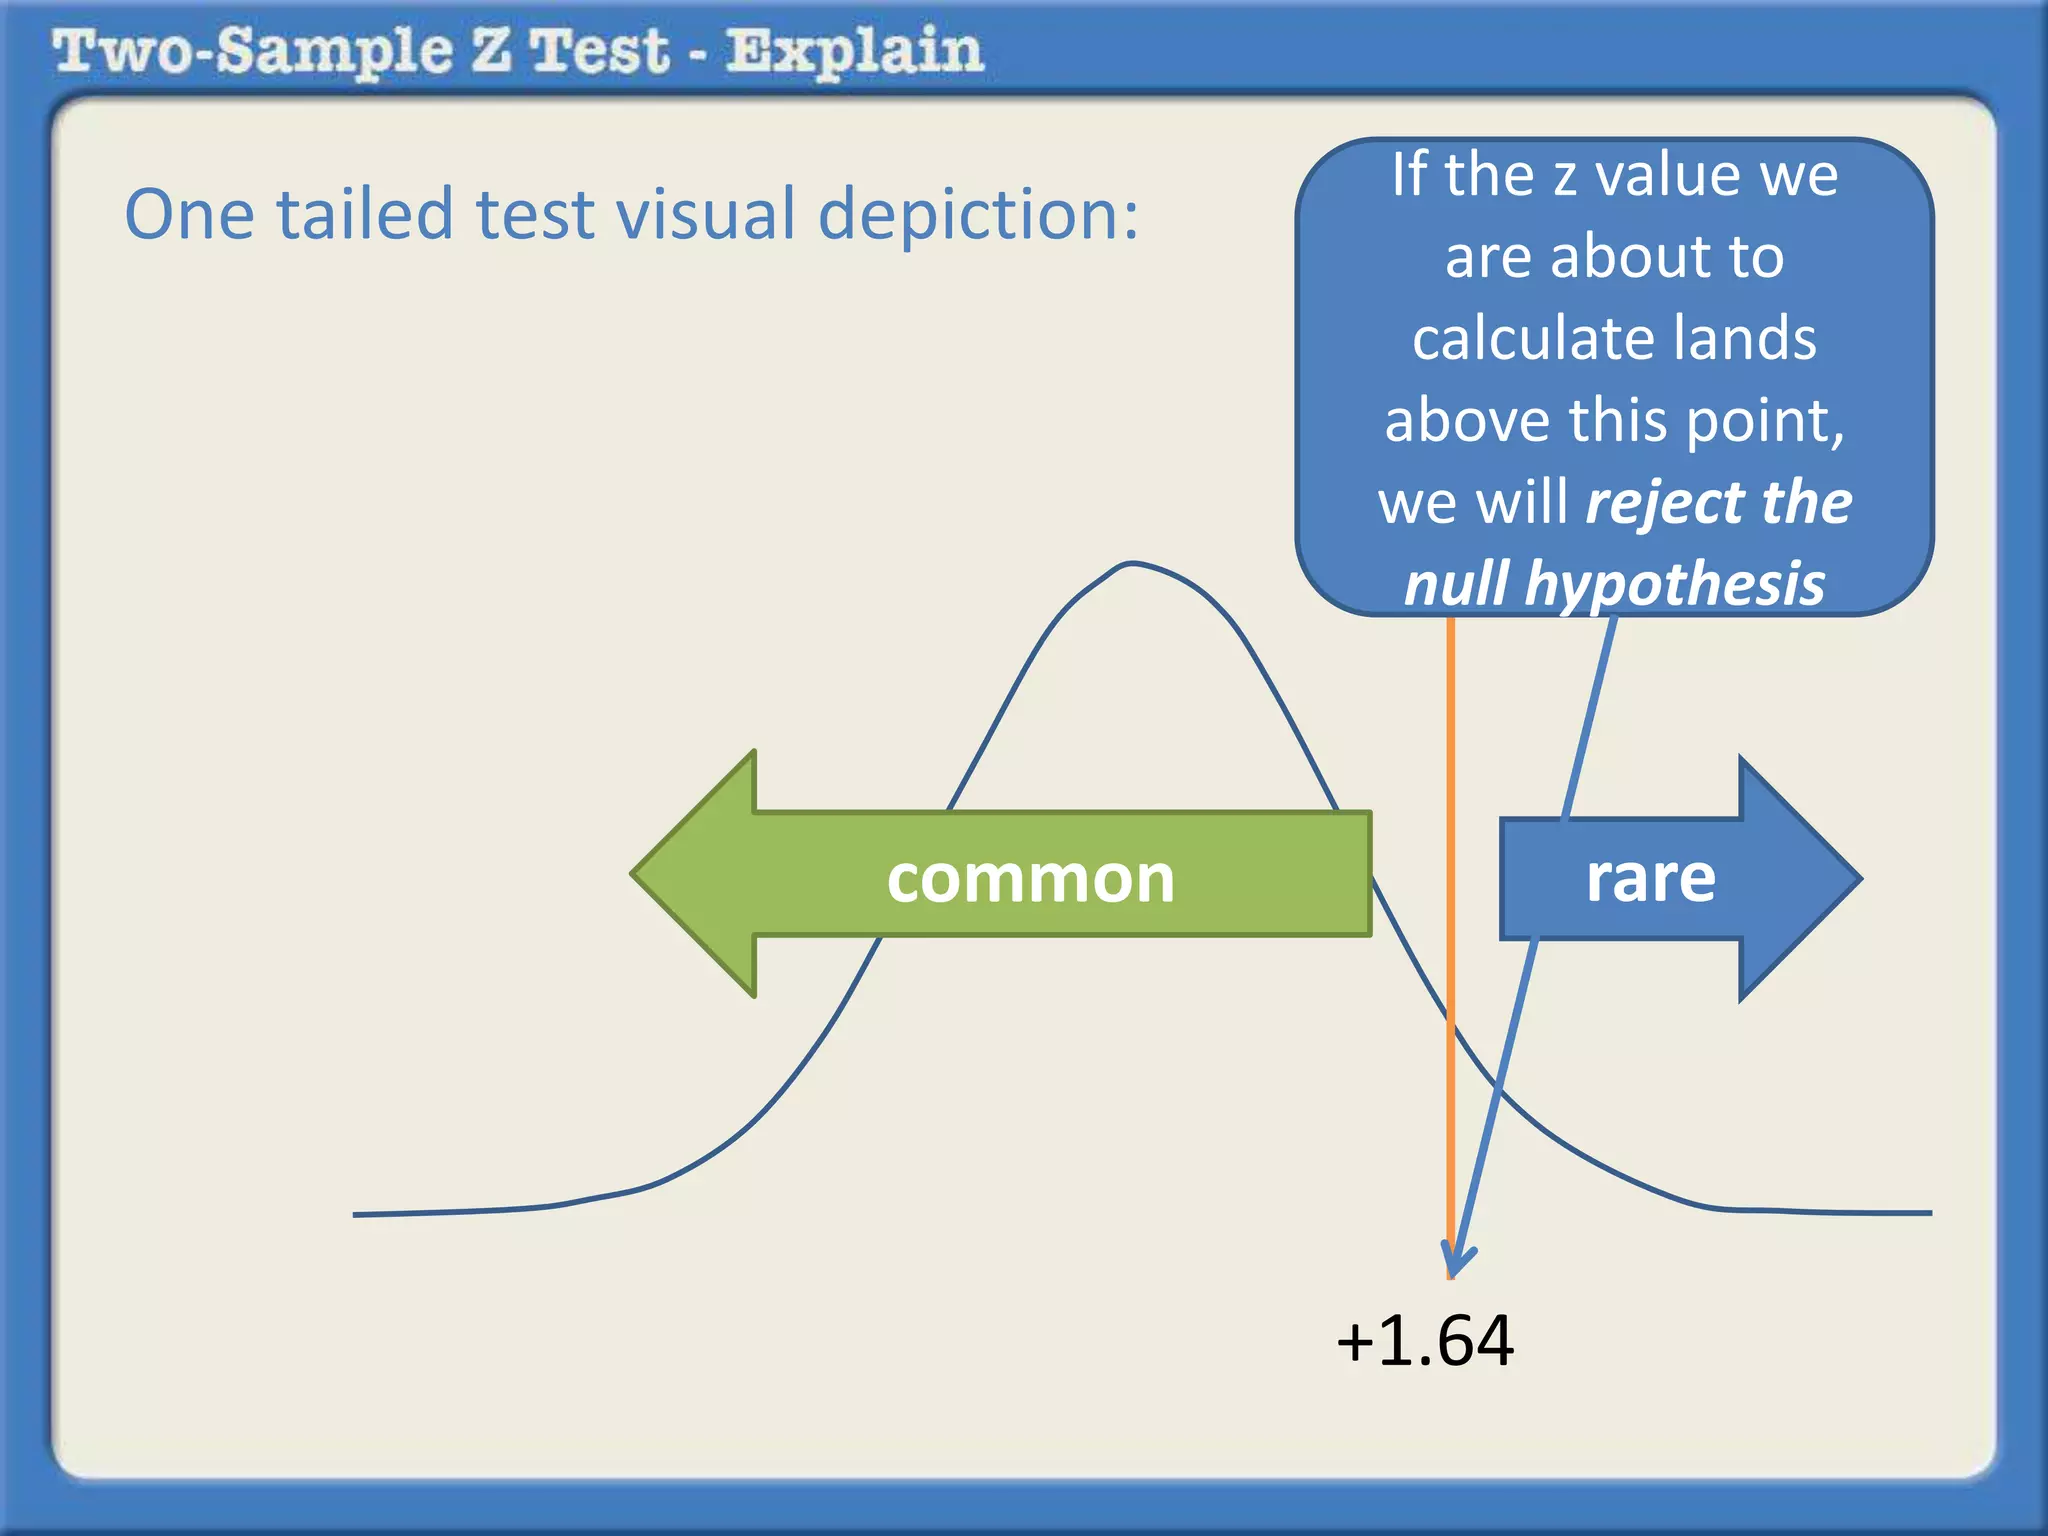
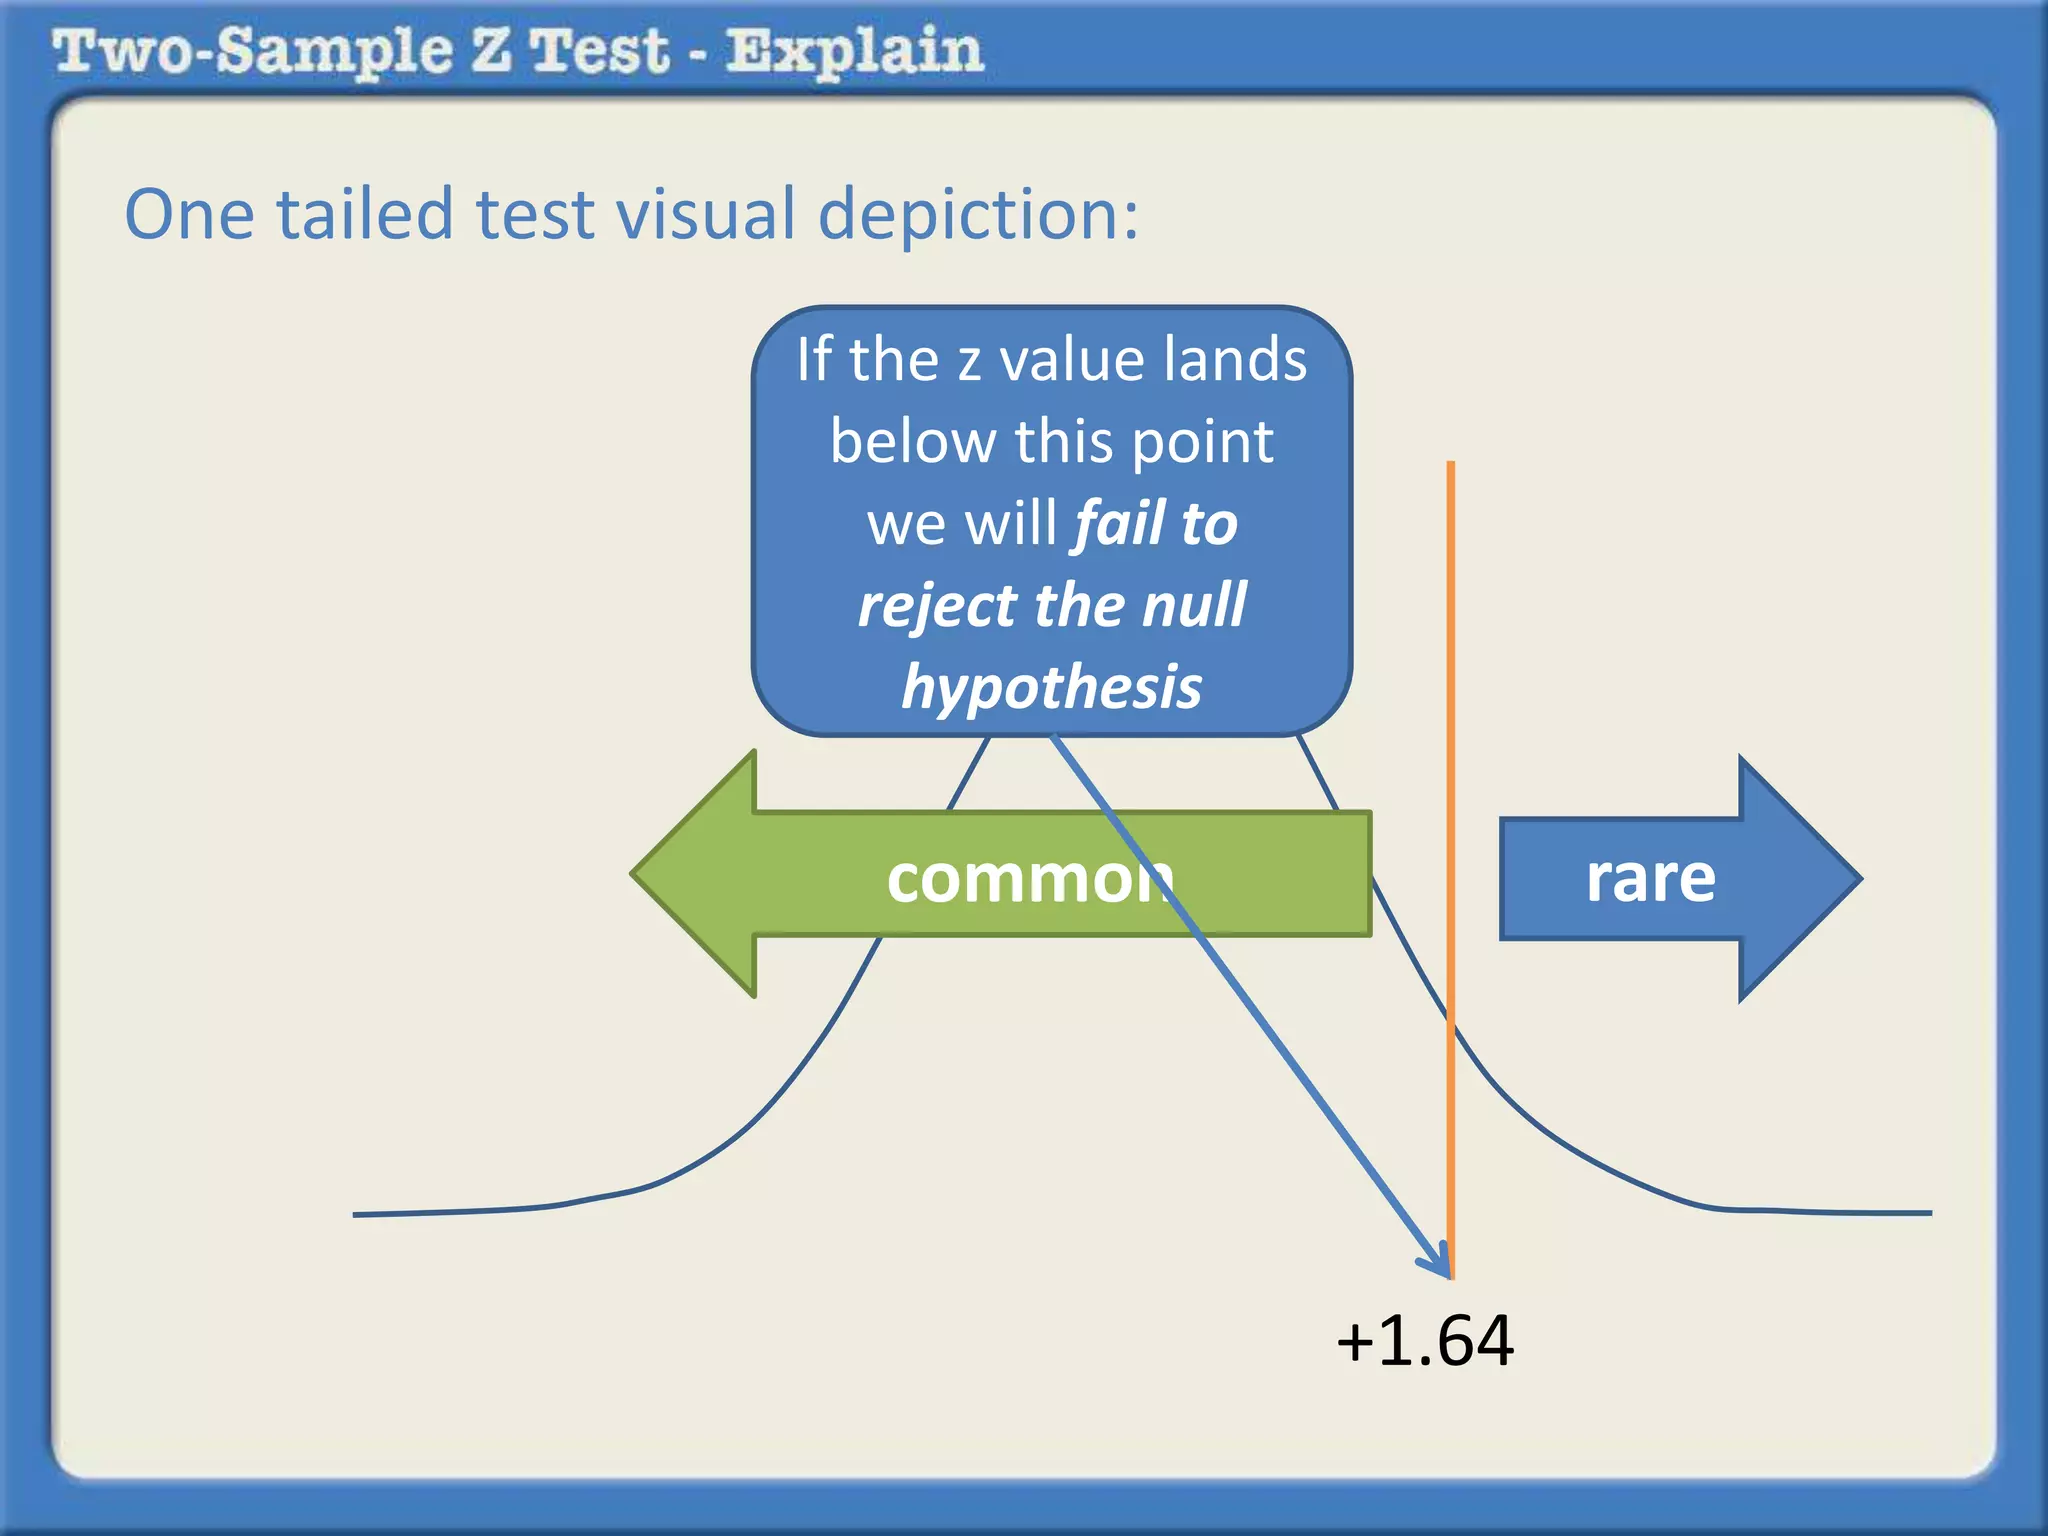
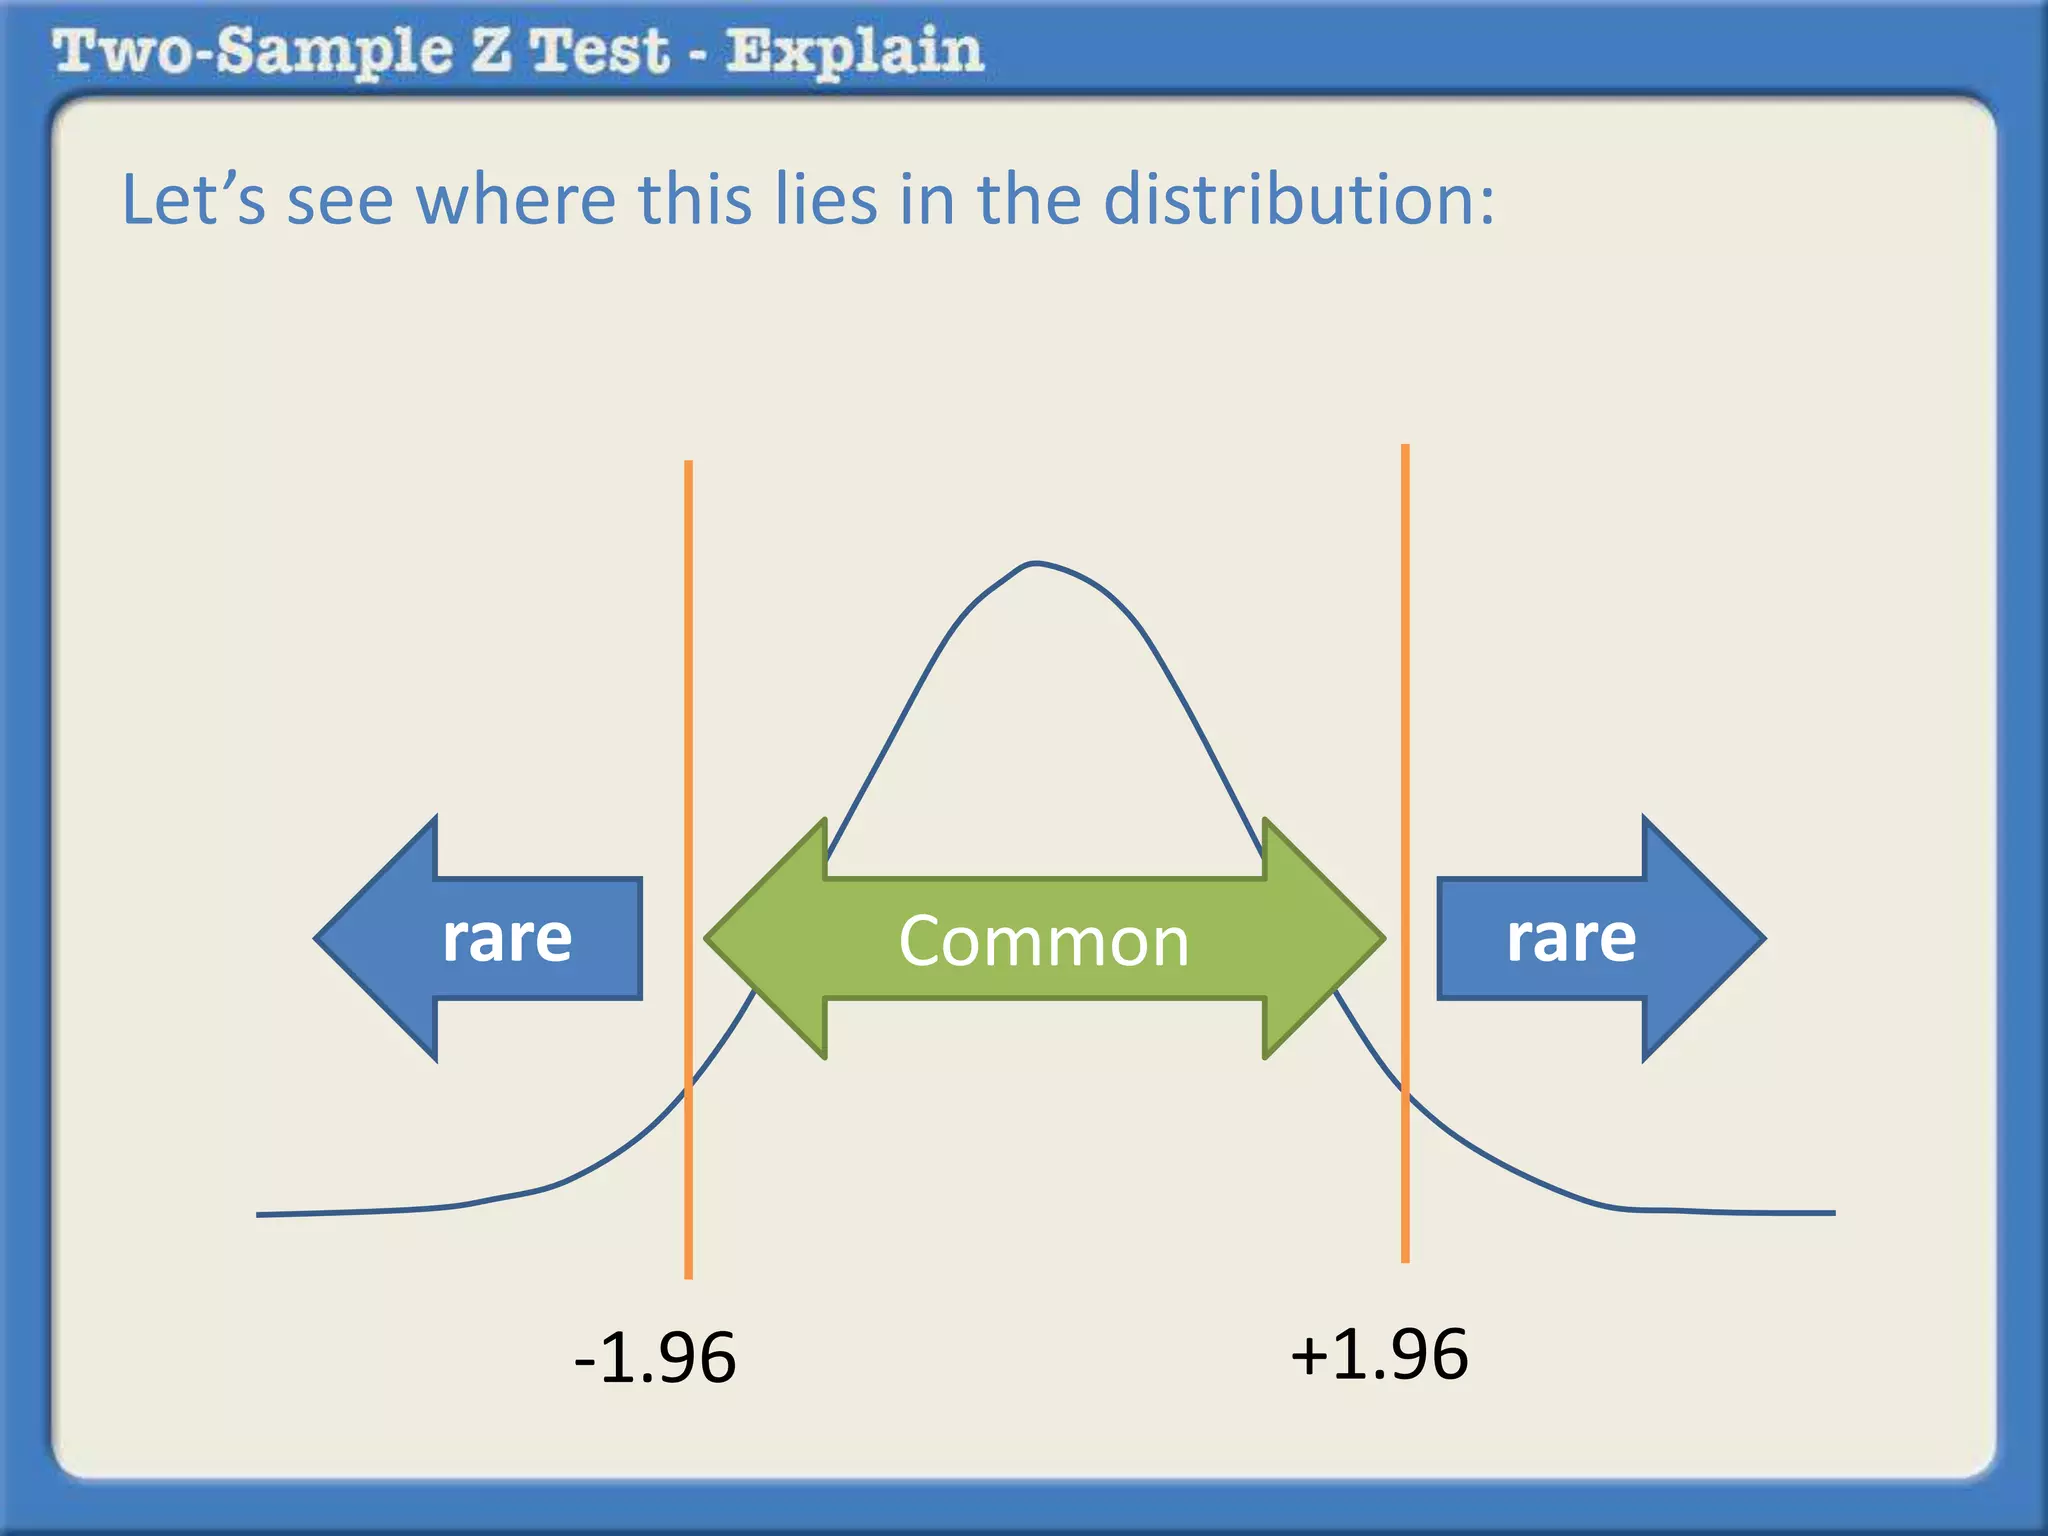
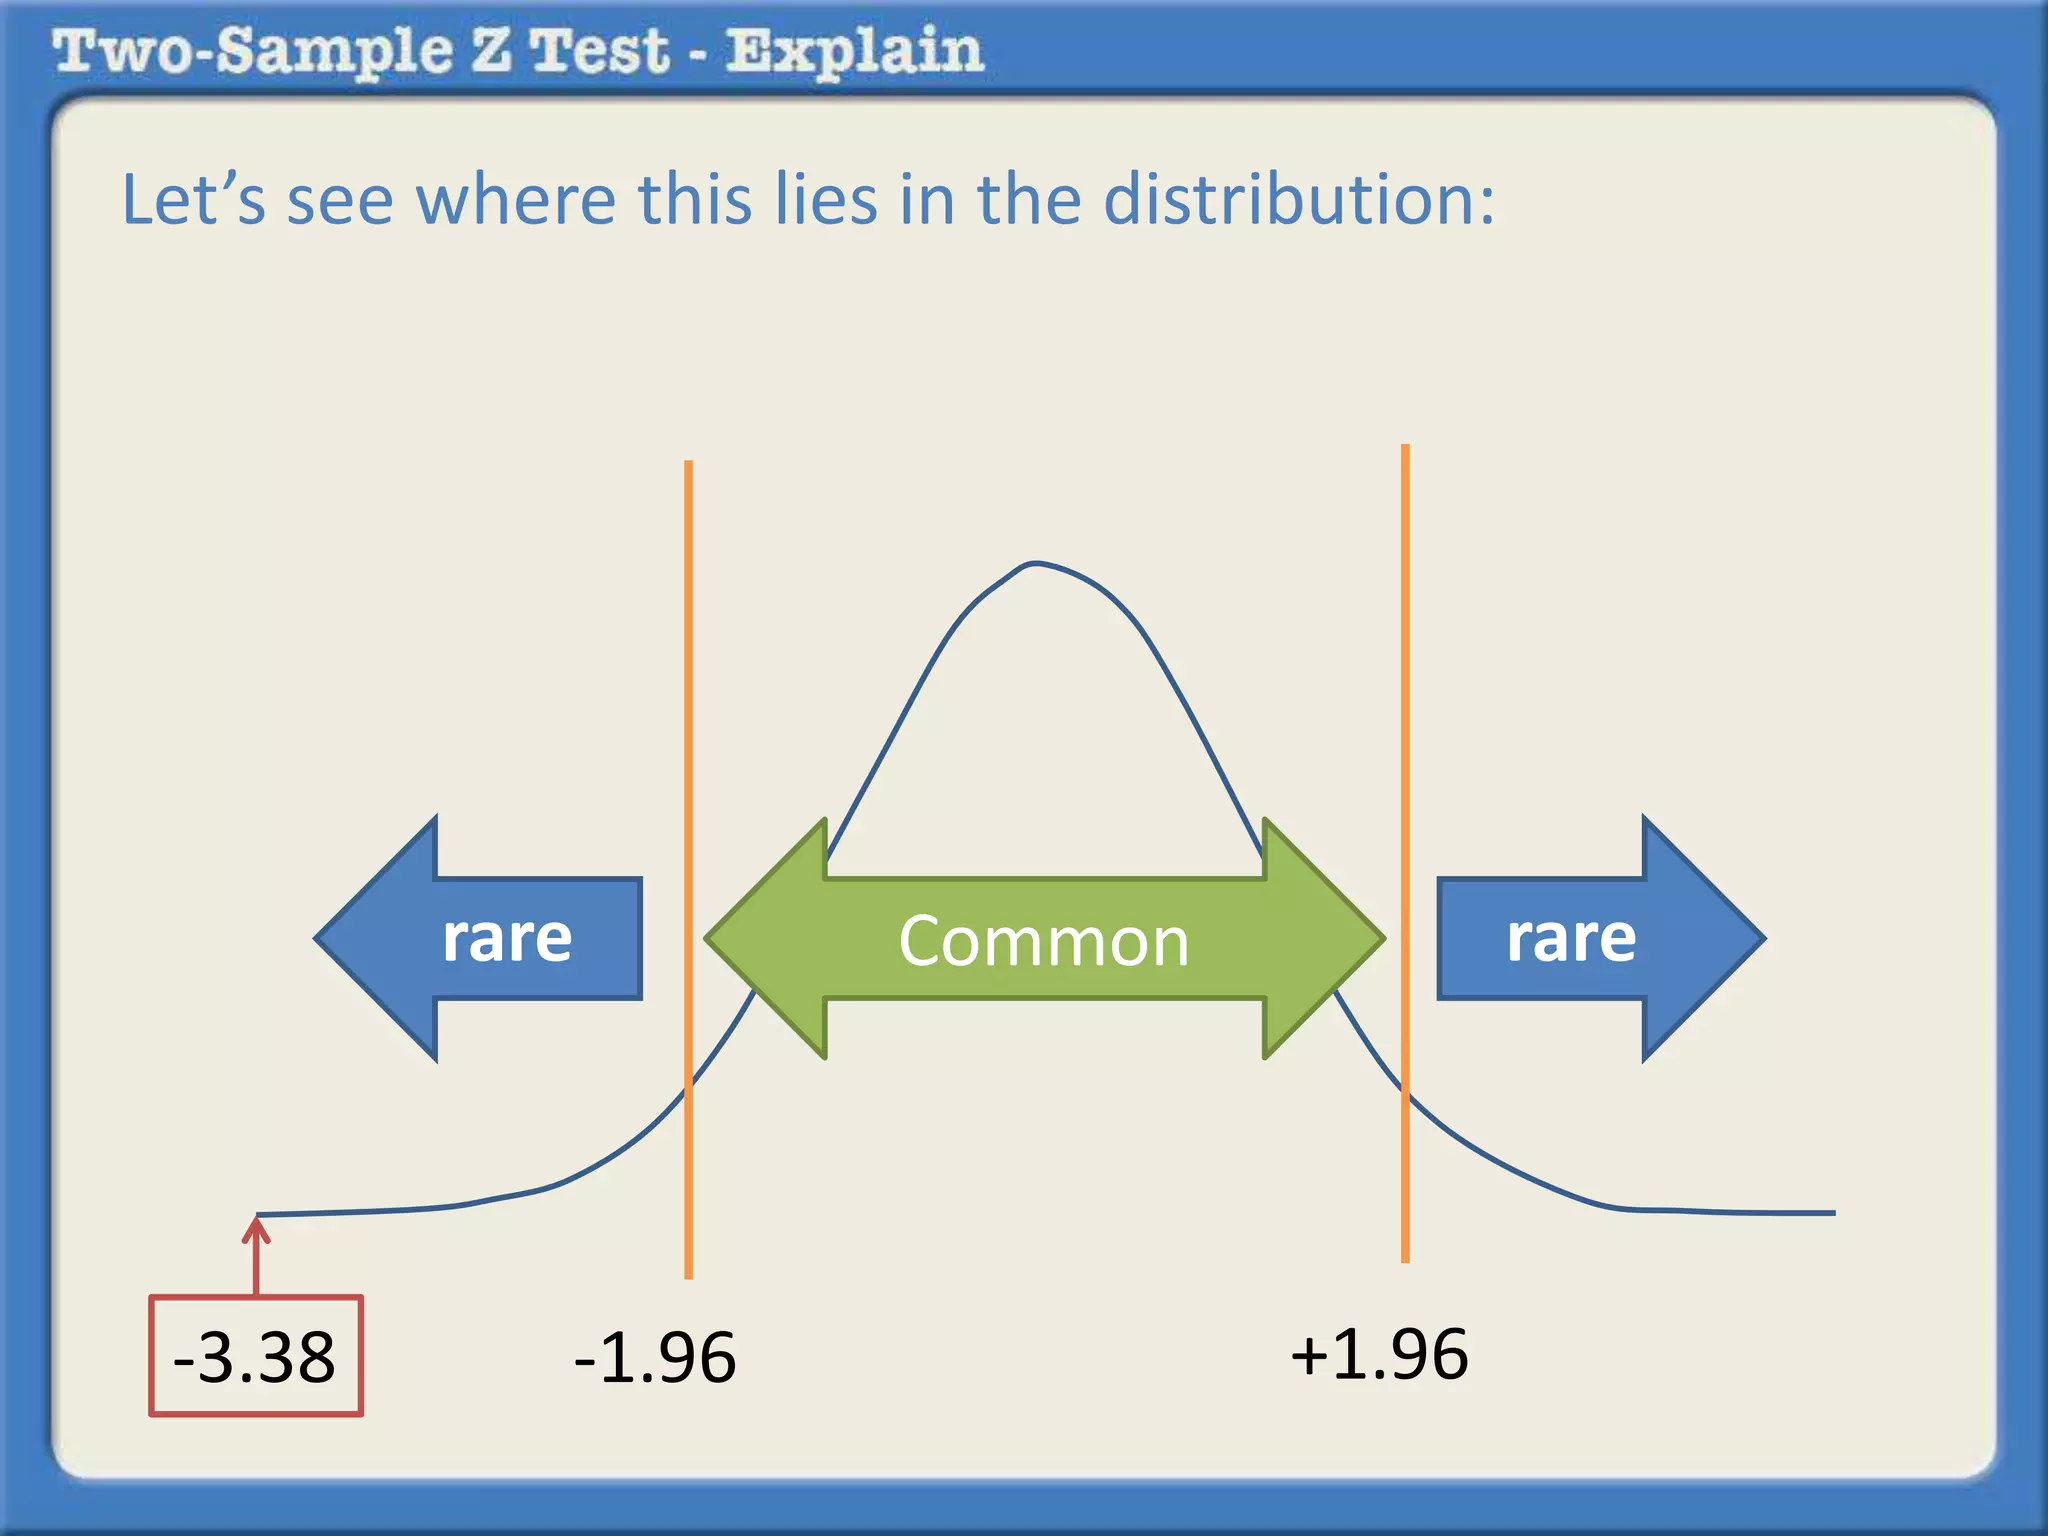
The alpha value makes it possible to determine what is
called the z critical. If the z statistic that we are about
to calculate from the data in the question is outside of
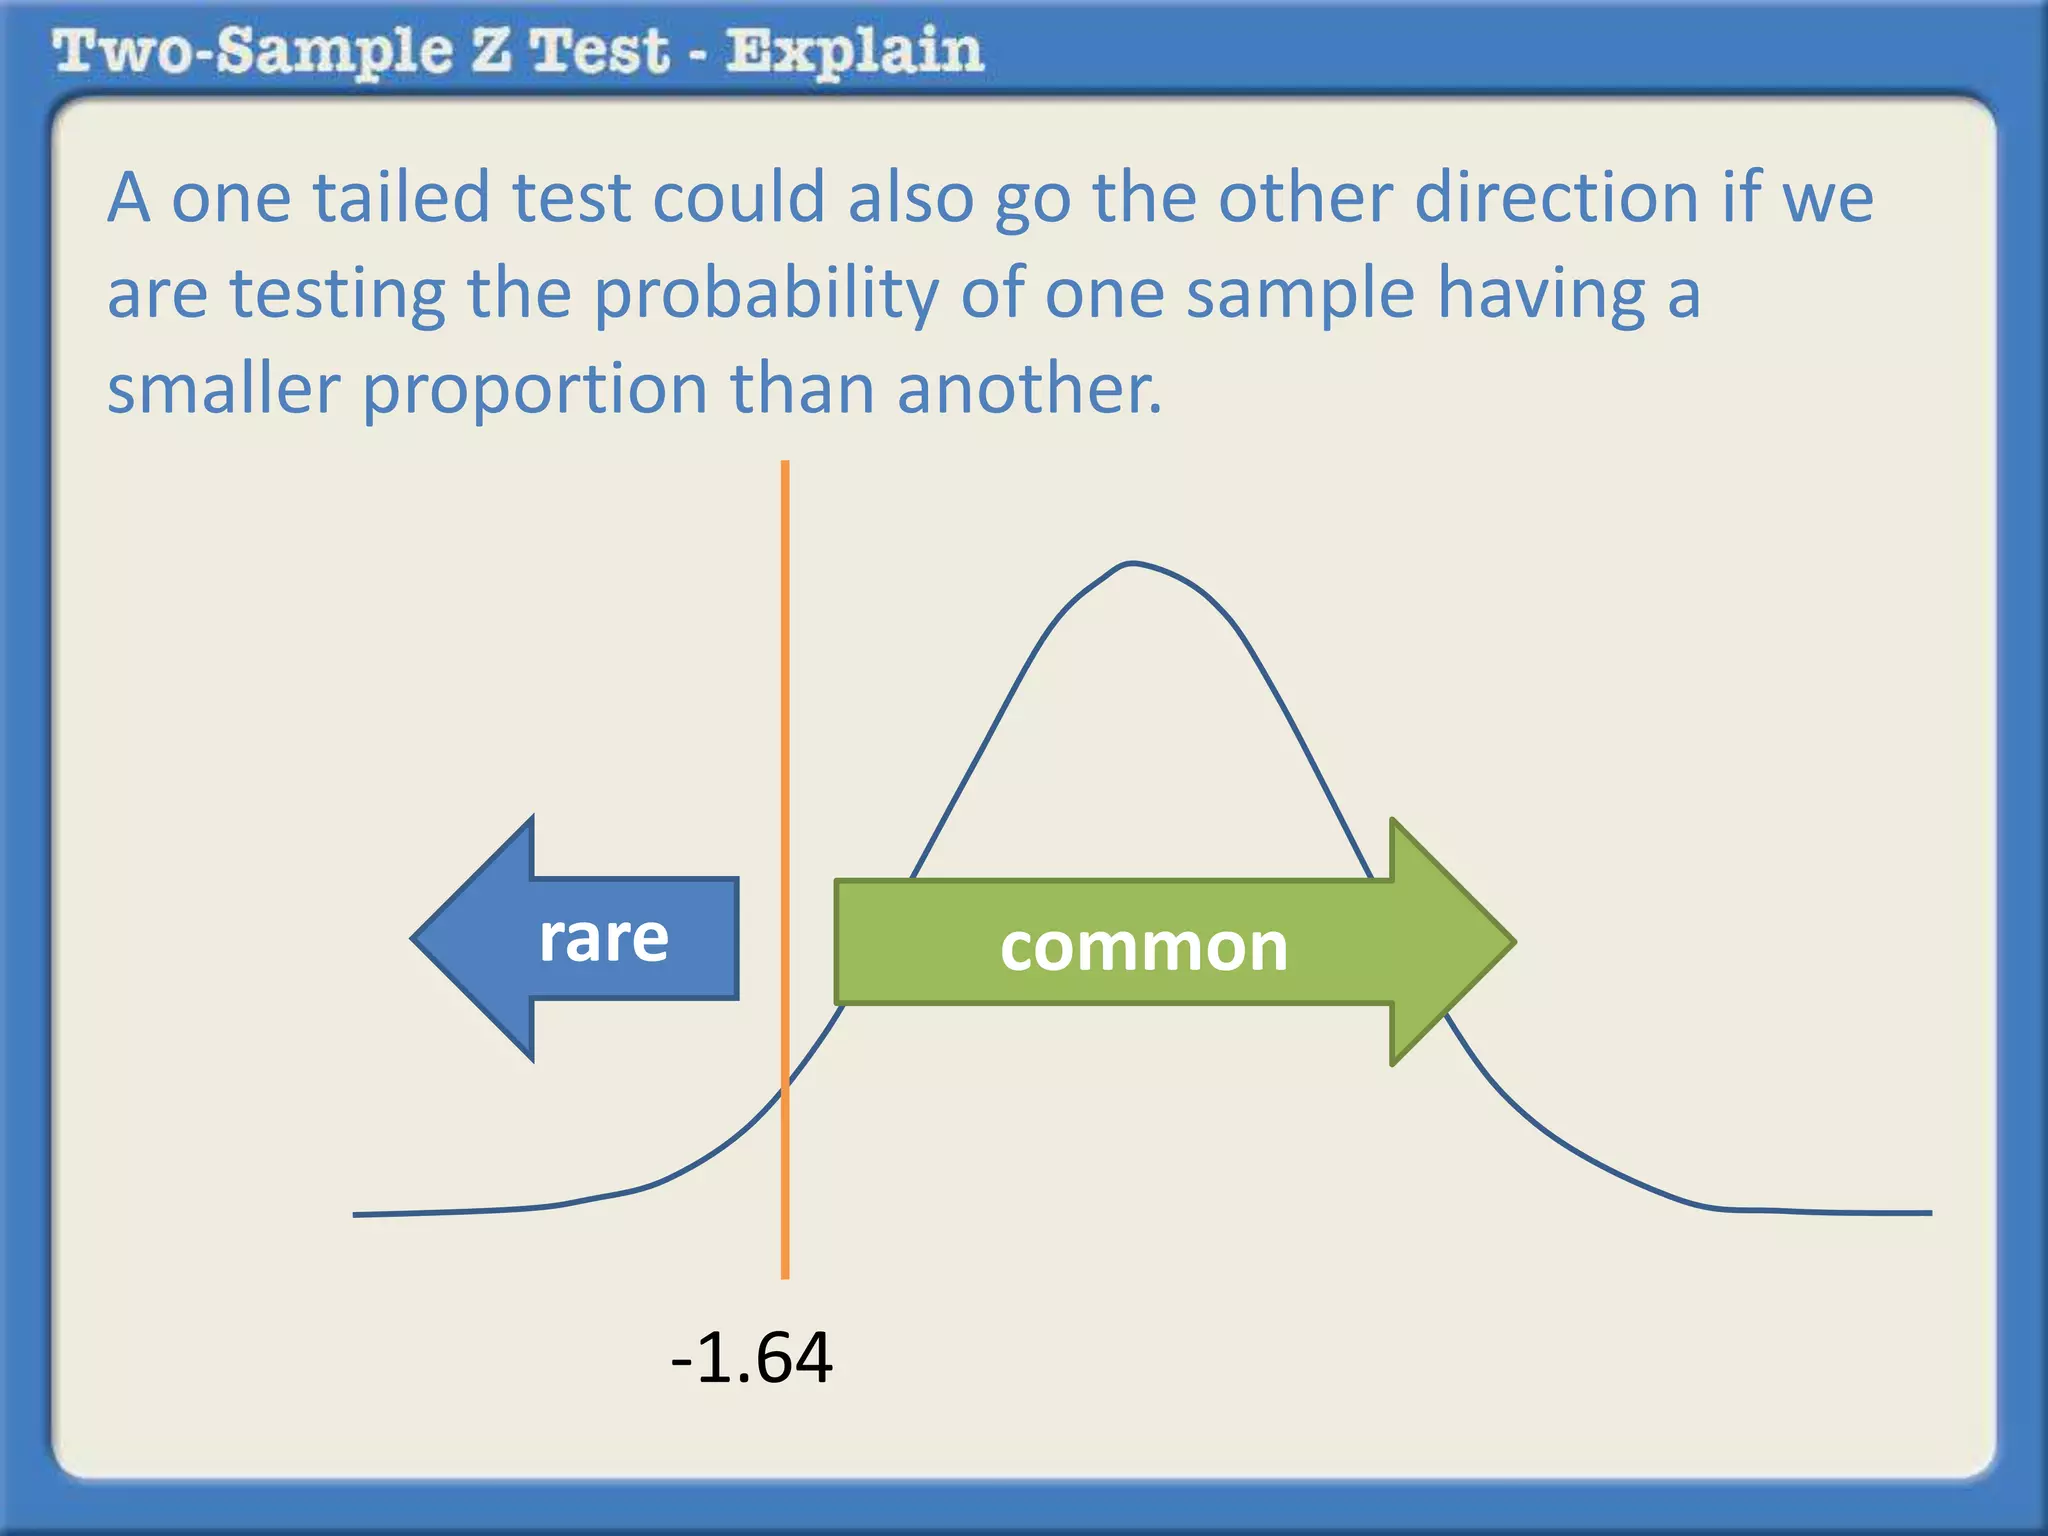
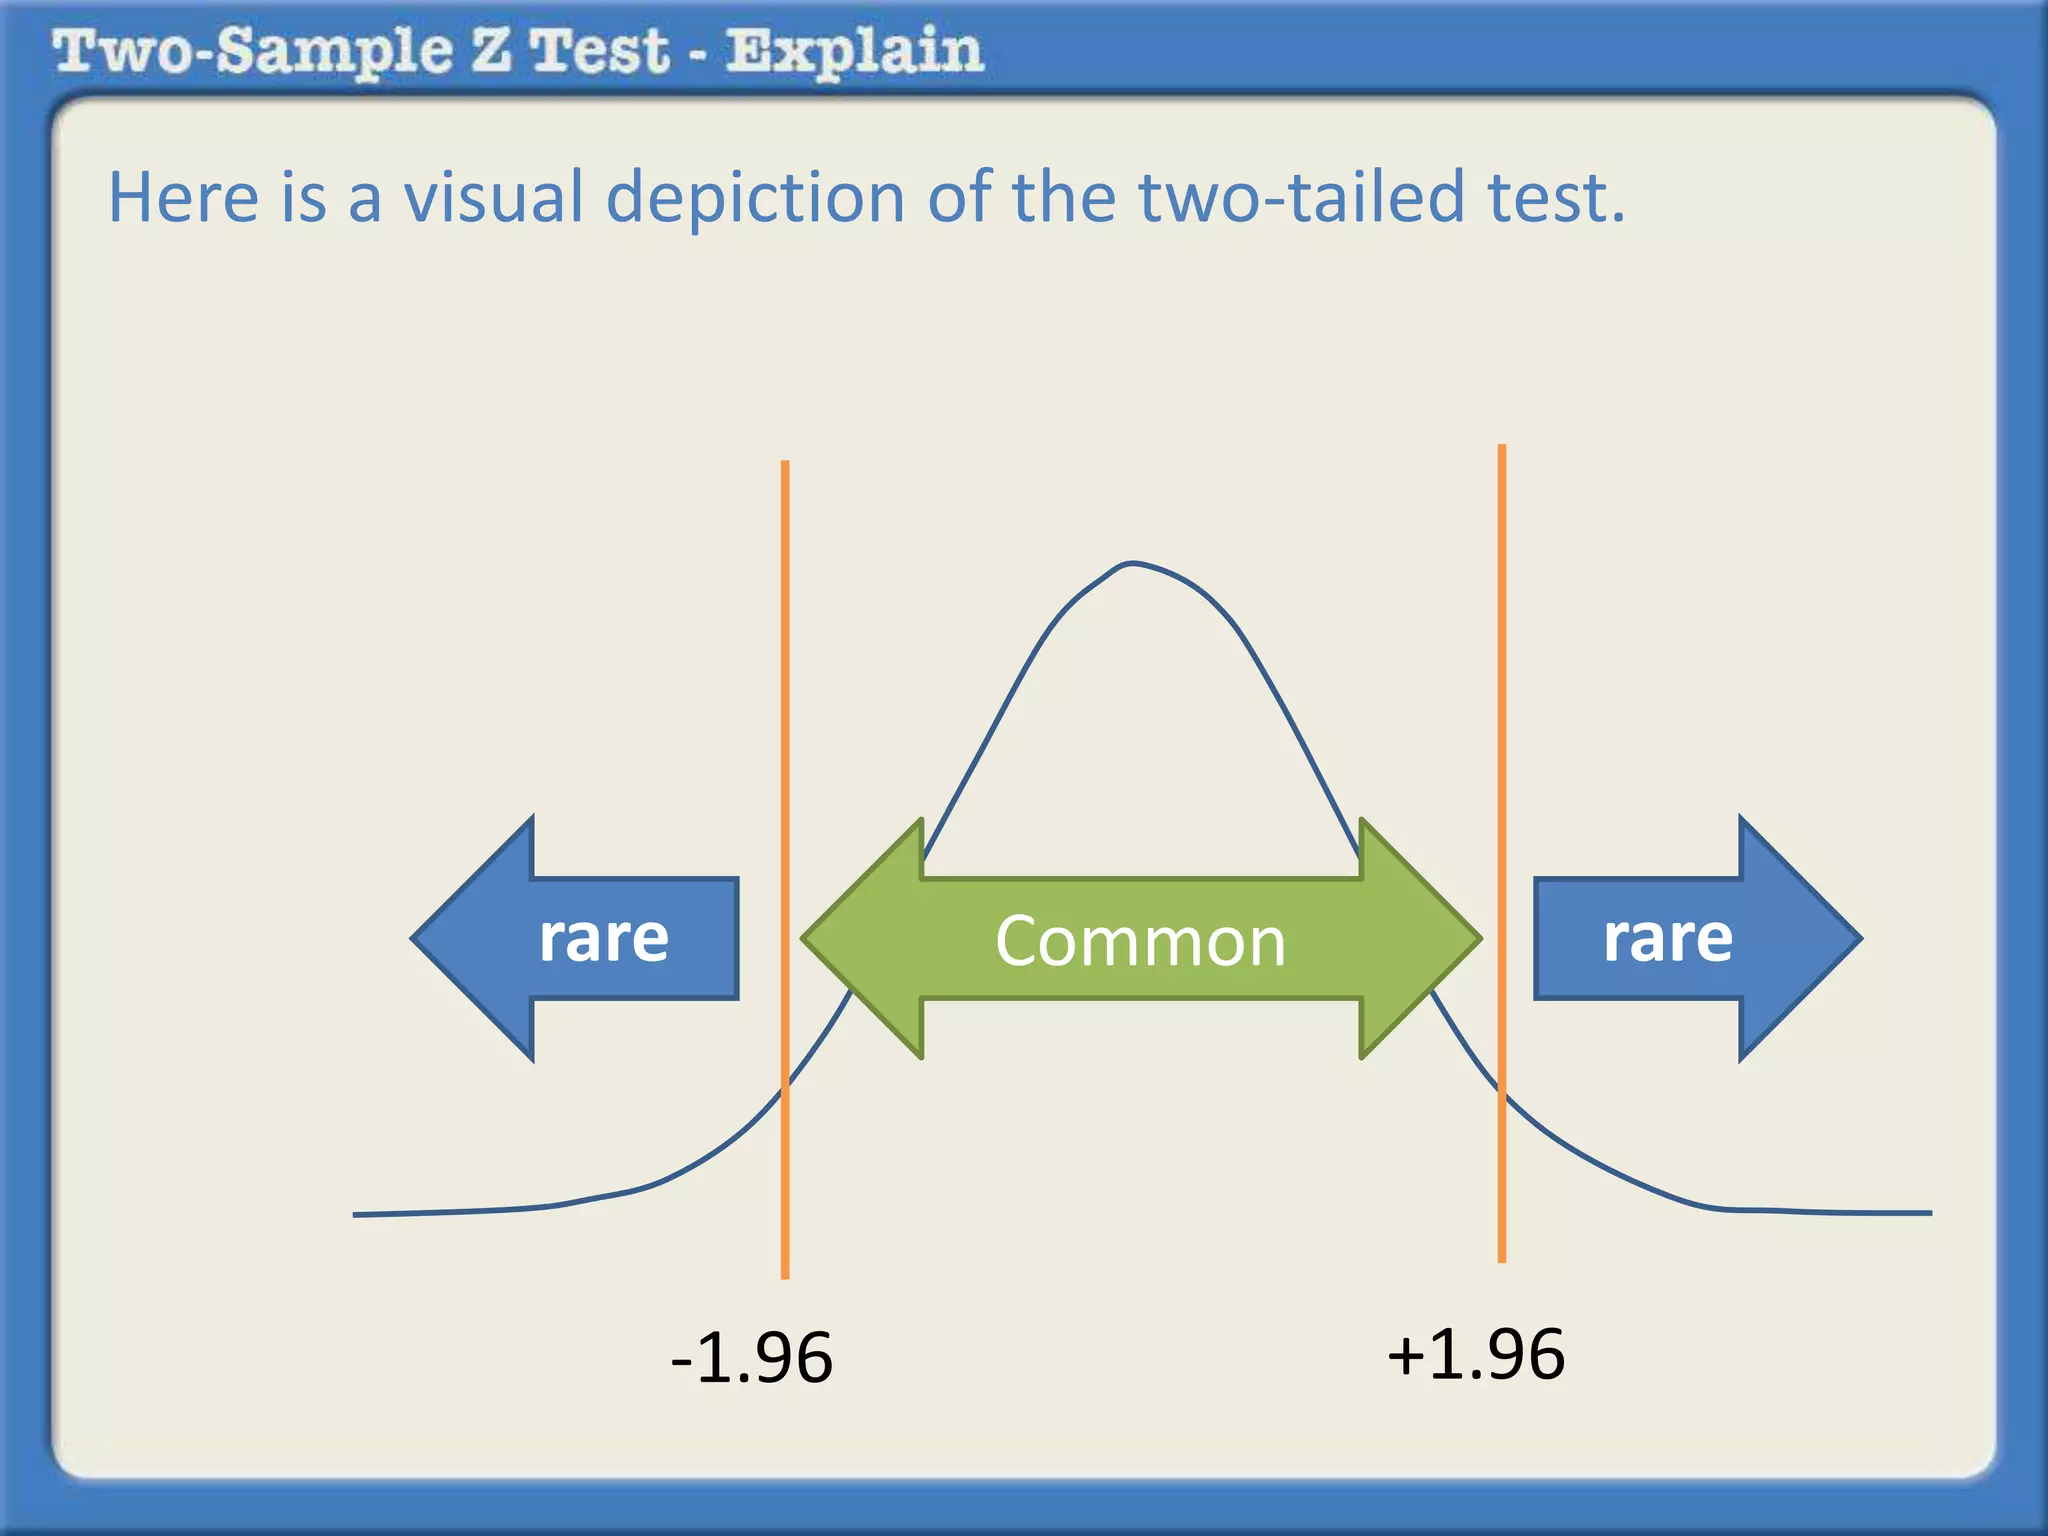
the z critical [for a one-tailed test (e.g., +1.64) or a two-
tailed test (e.g., -1.96 or +1.96]](https://image.slidesharecdn.com/calculatingatwo-sampleztestbyhand-140926153511-phpapp02/75/Calculating-a-two-sample-z-test-by-hand-11-2048.jpg)

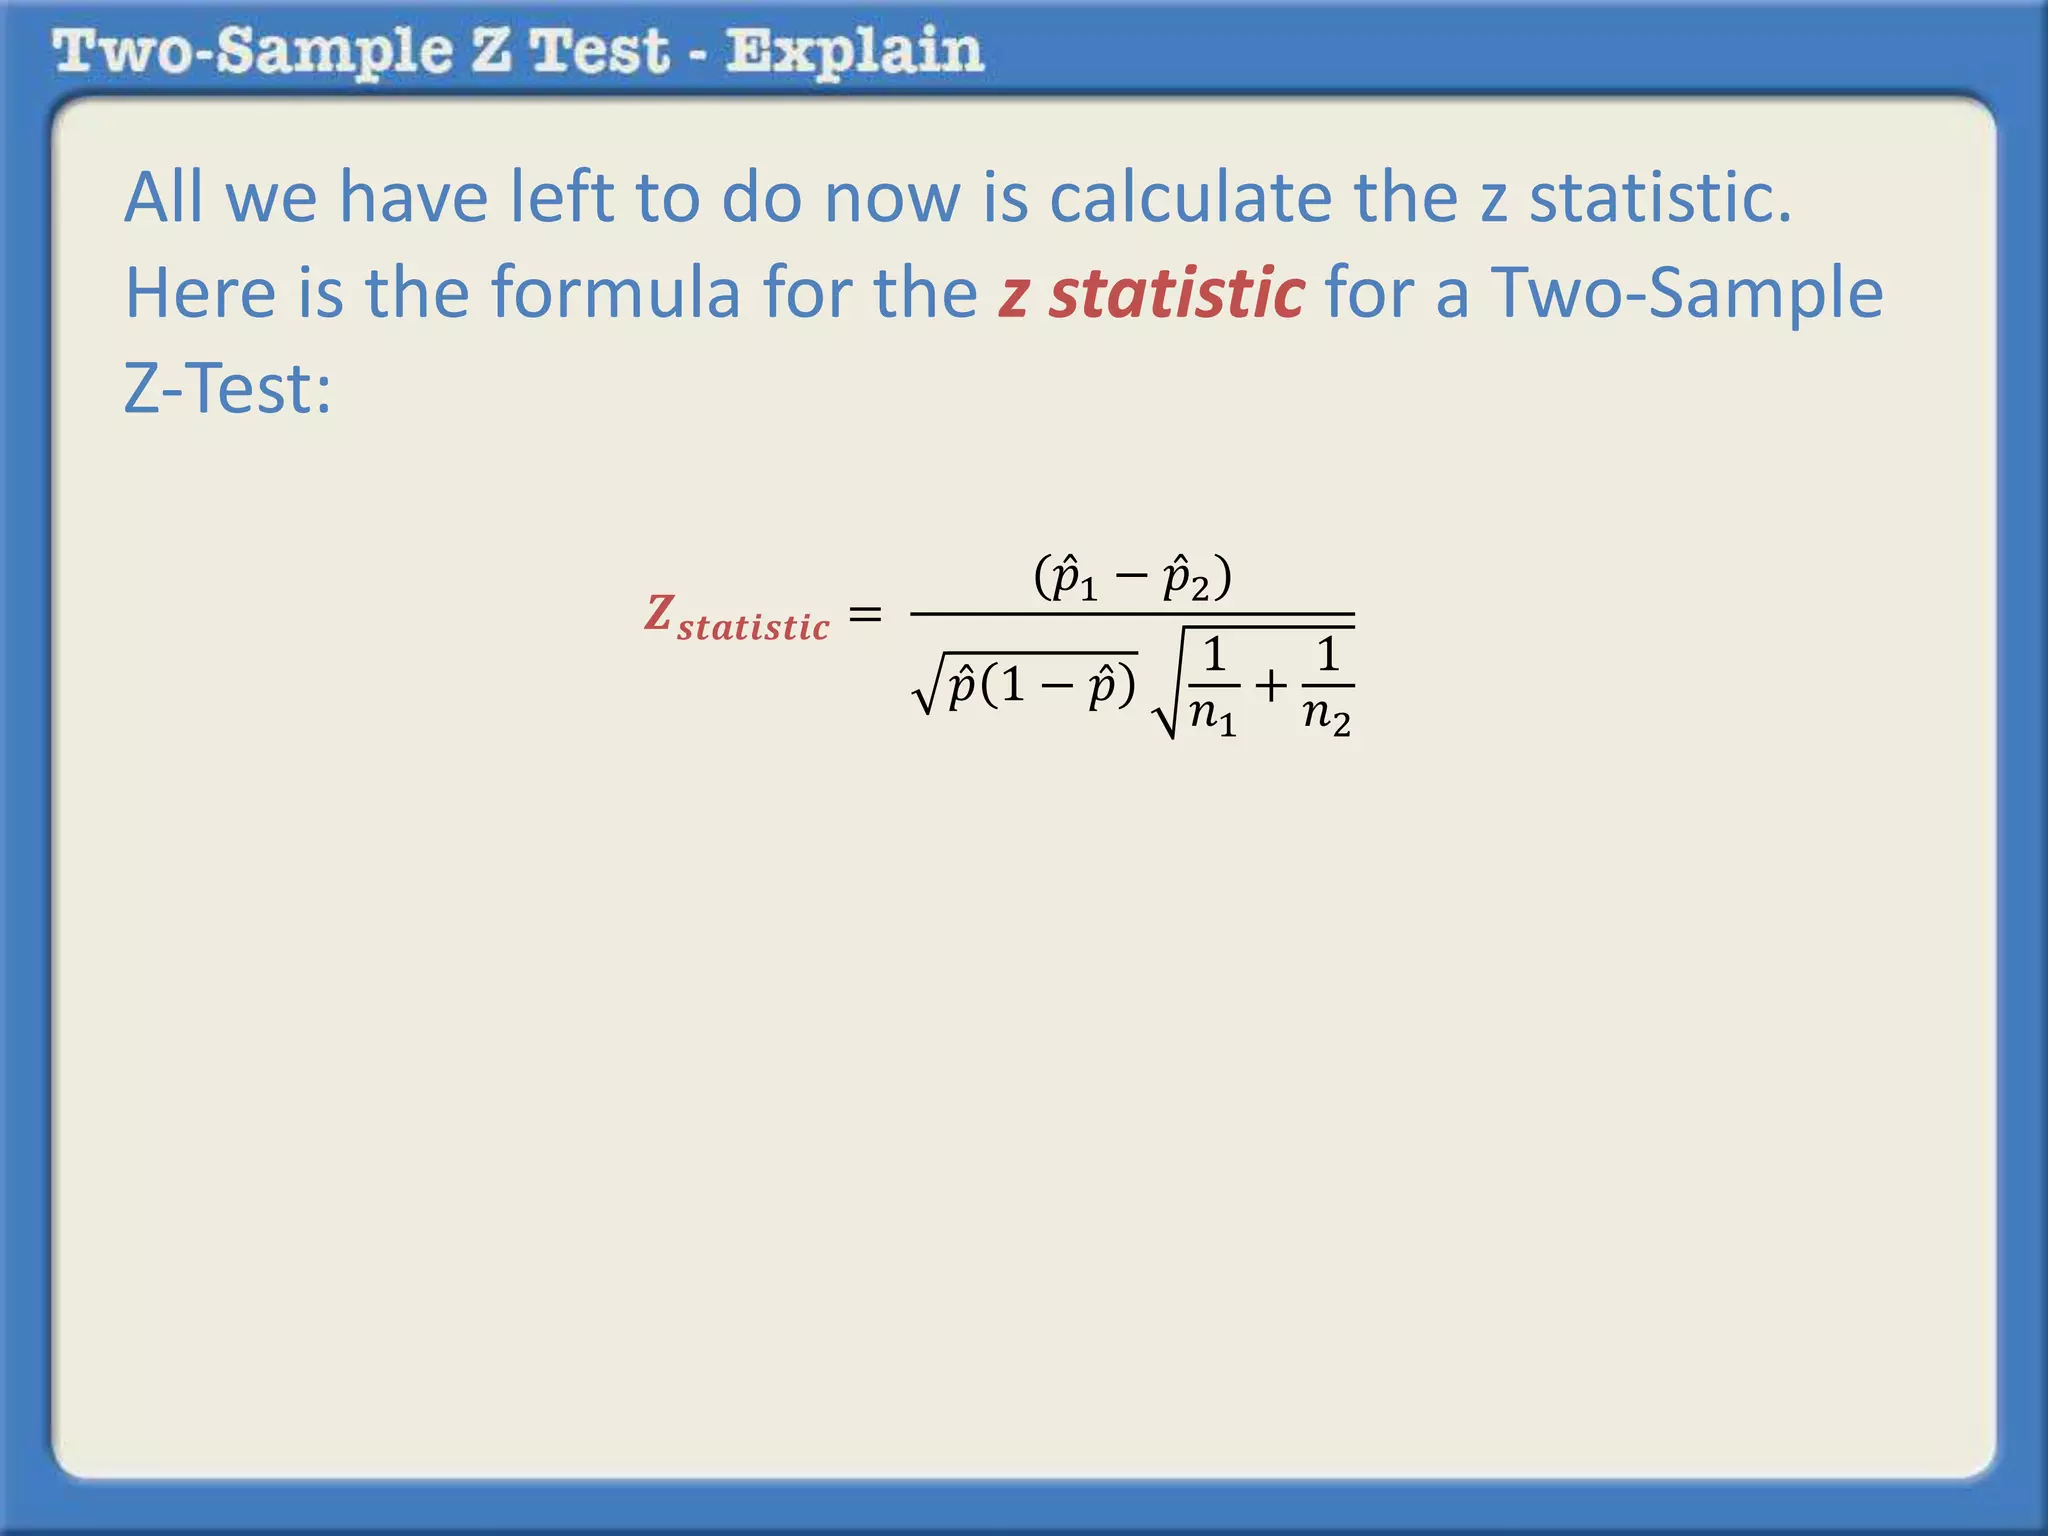
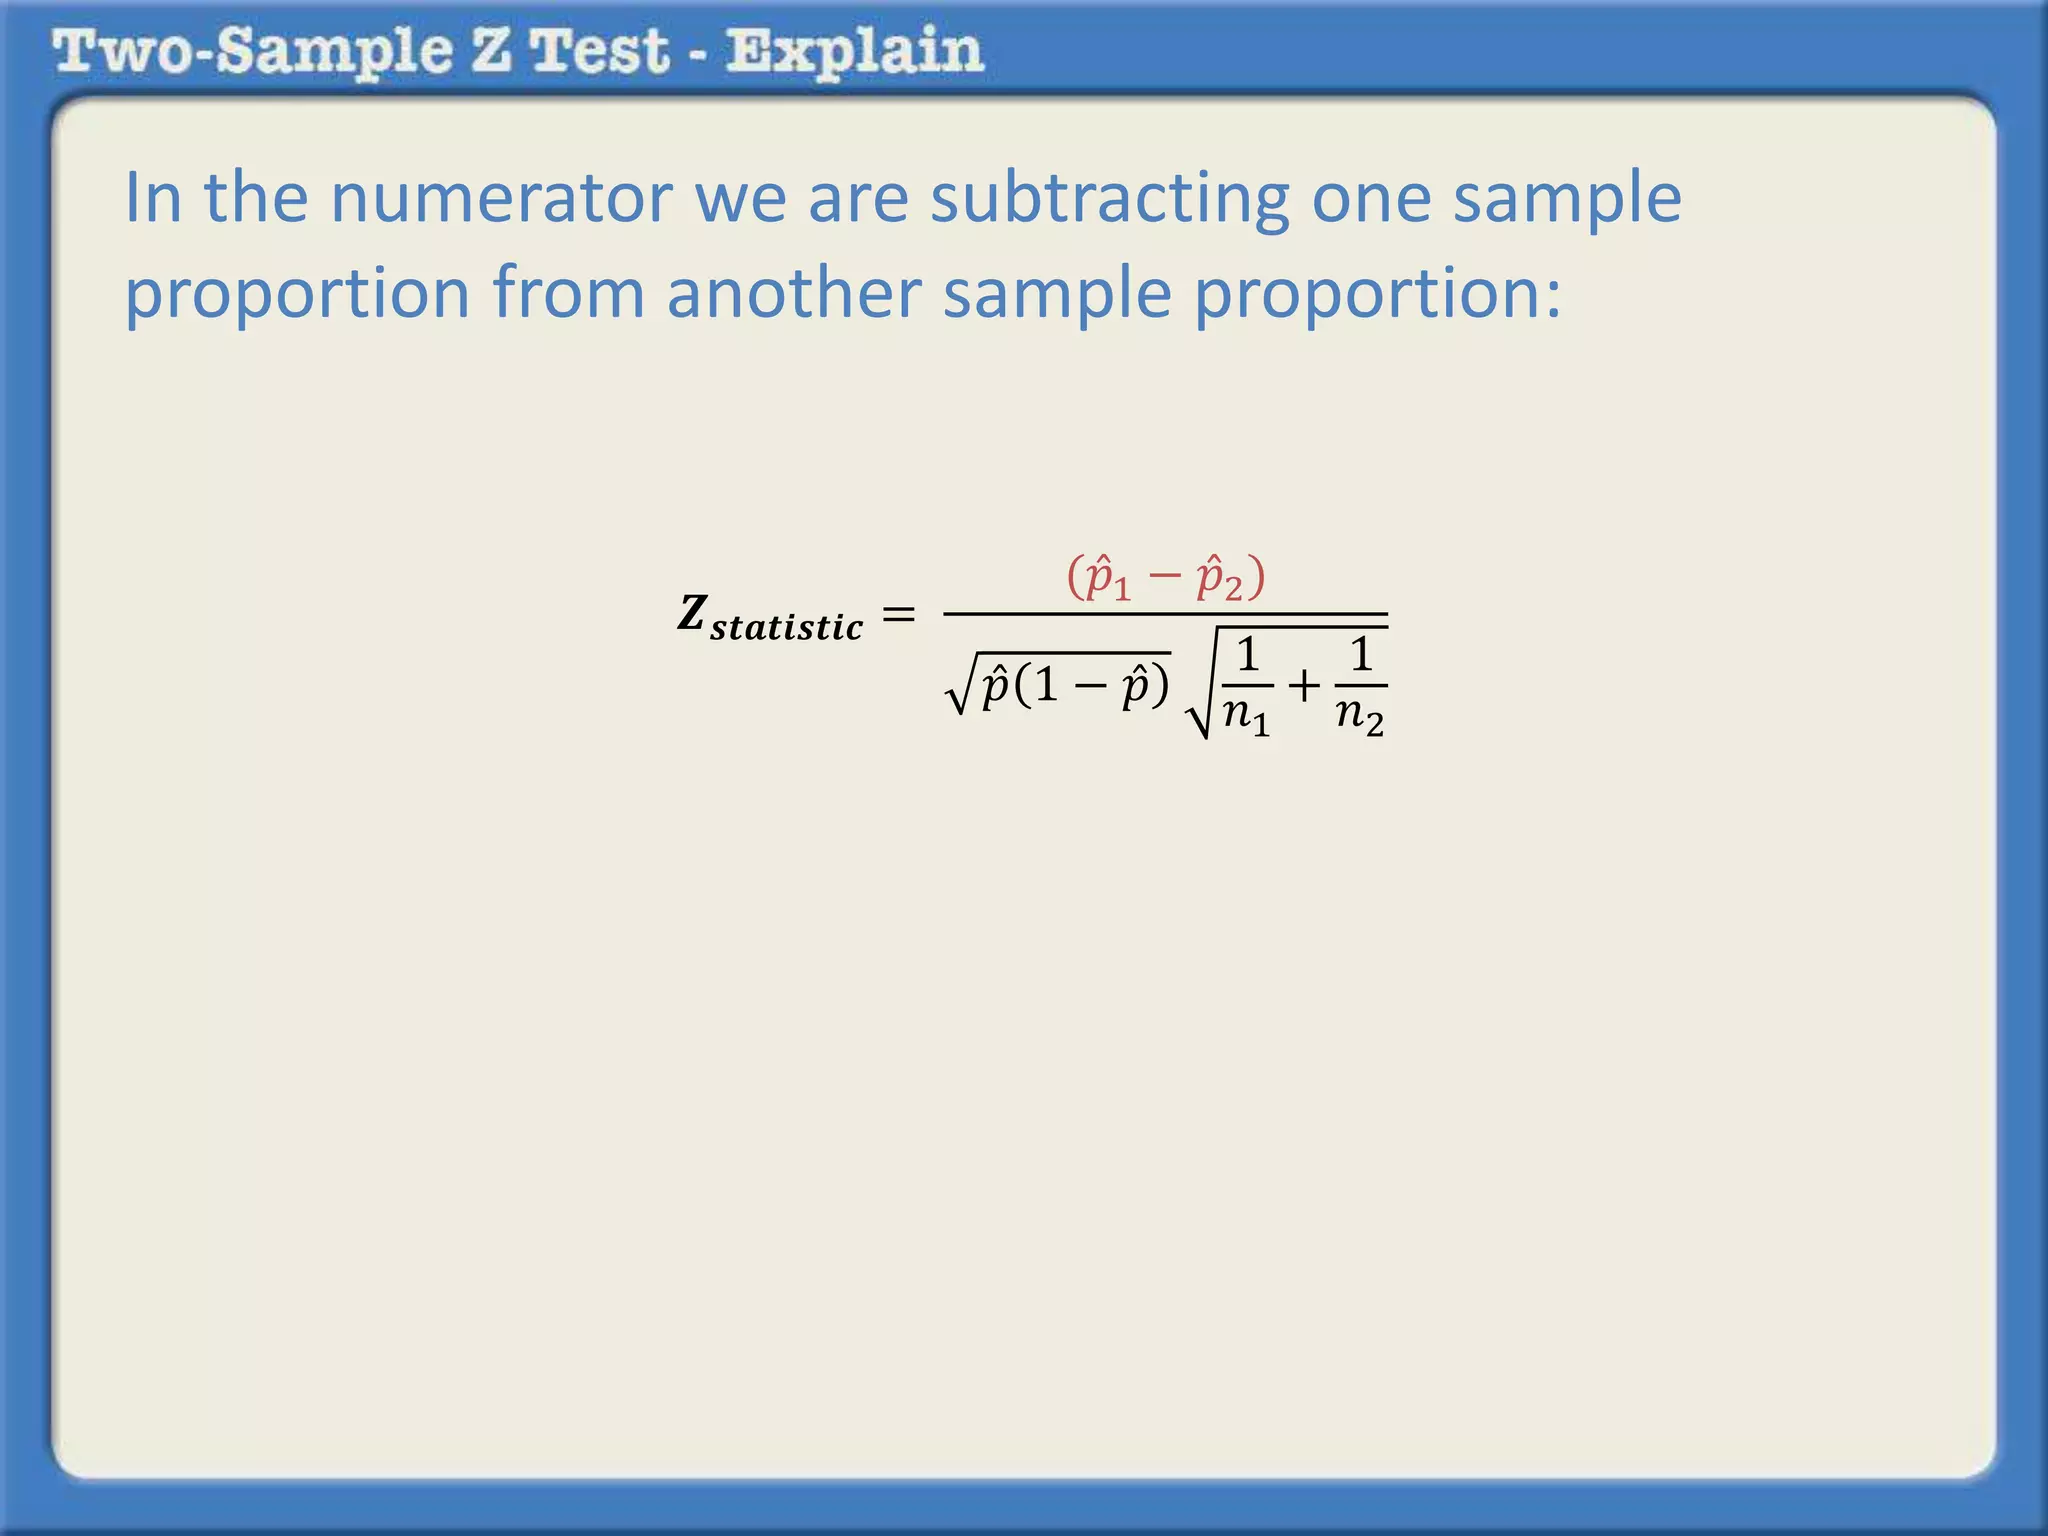
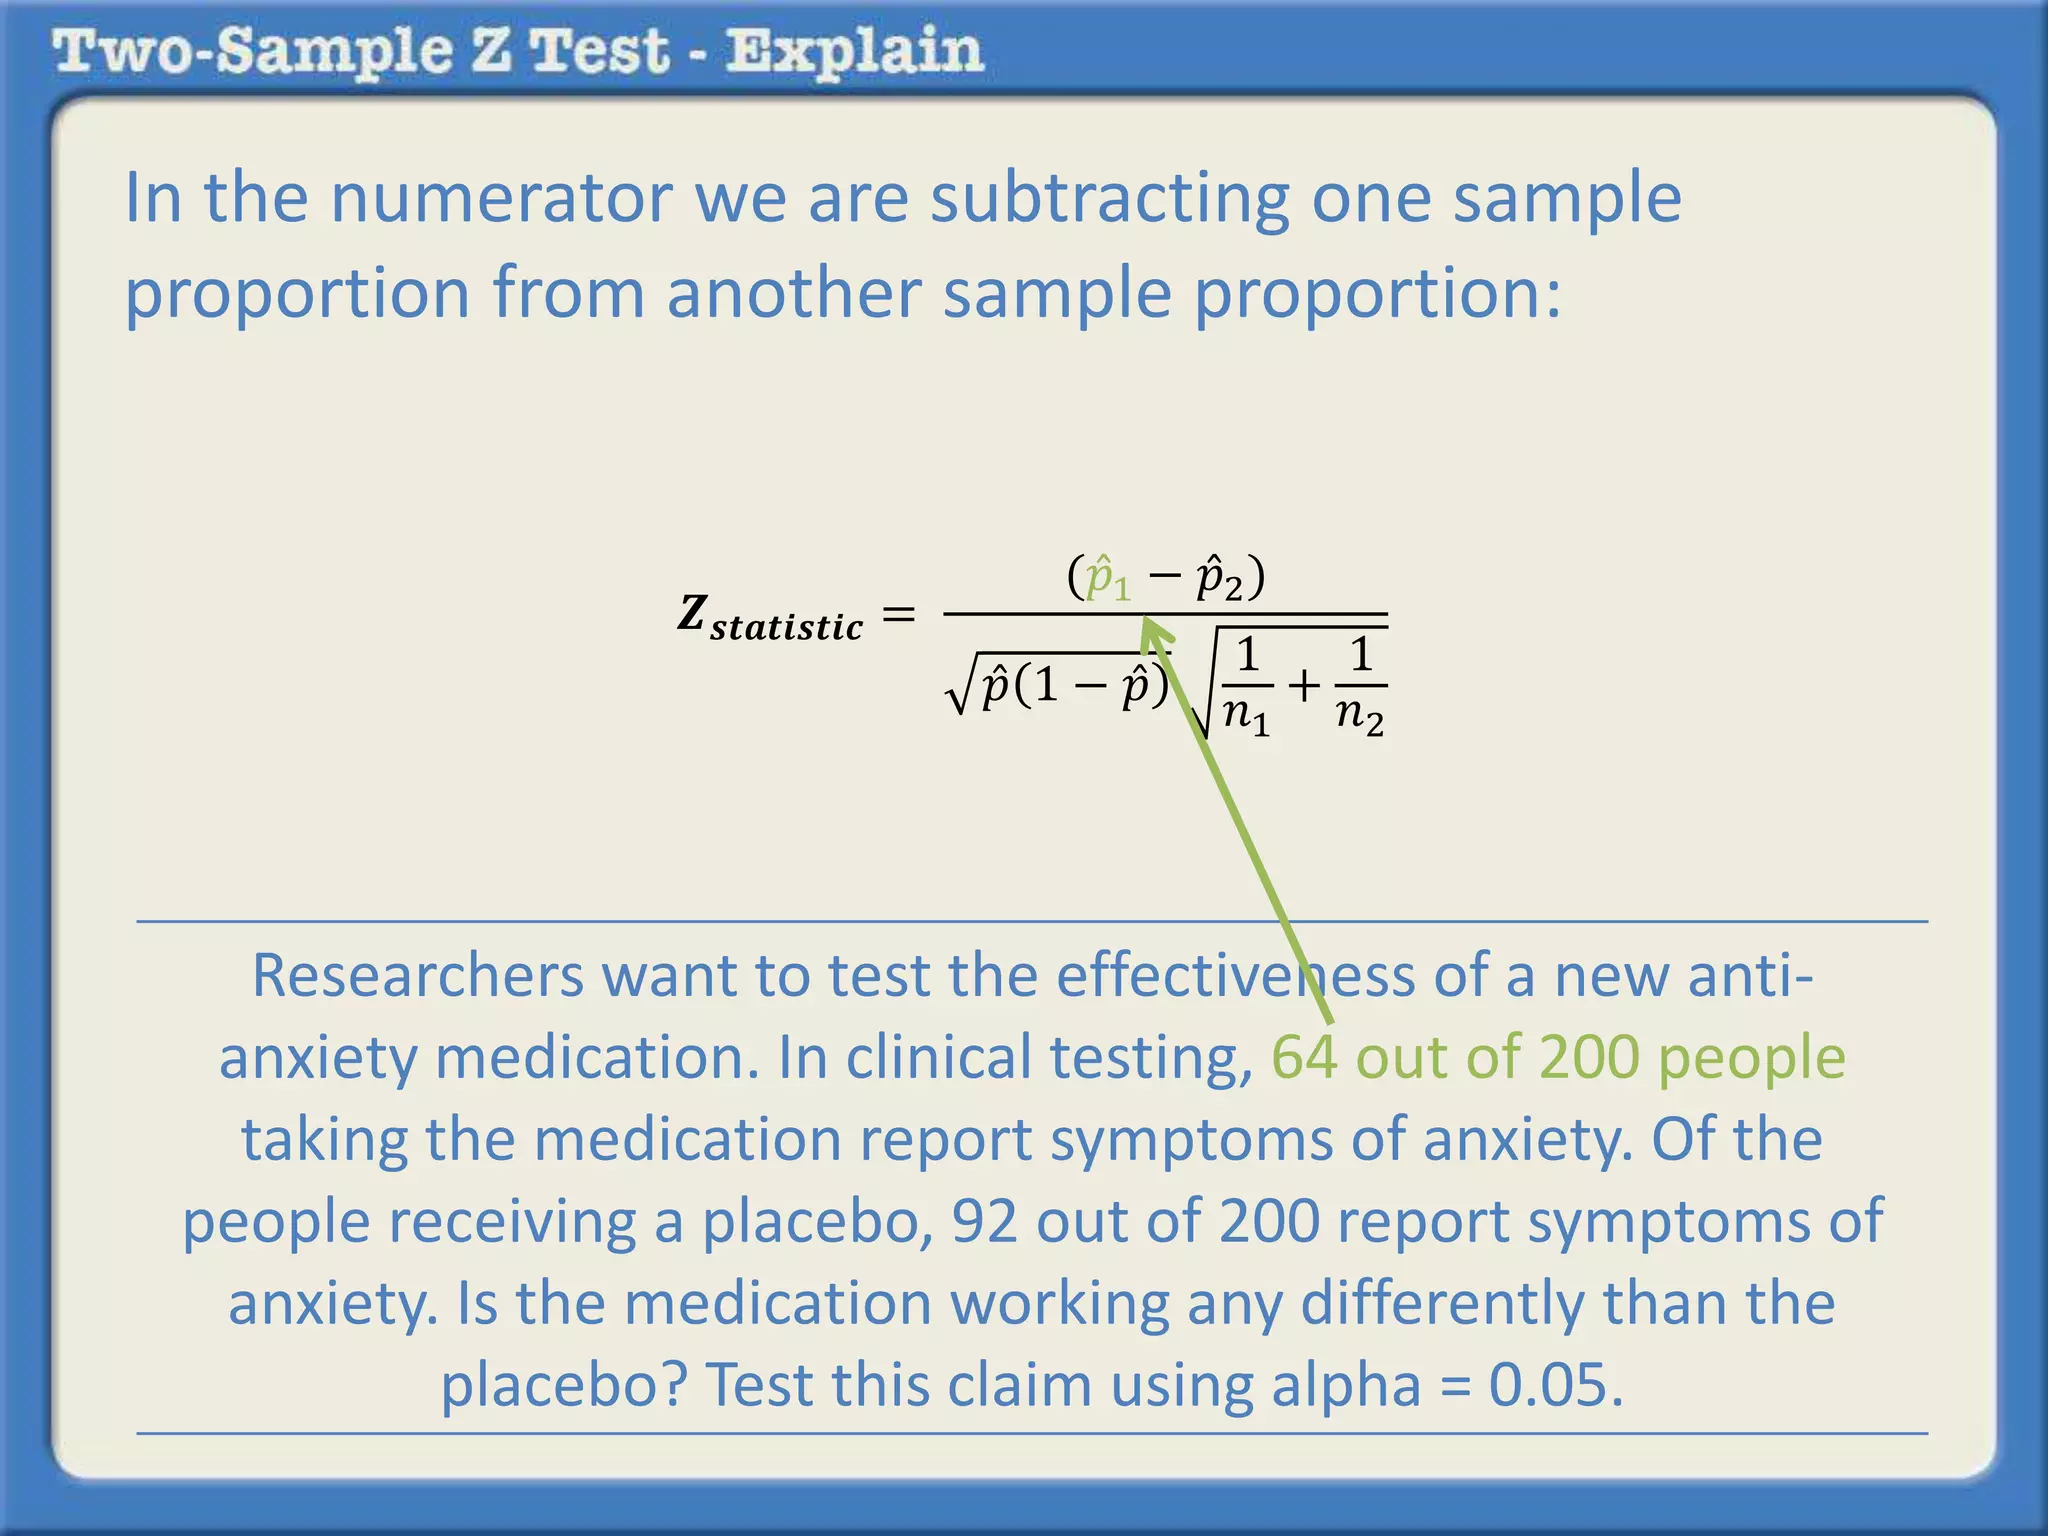
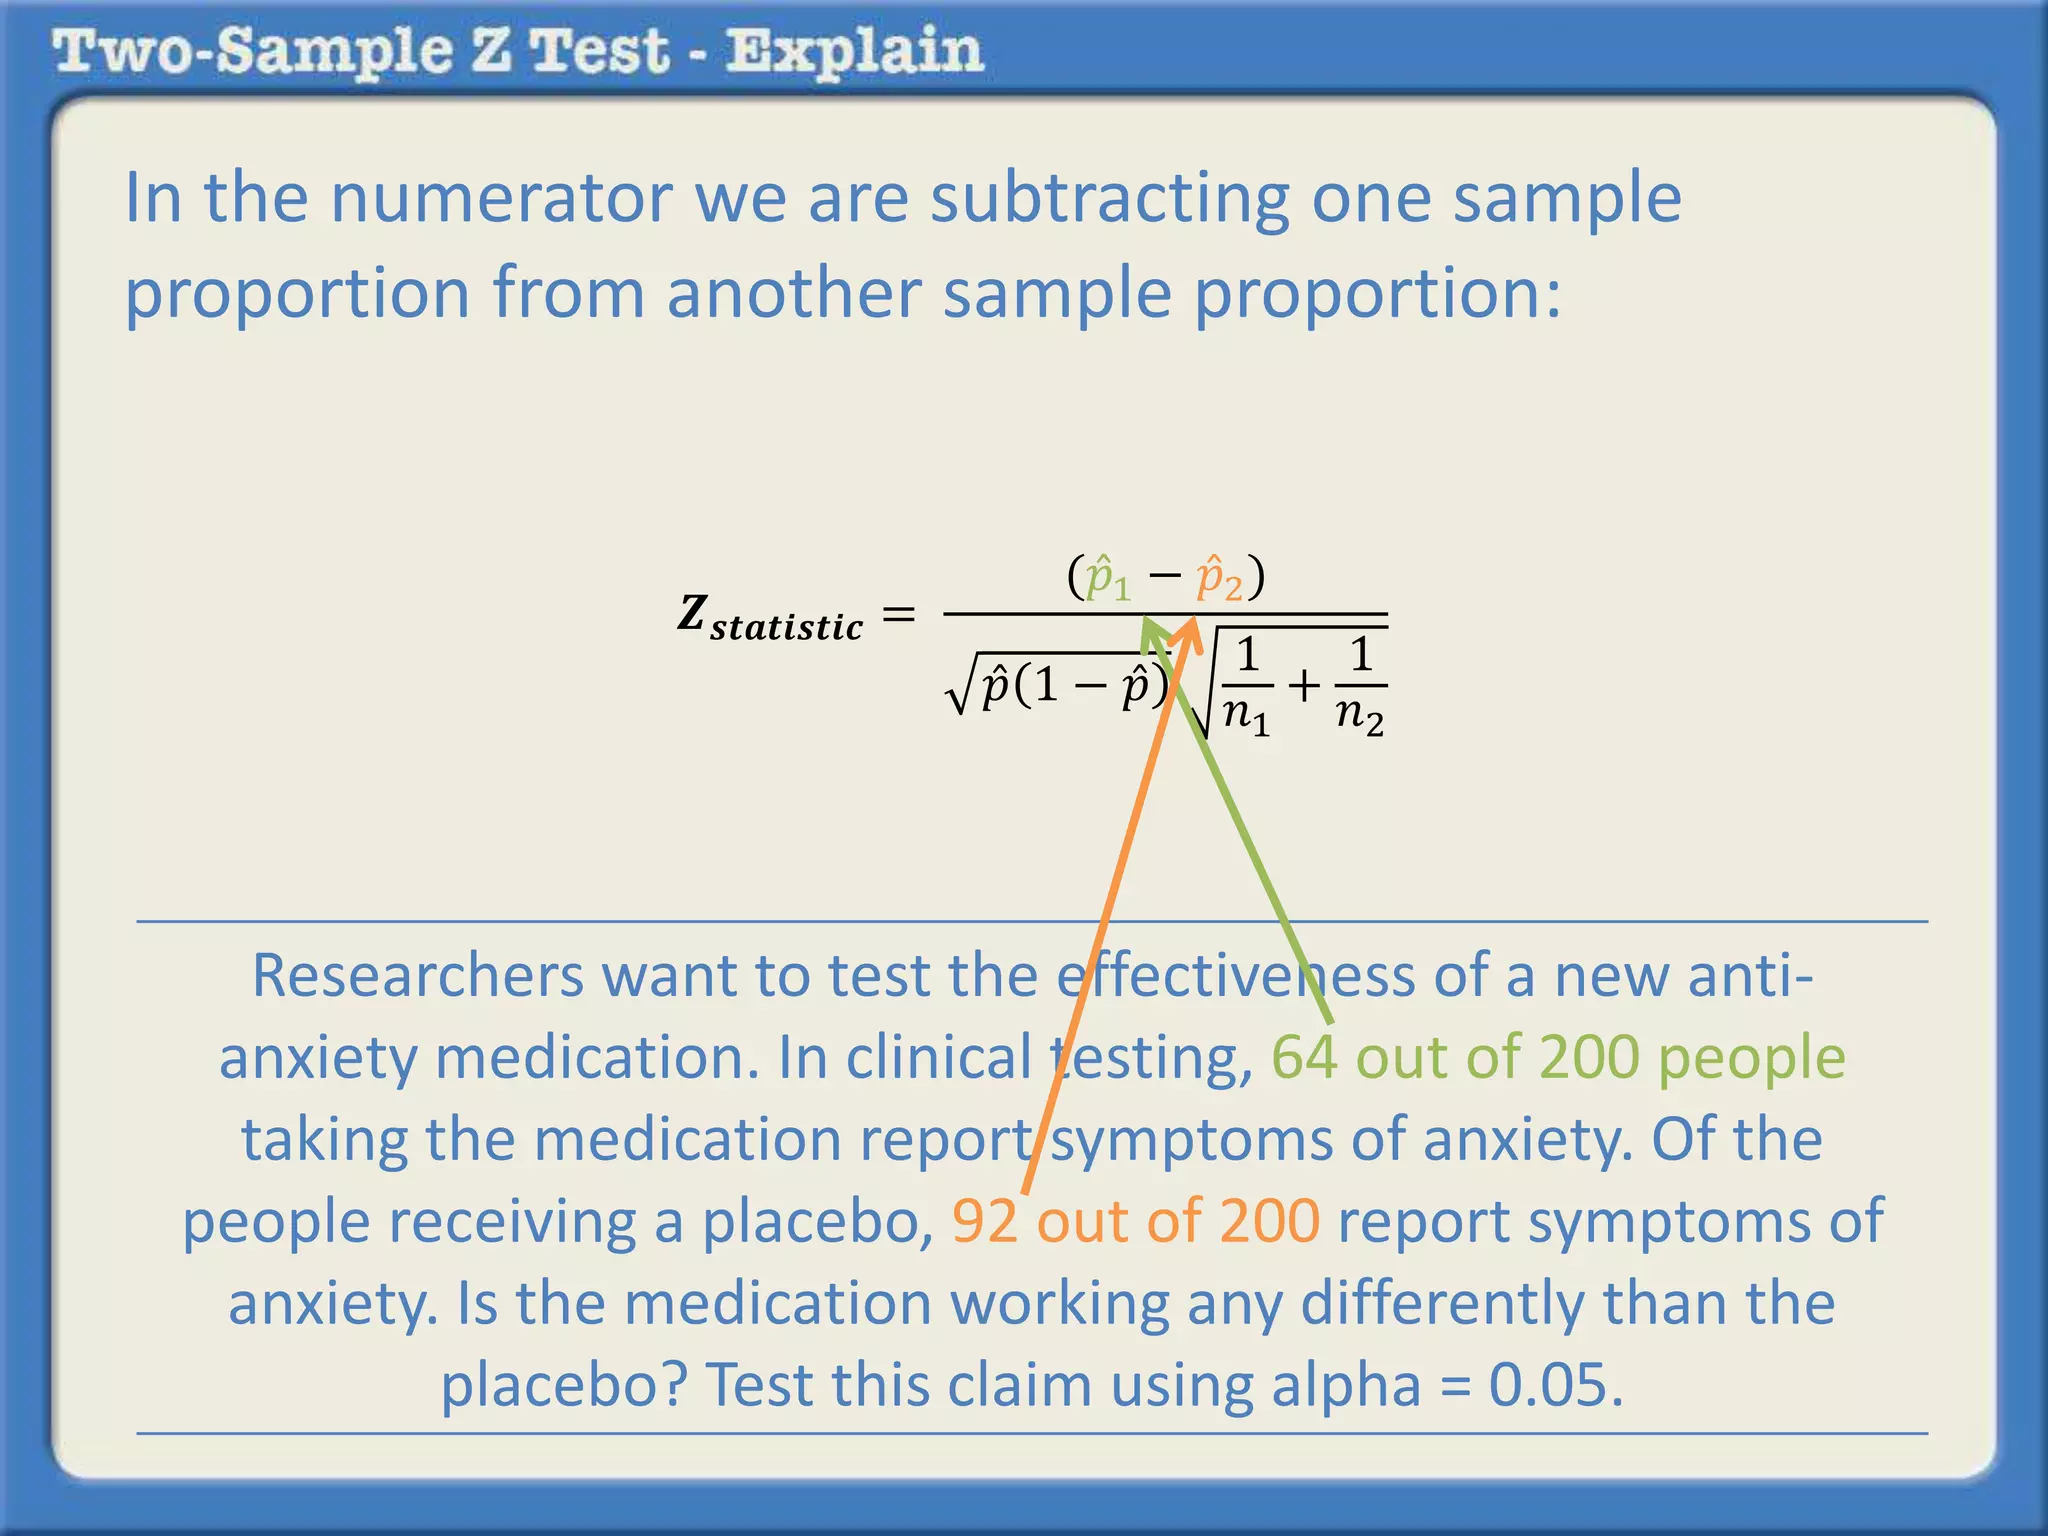
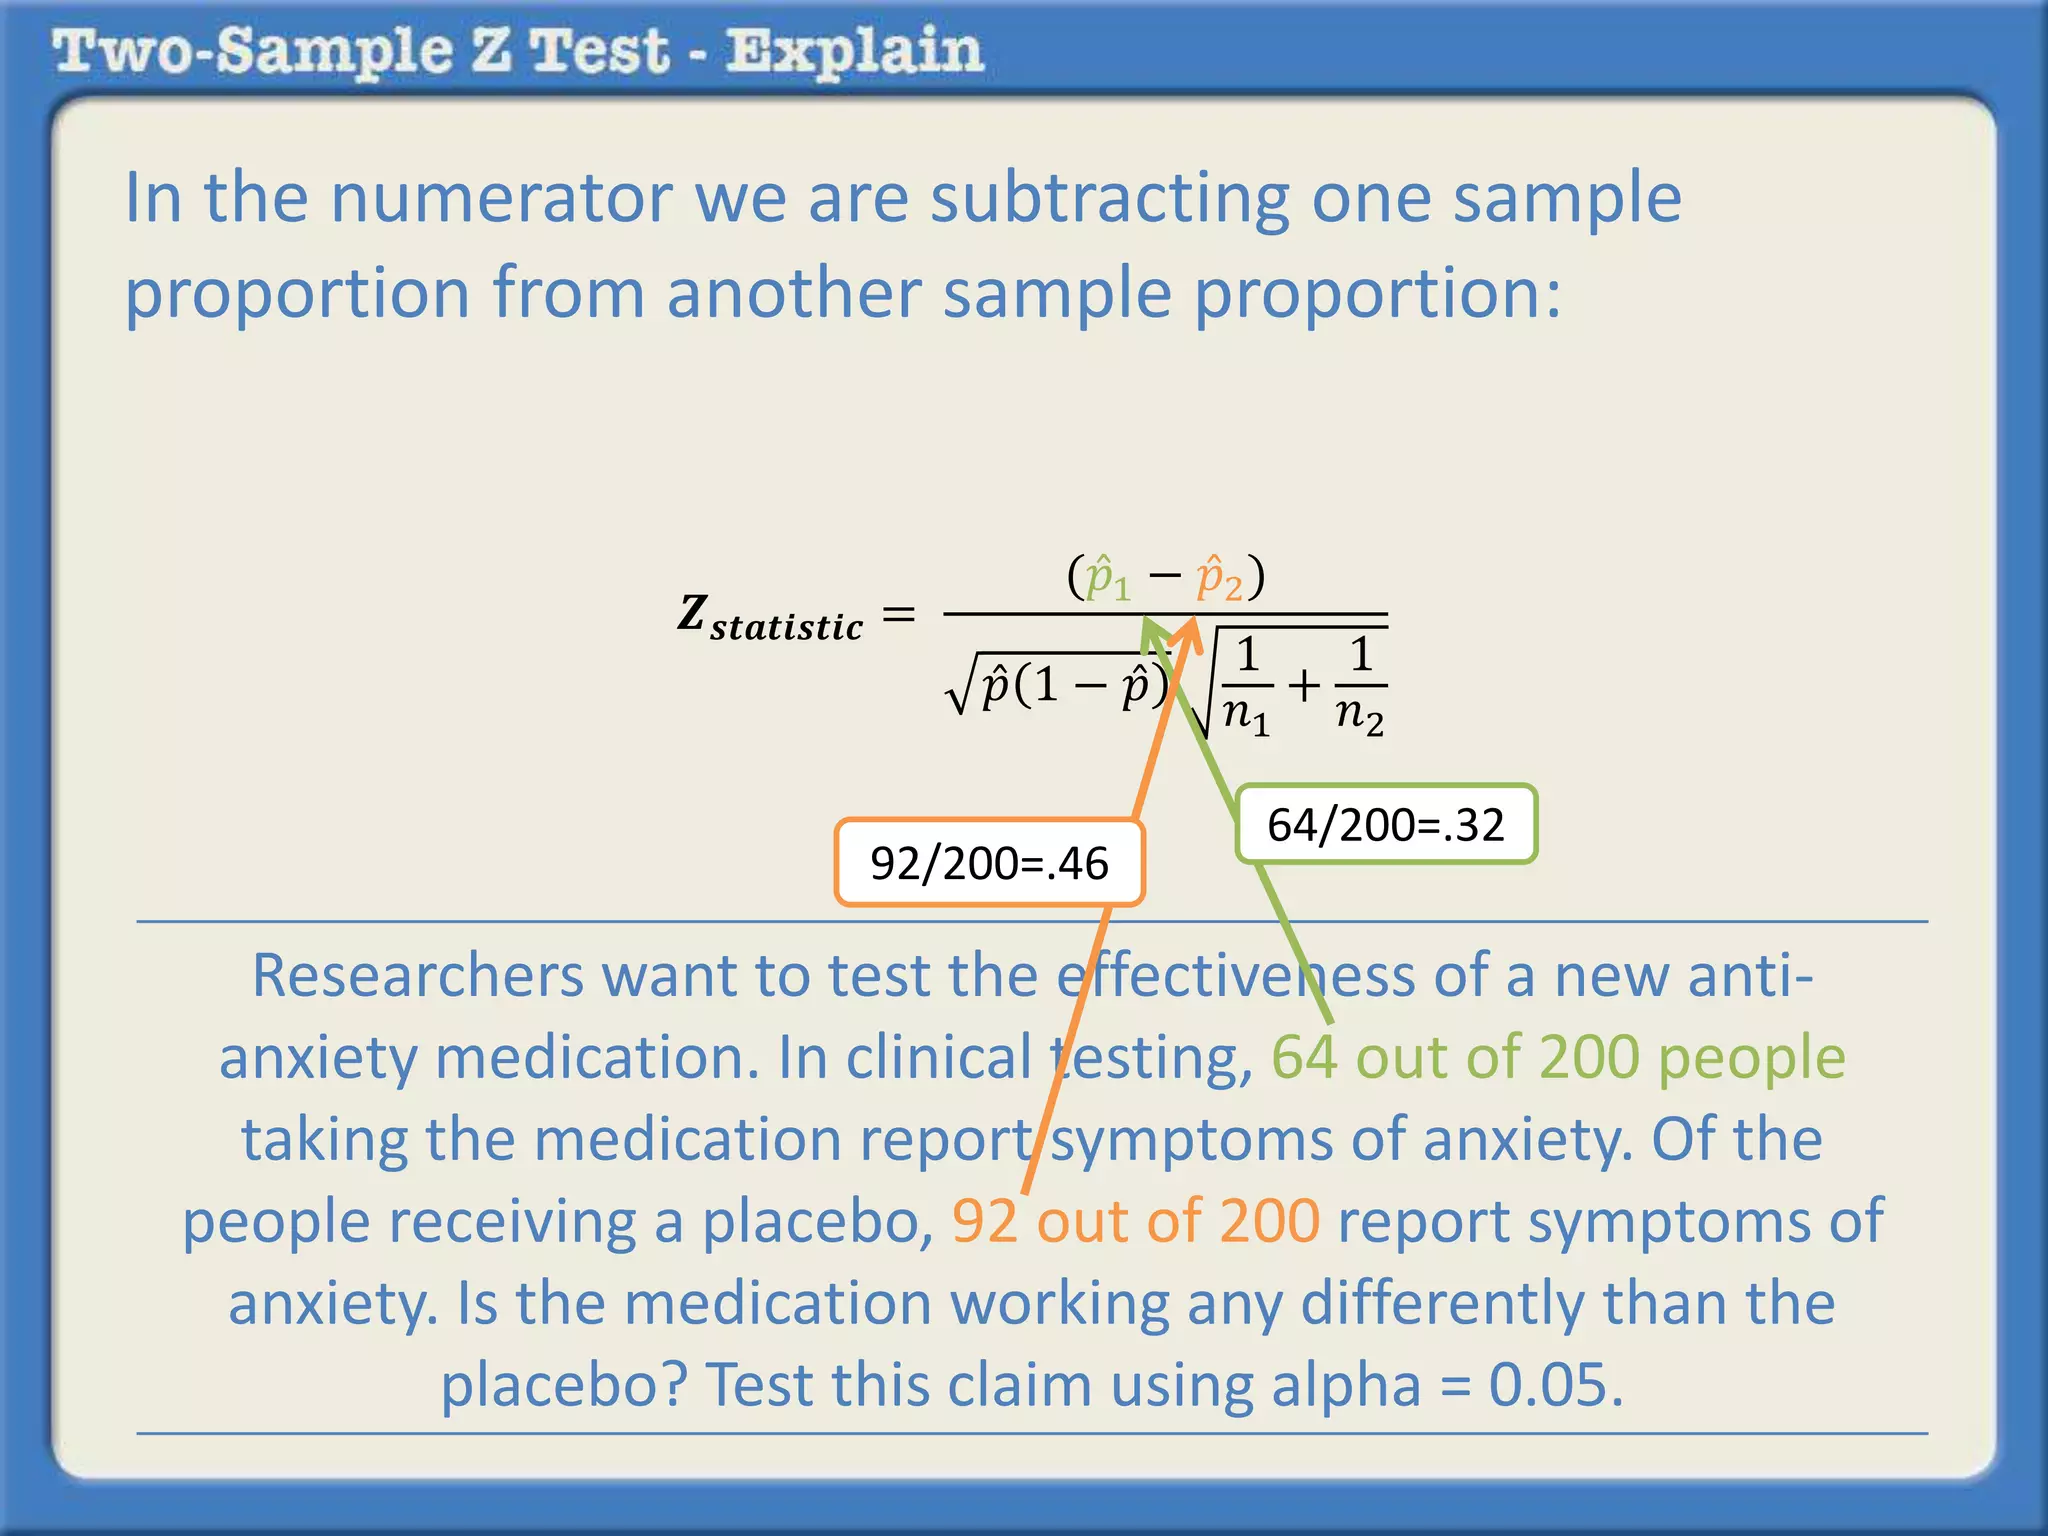
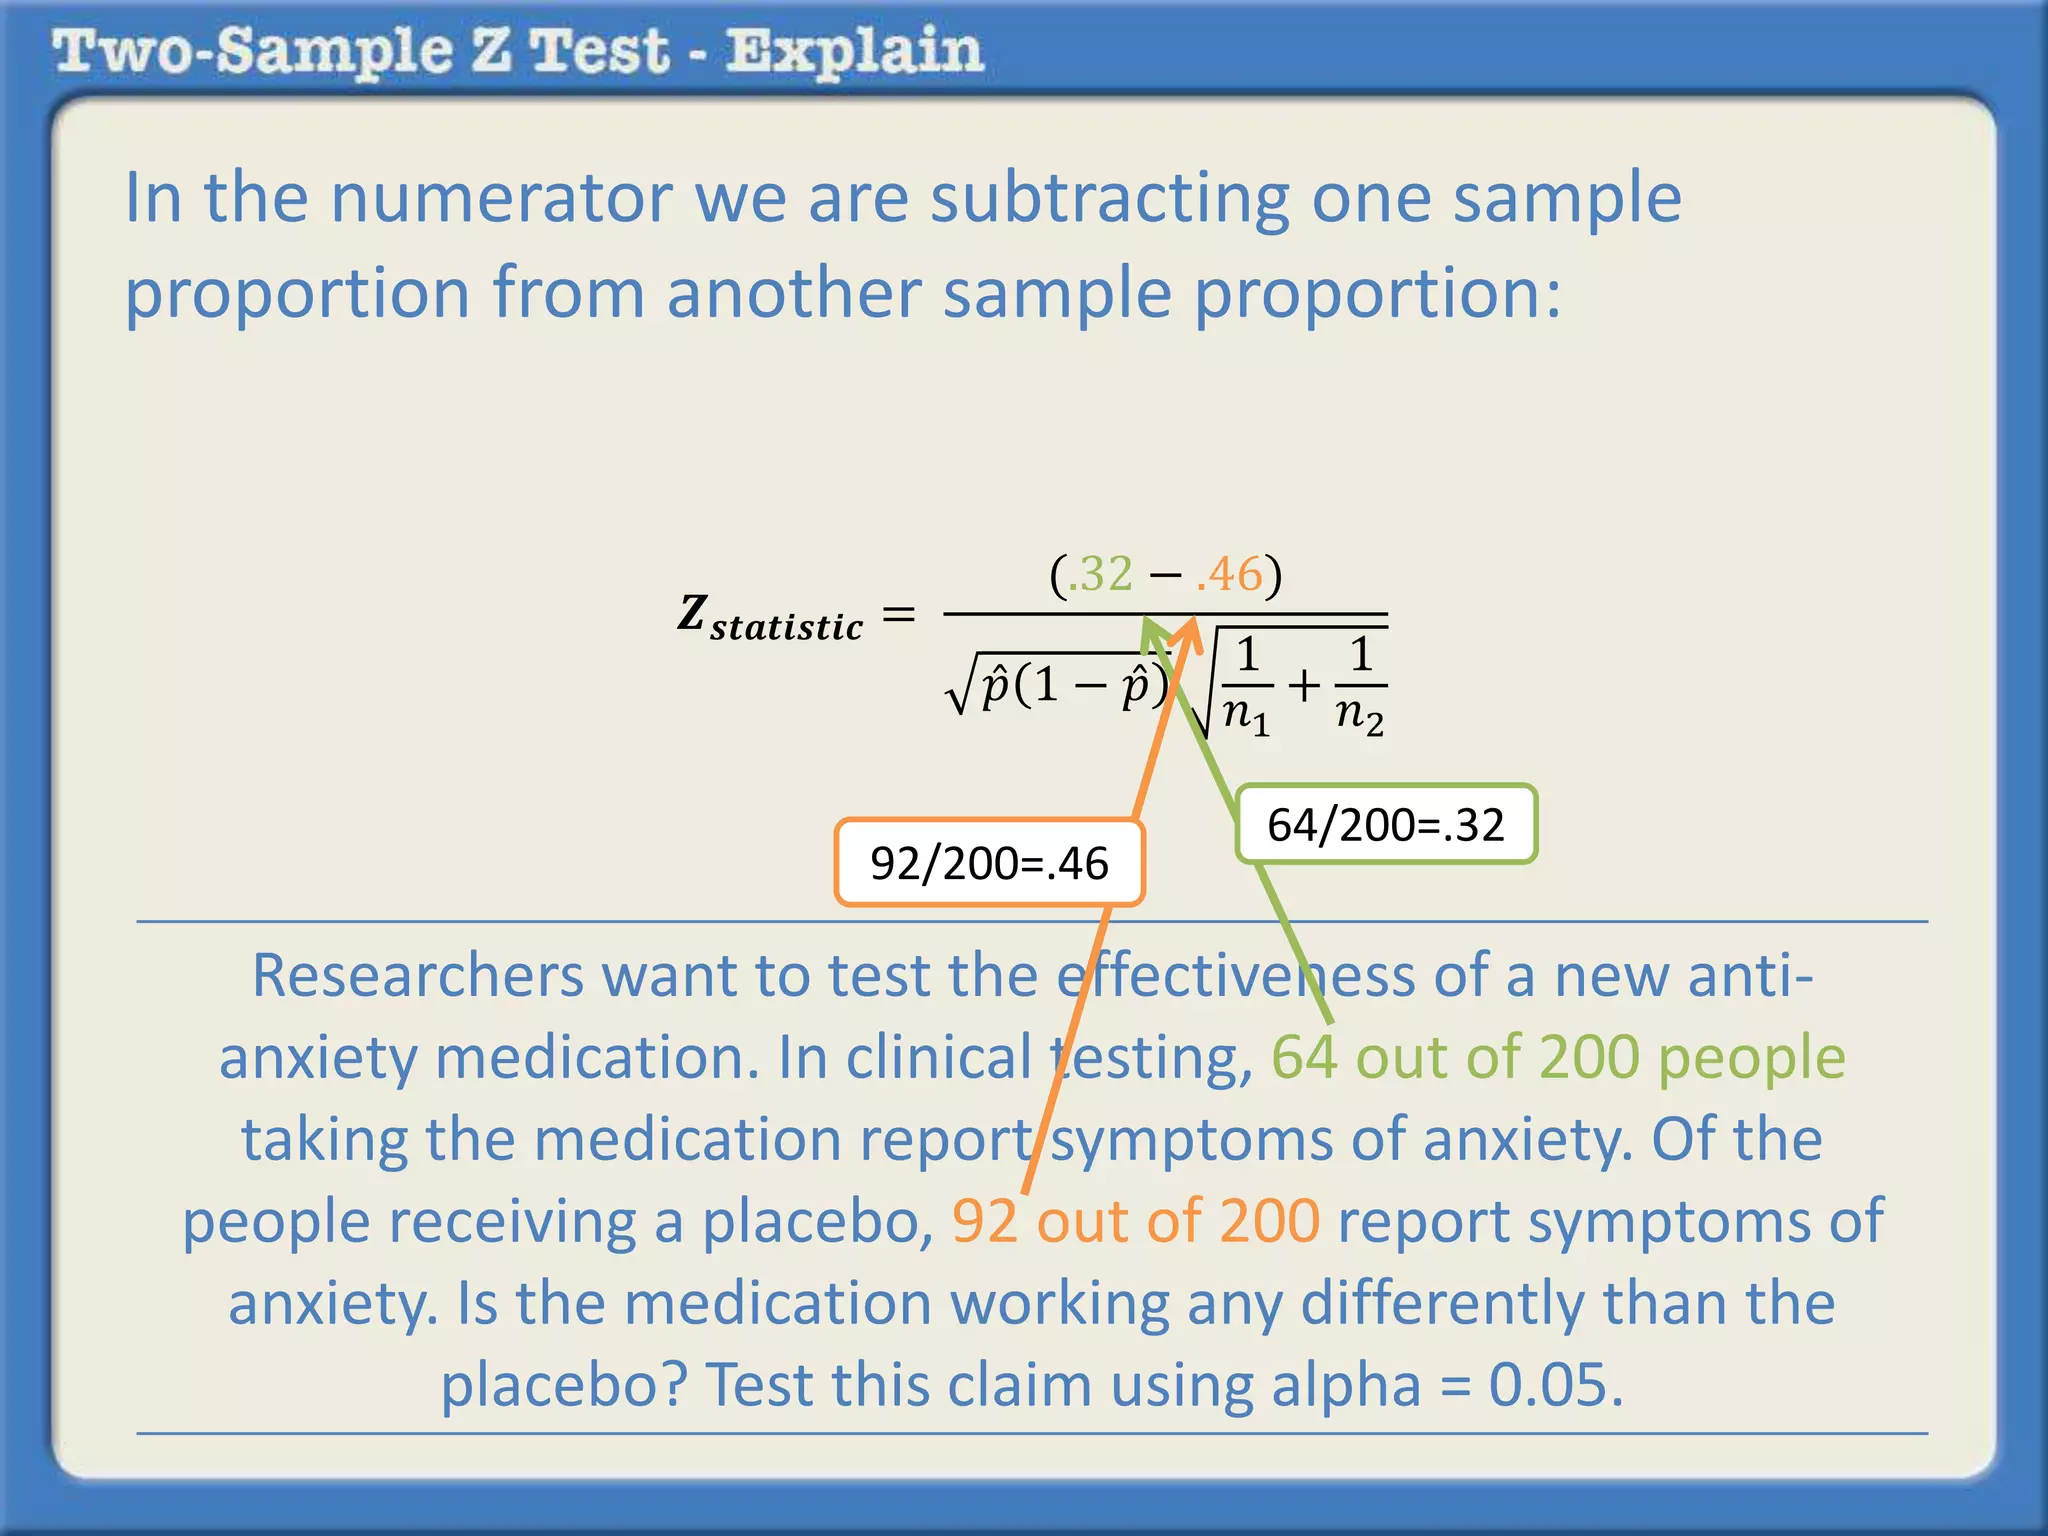
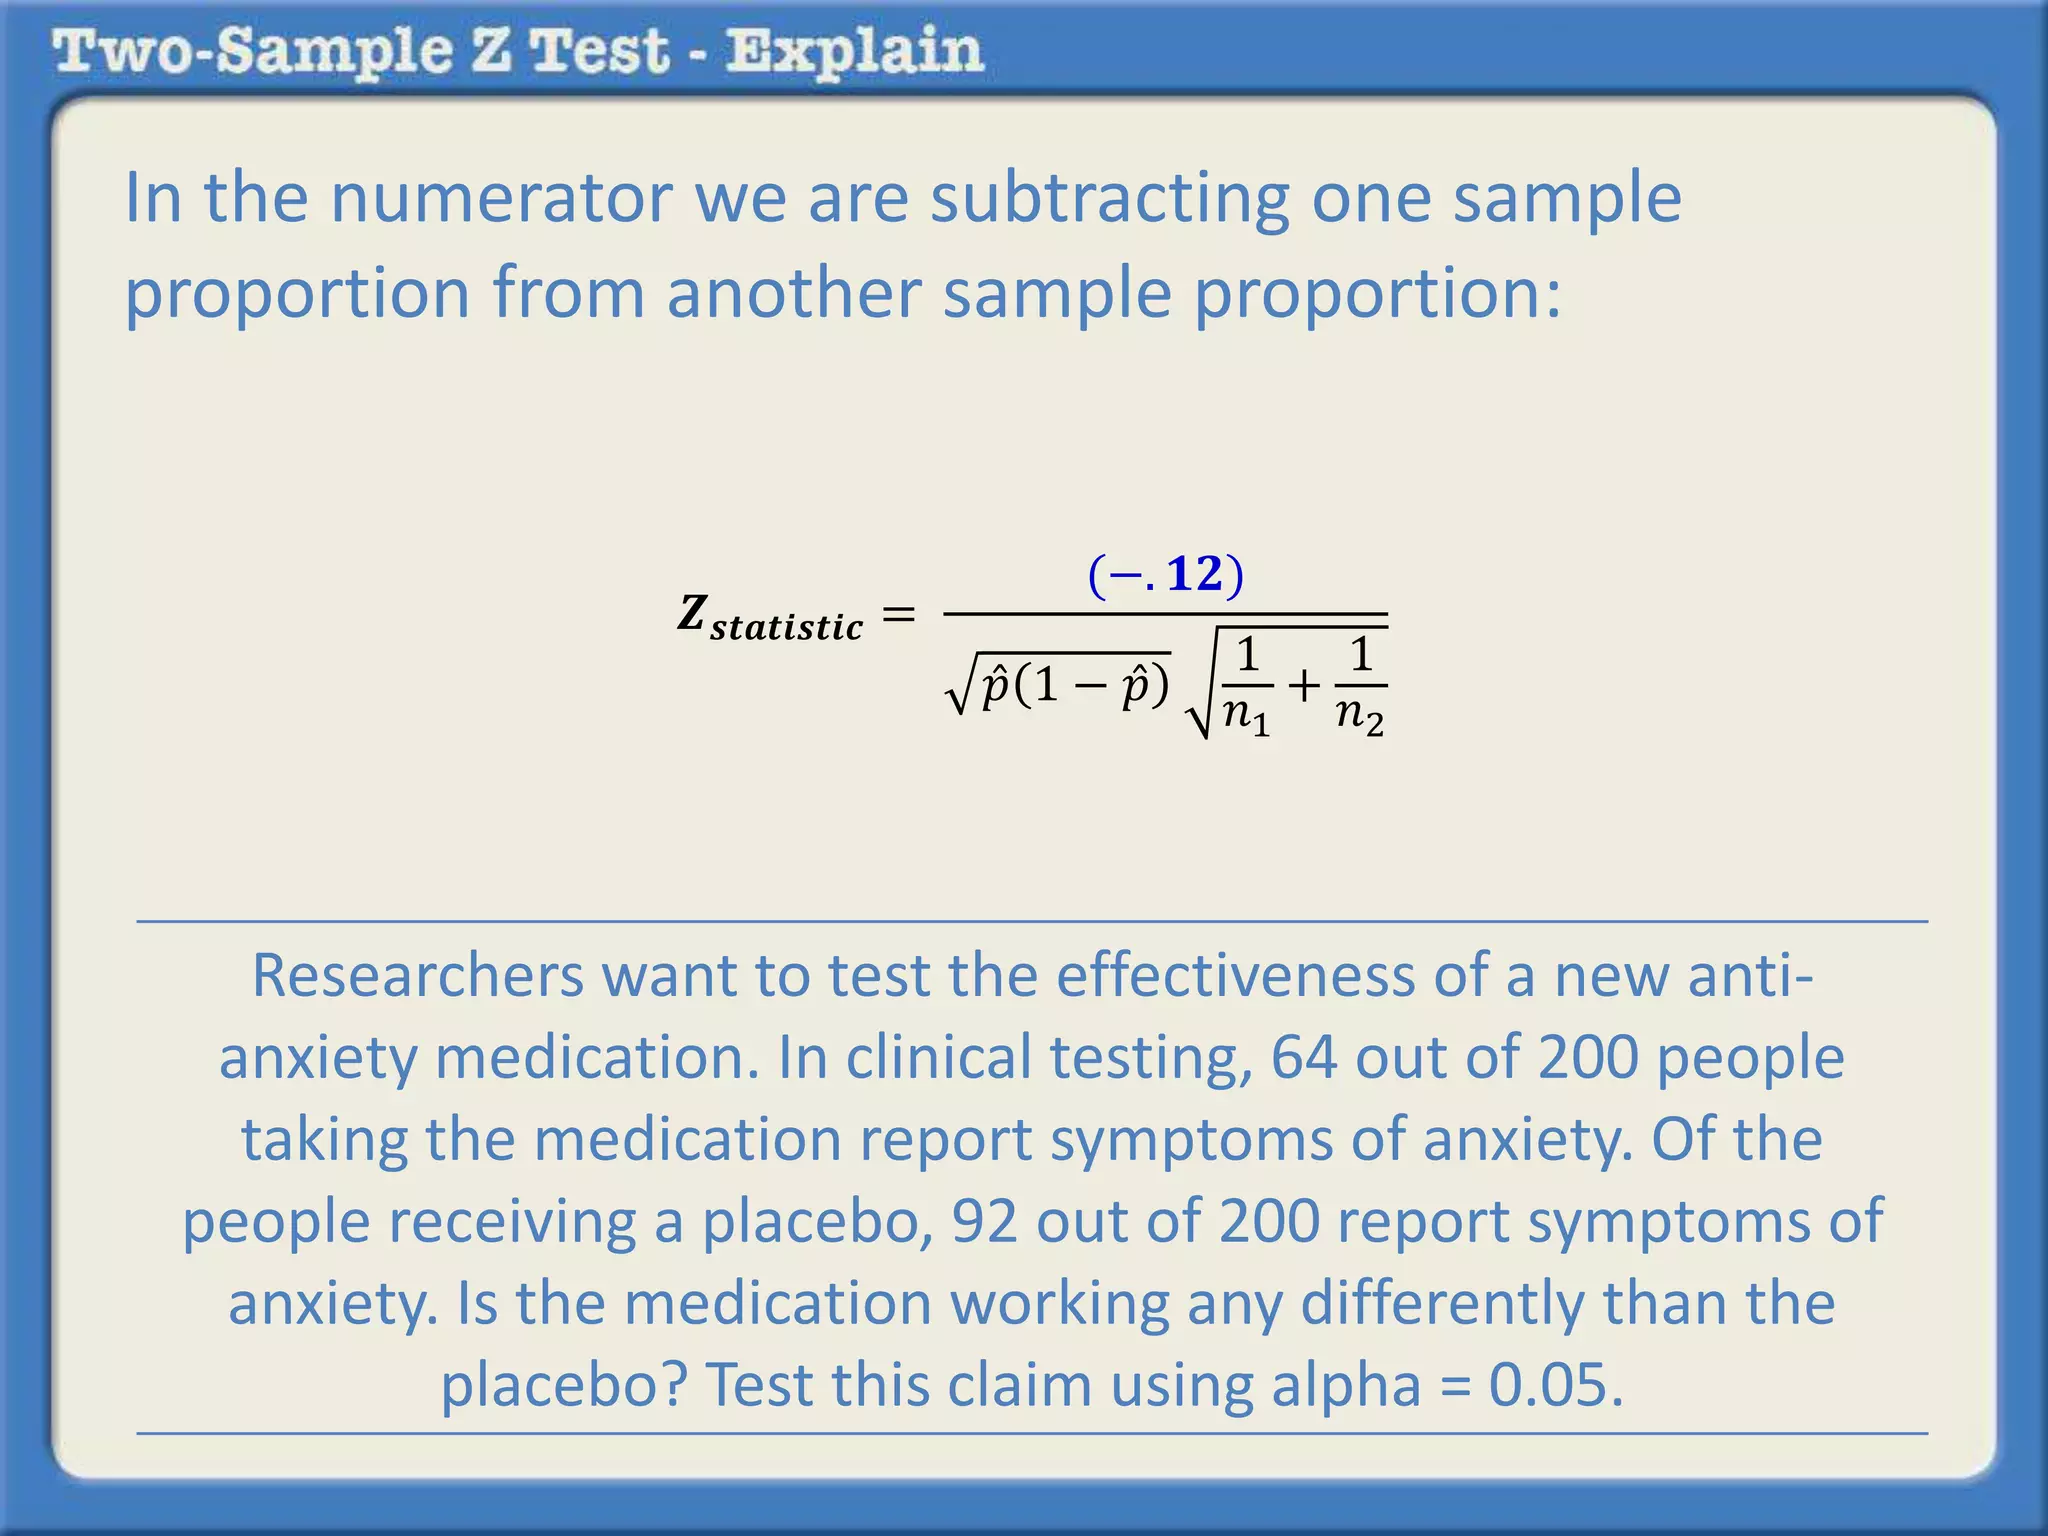
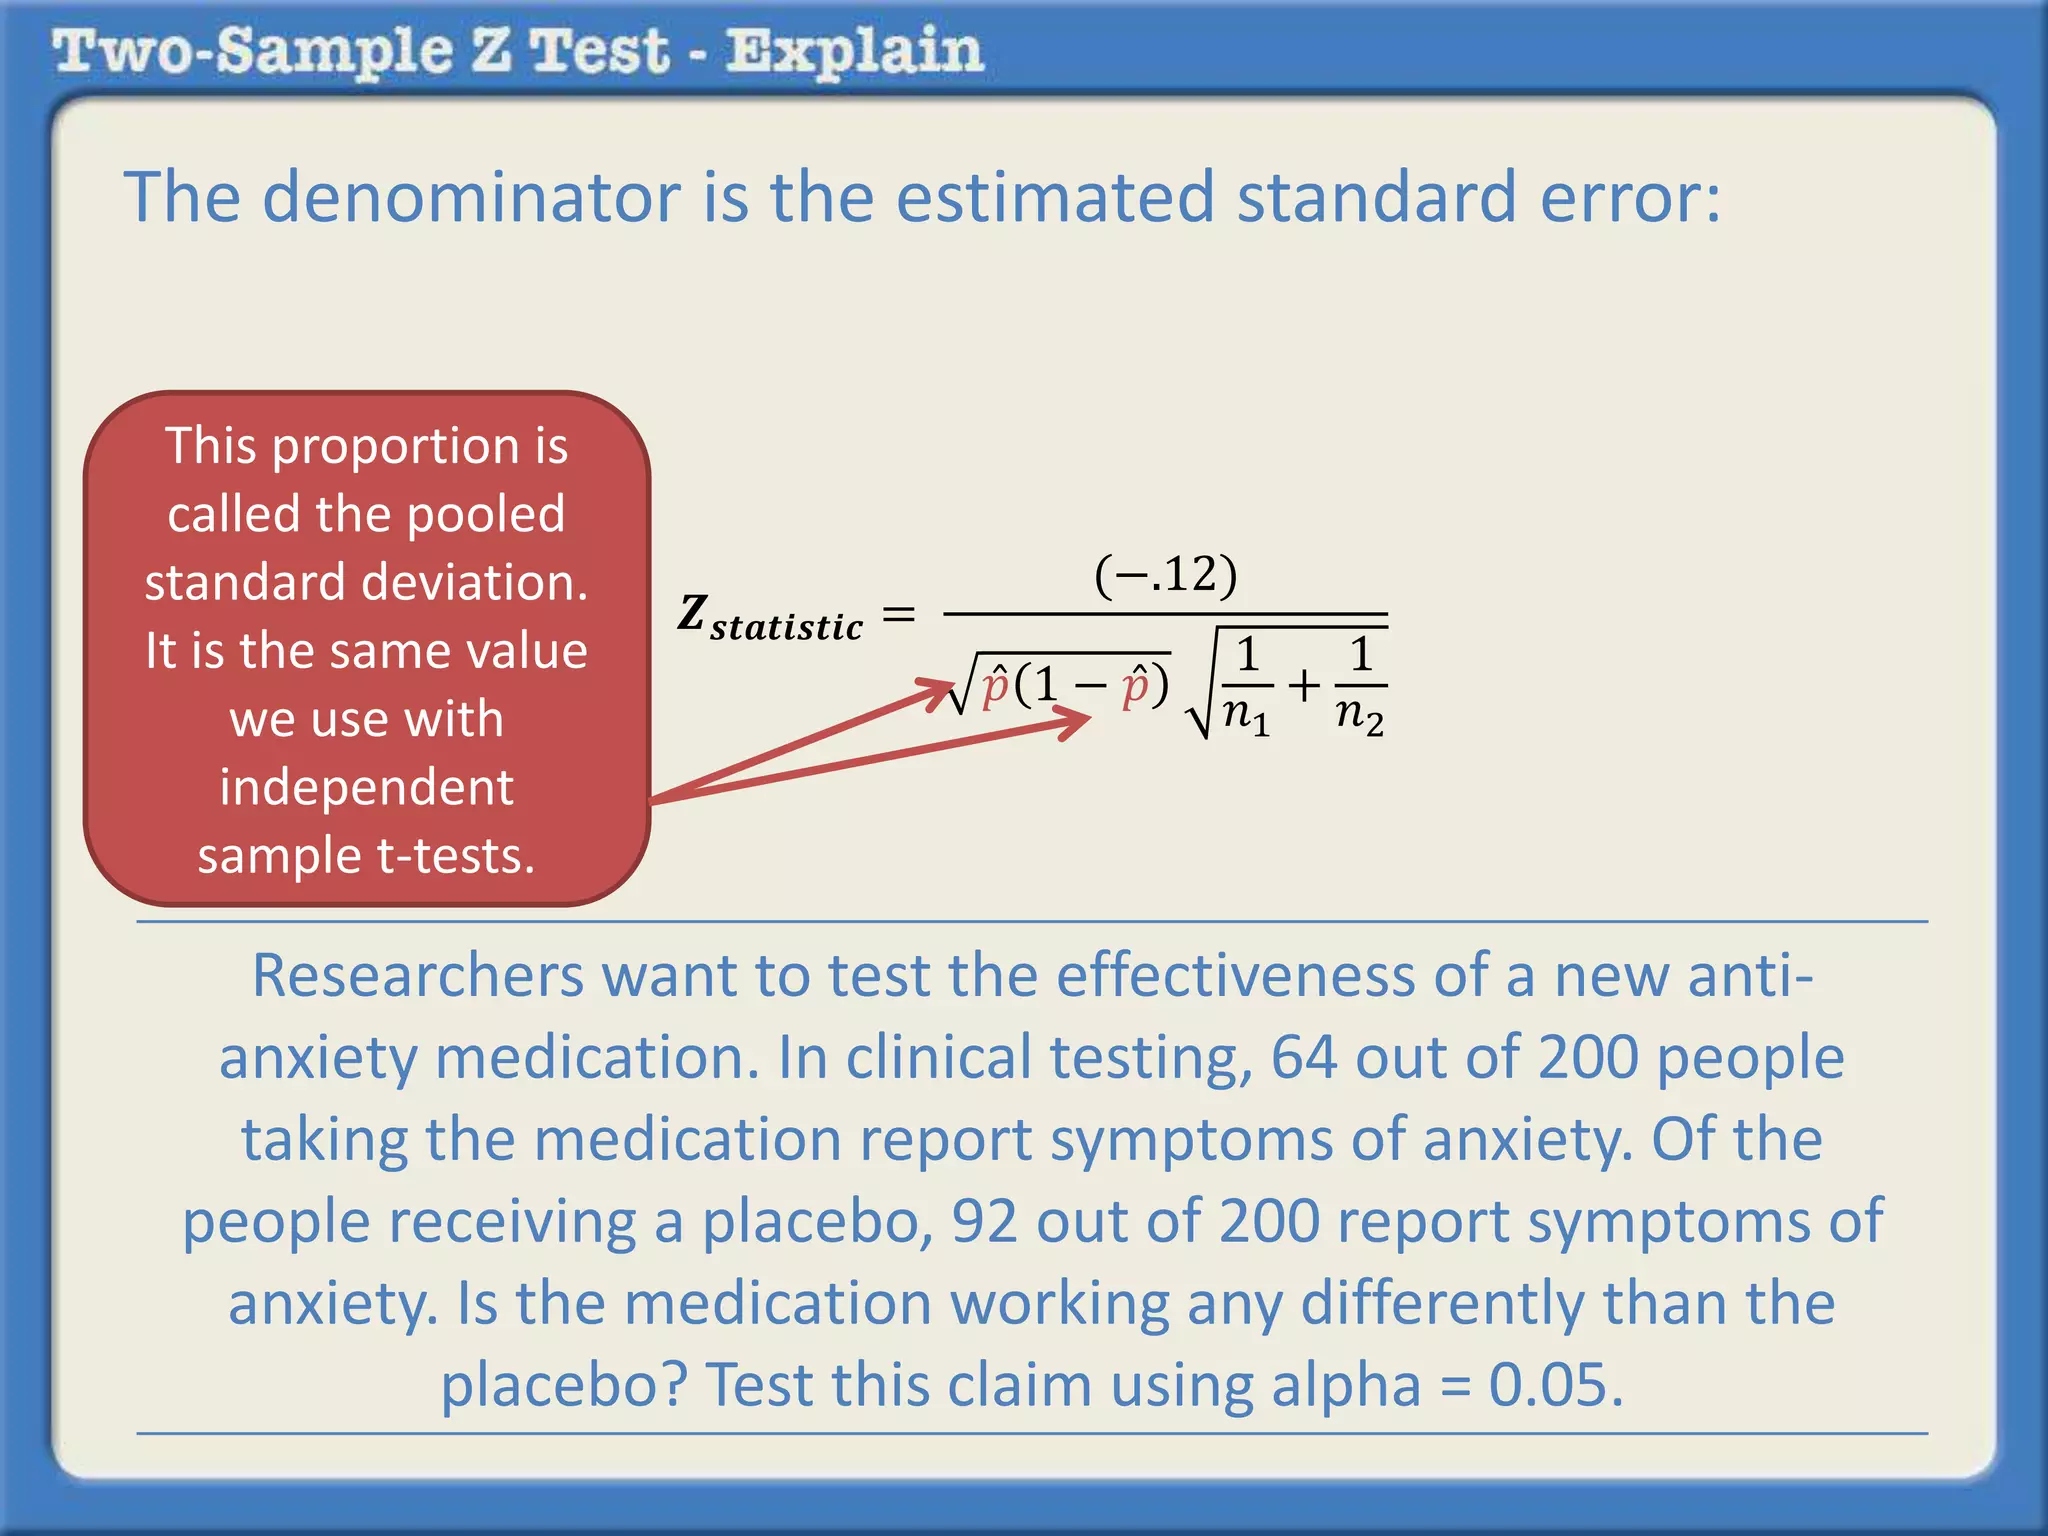
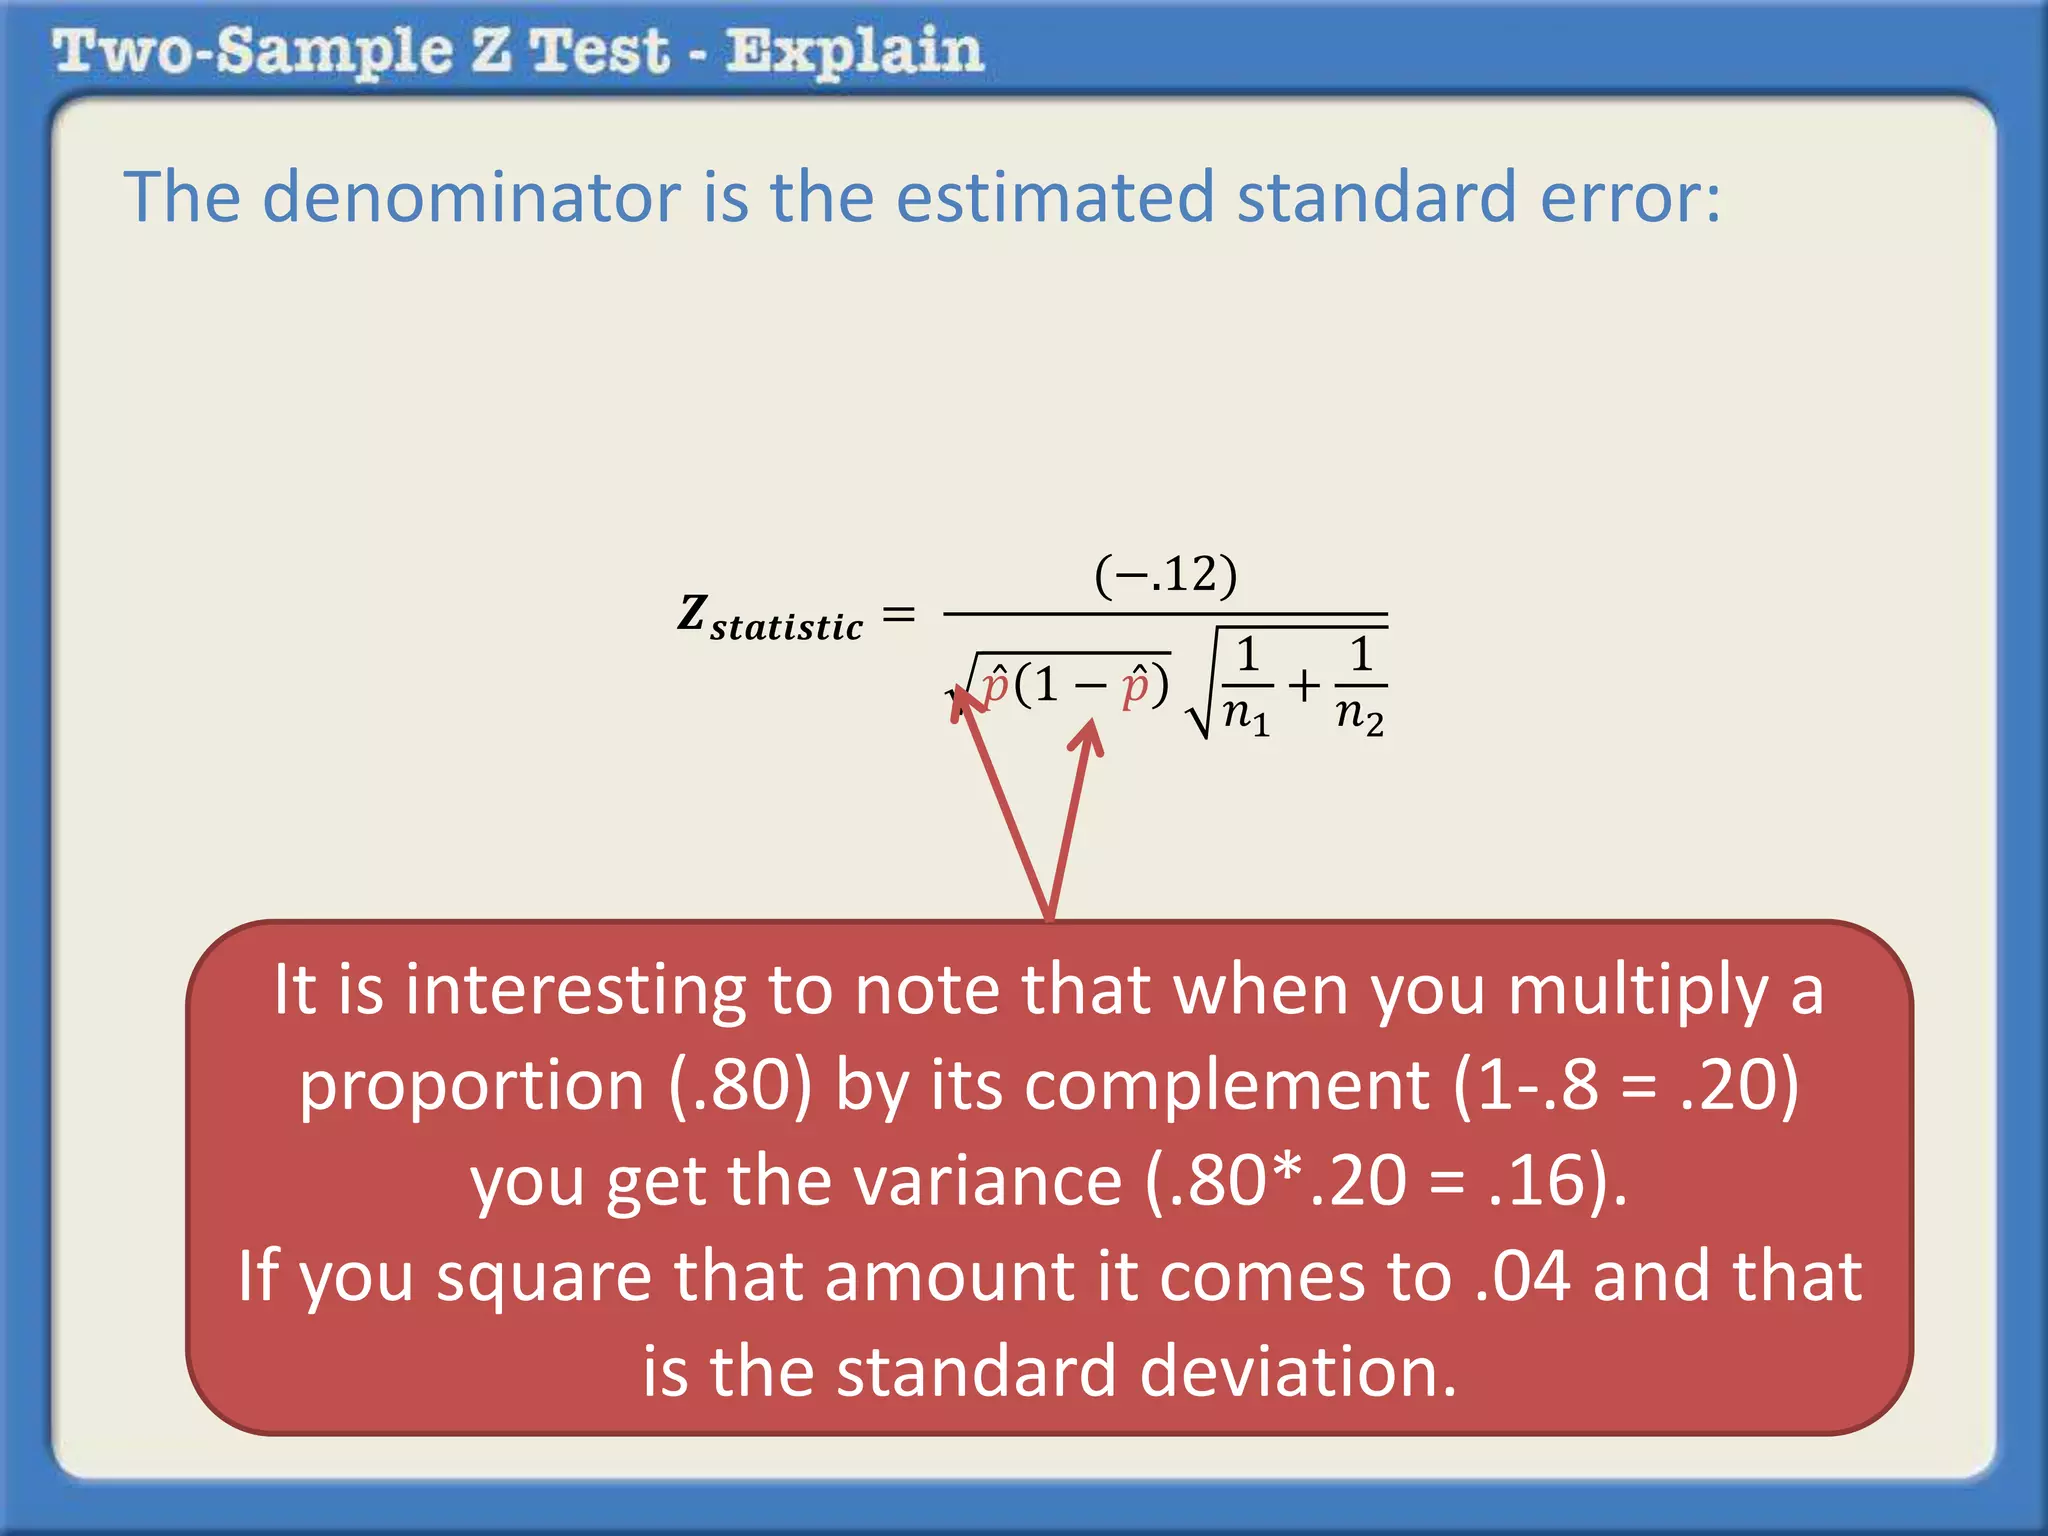
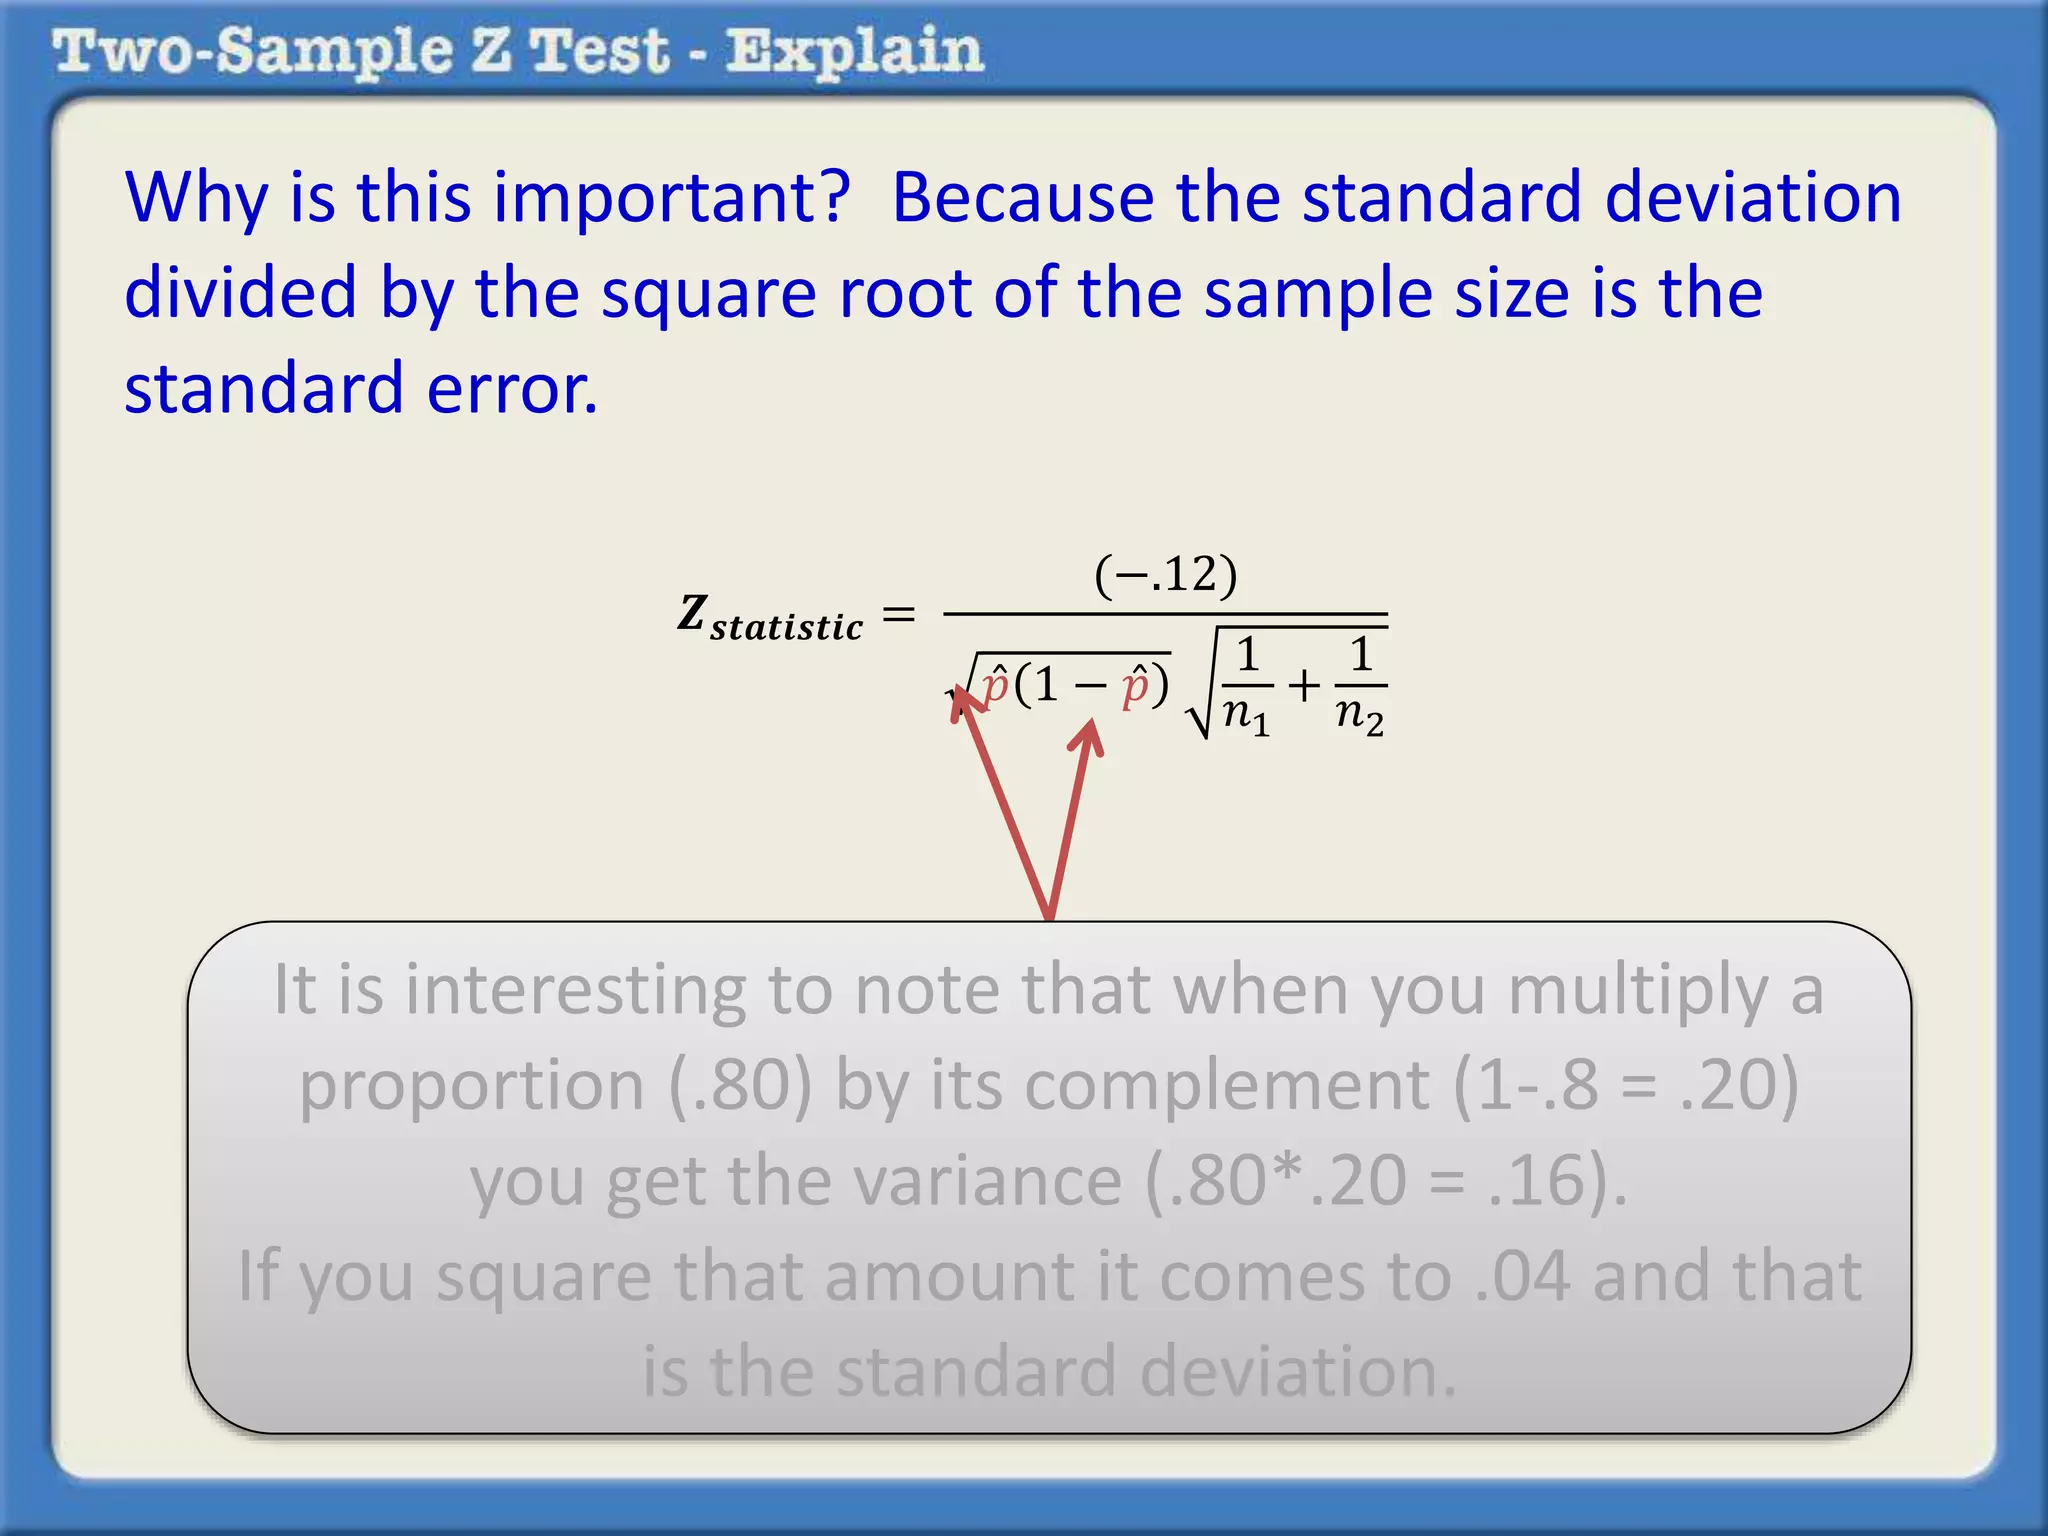
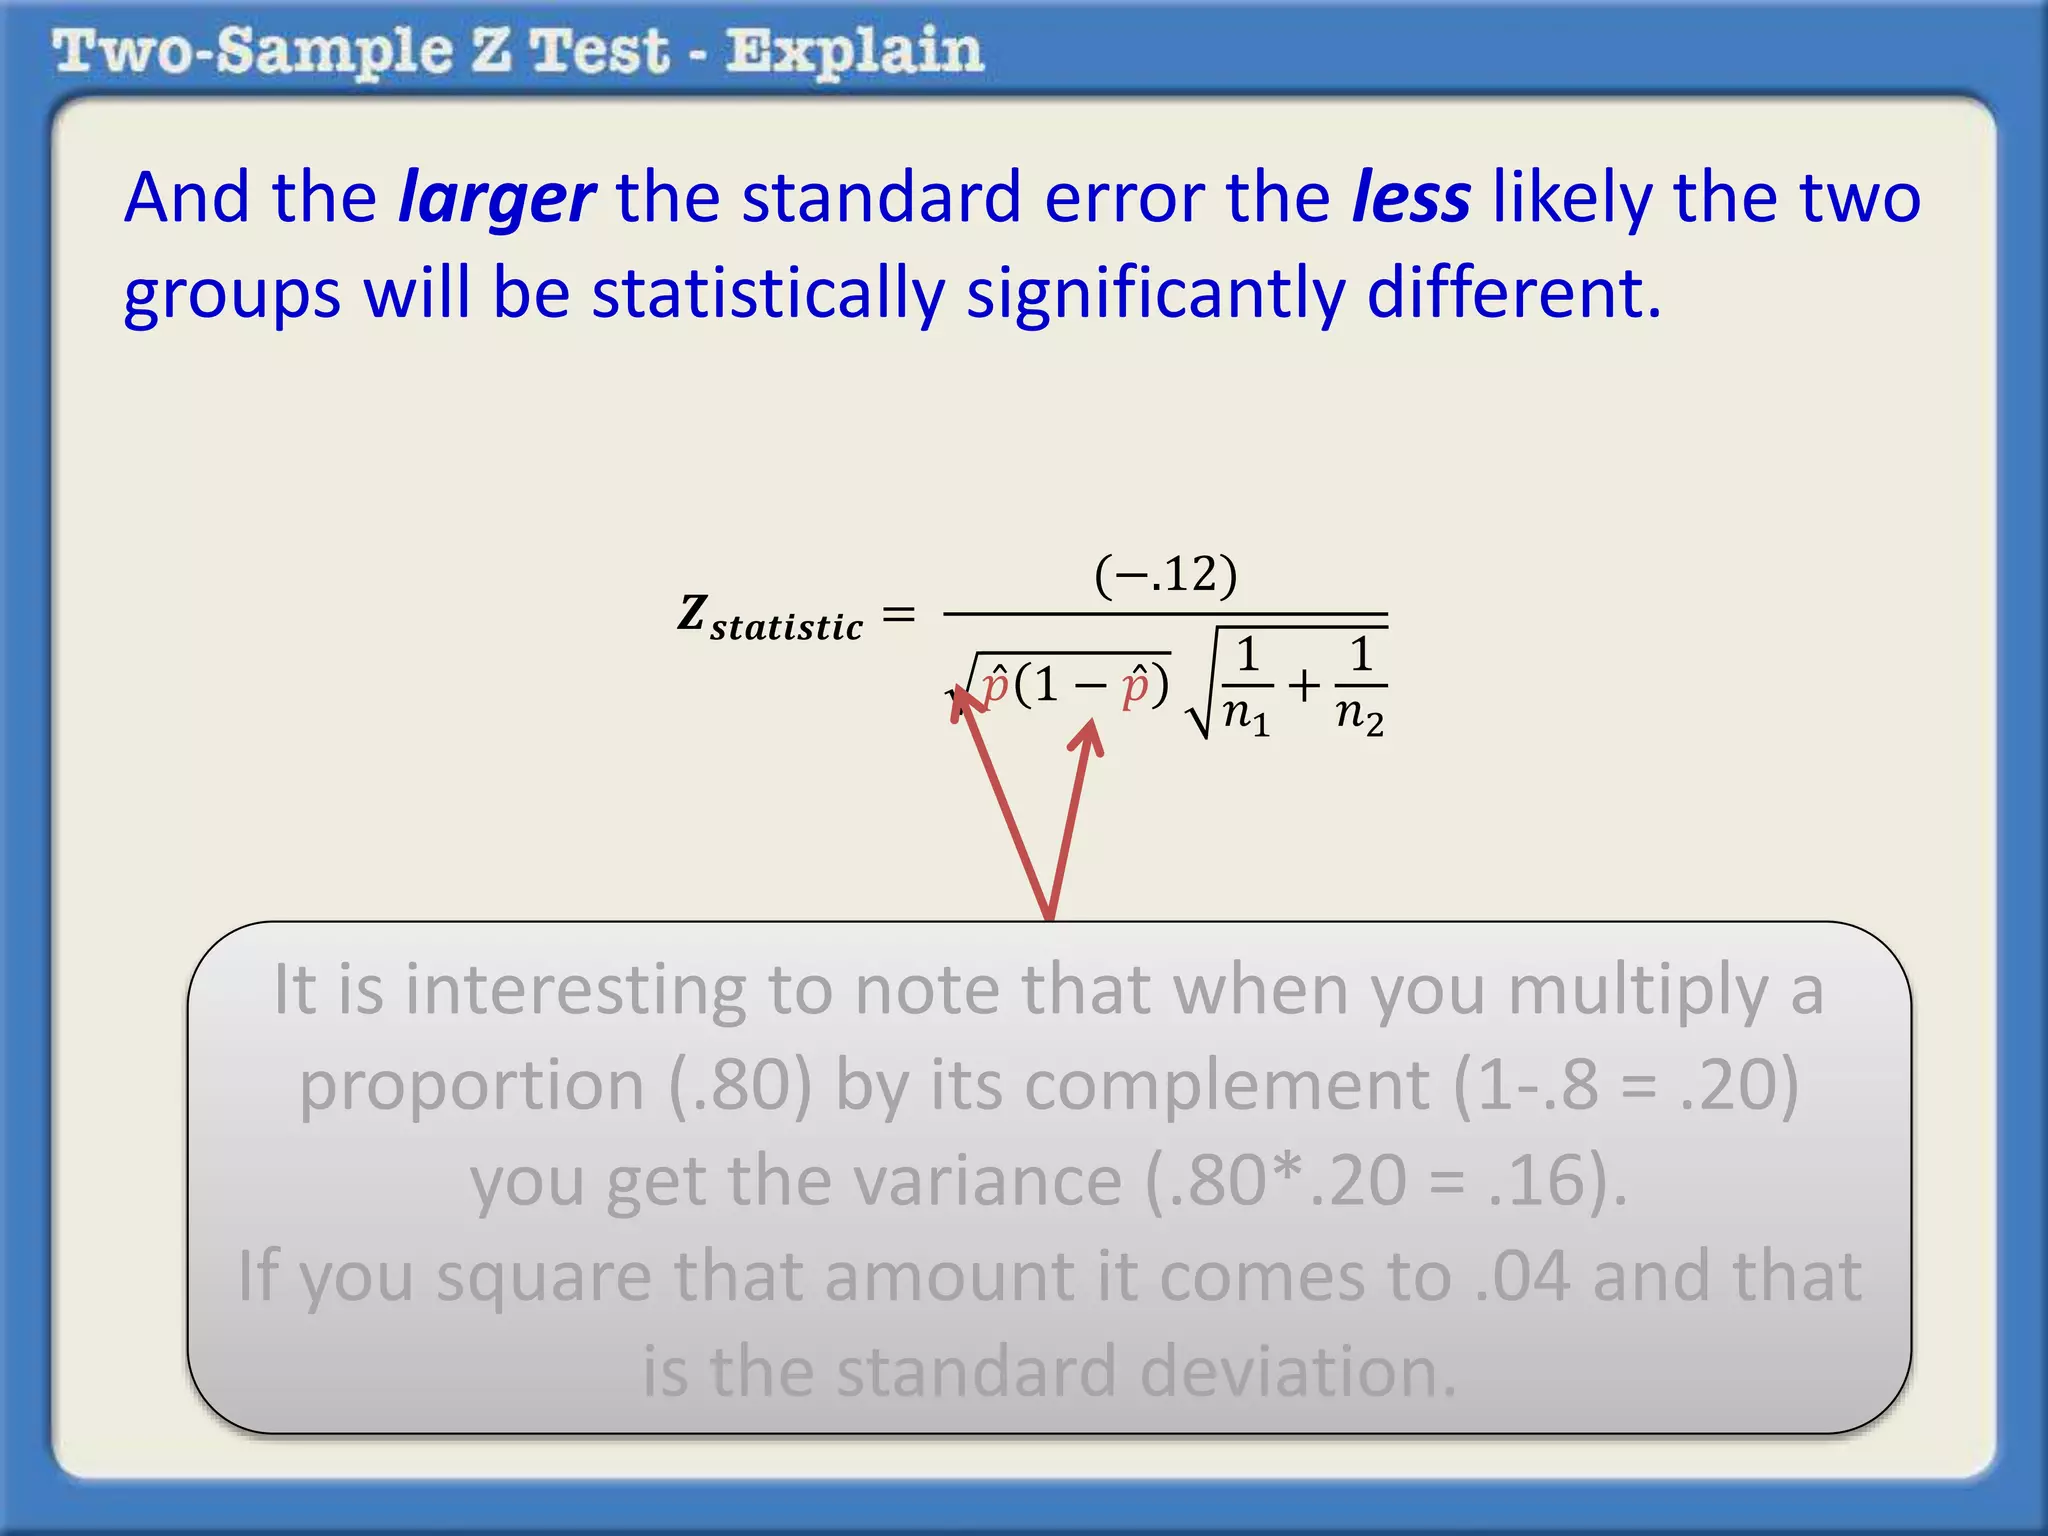
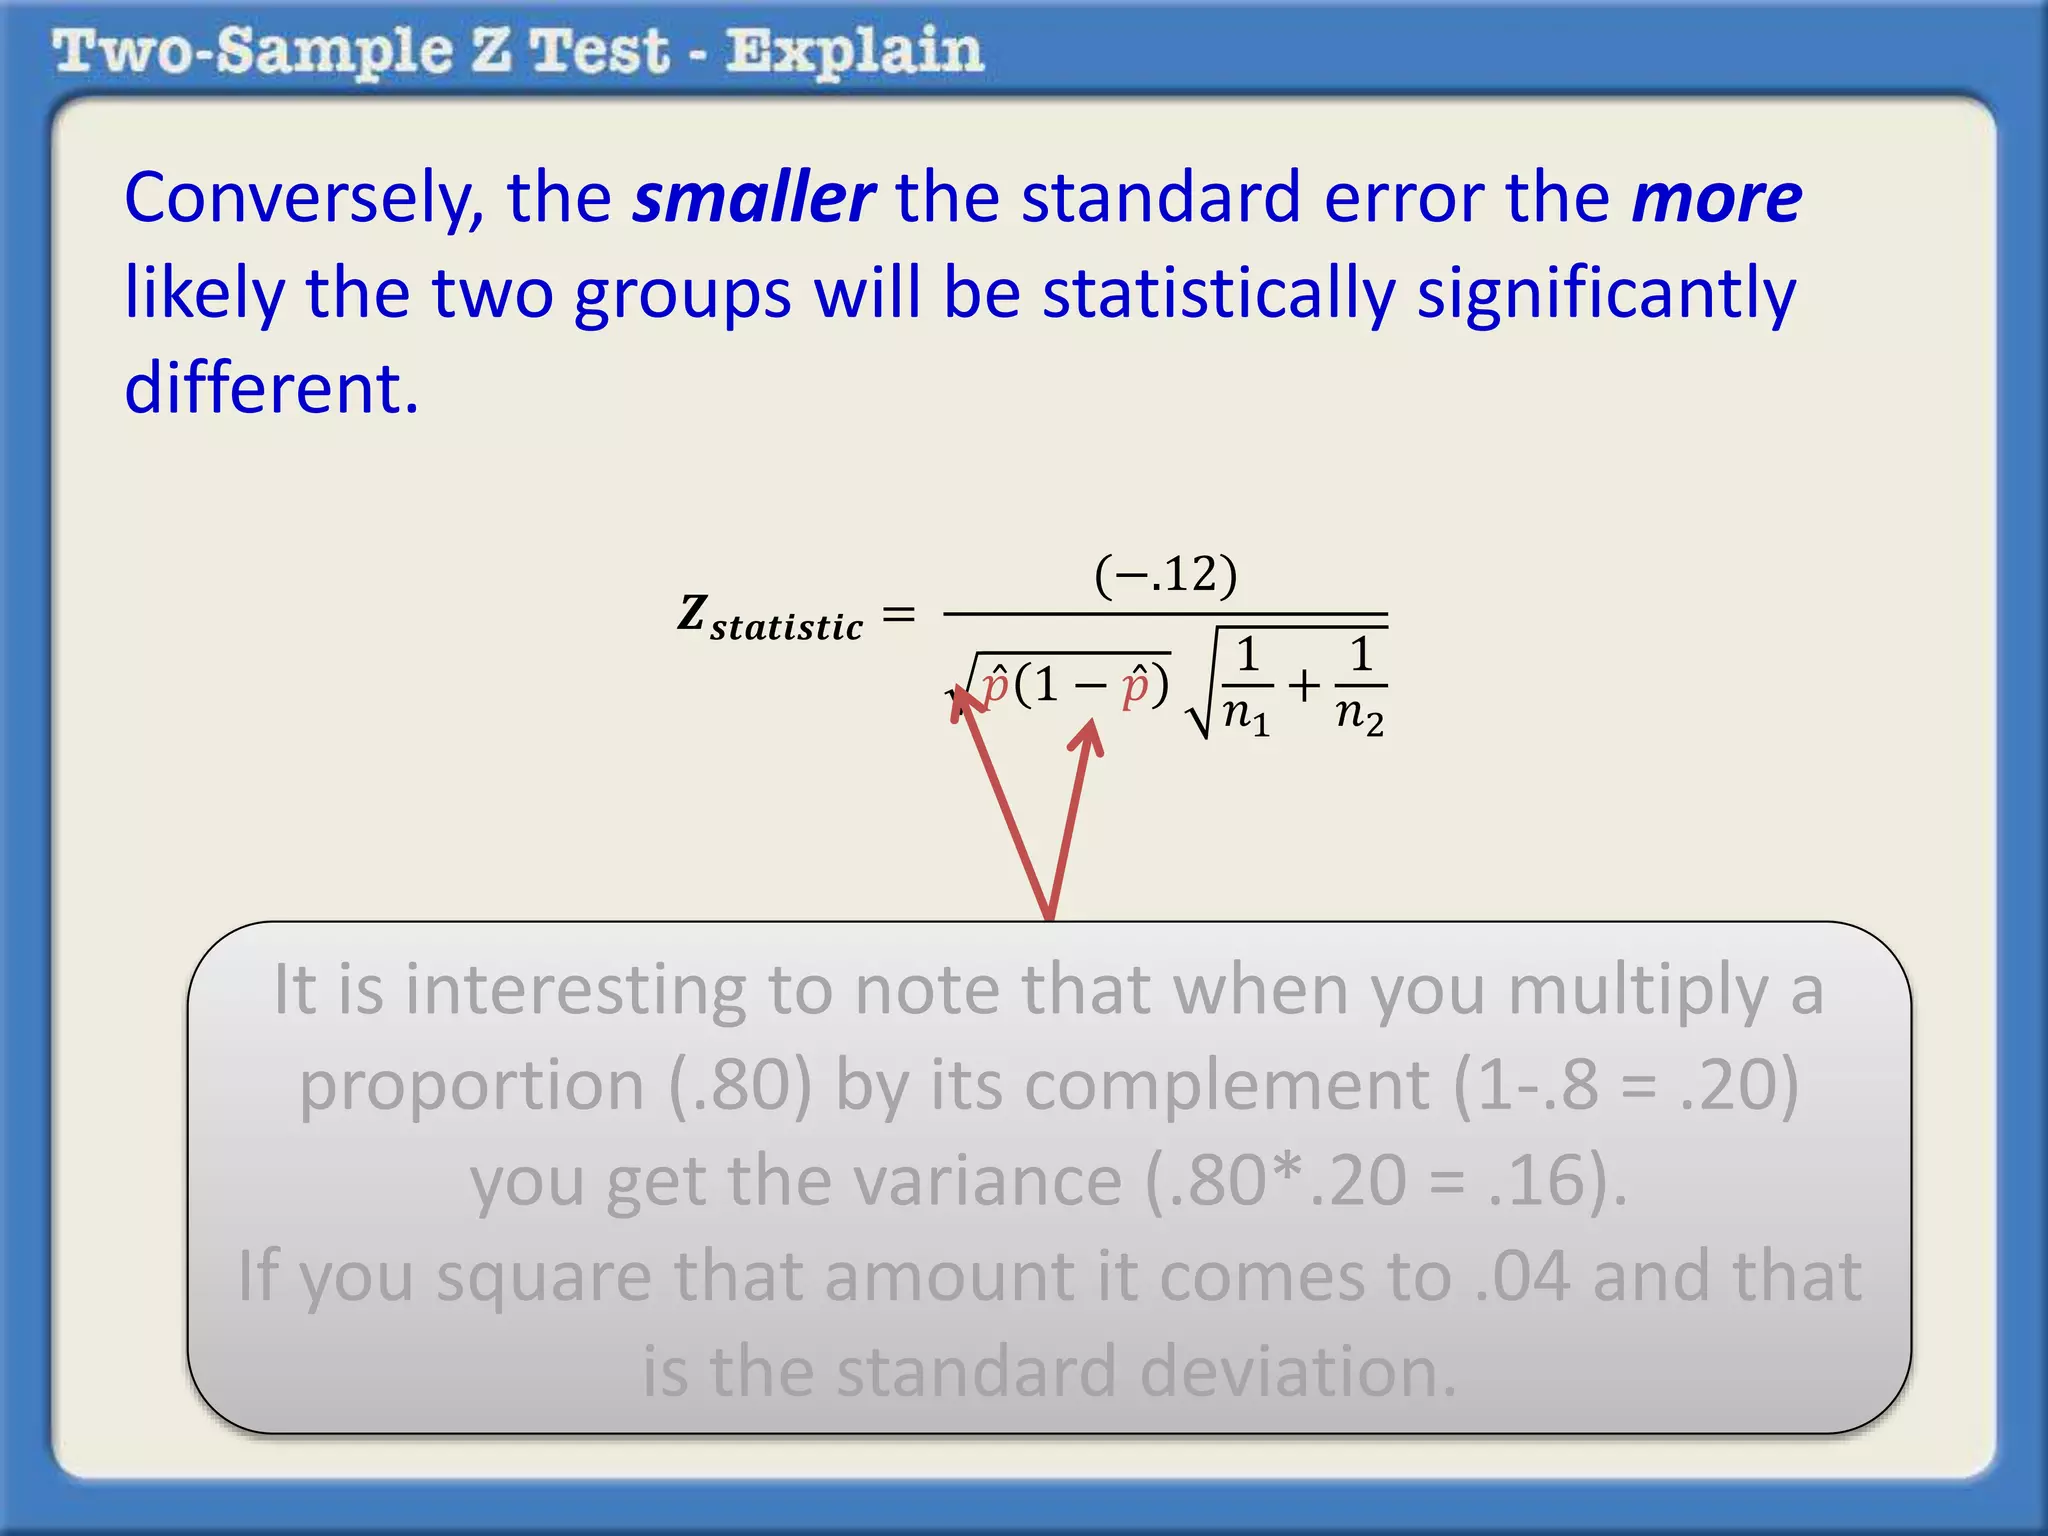
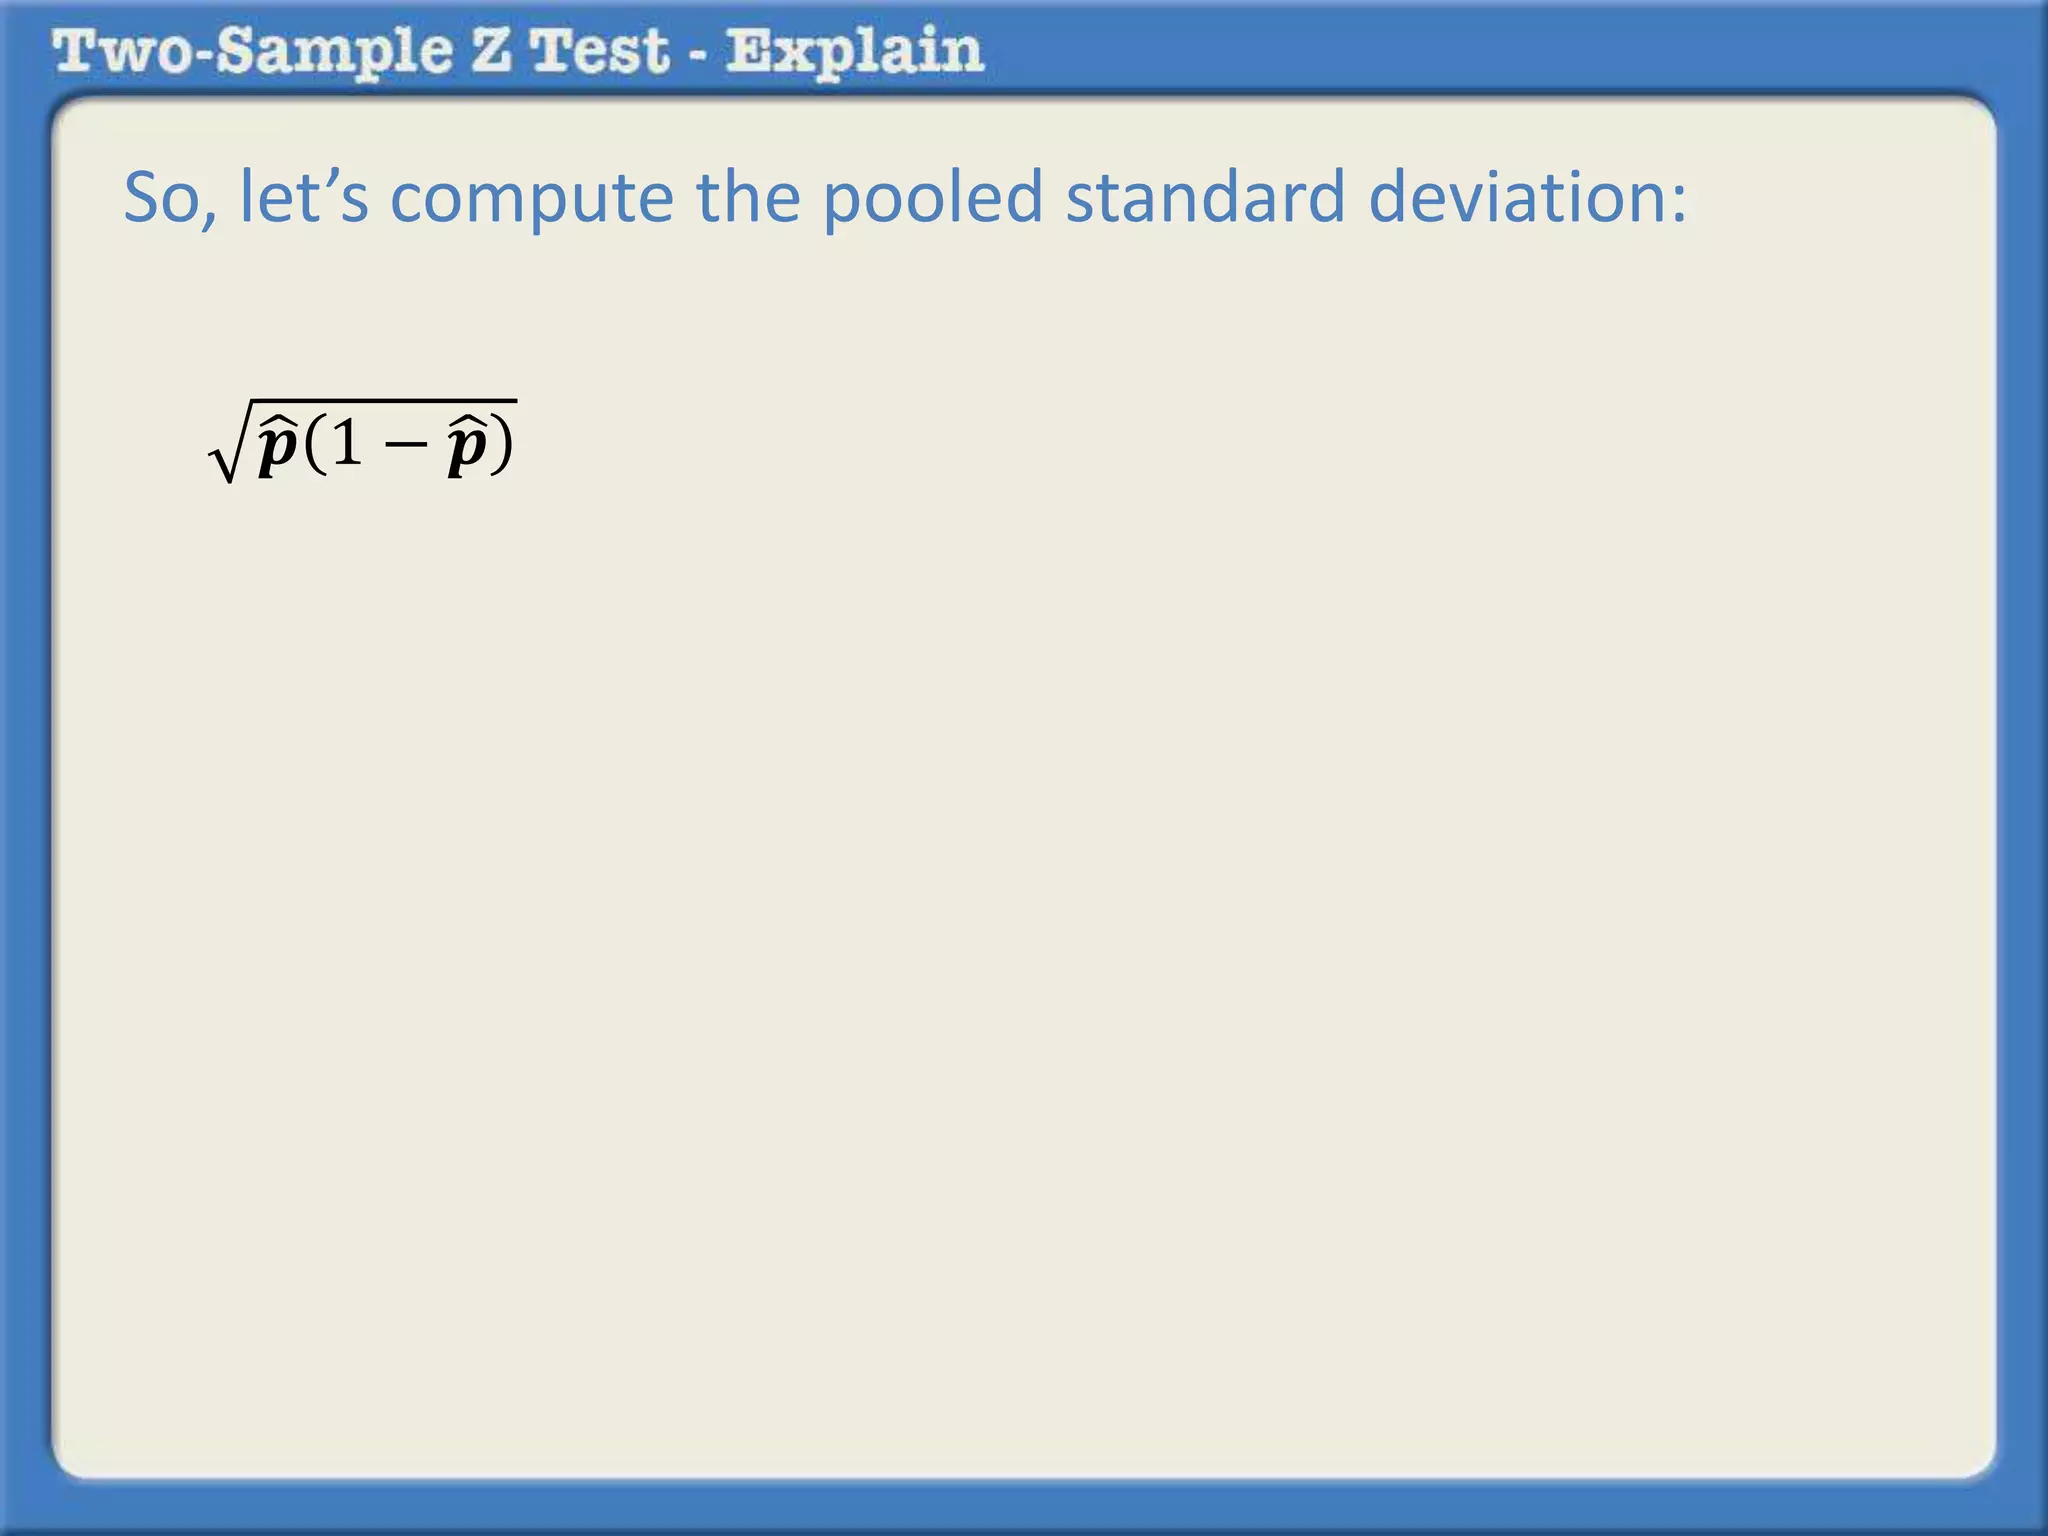
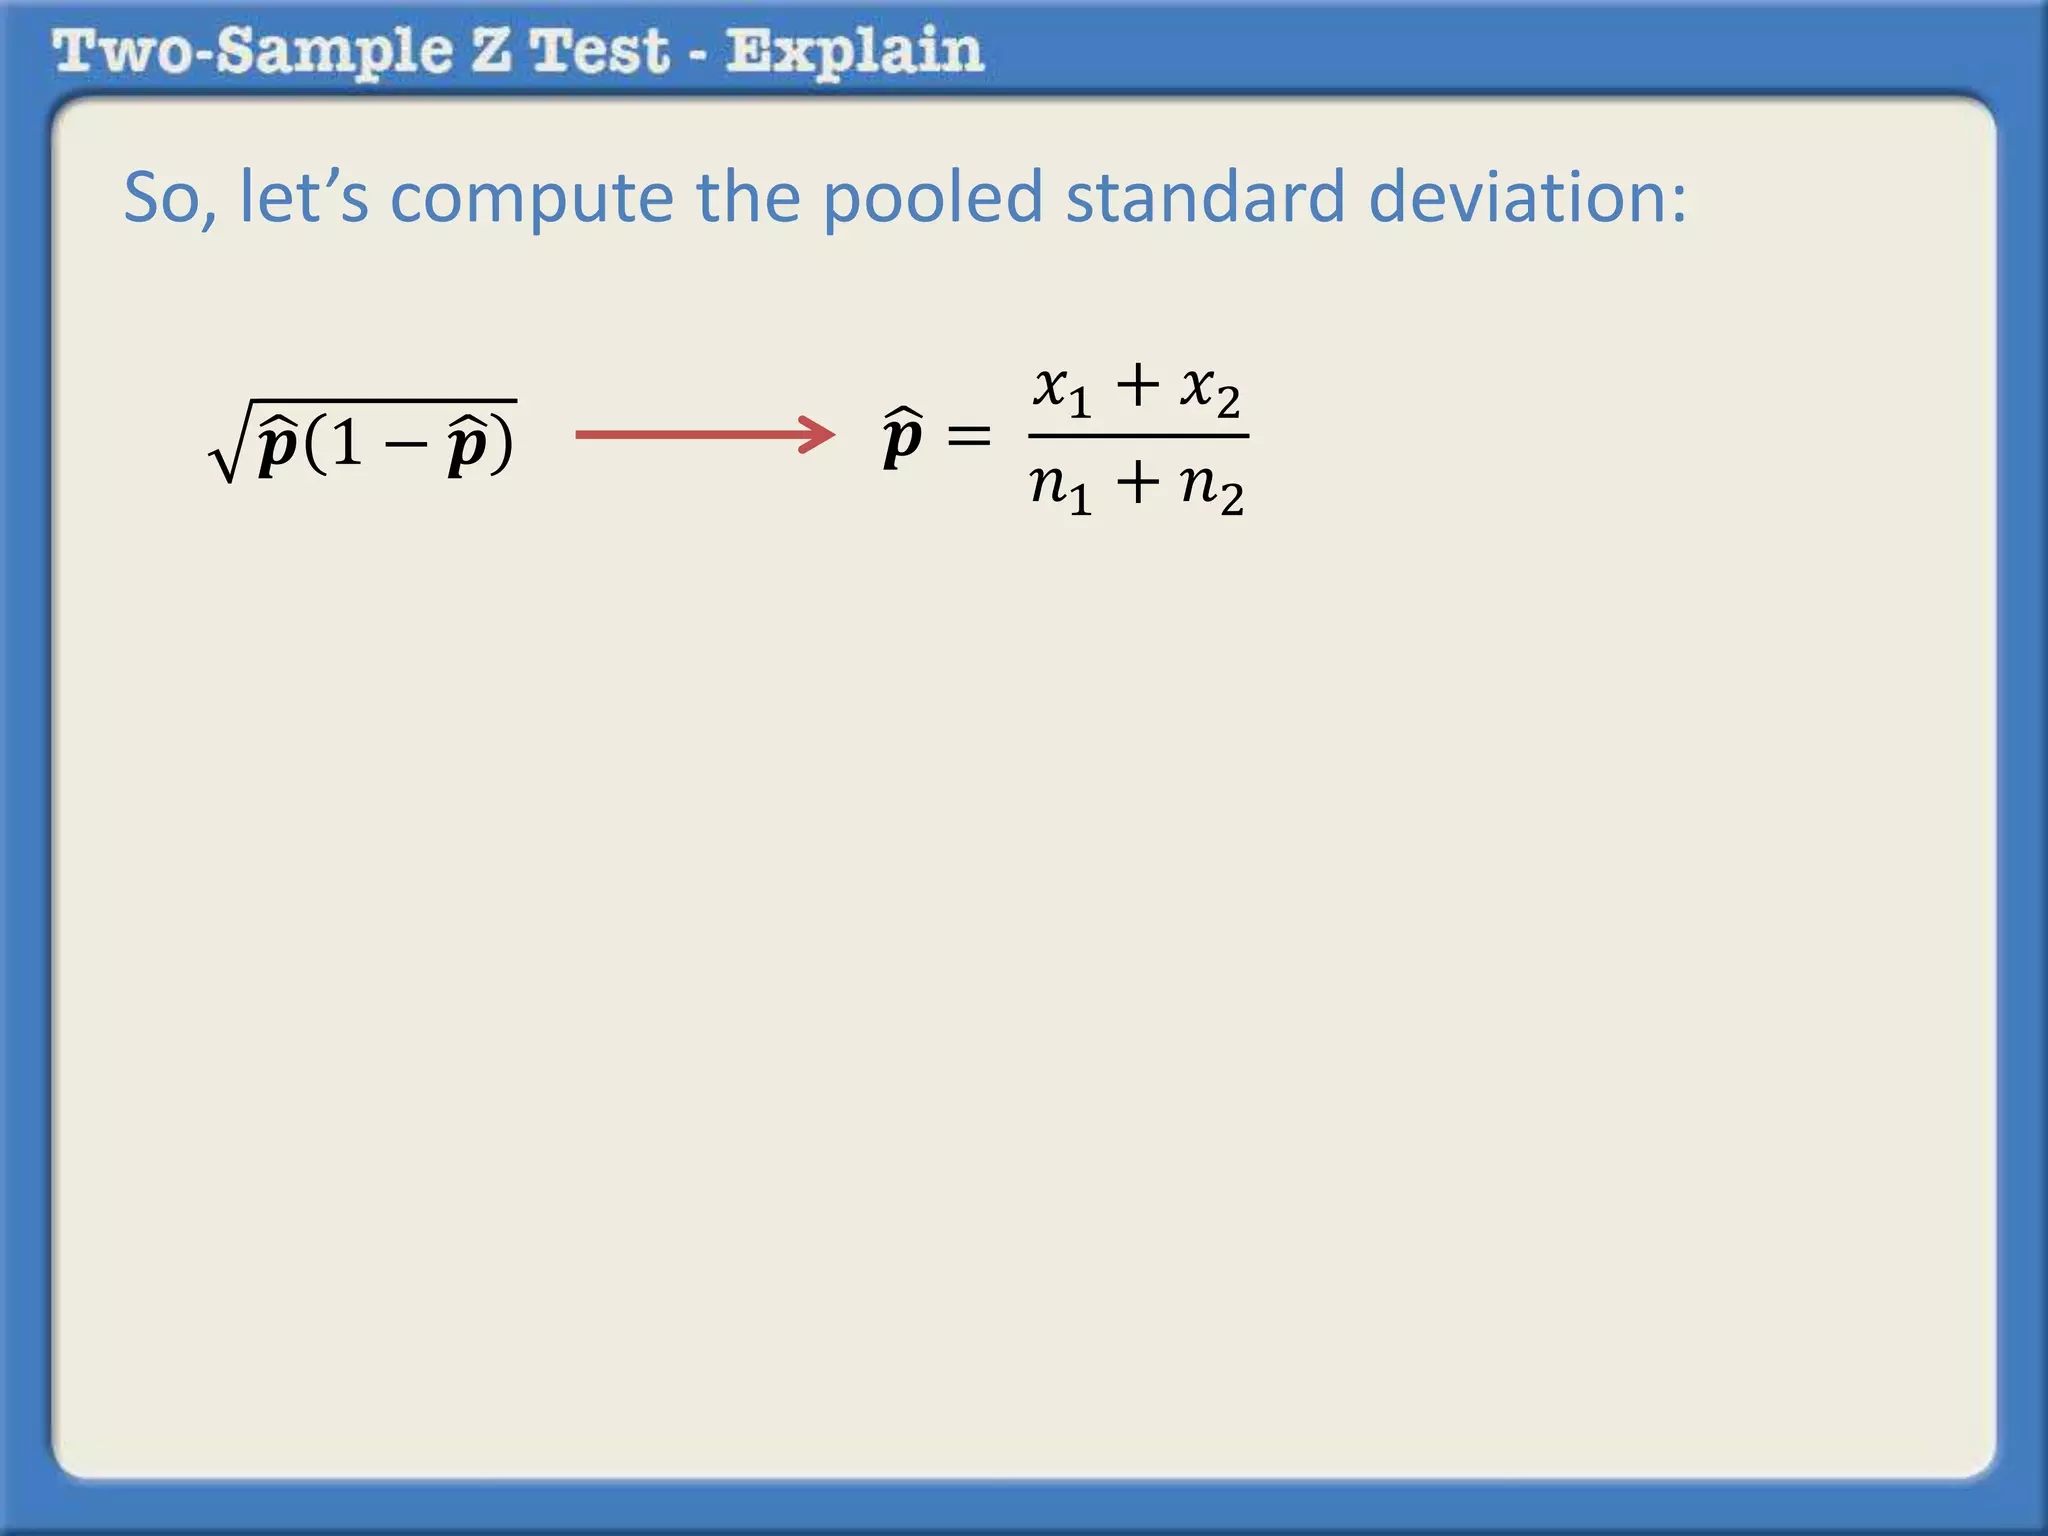
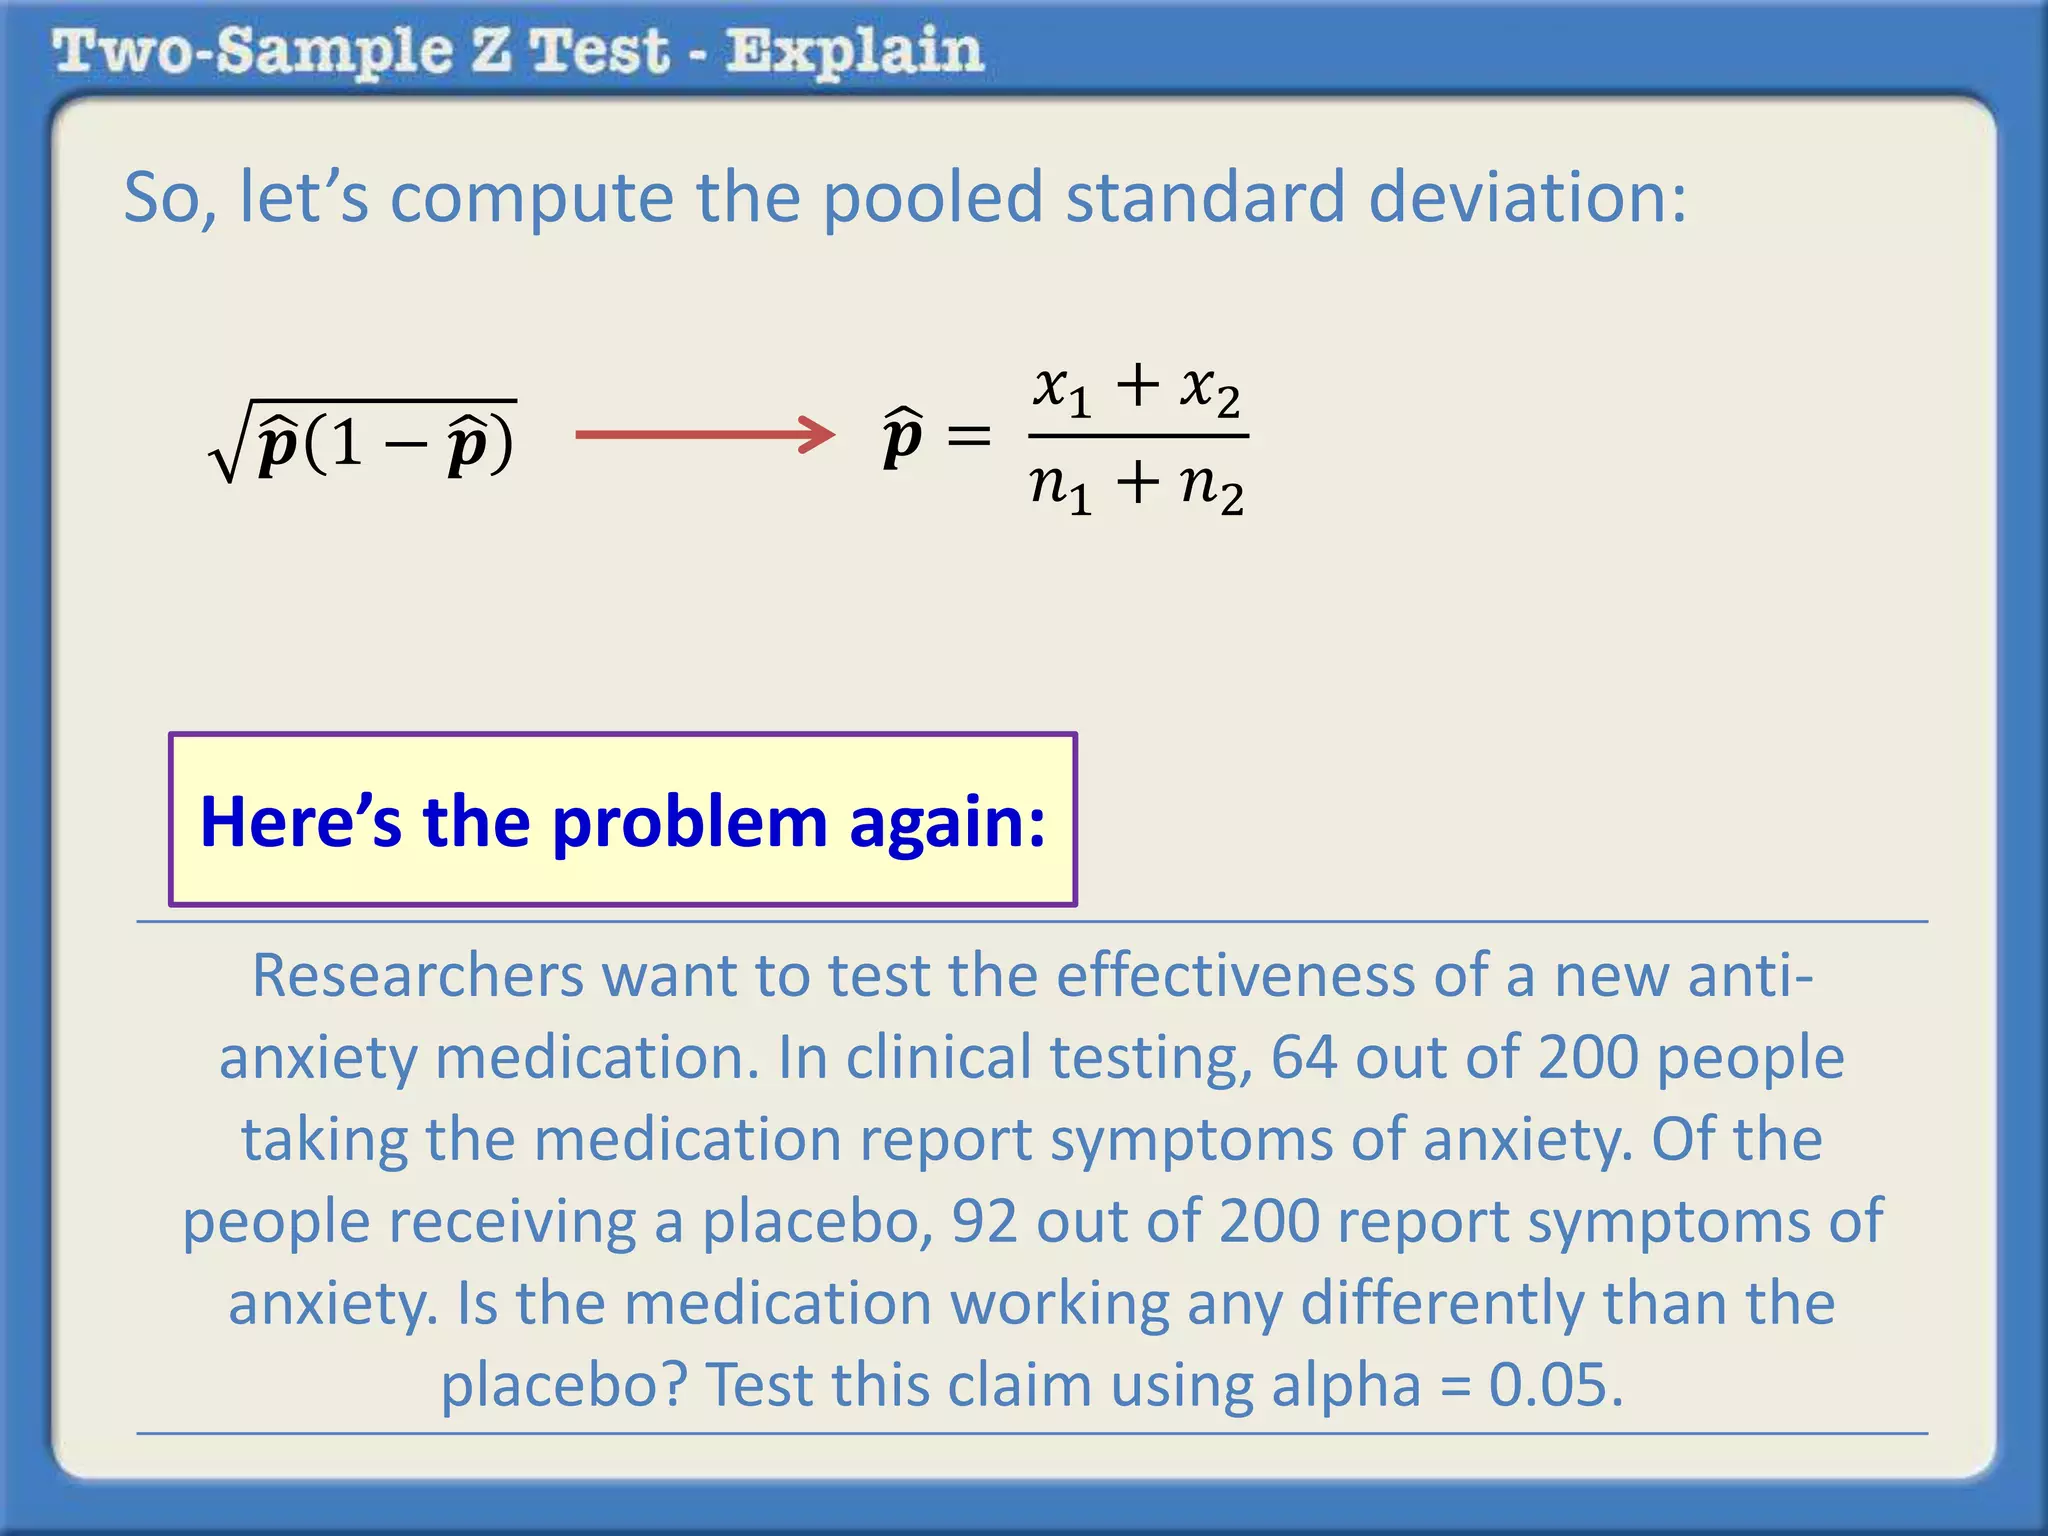
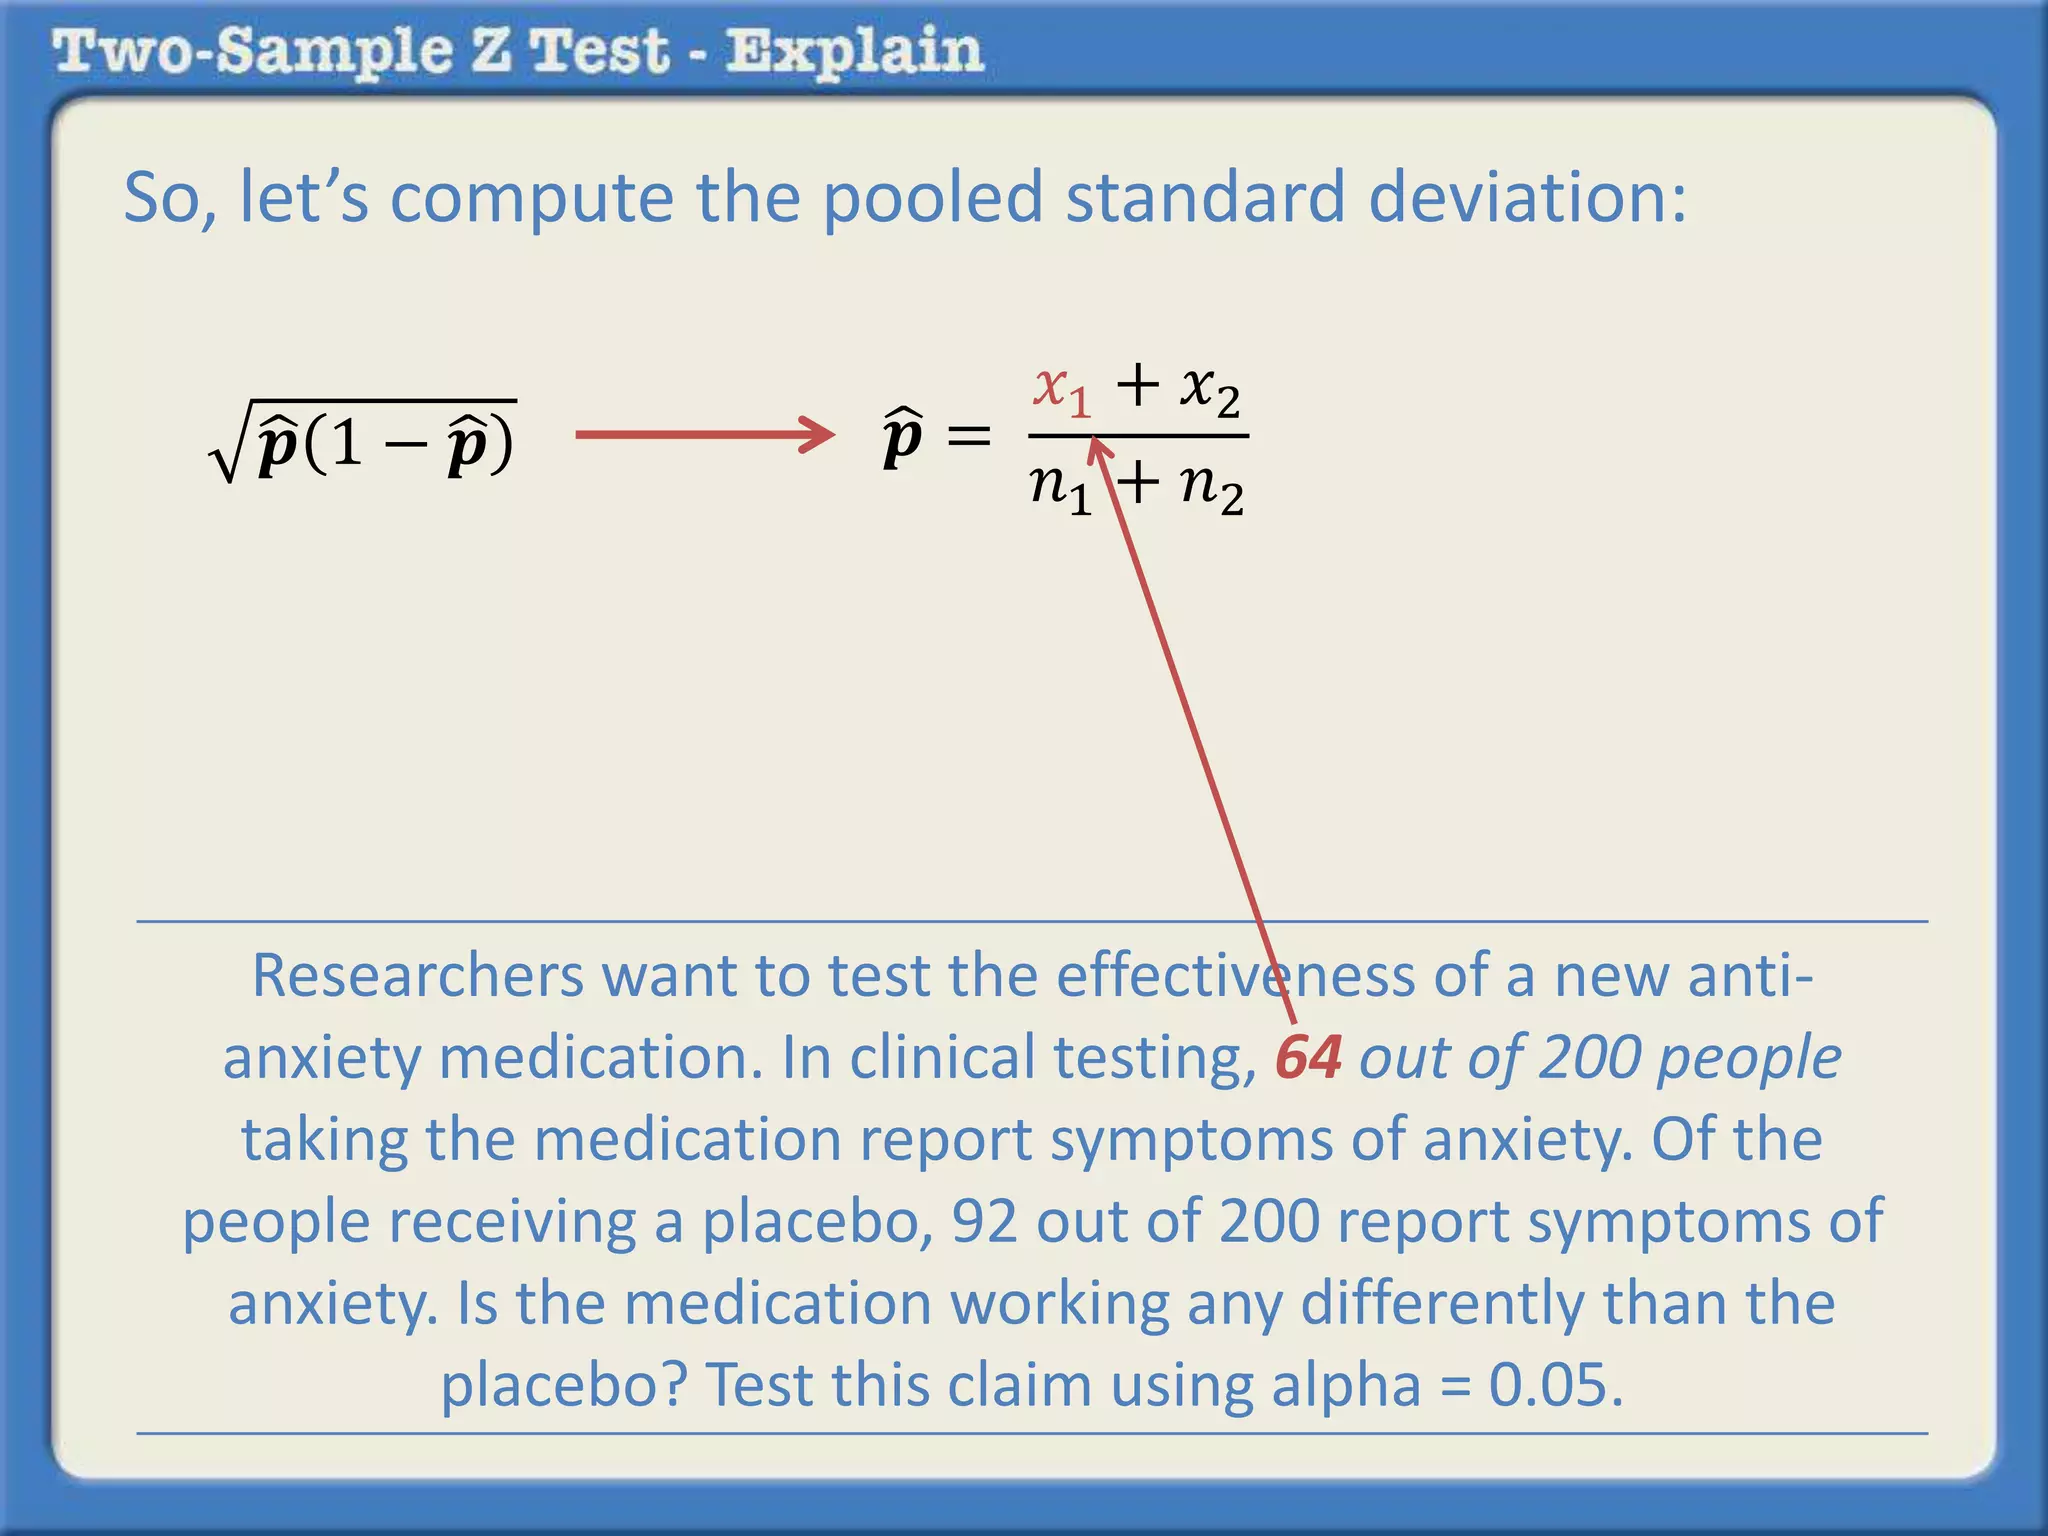
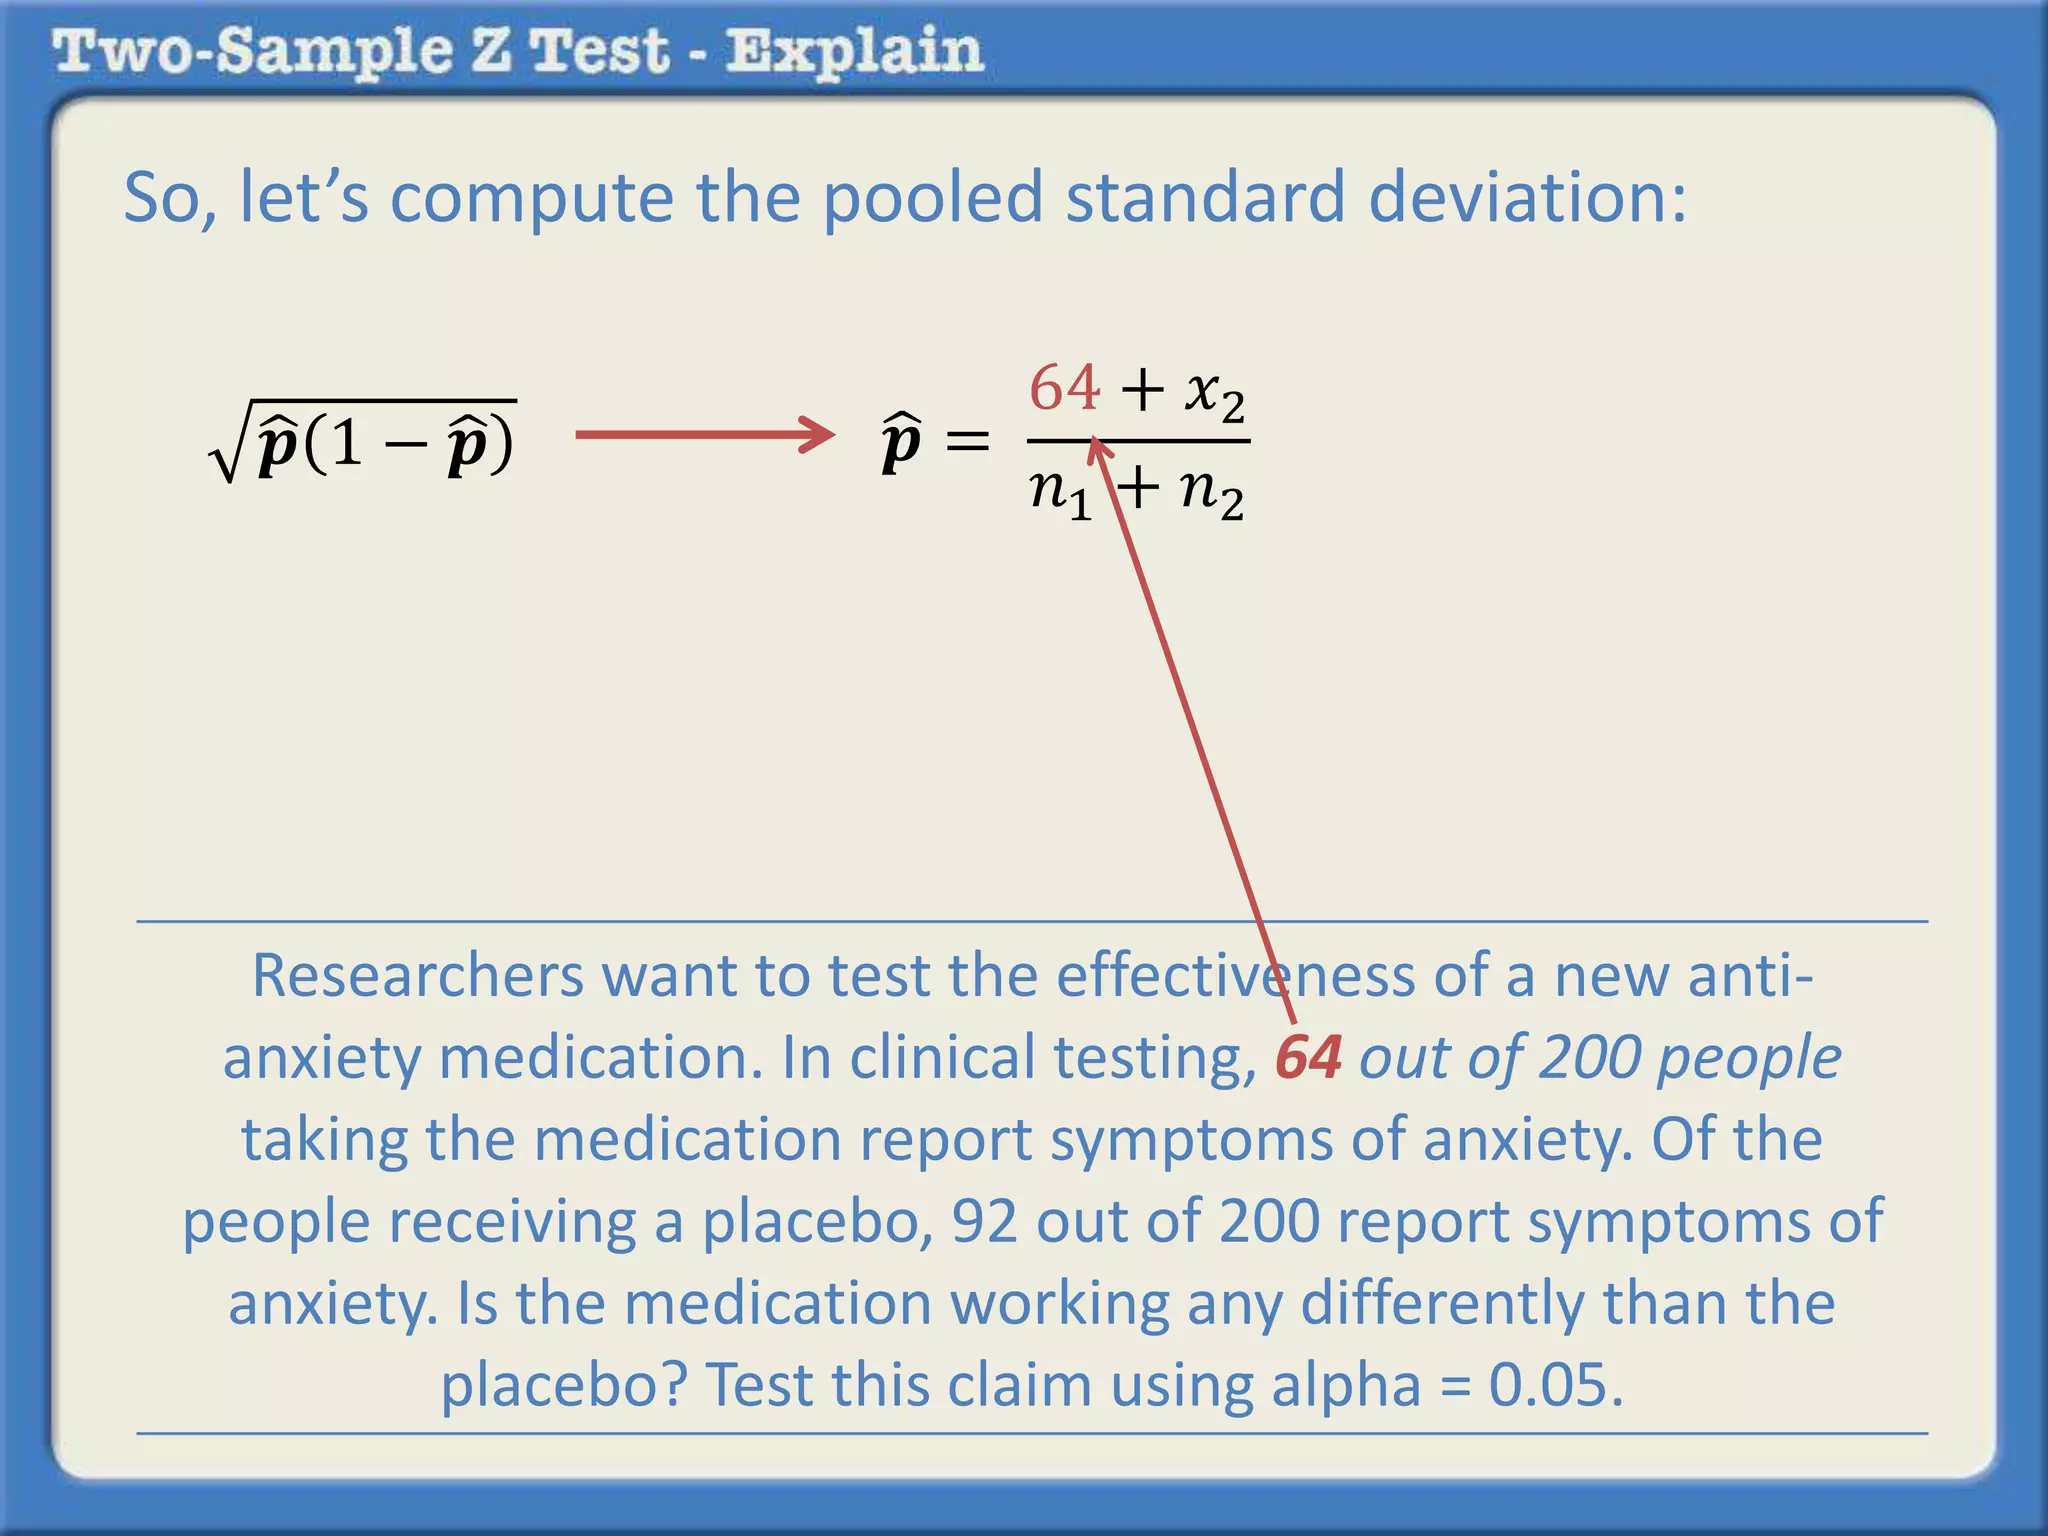
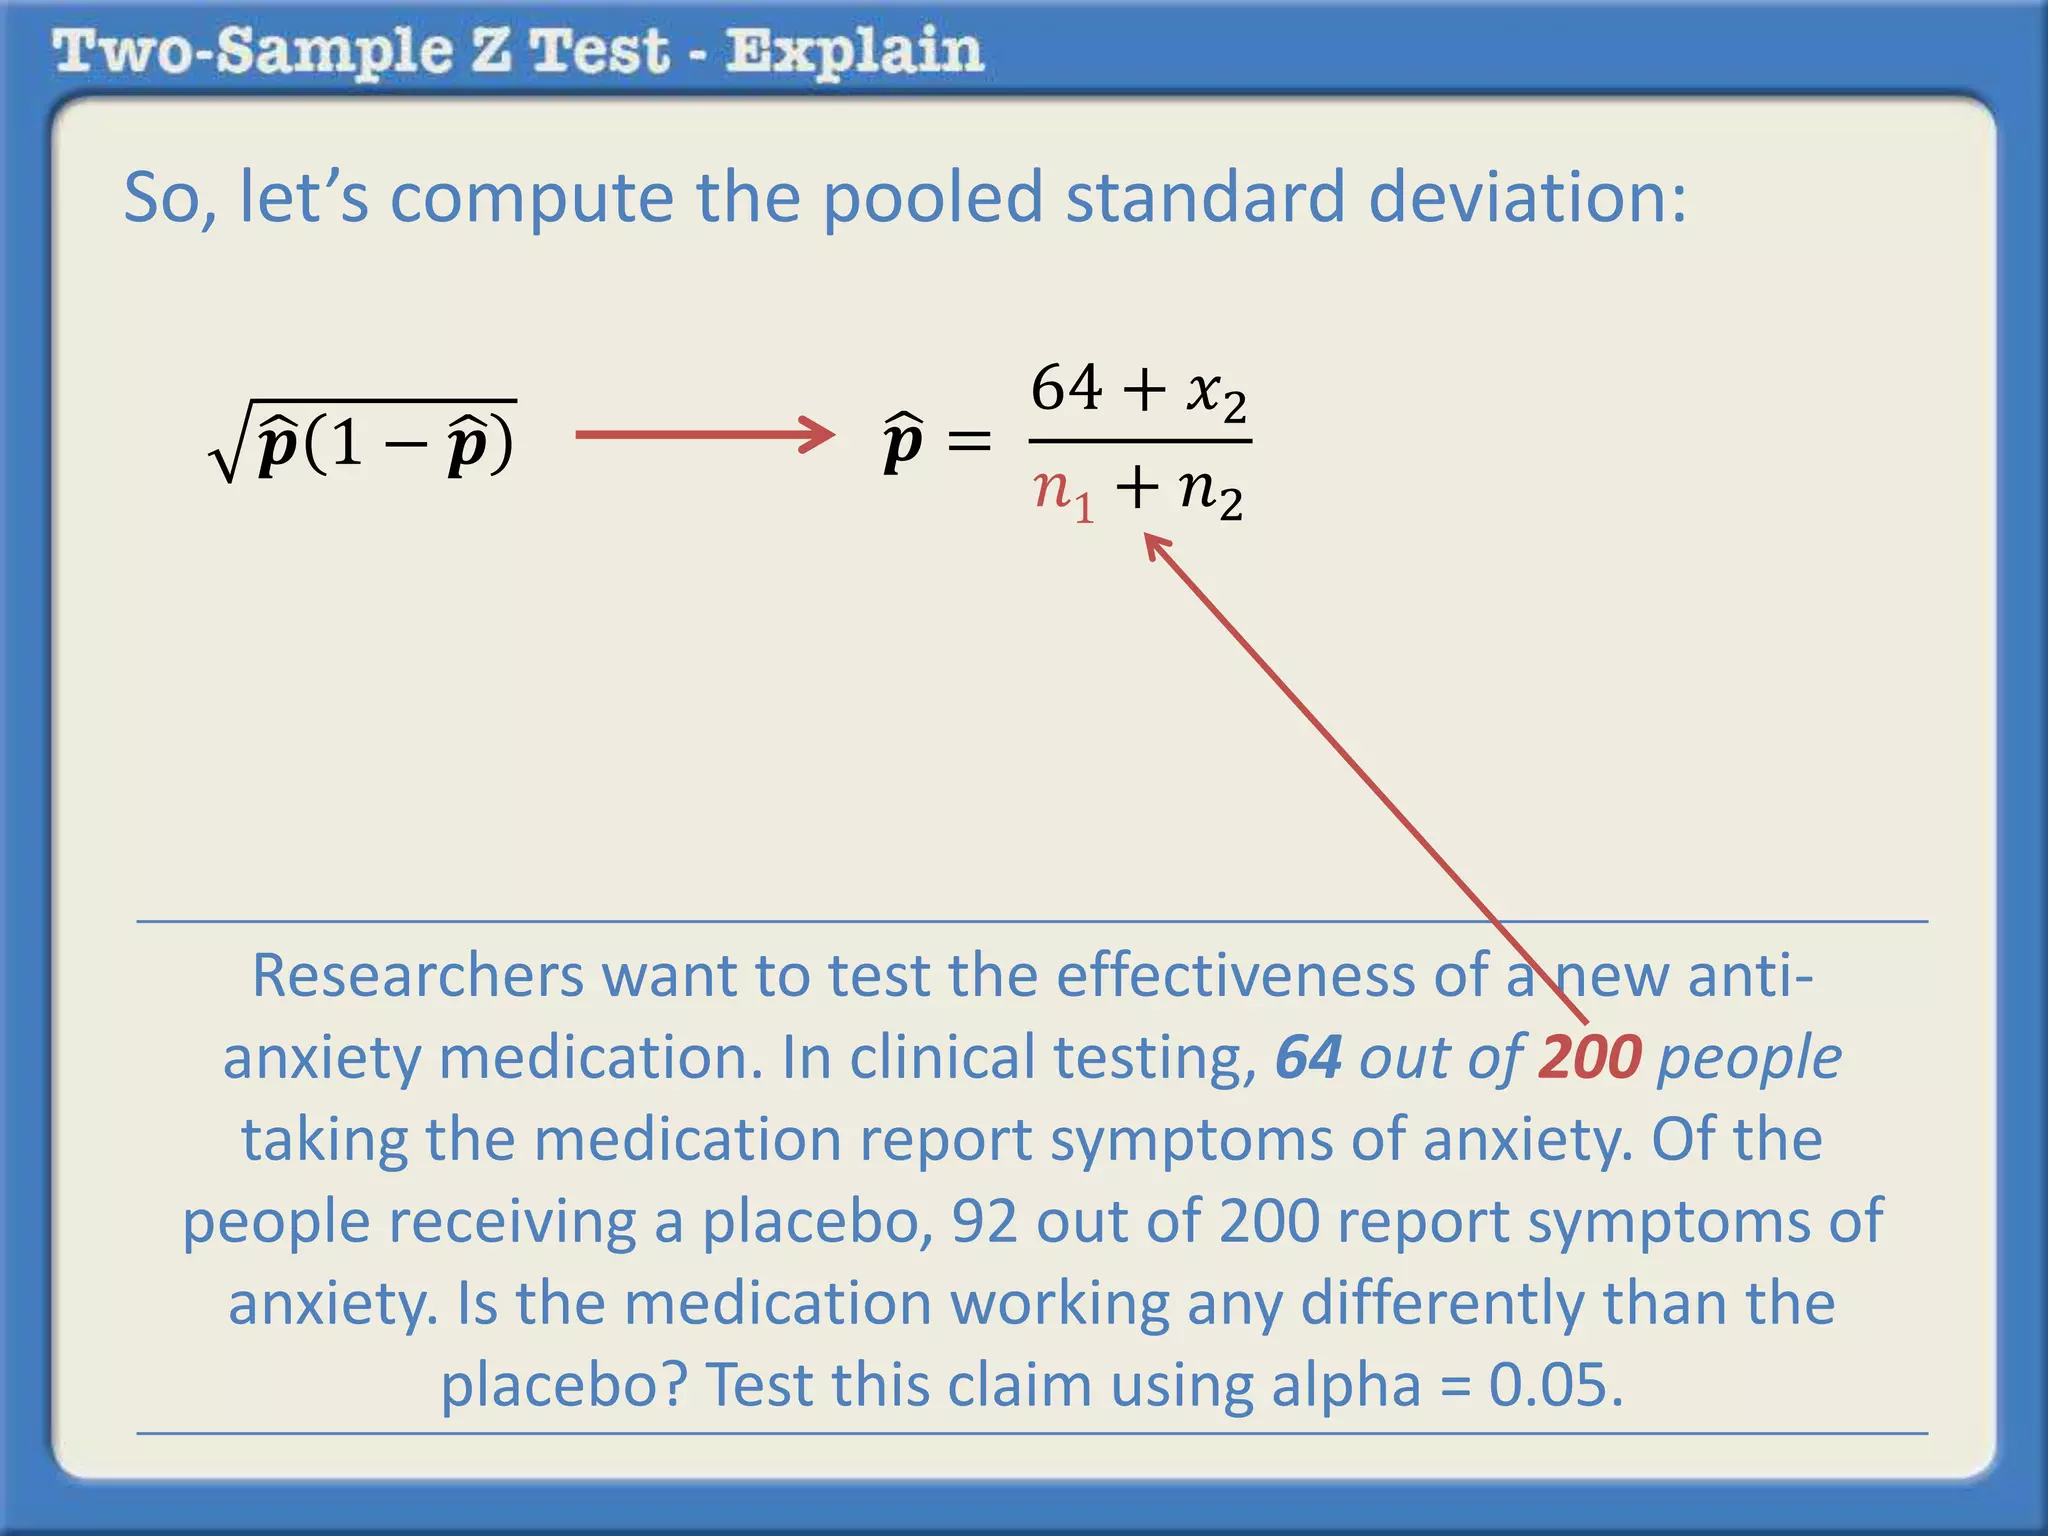
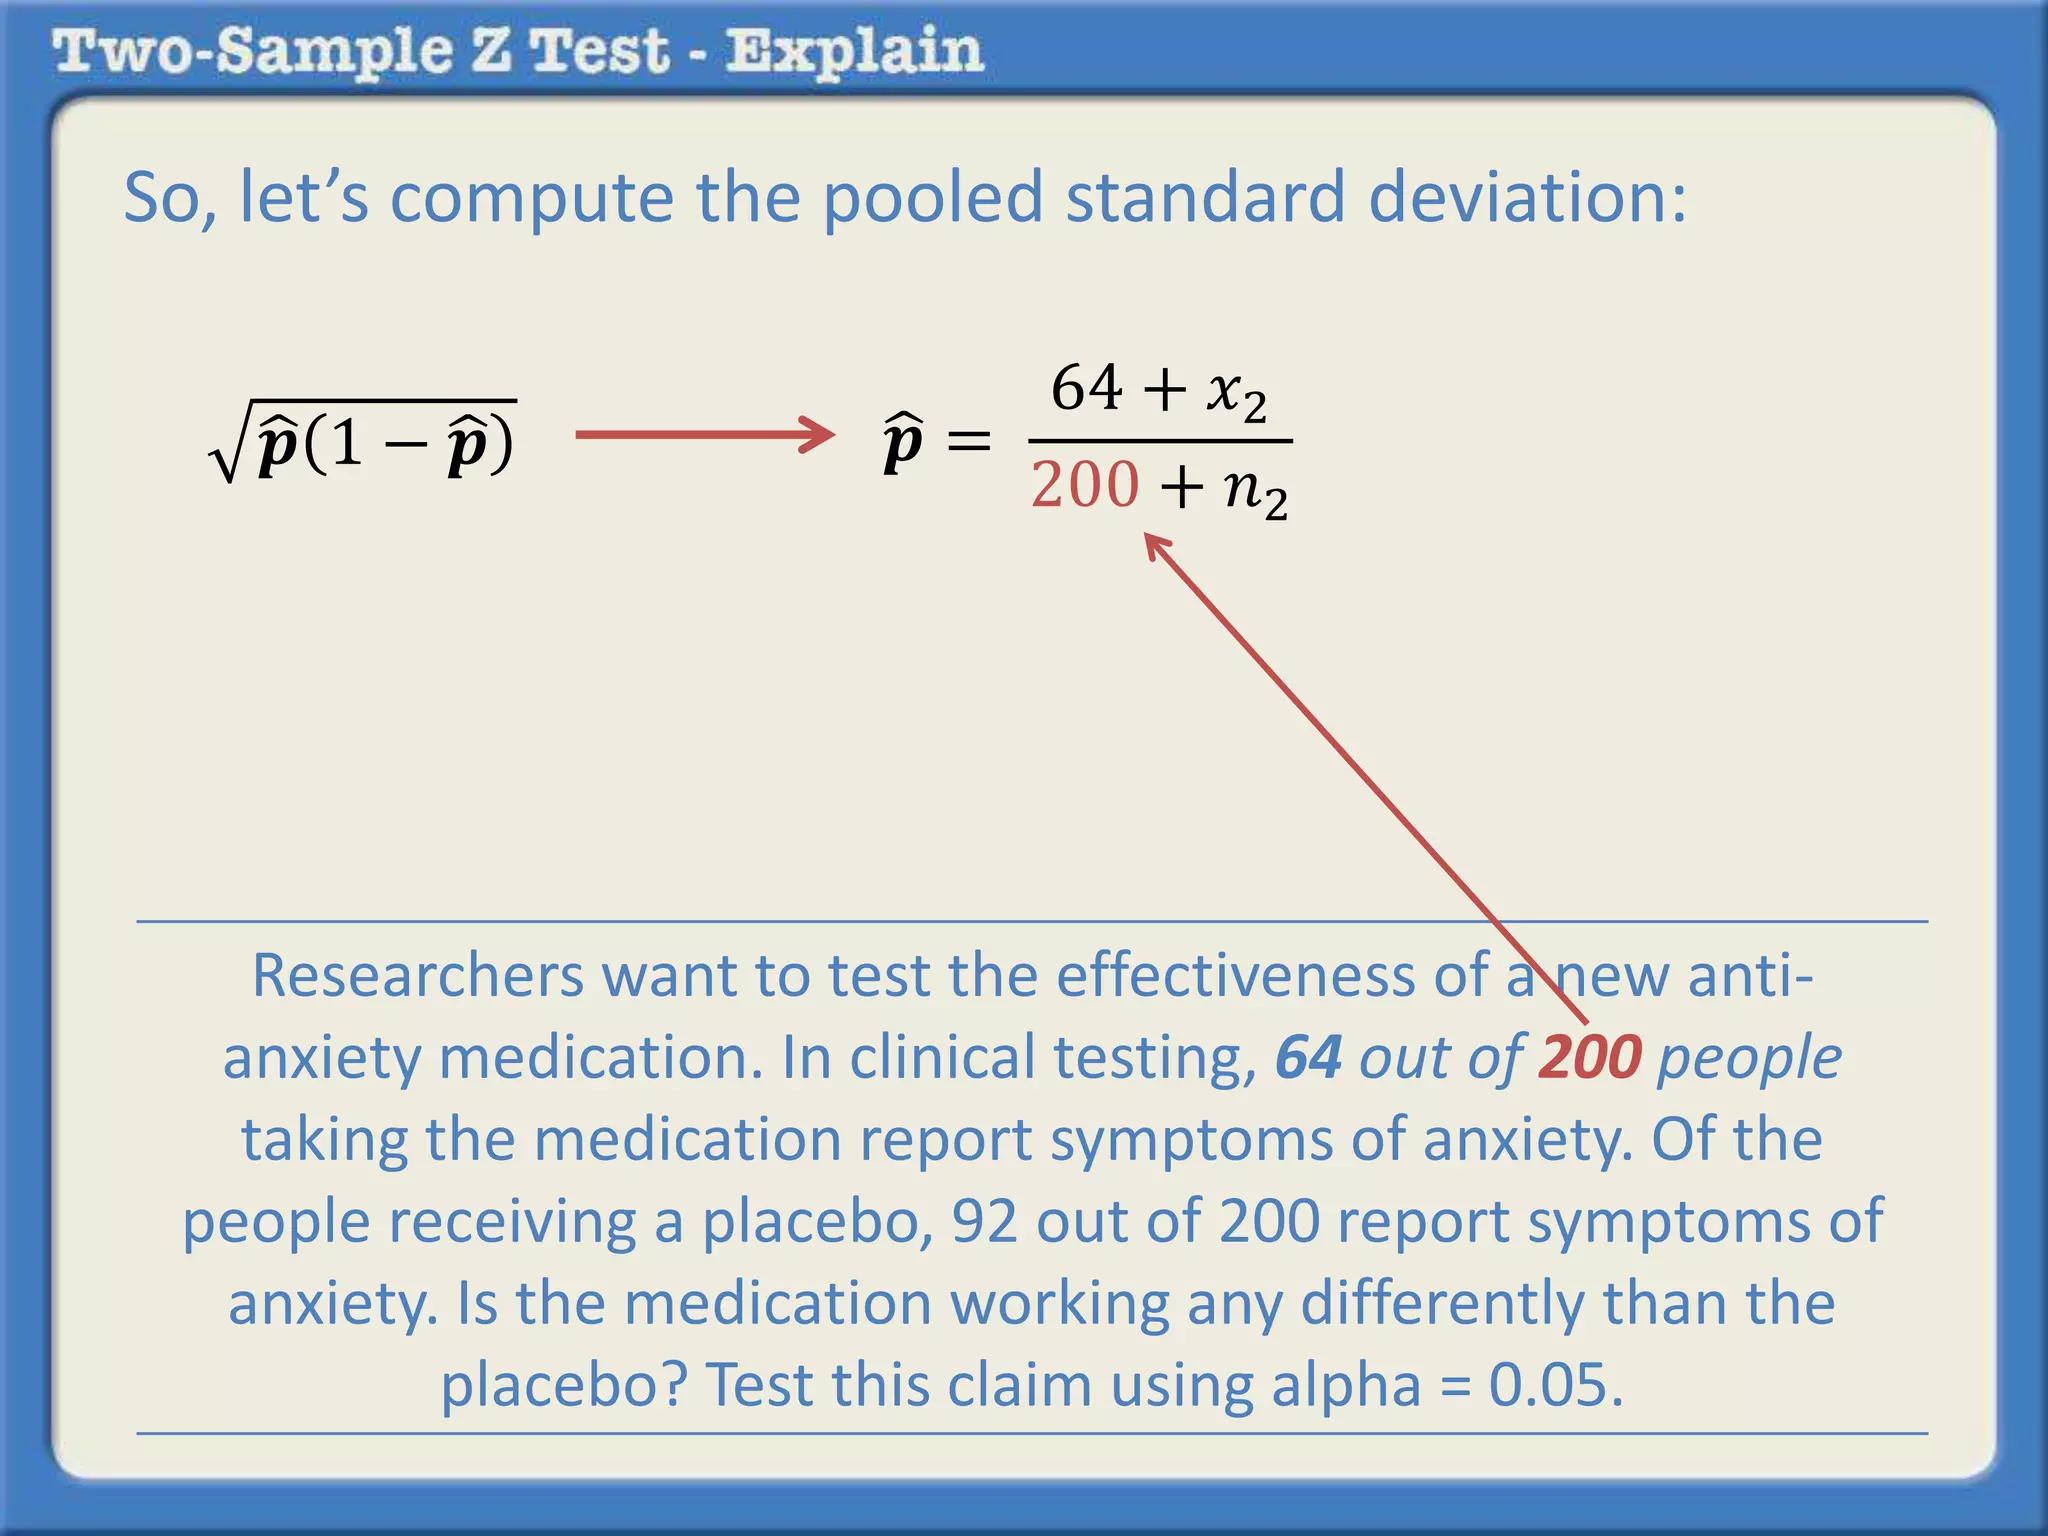
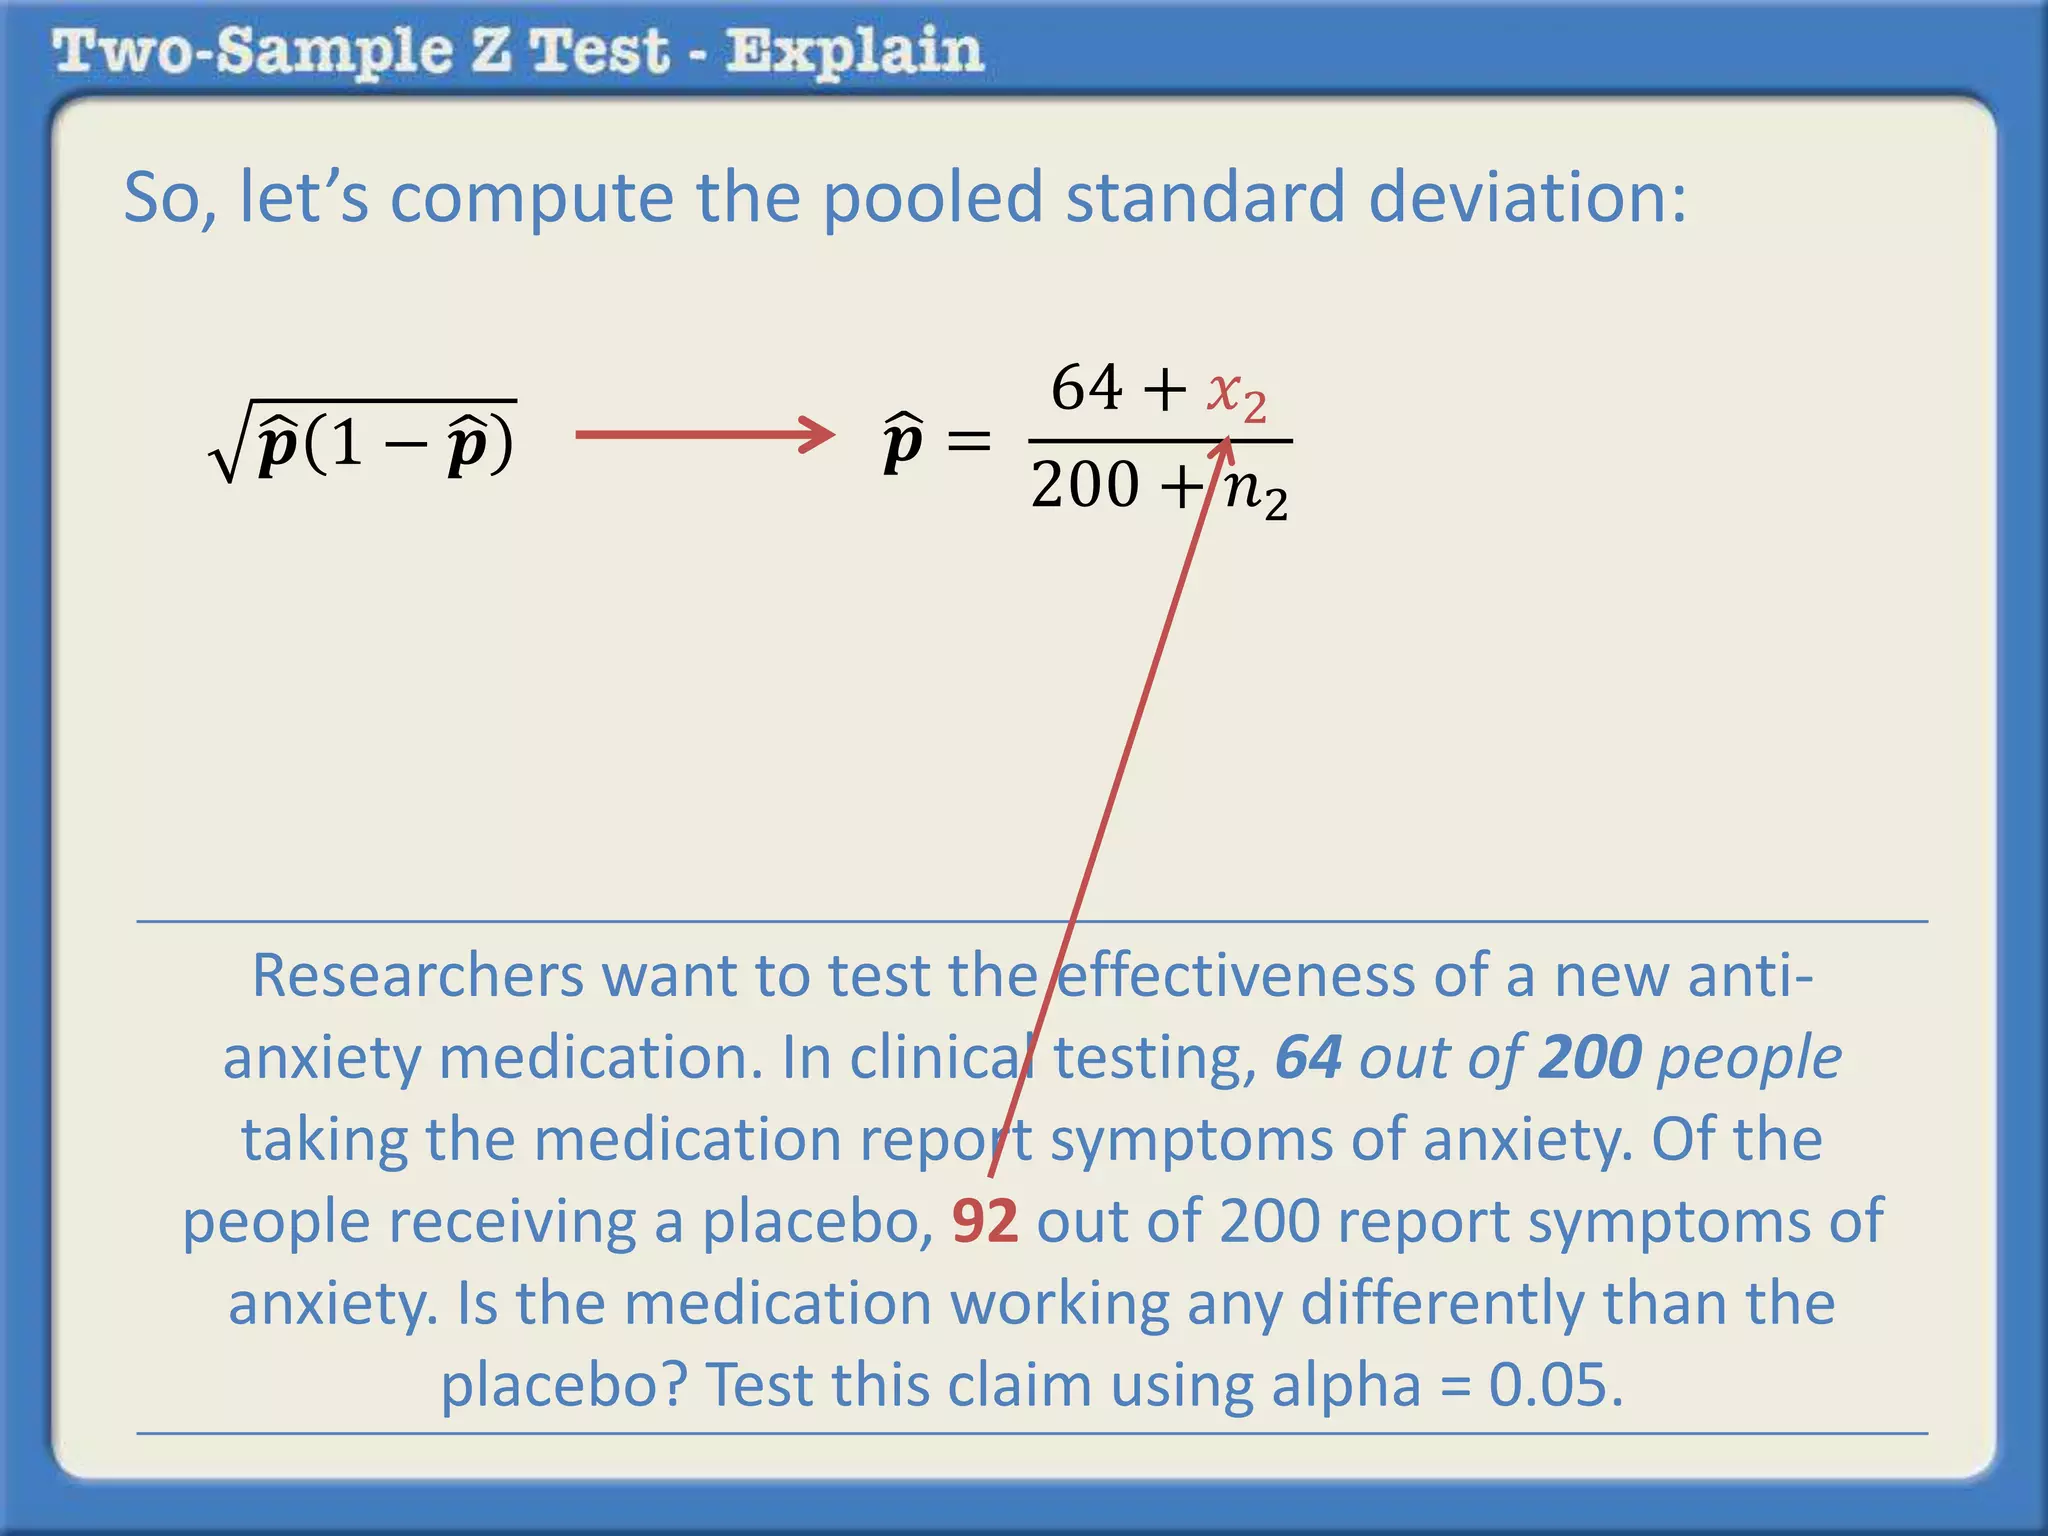
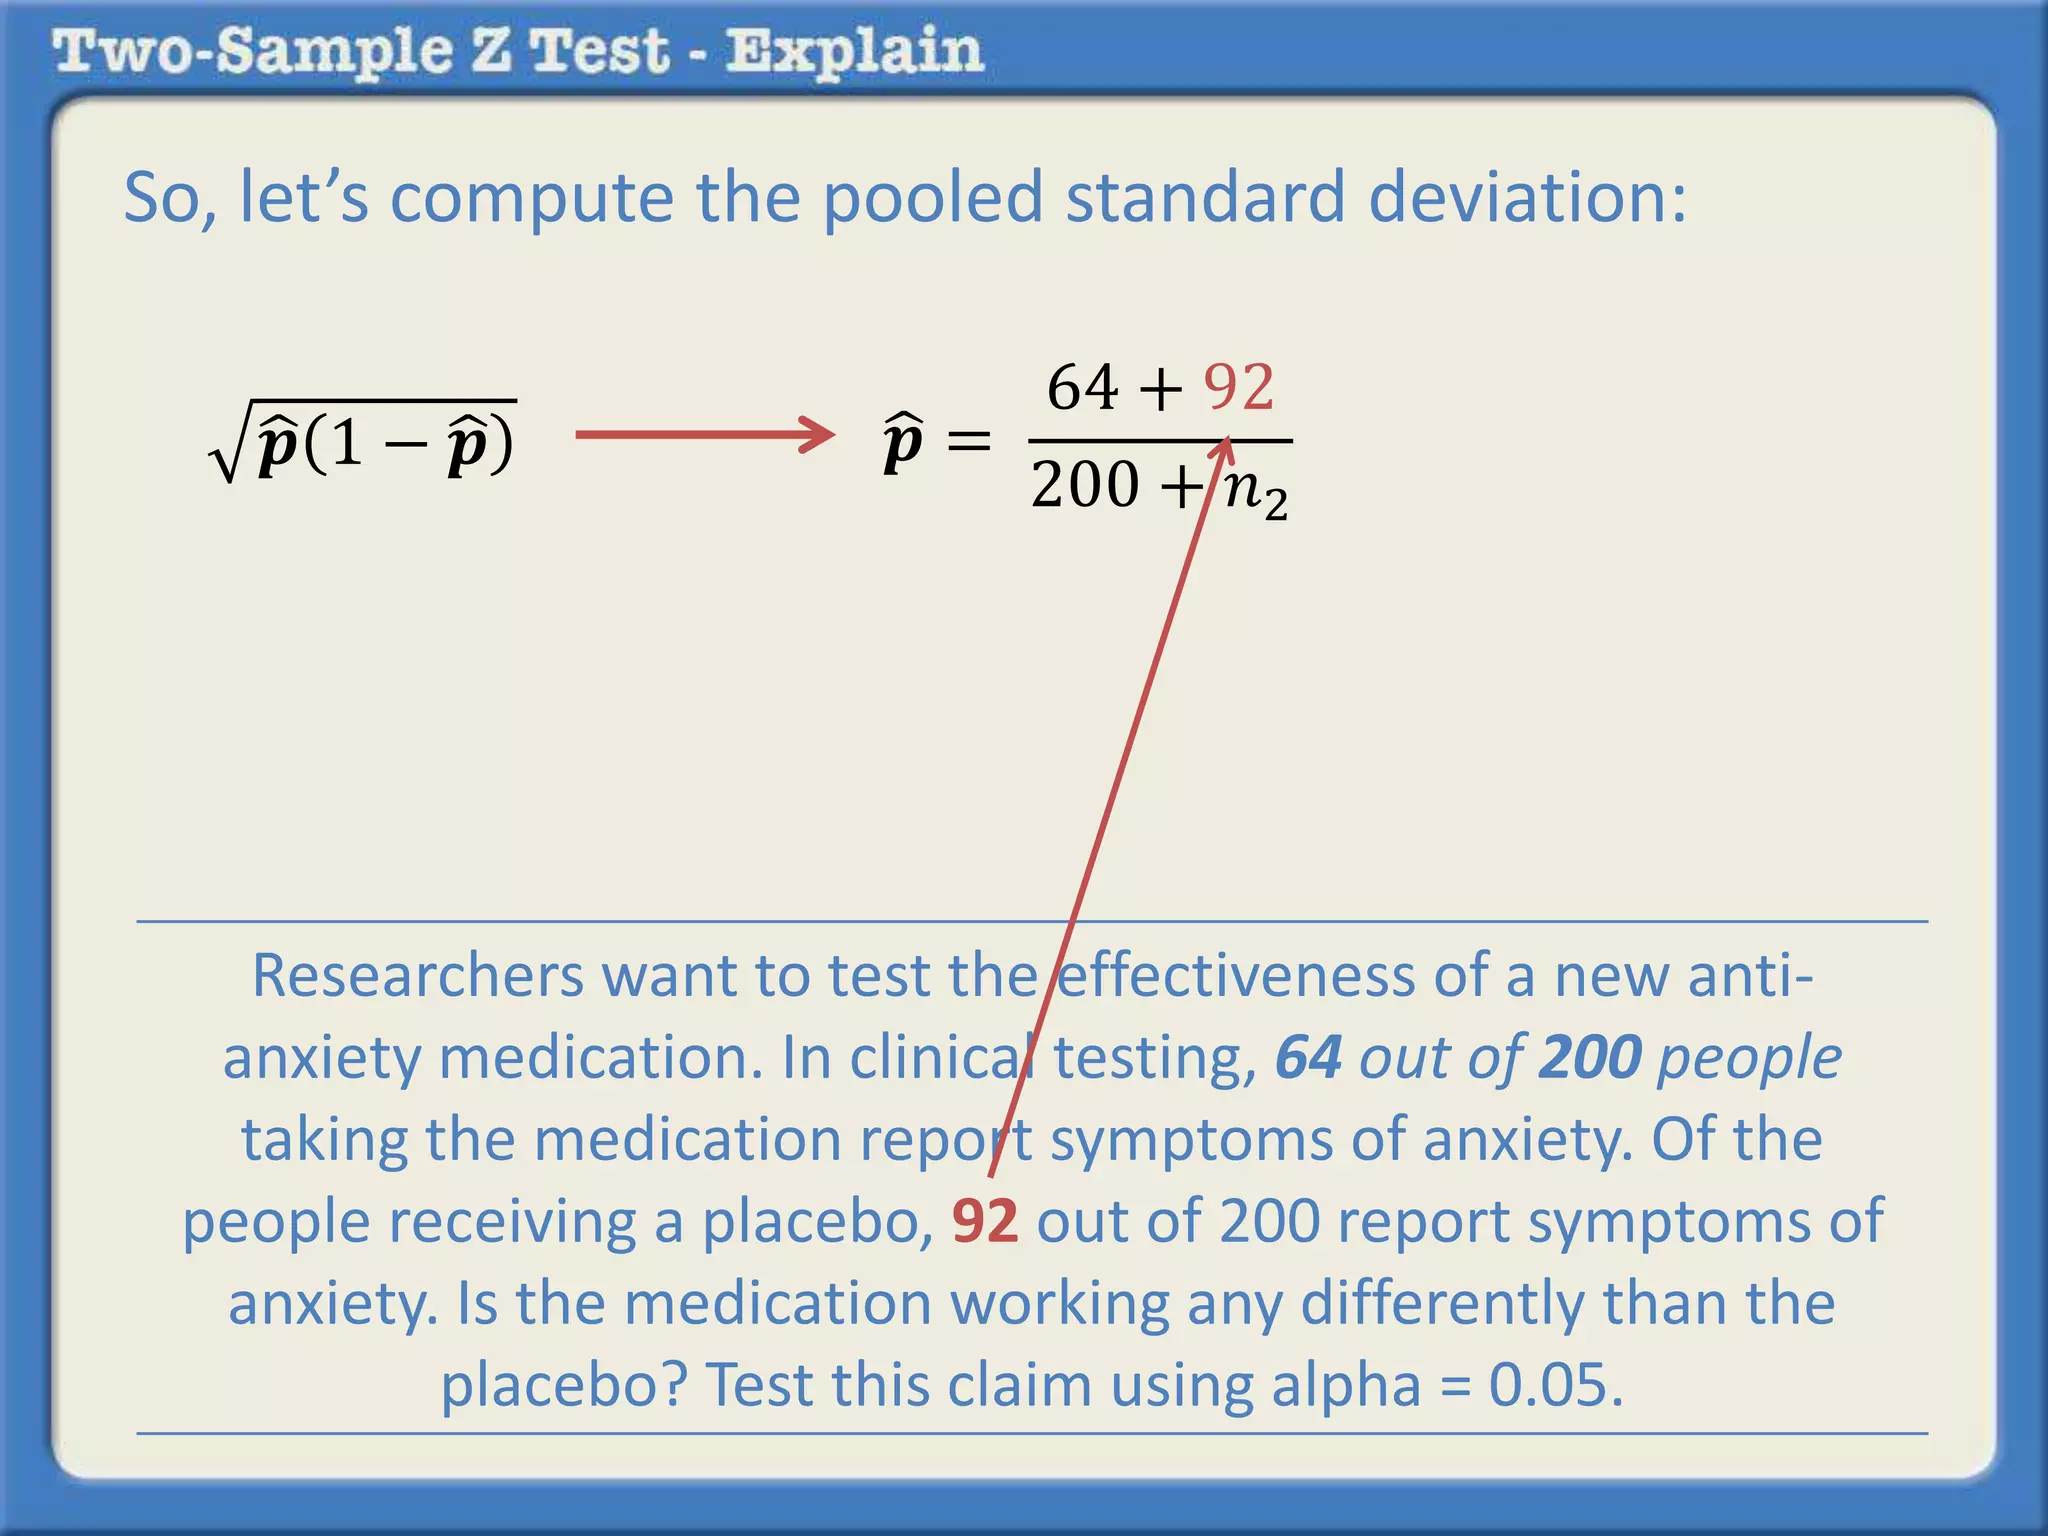
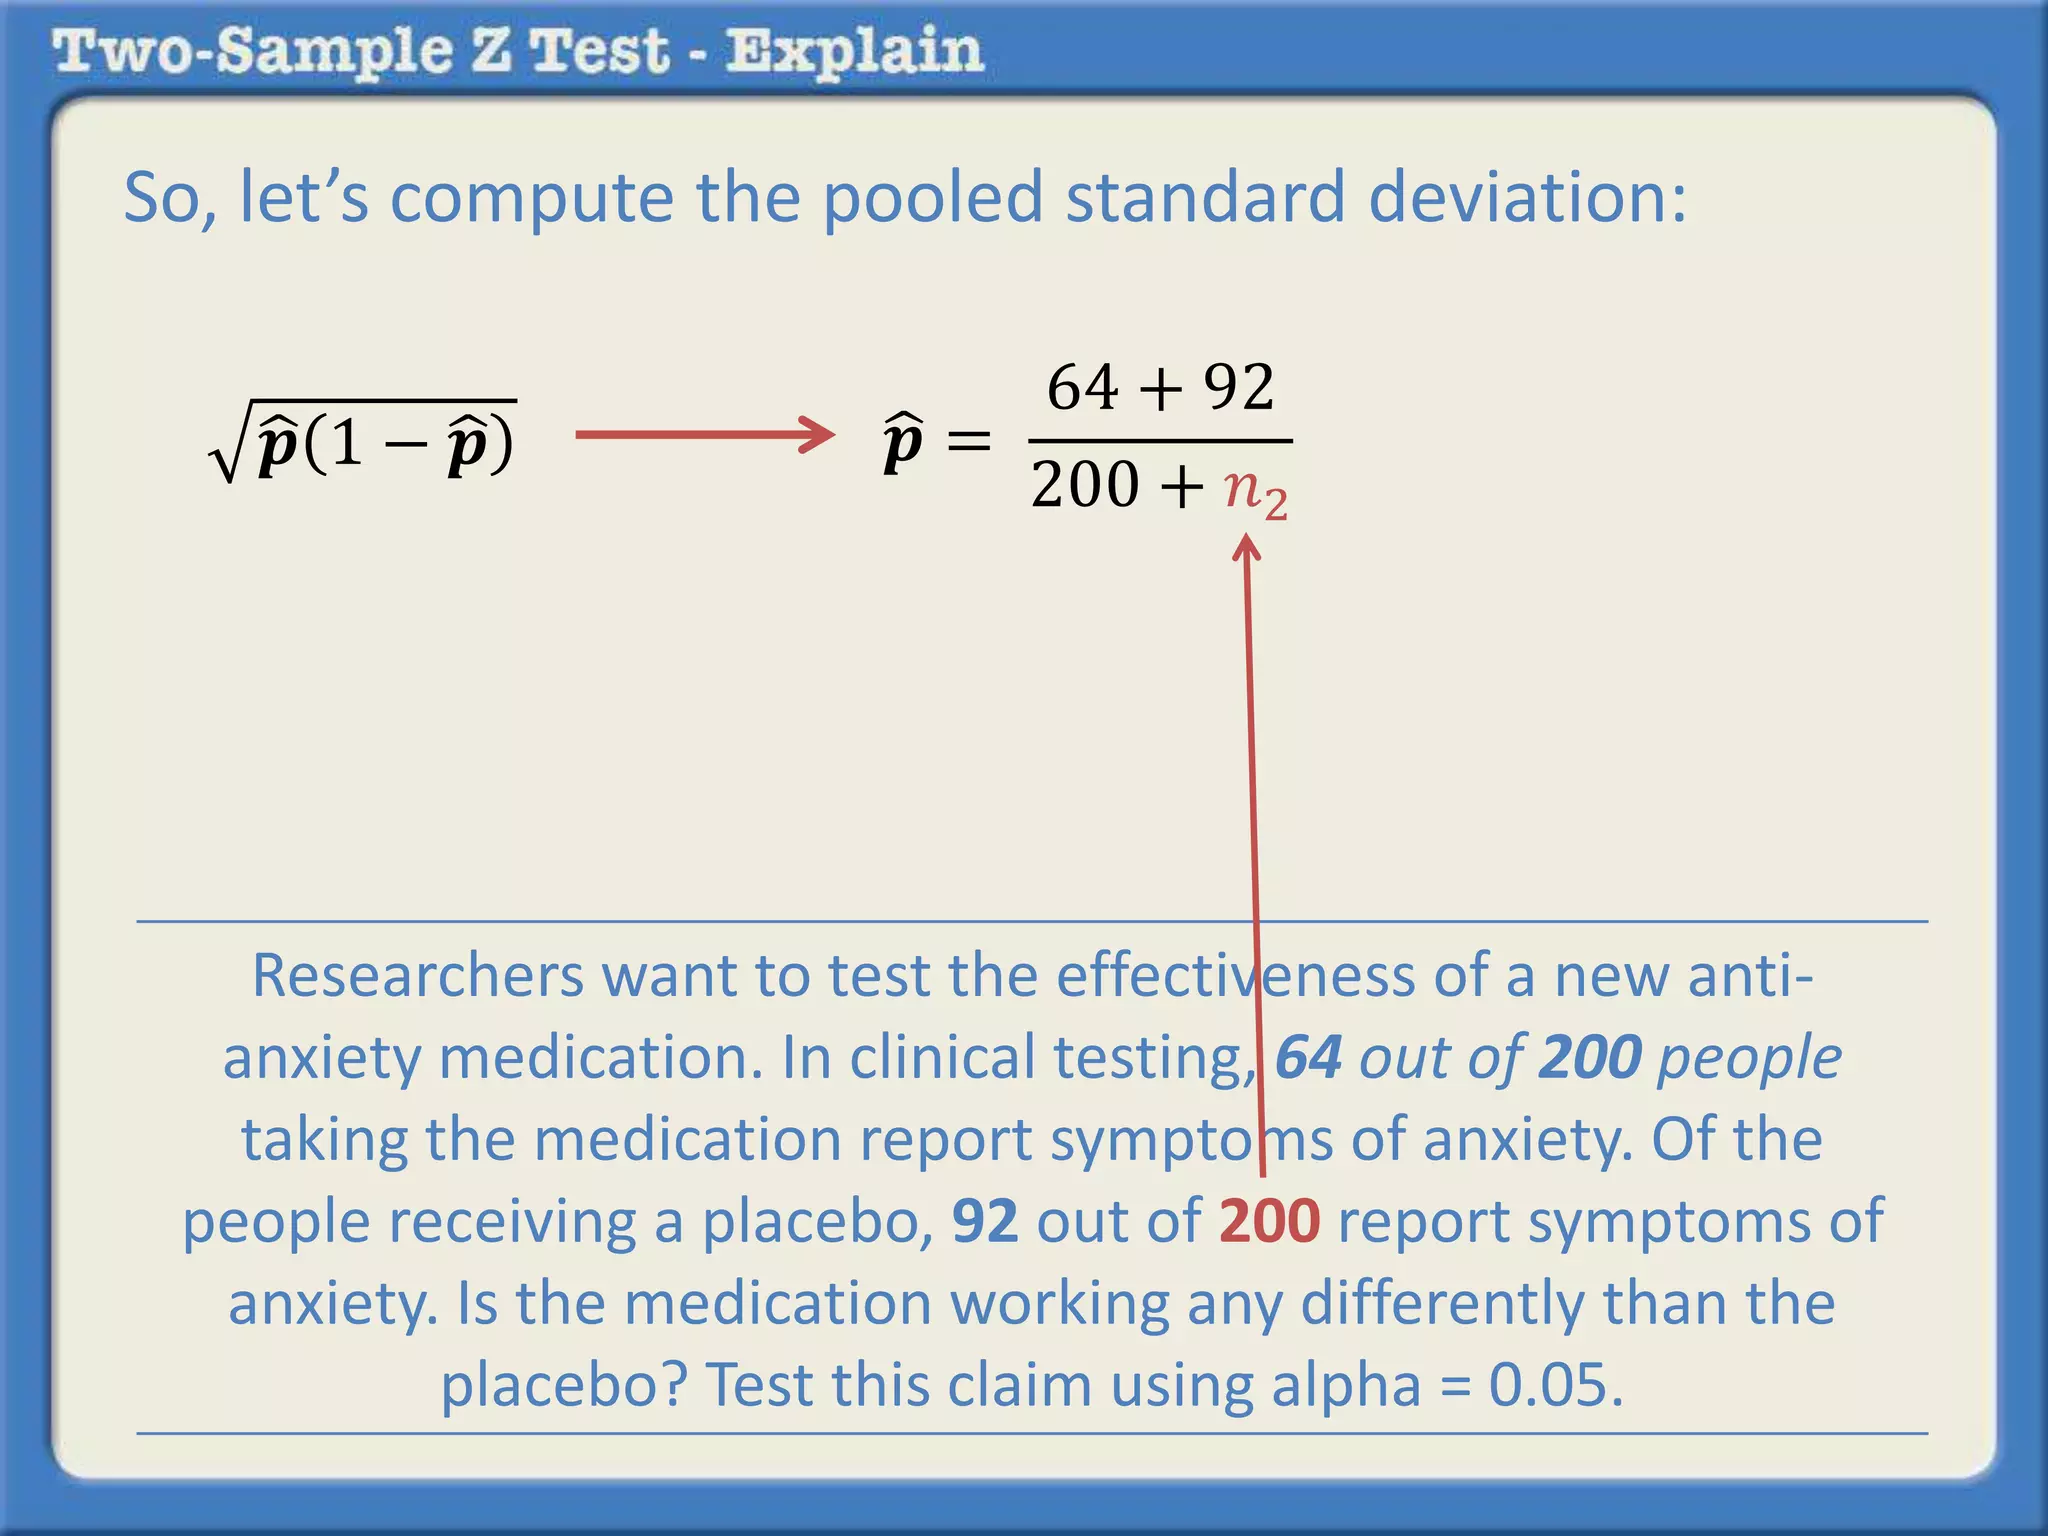
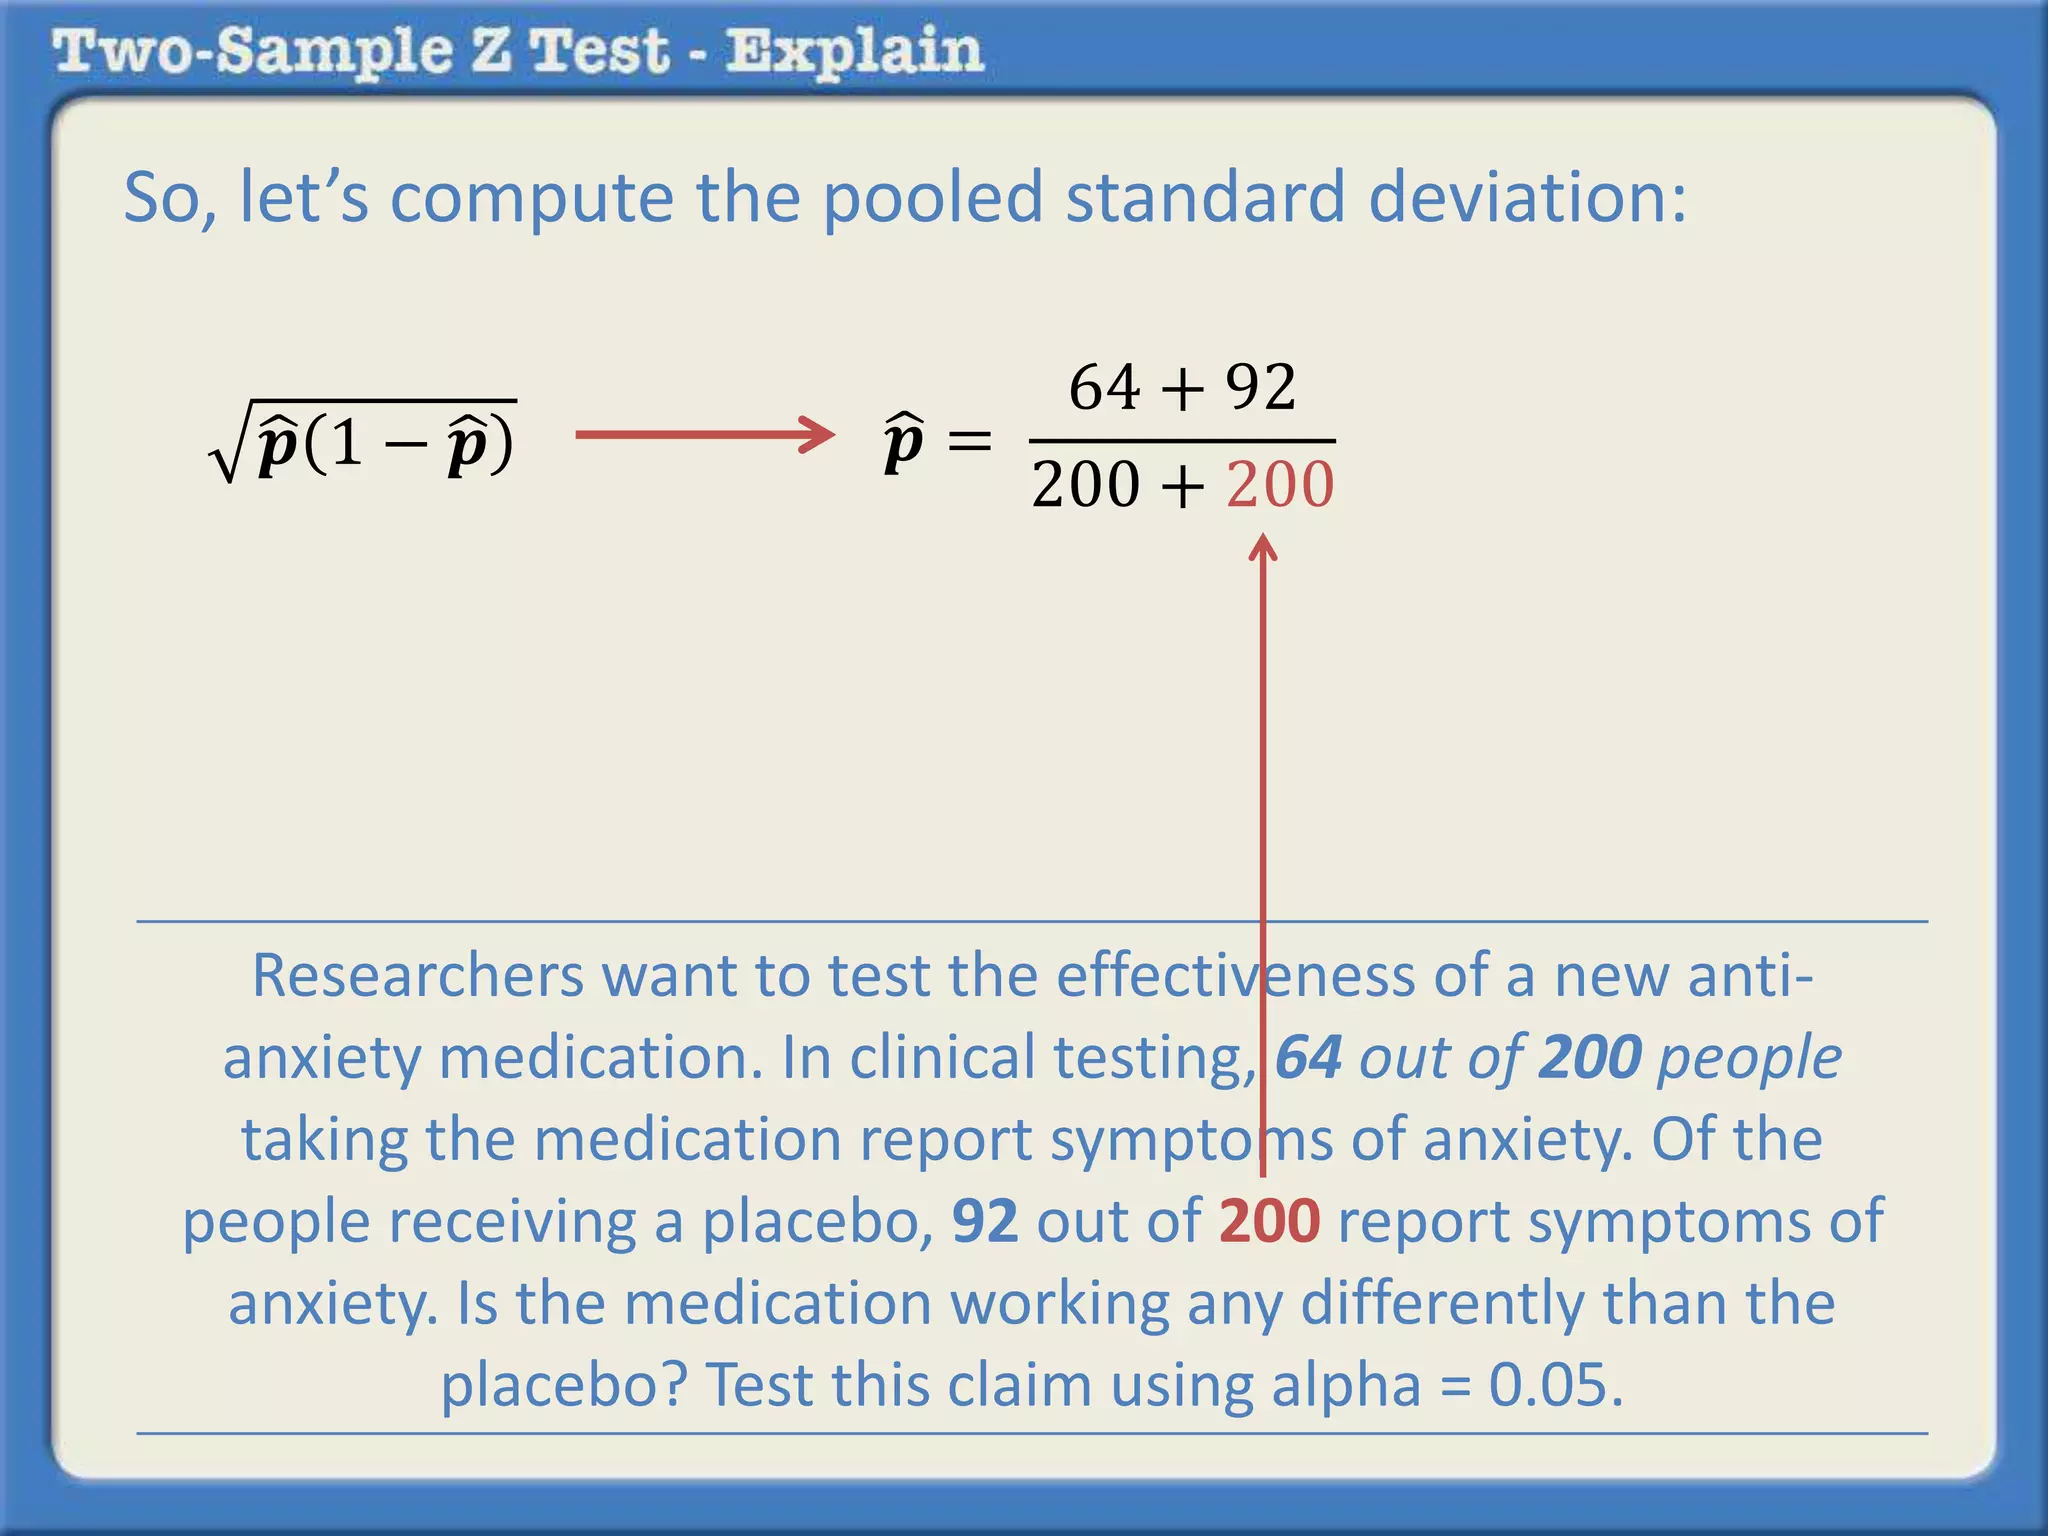
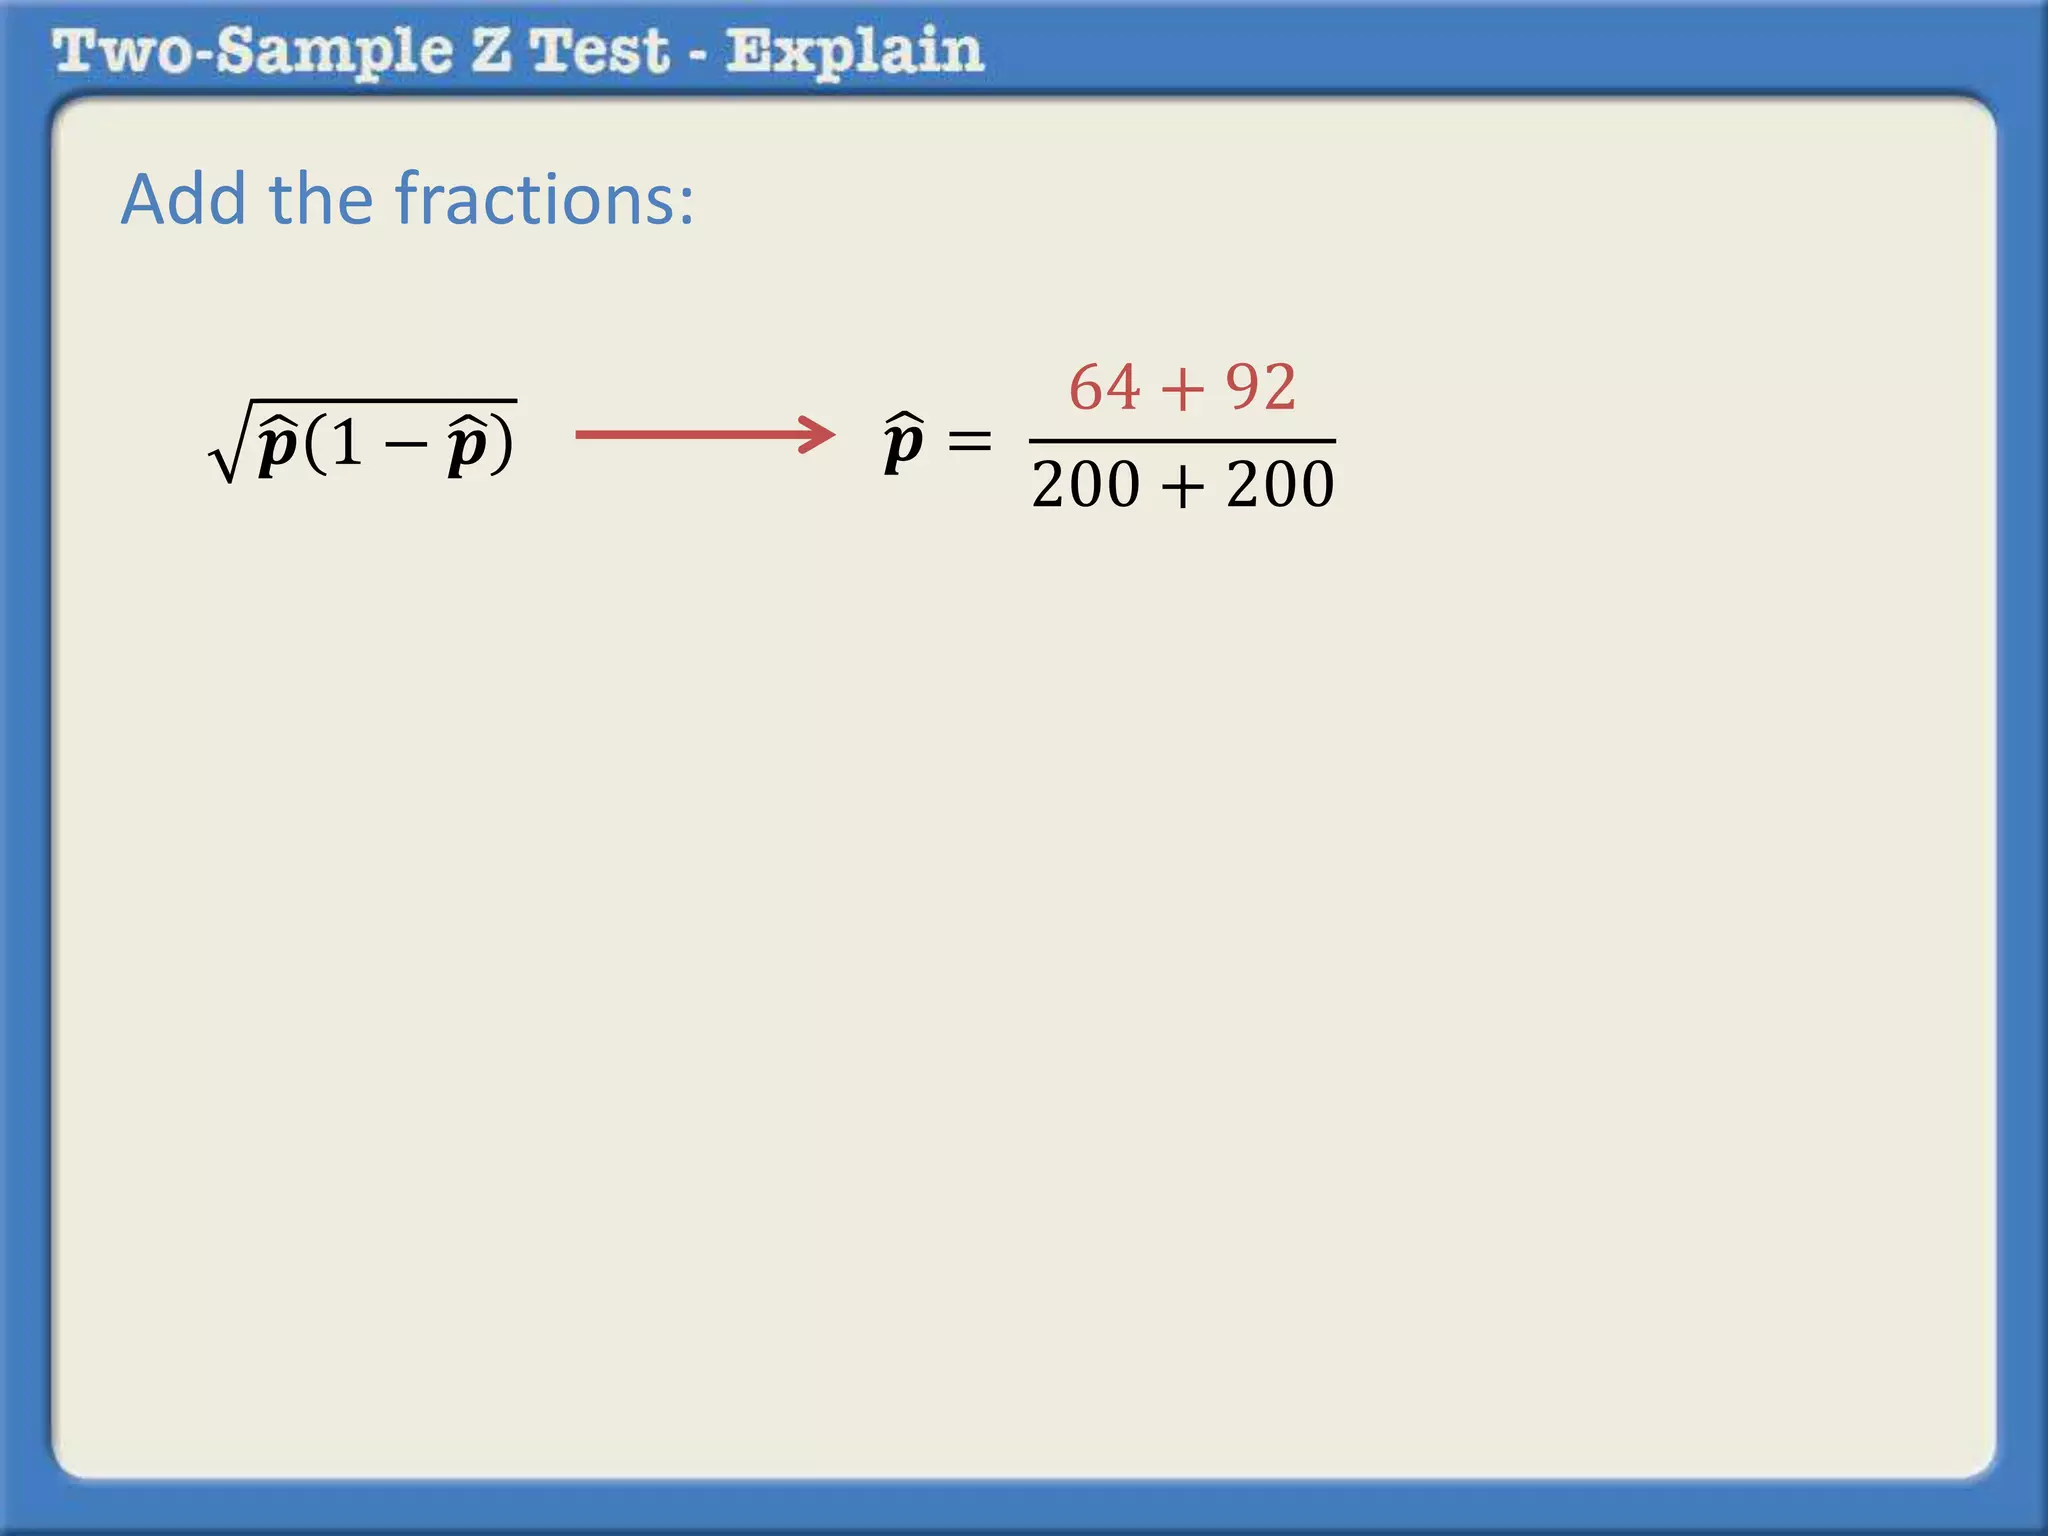
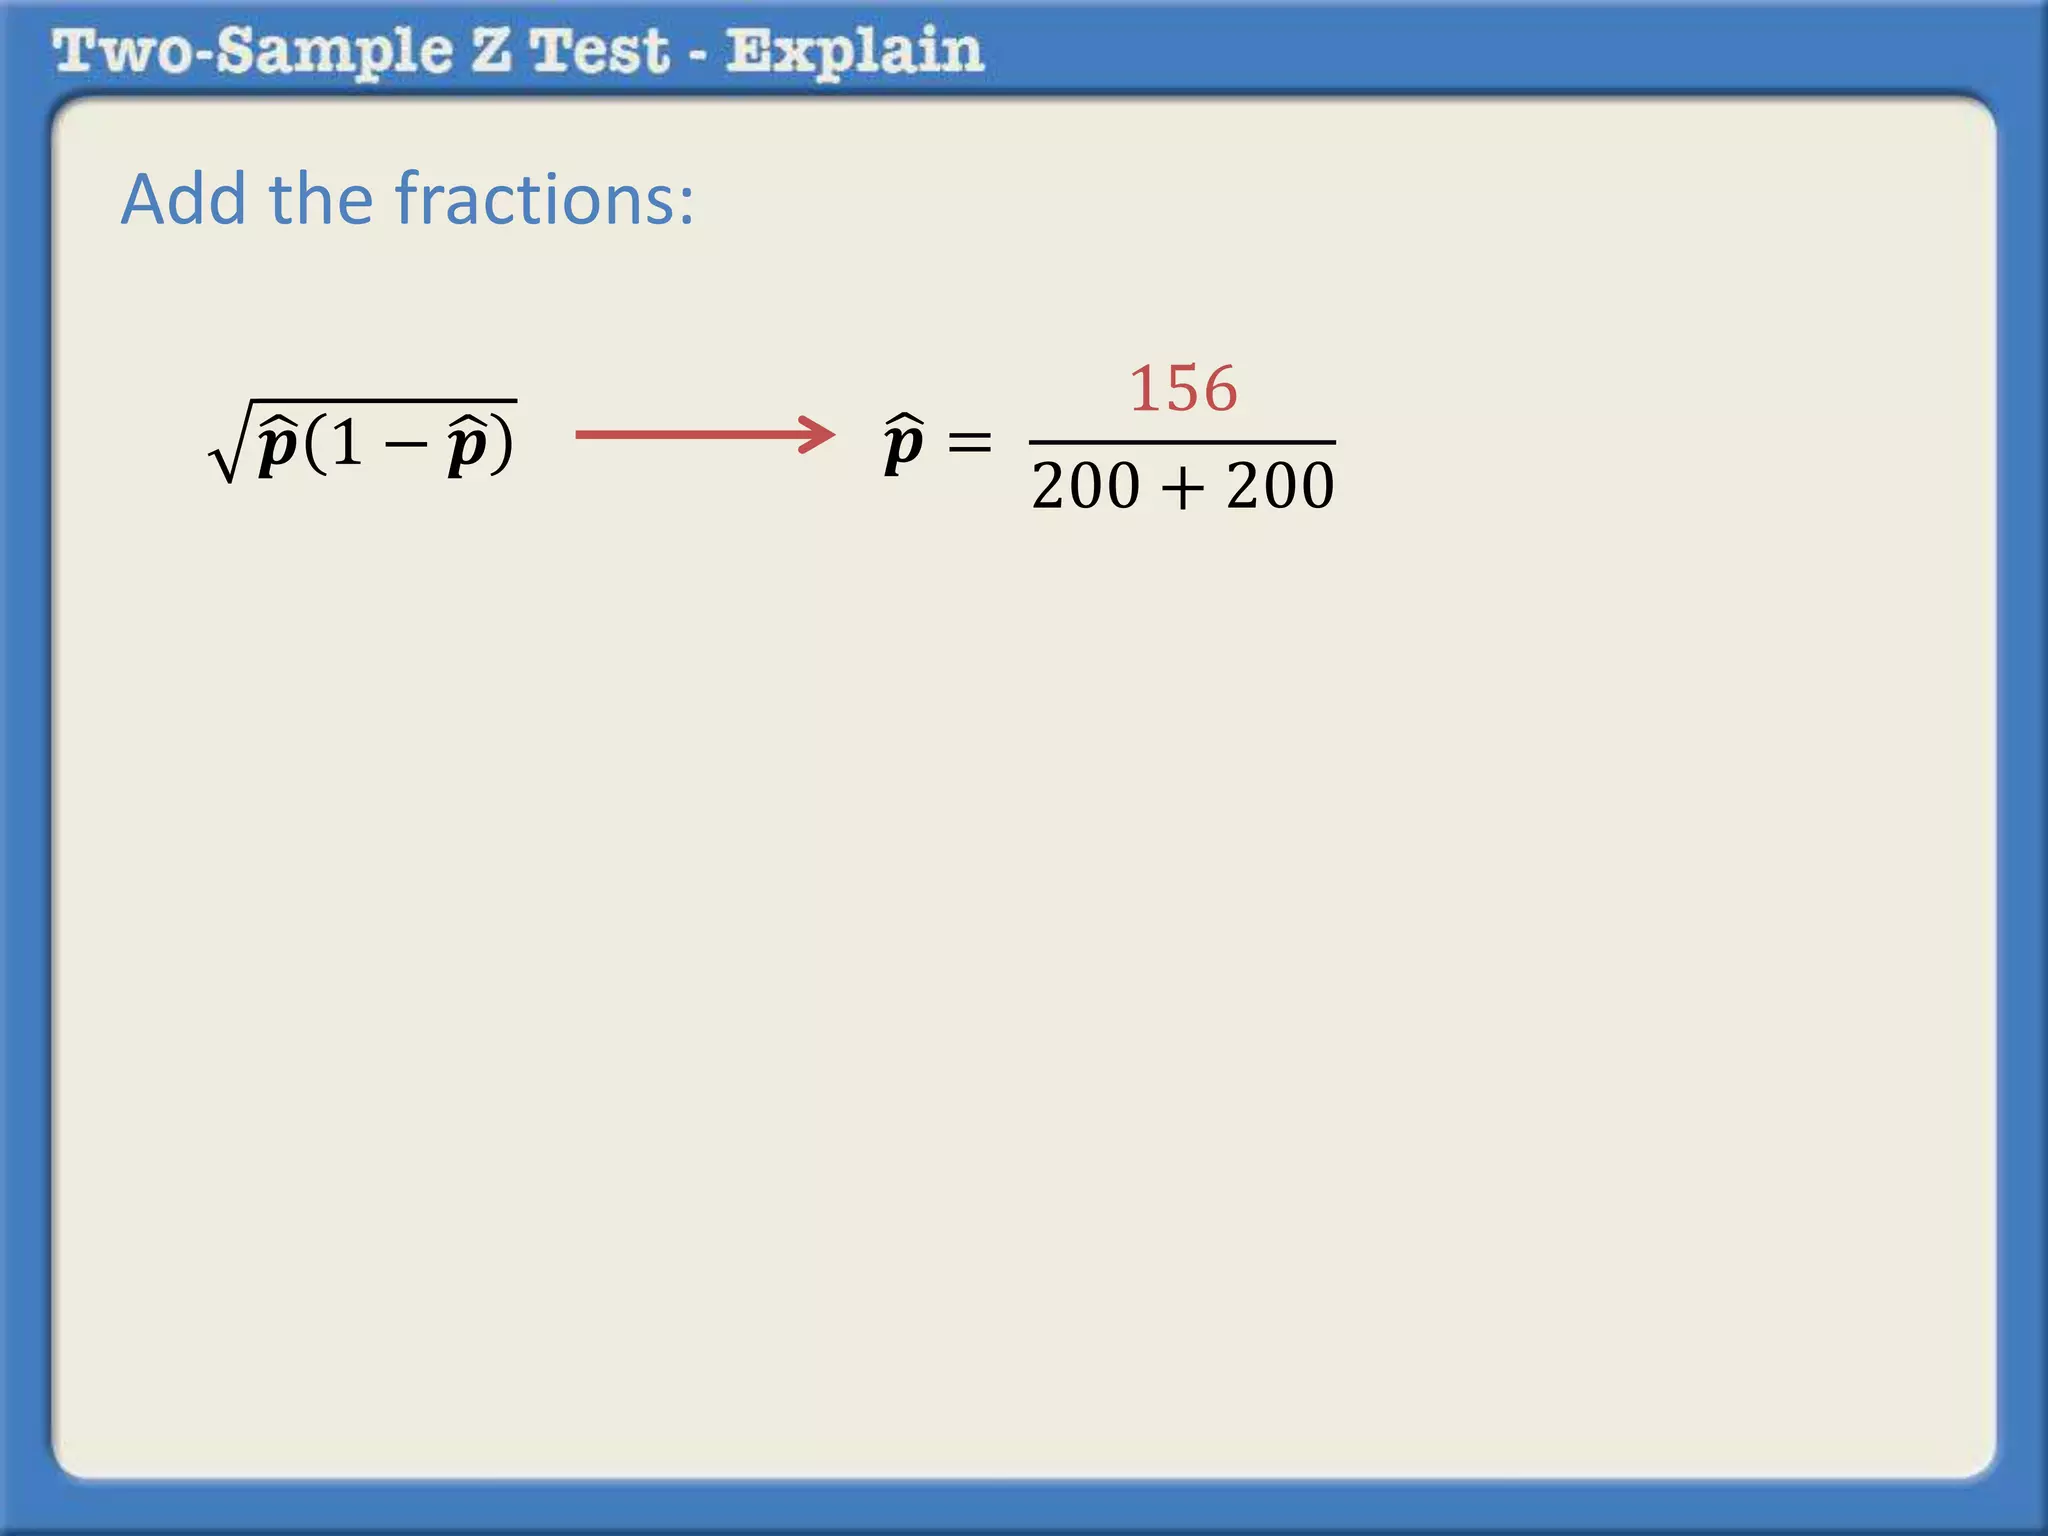
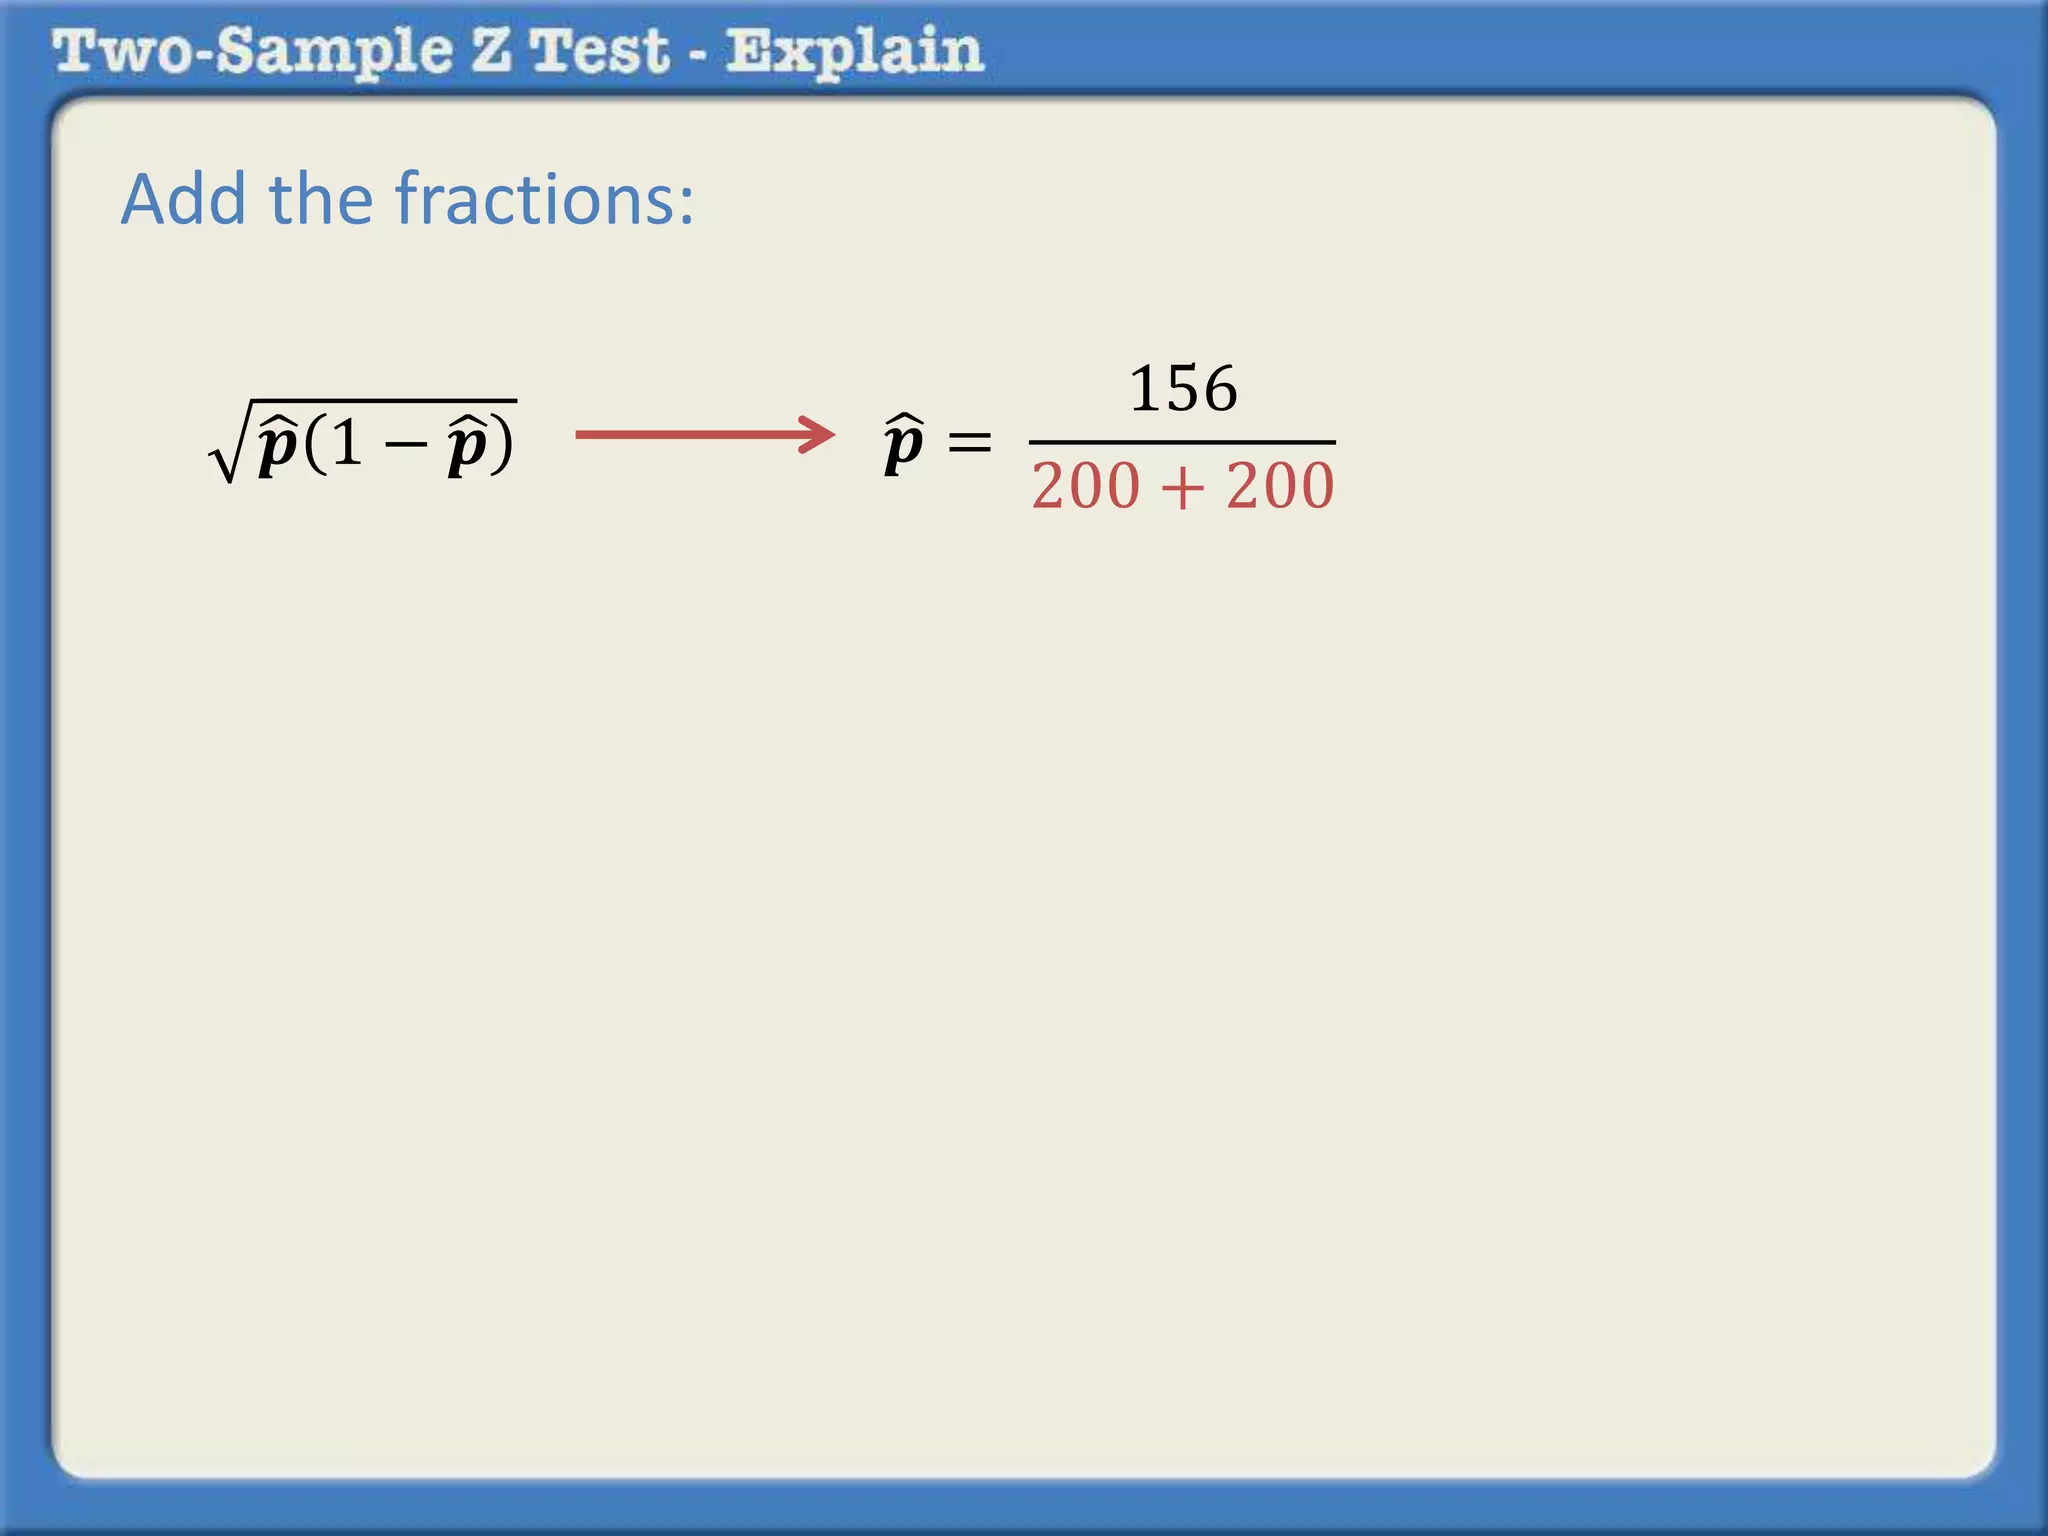
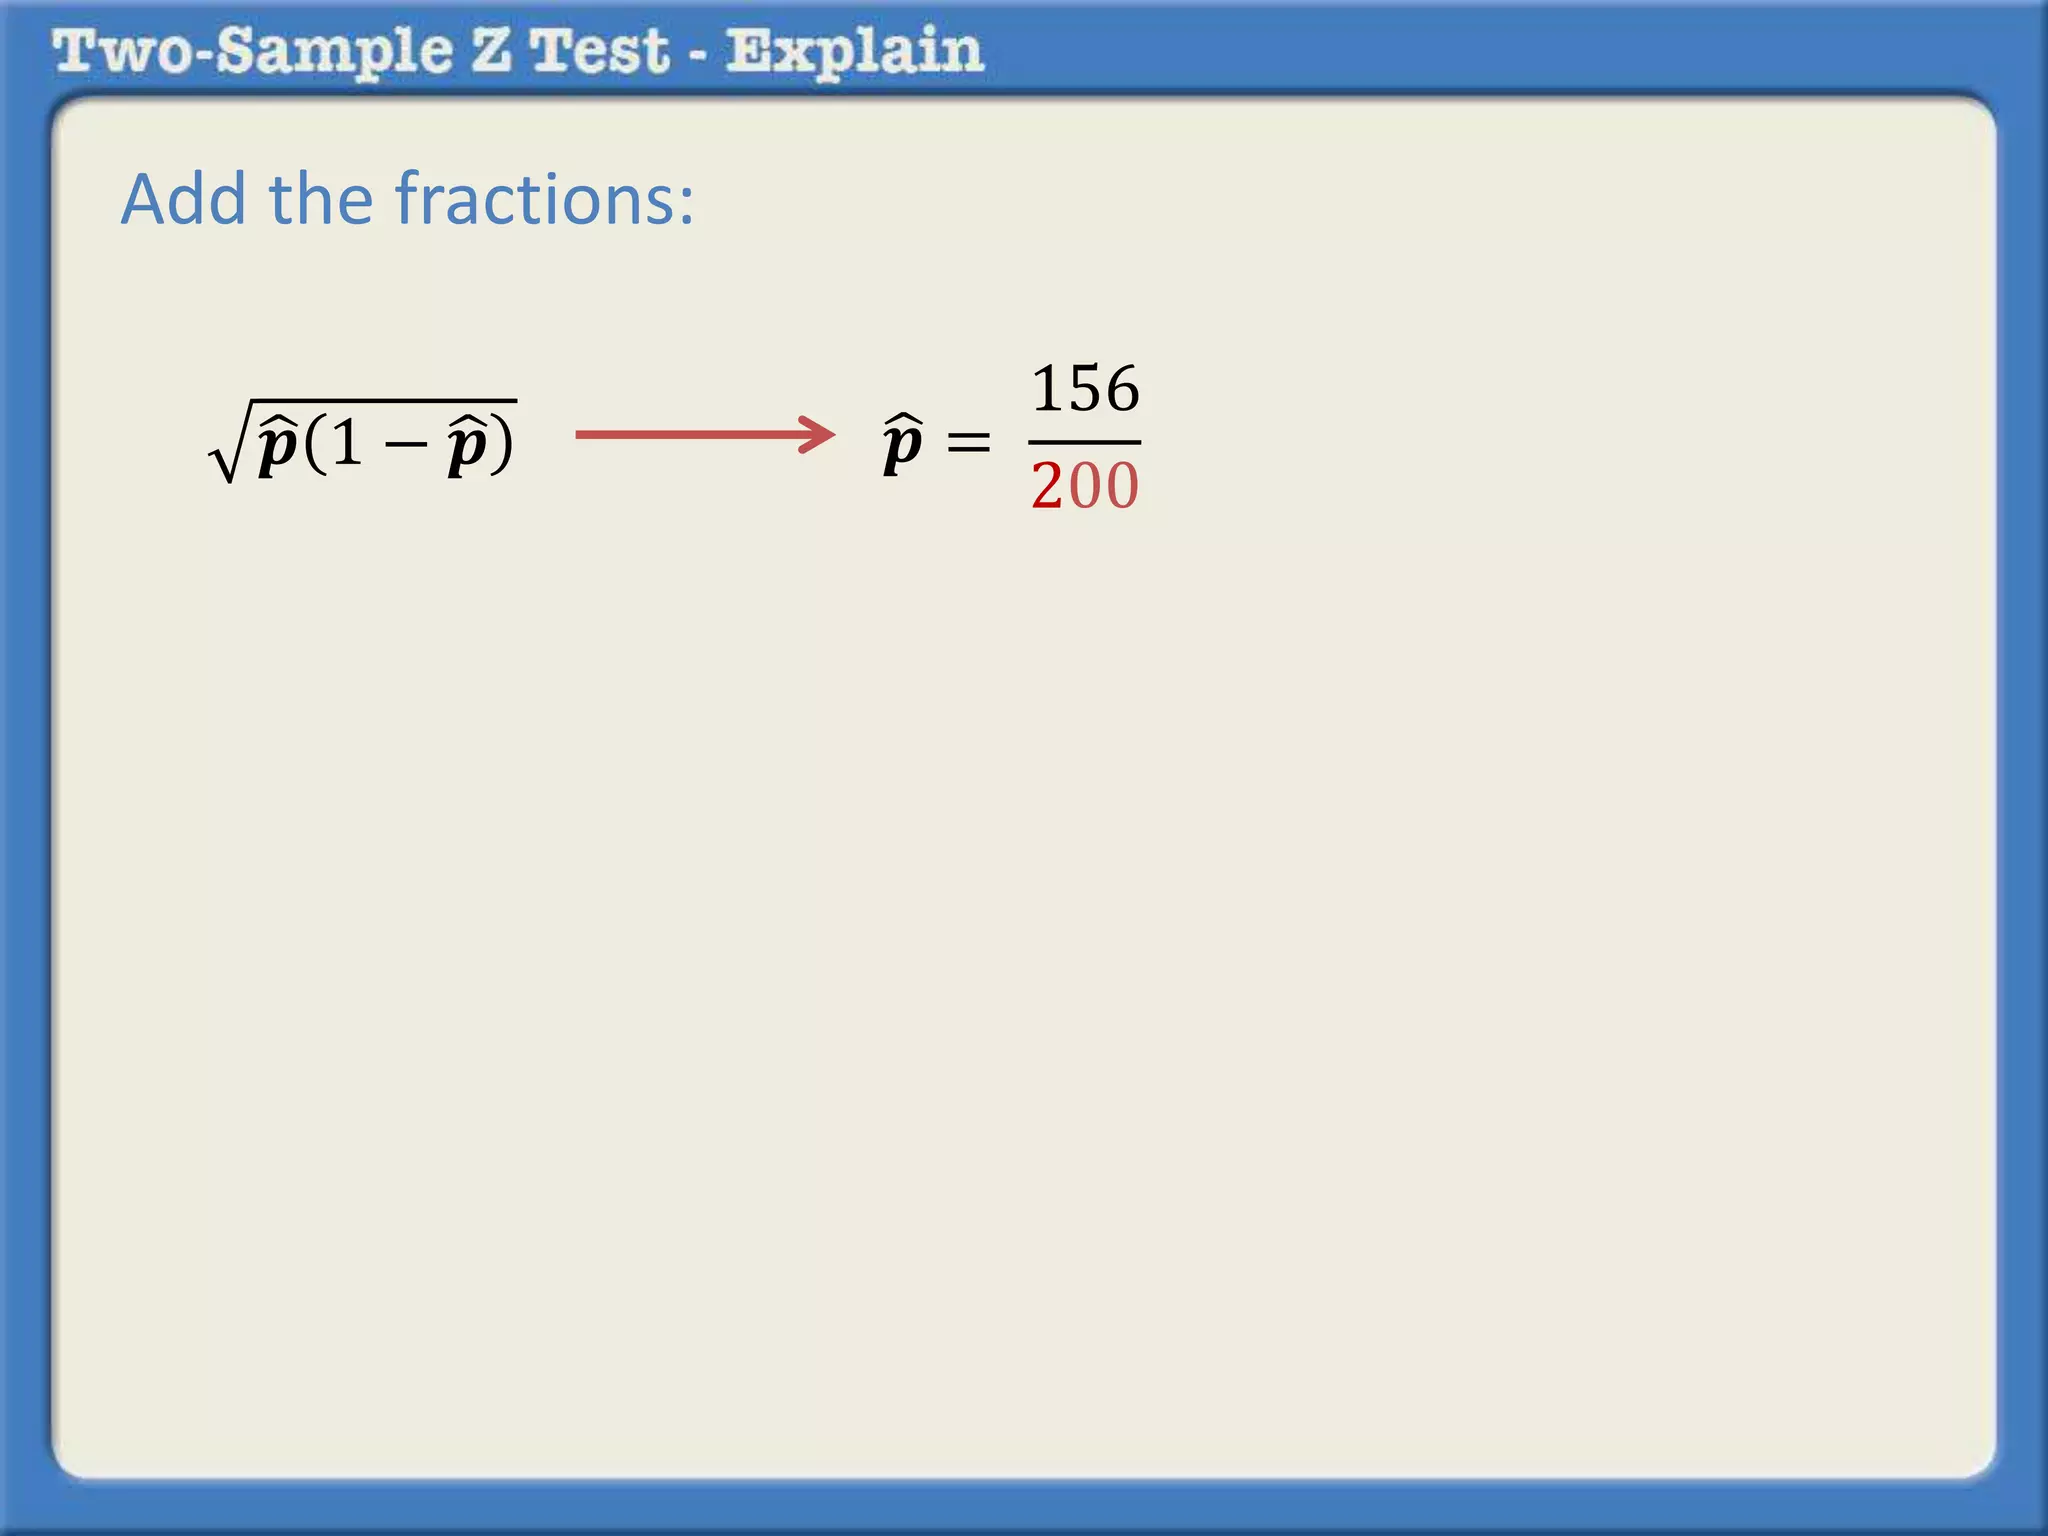
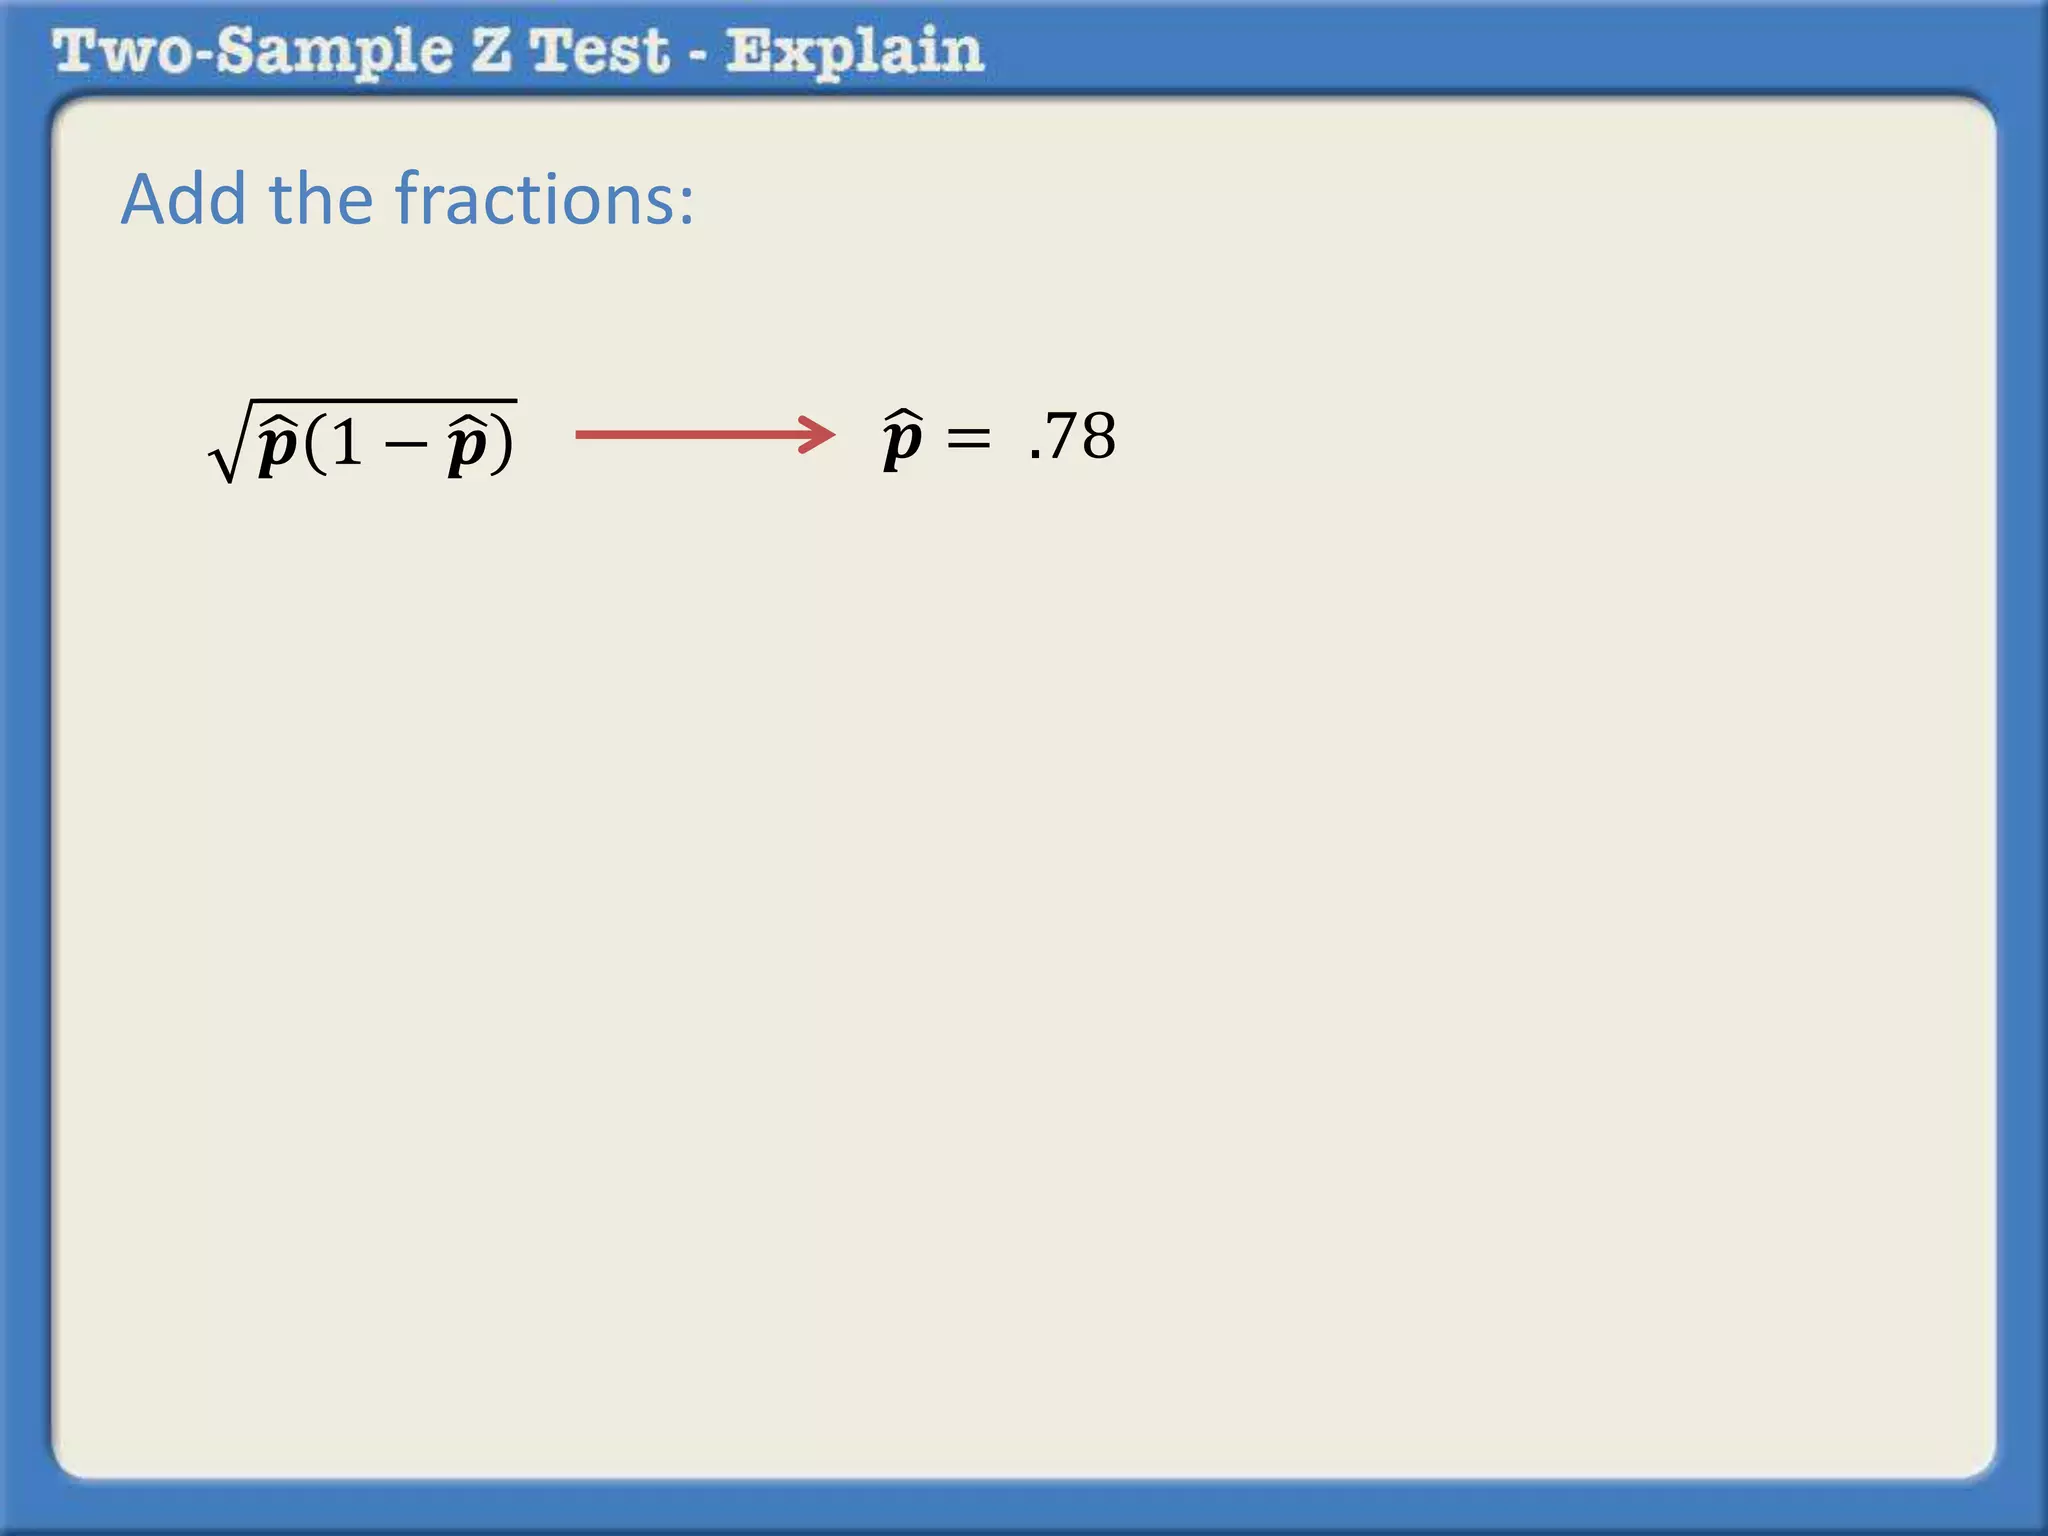
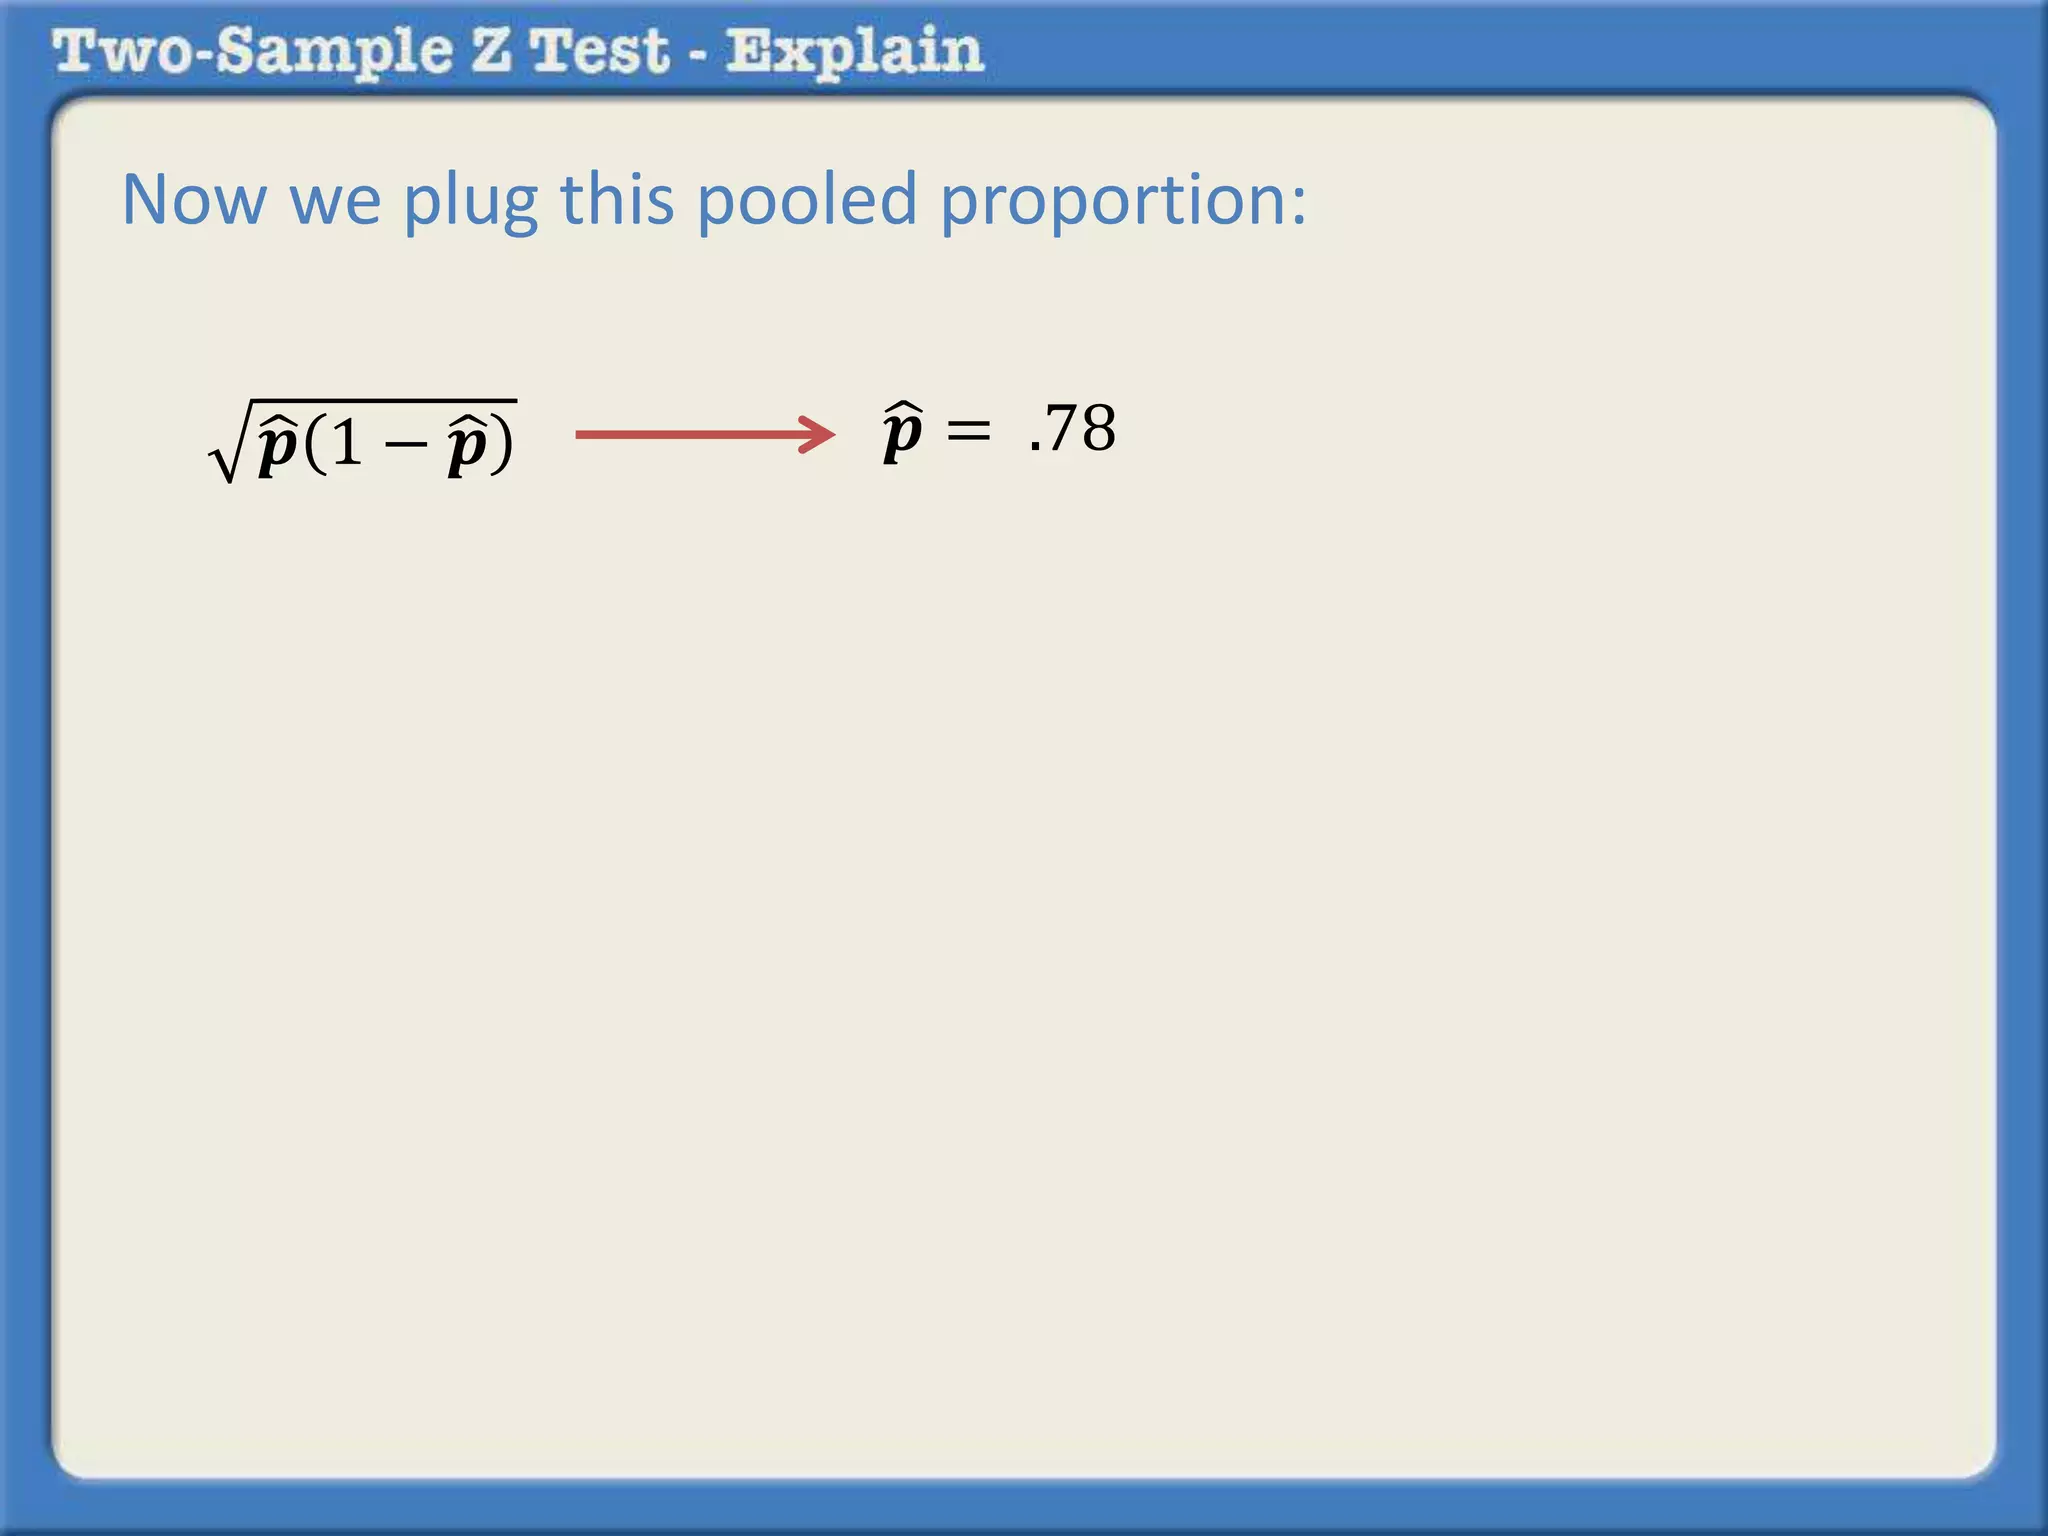
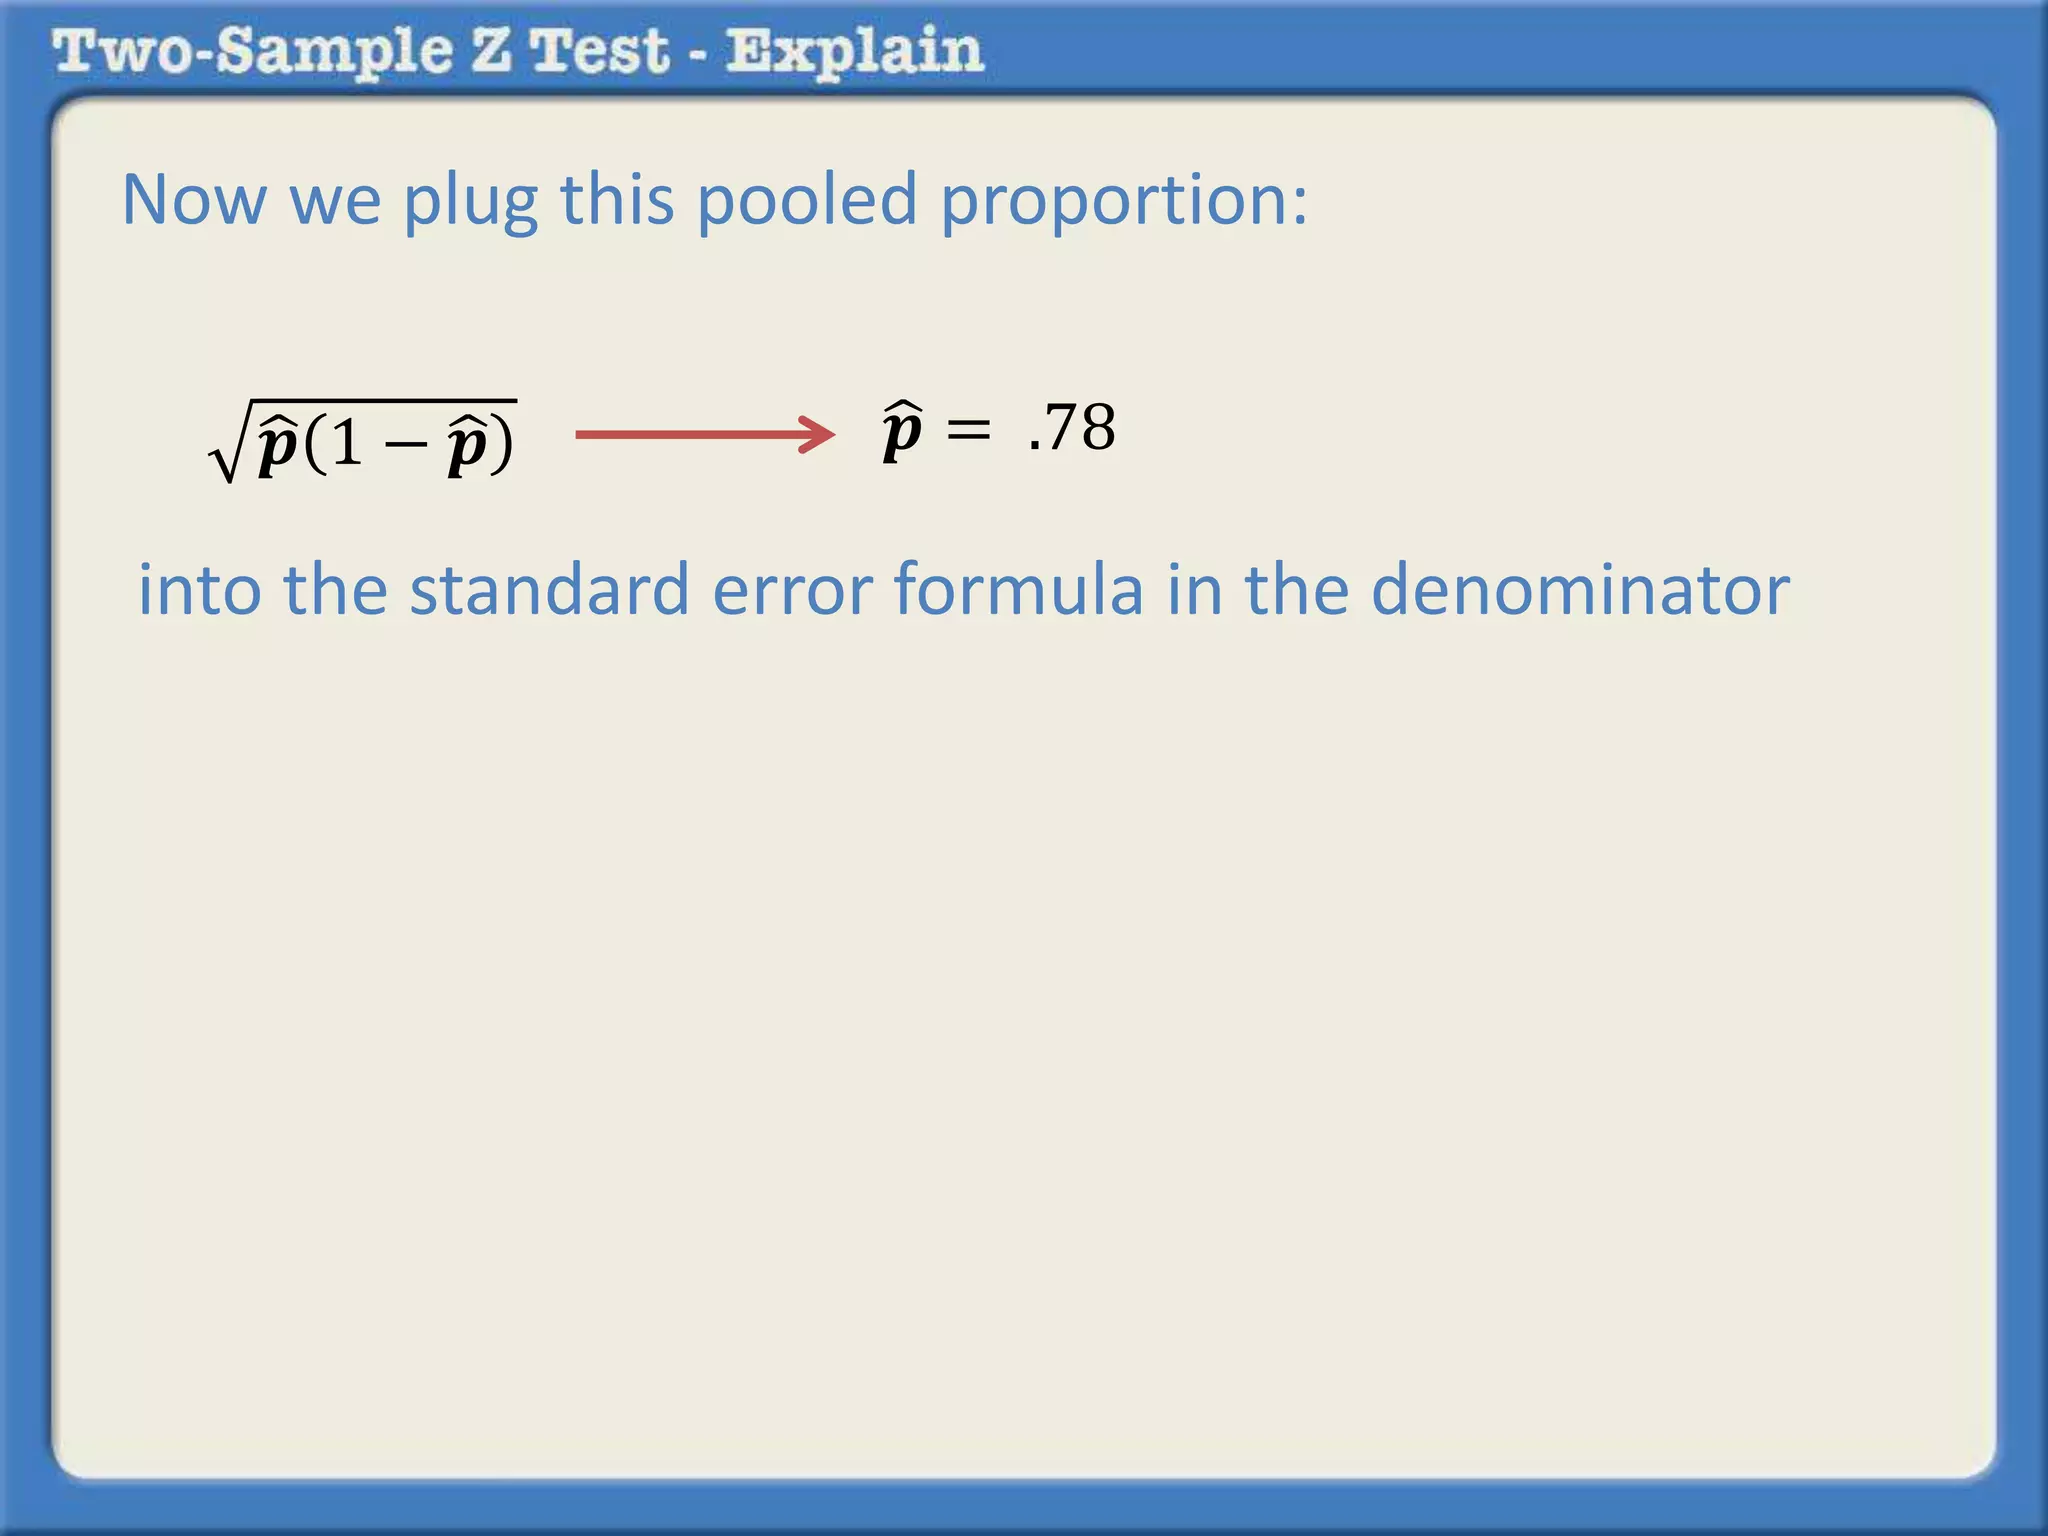
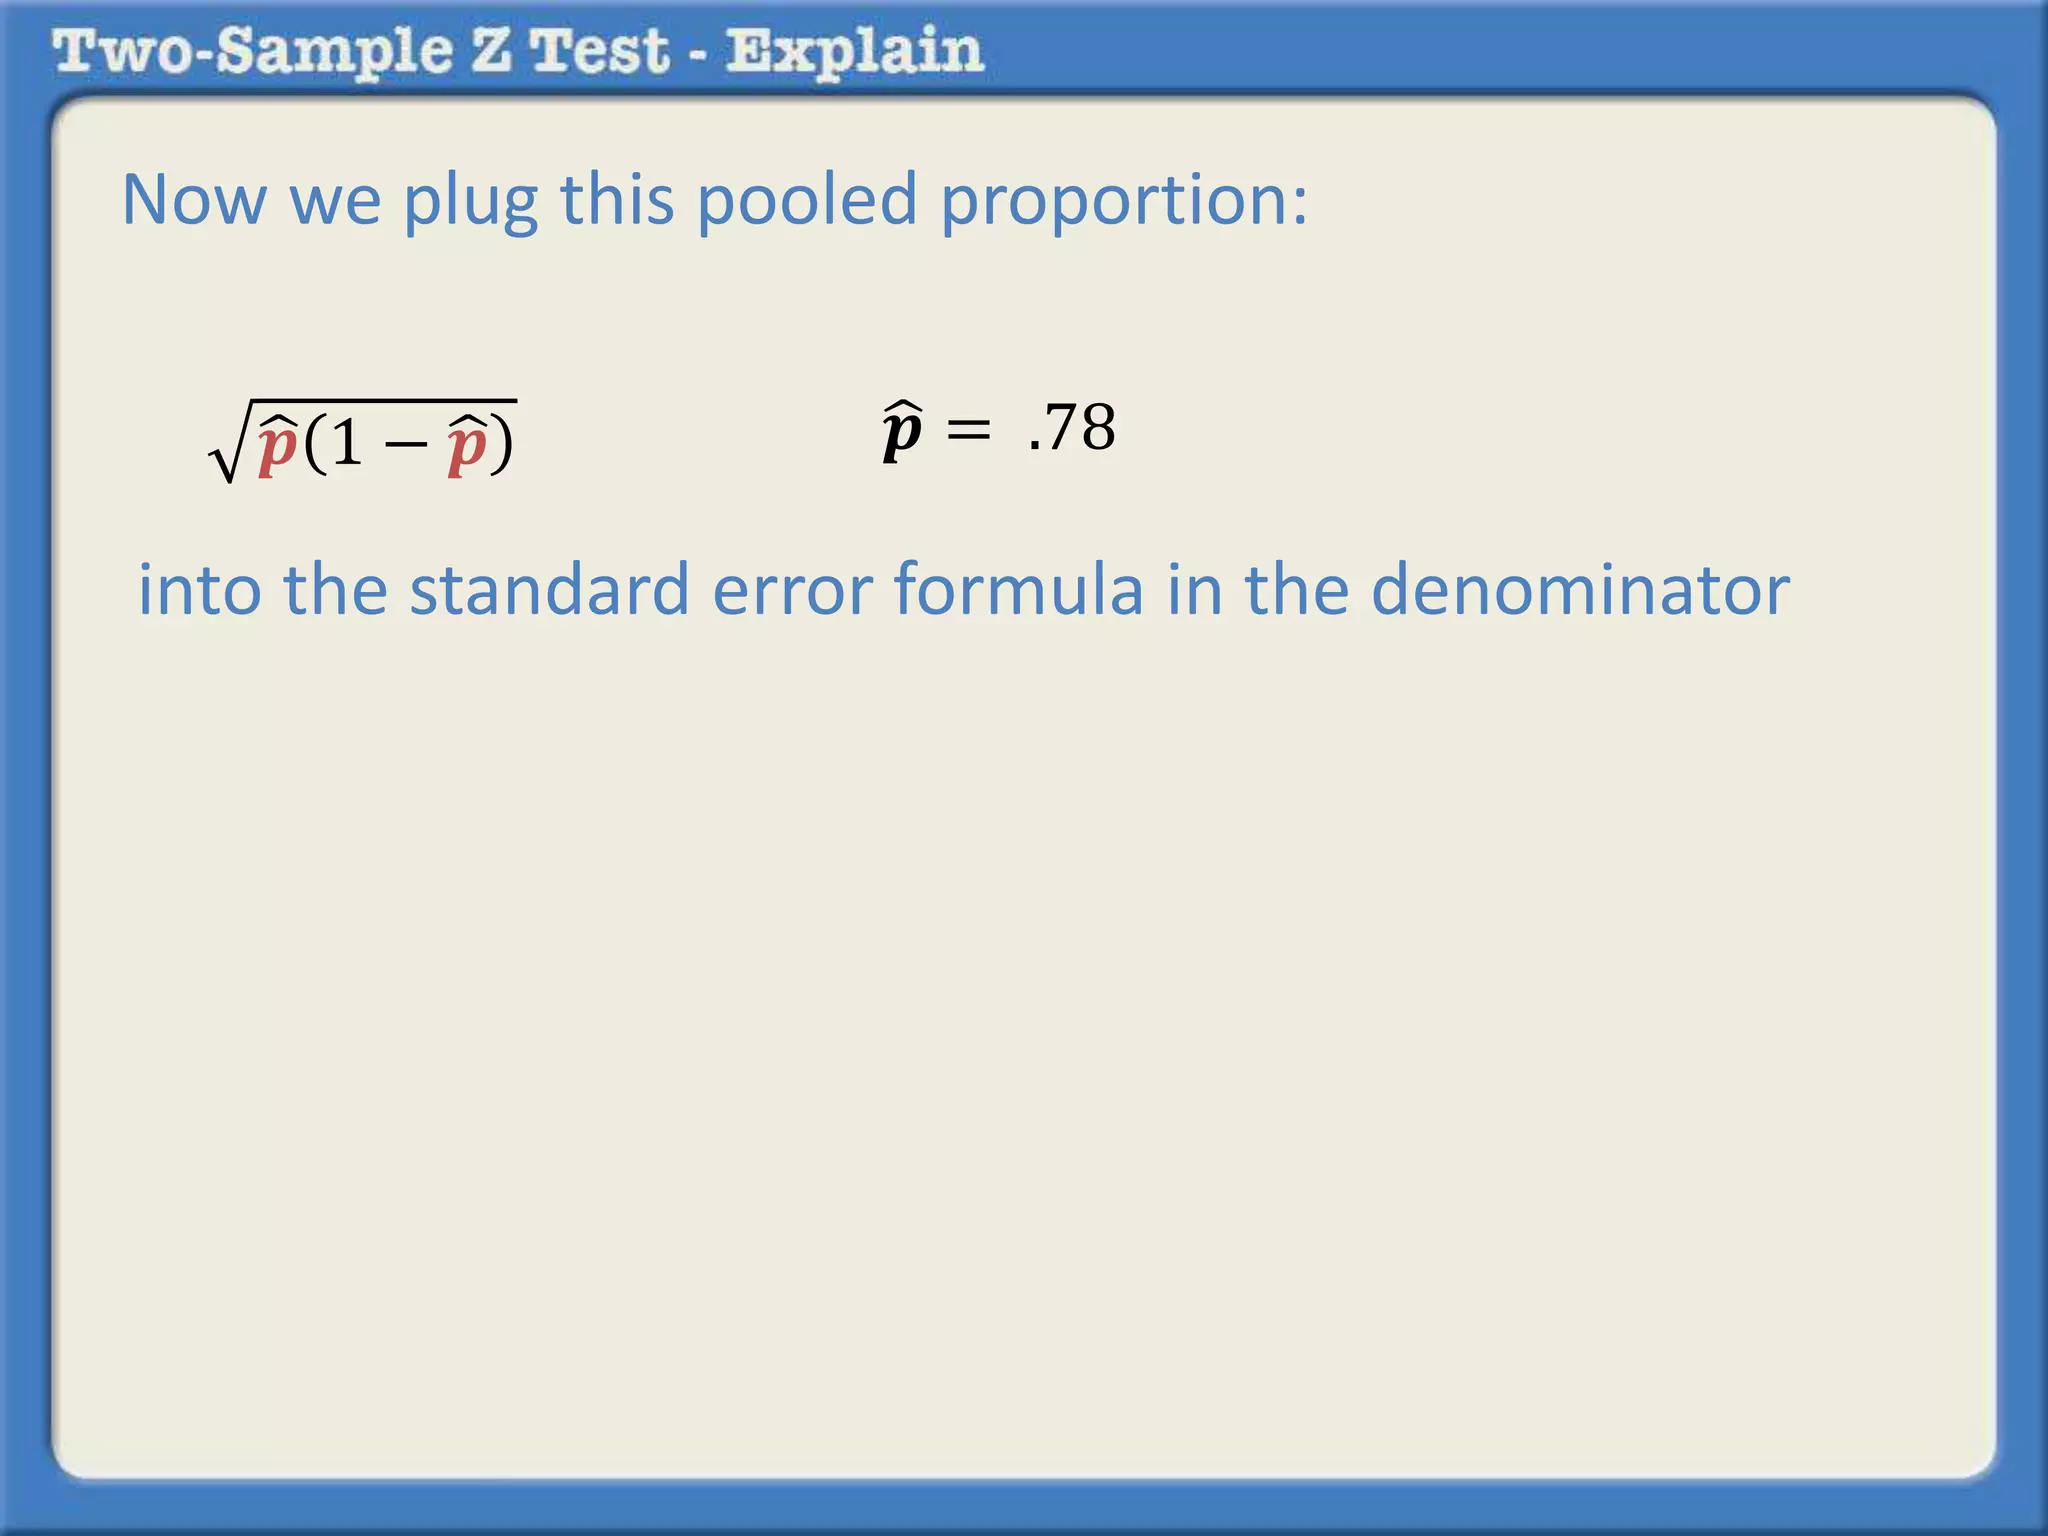
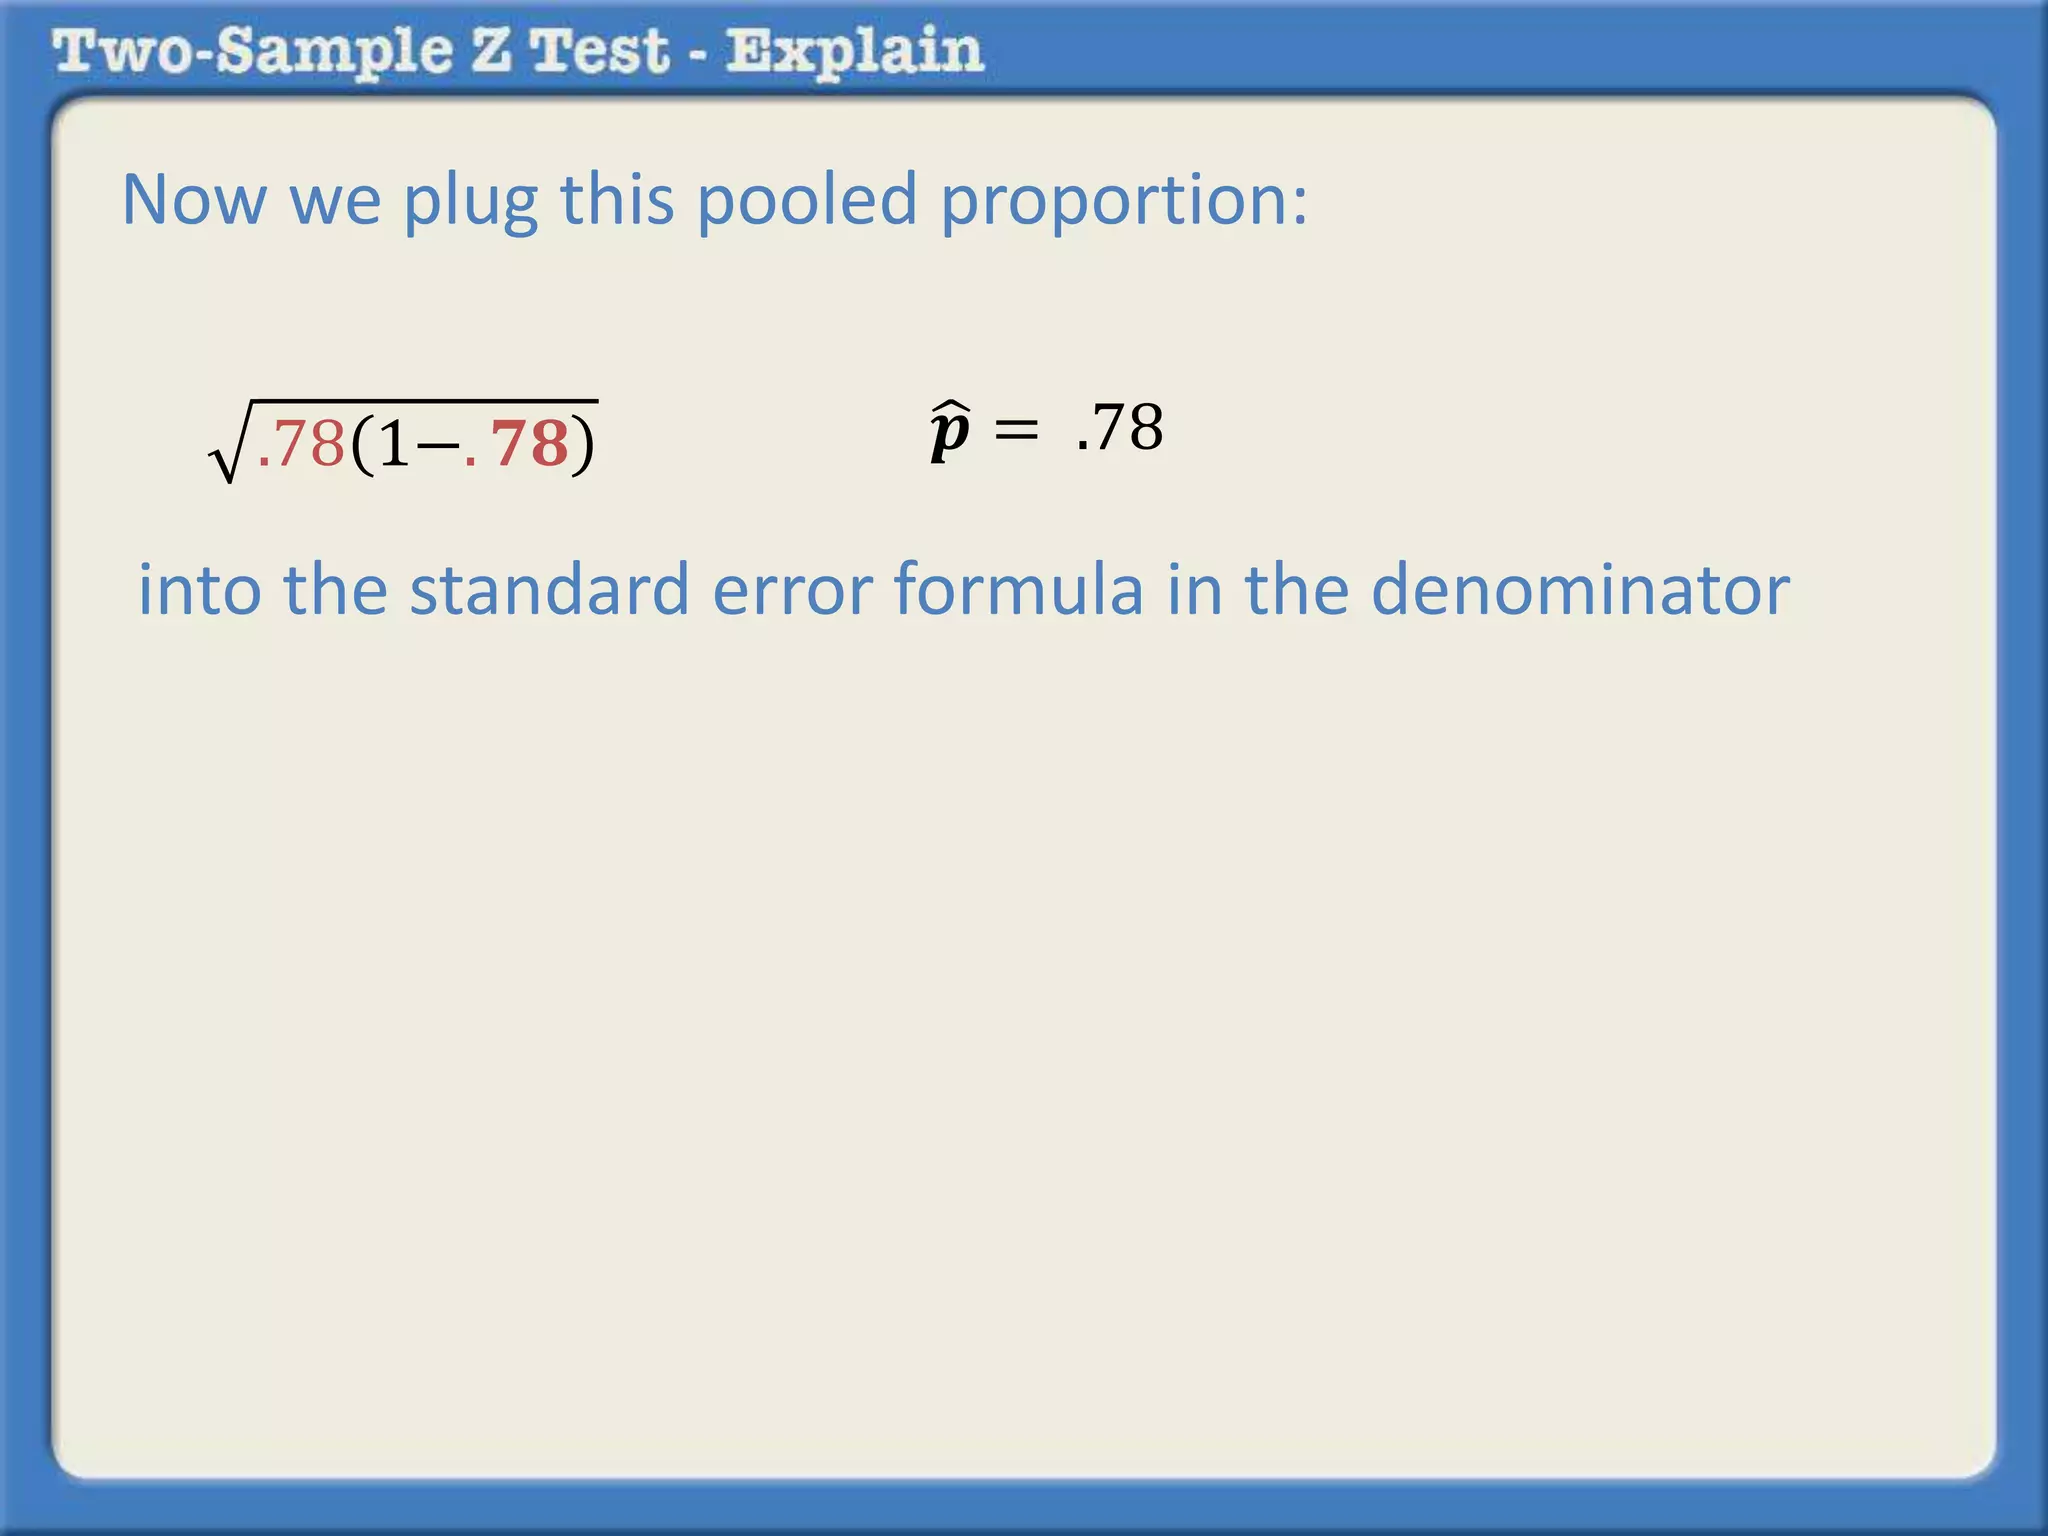
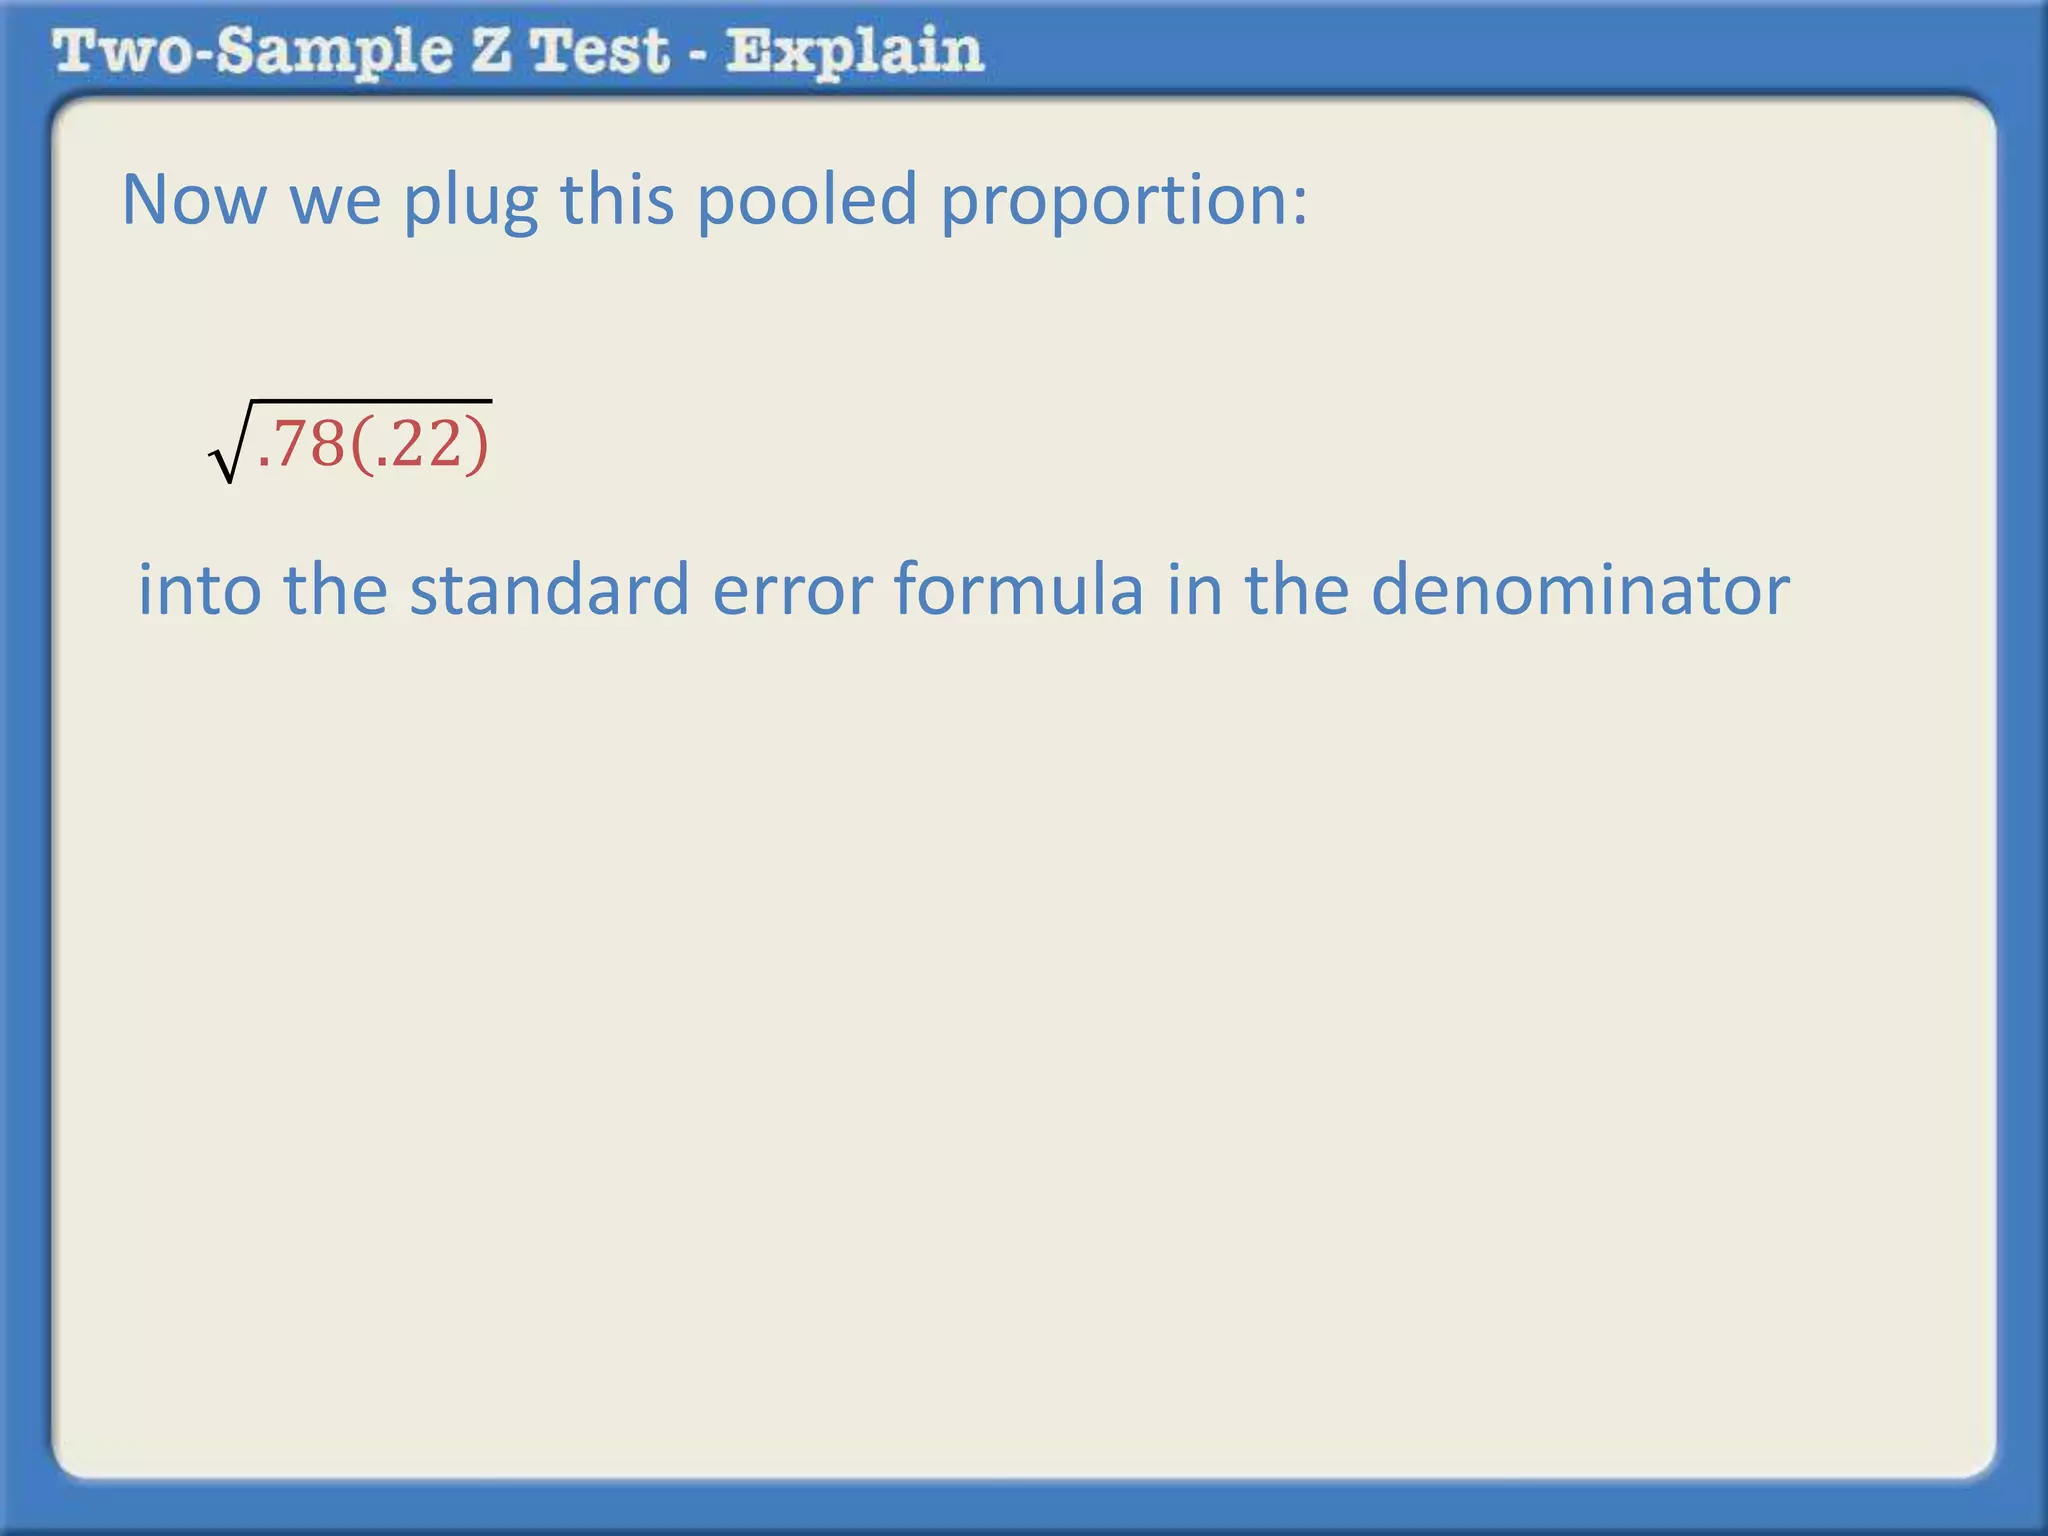
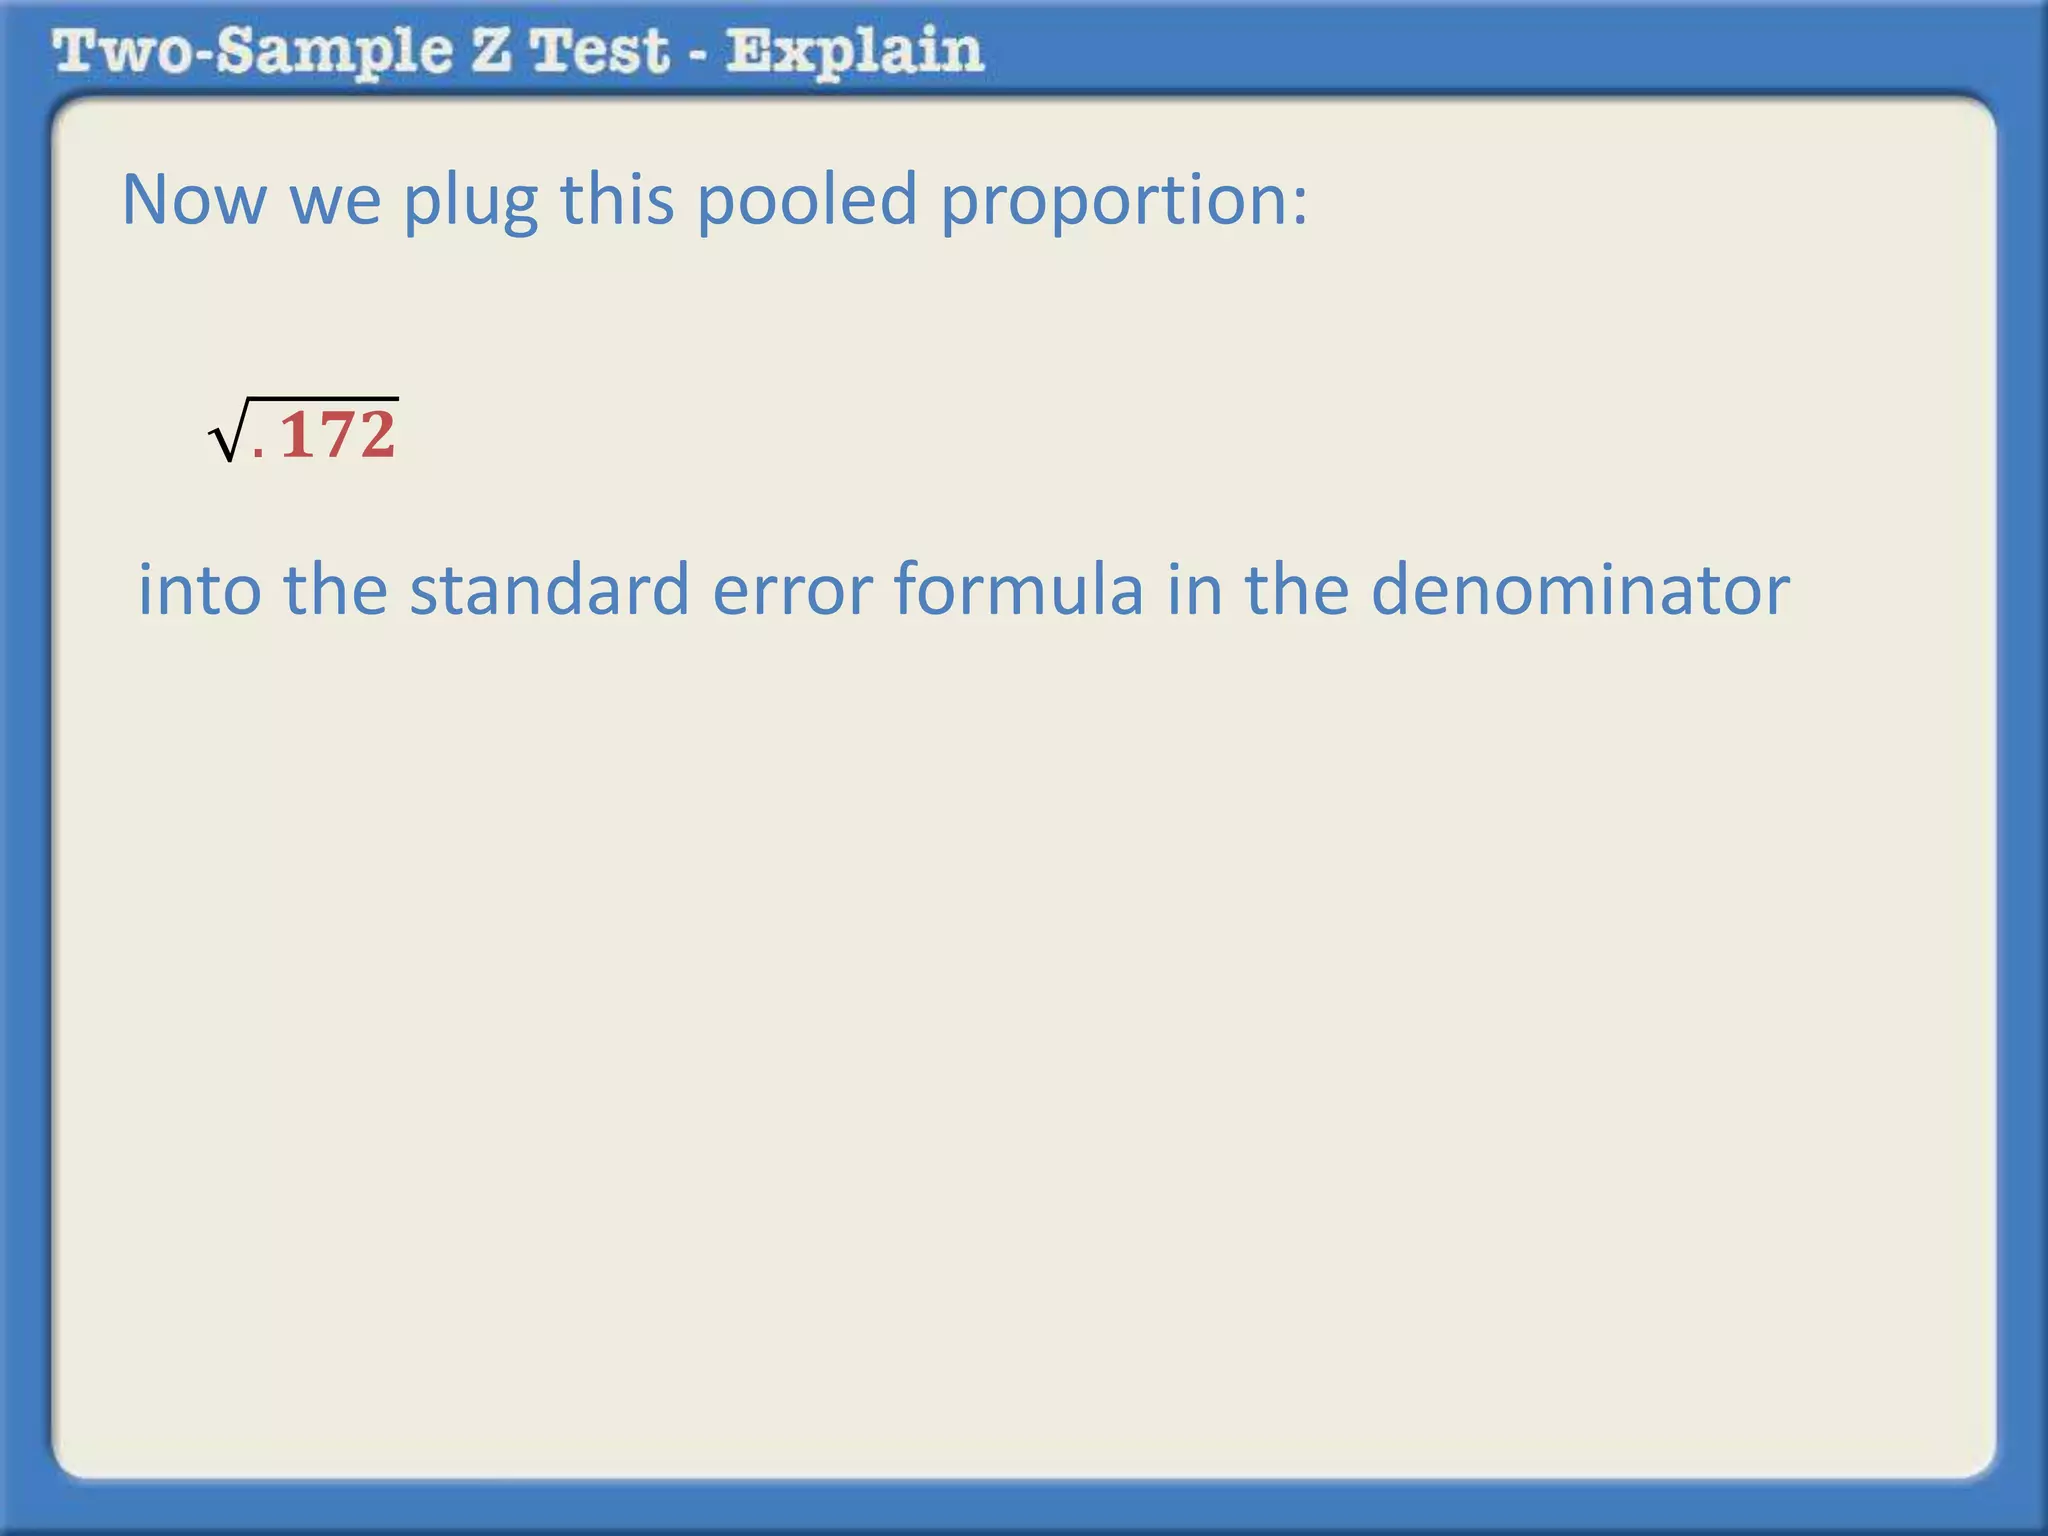
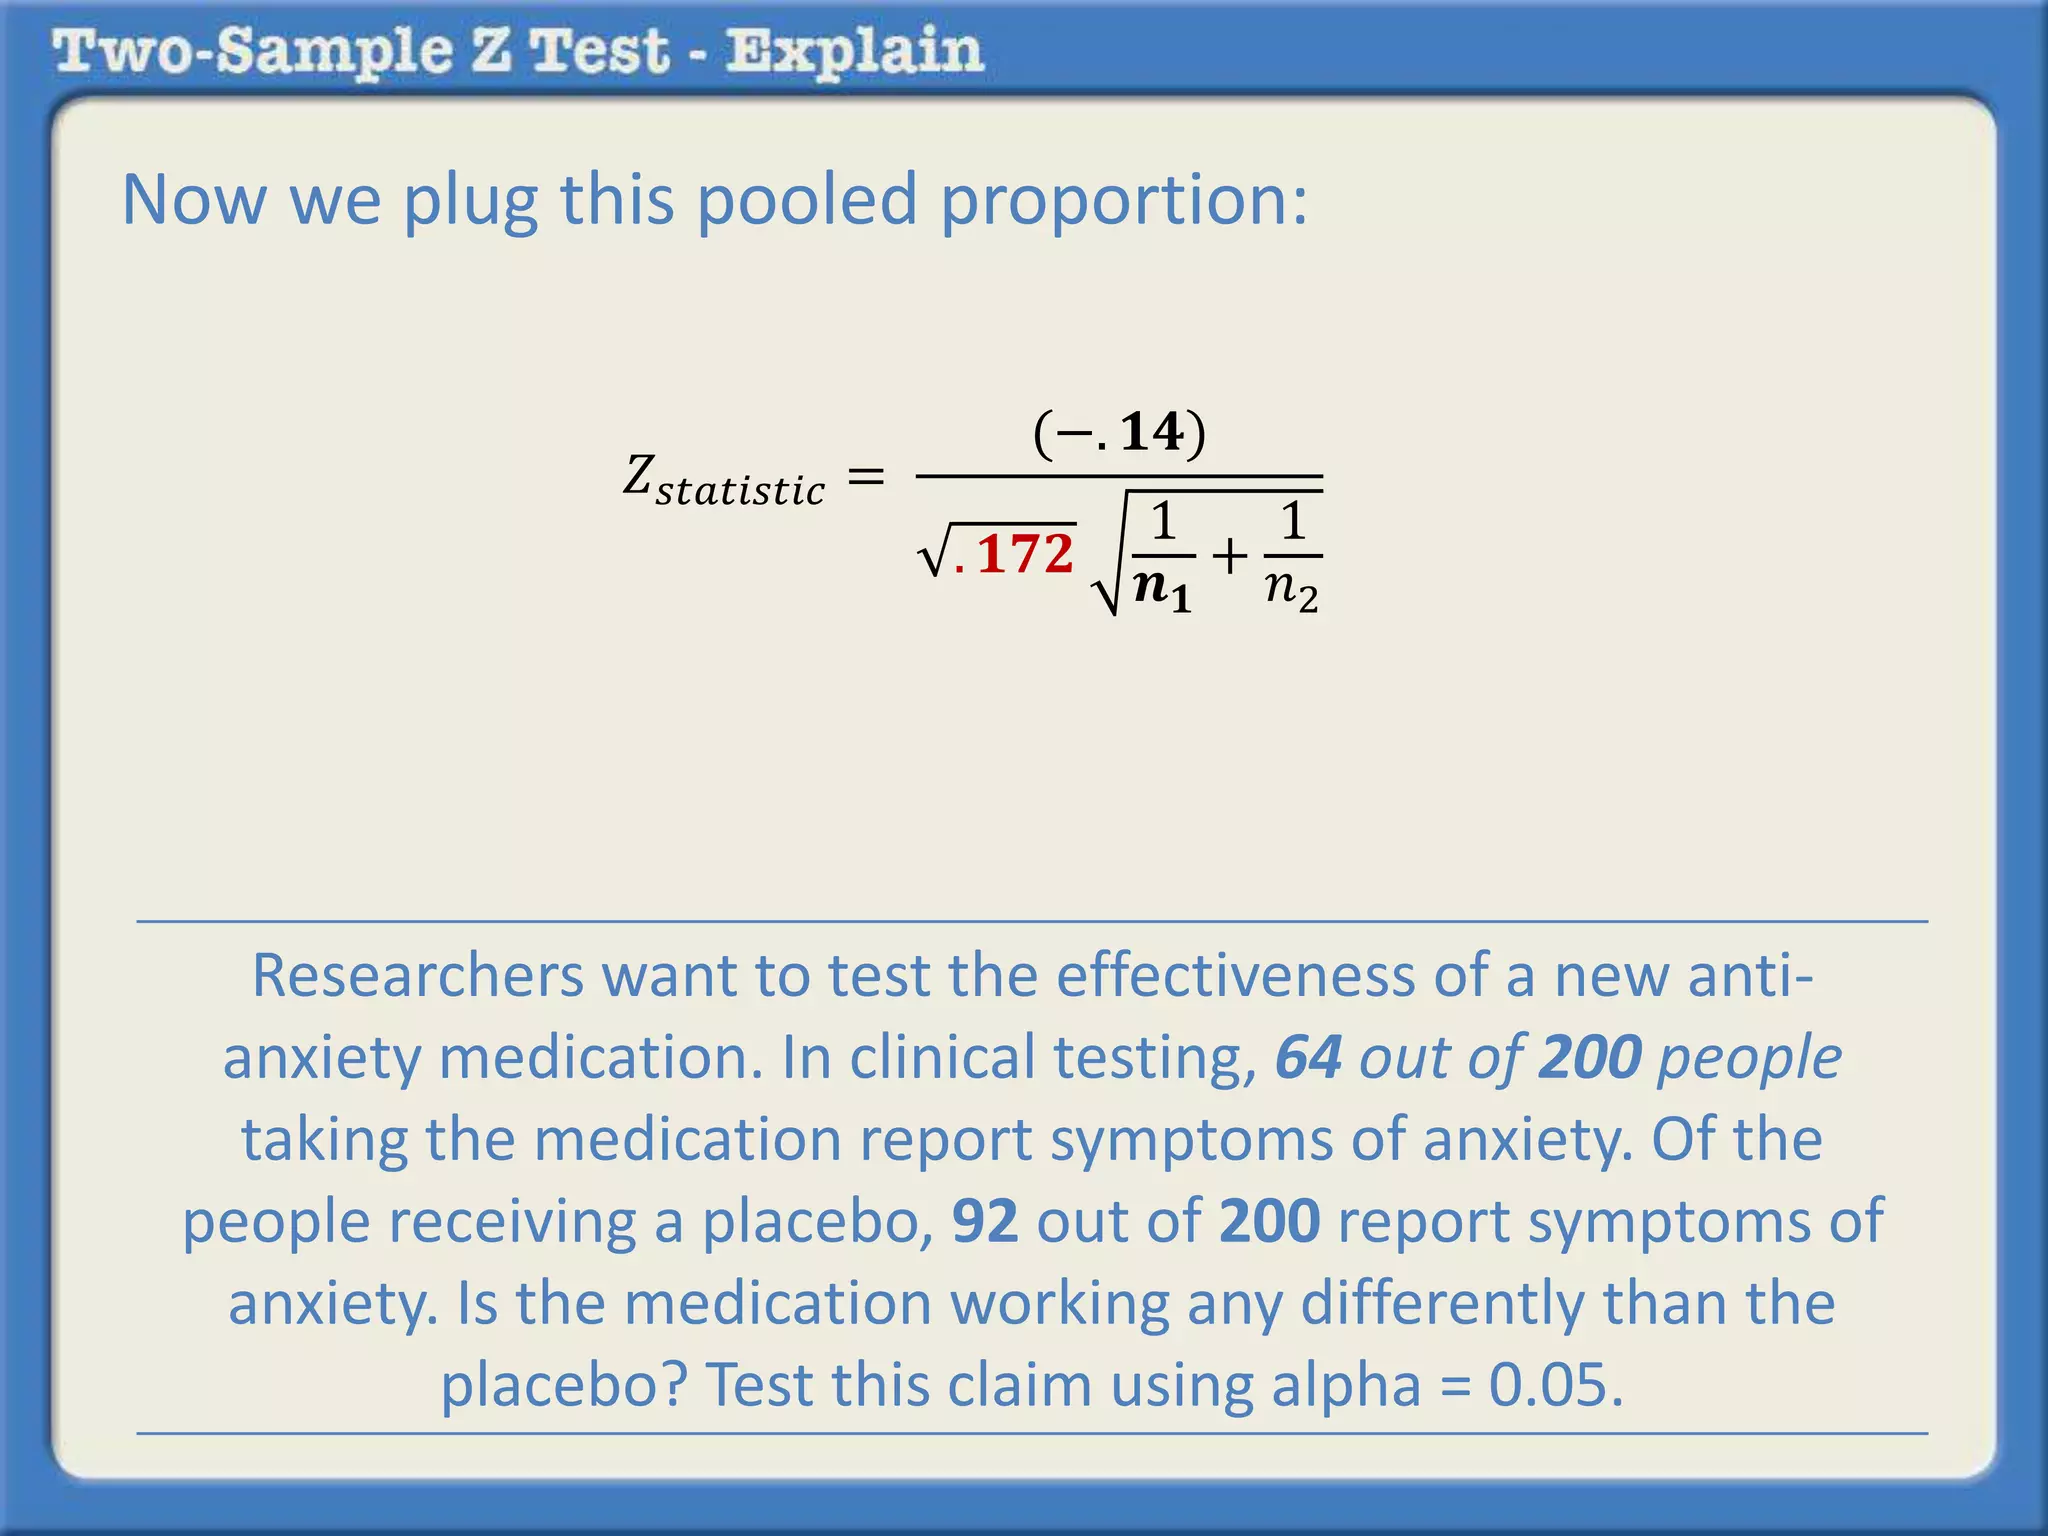
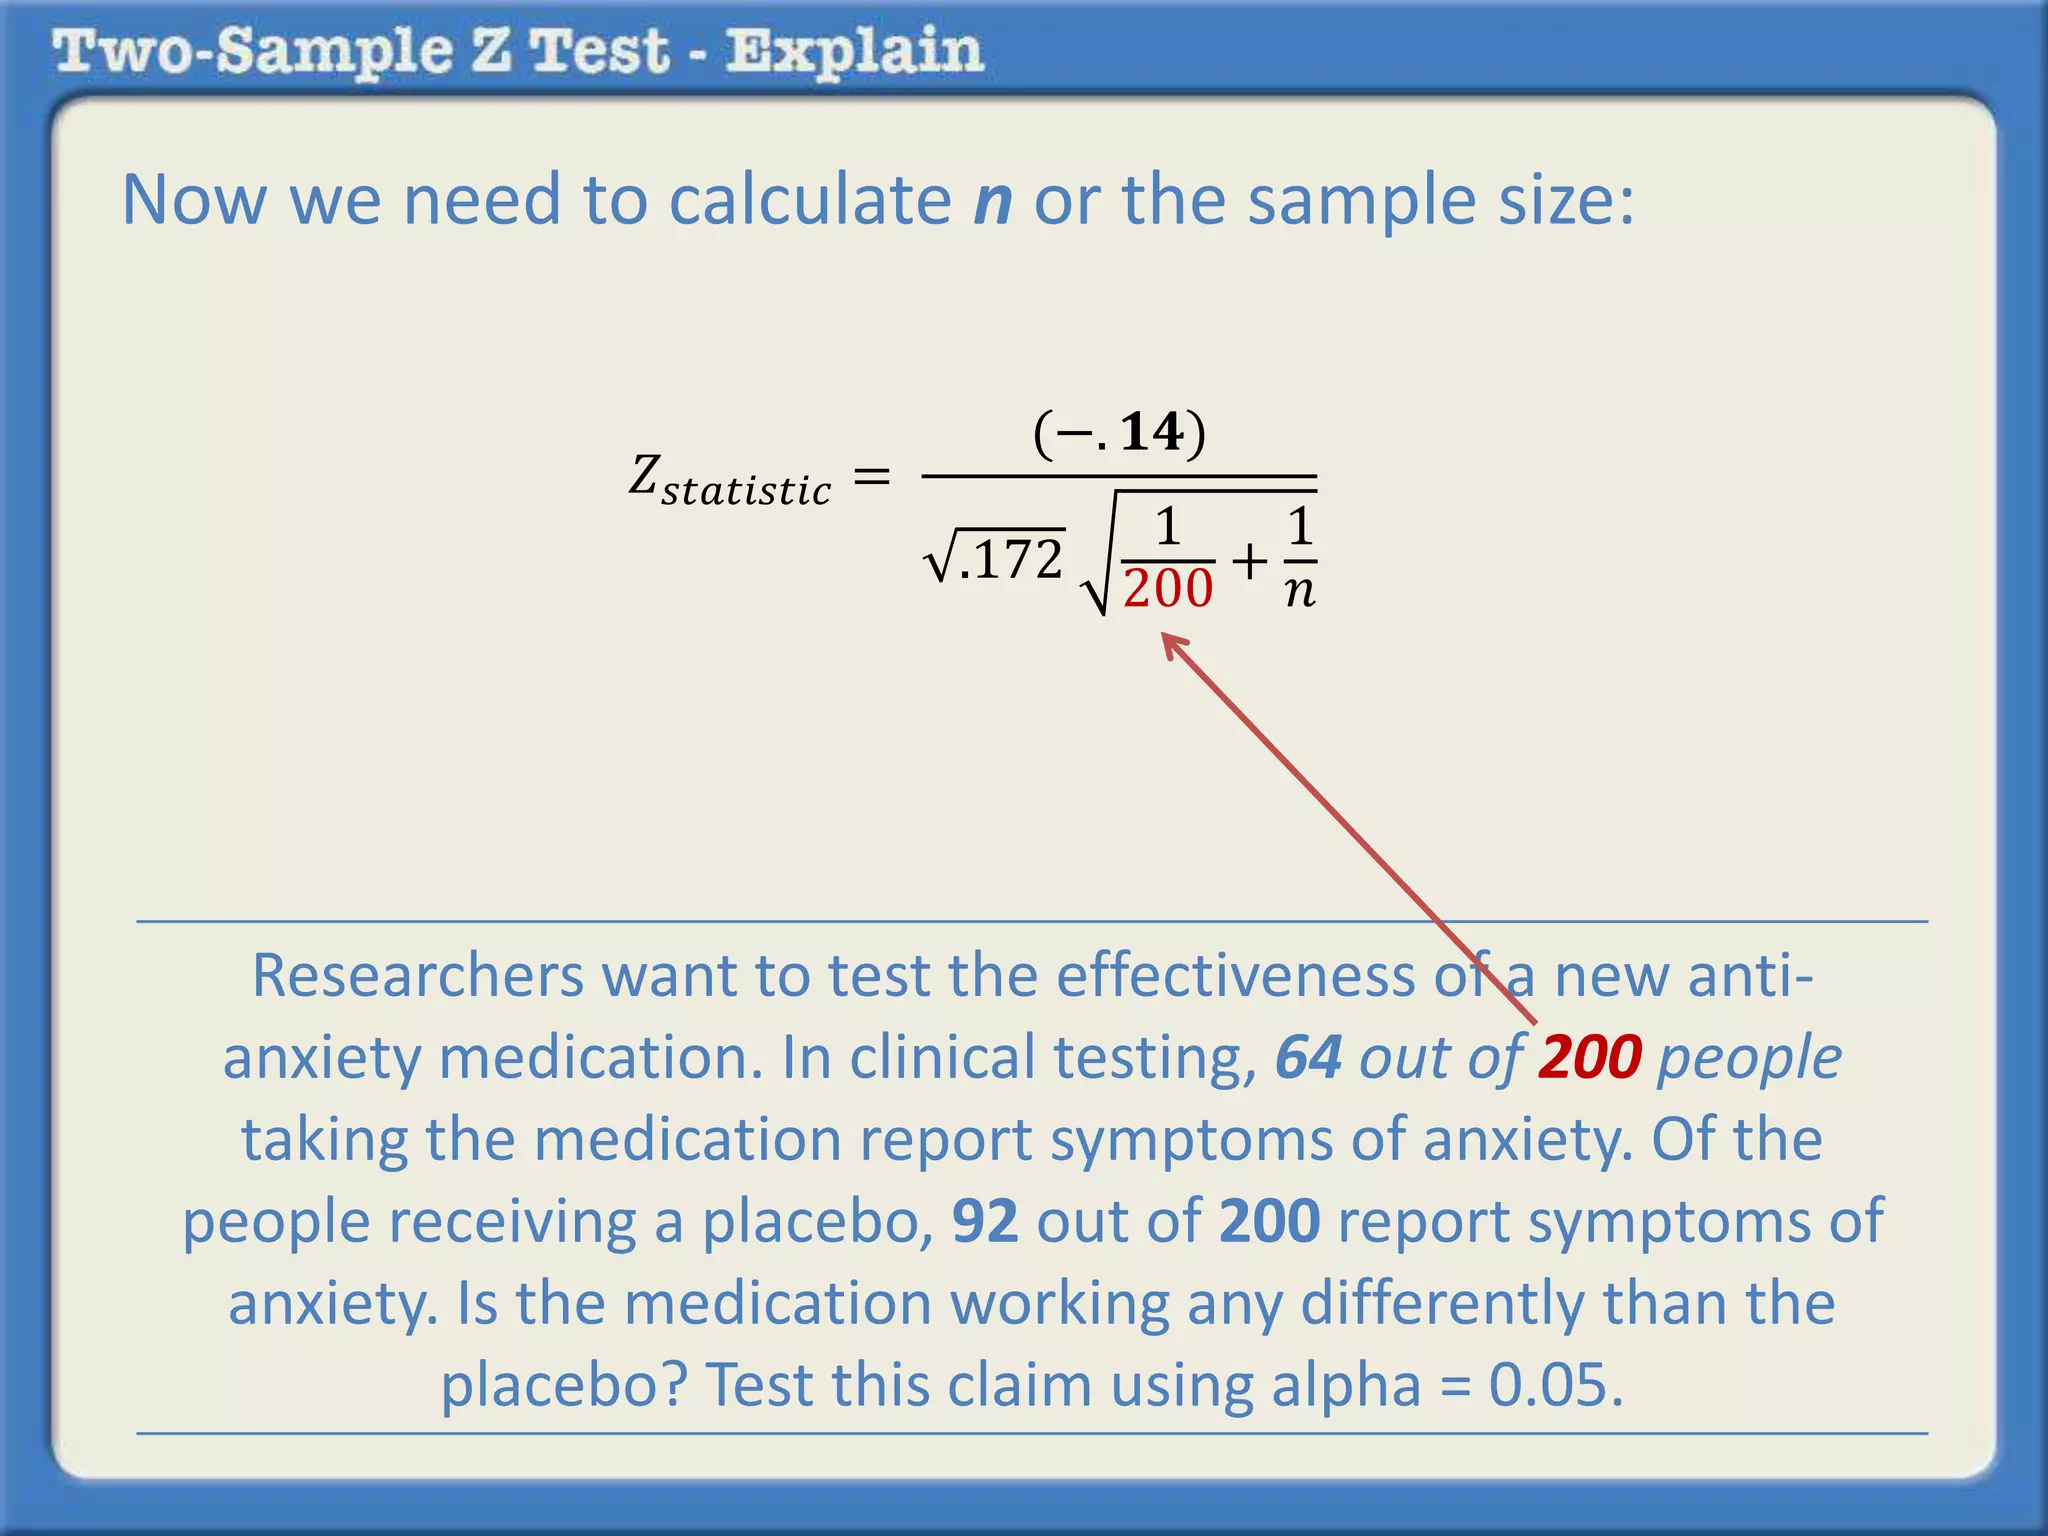

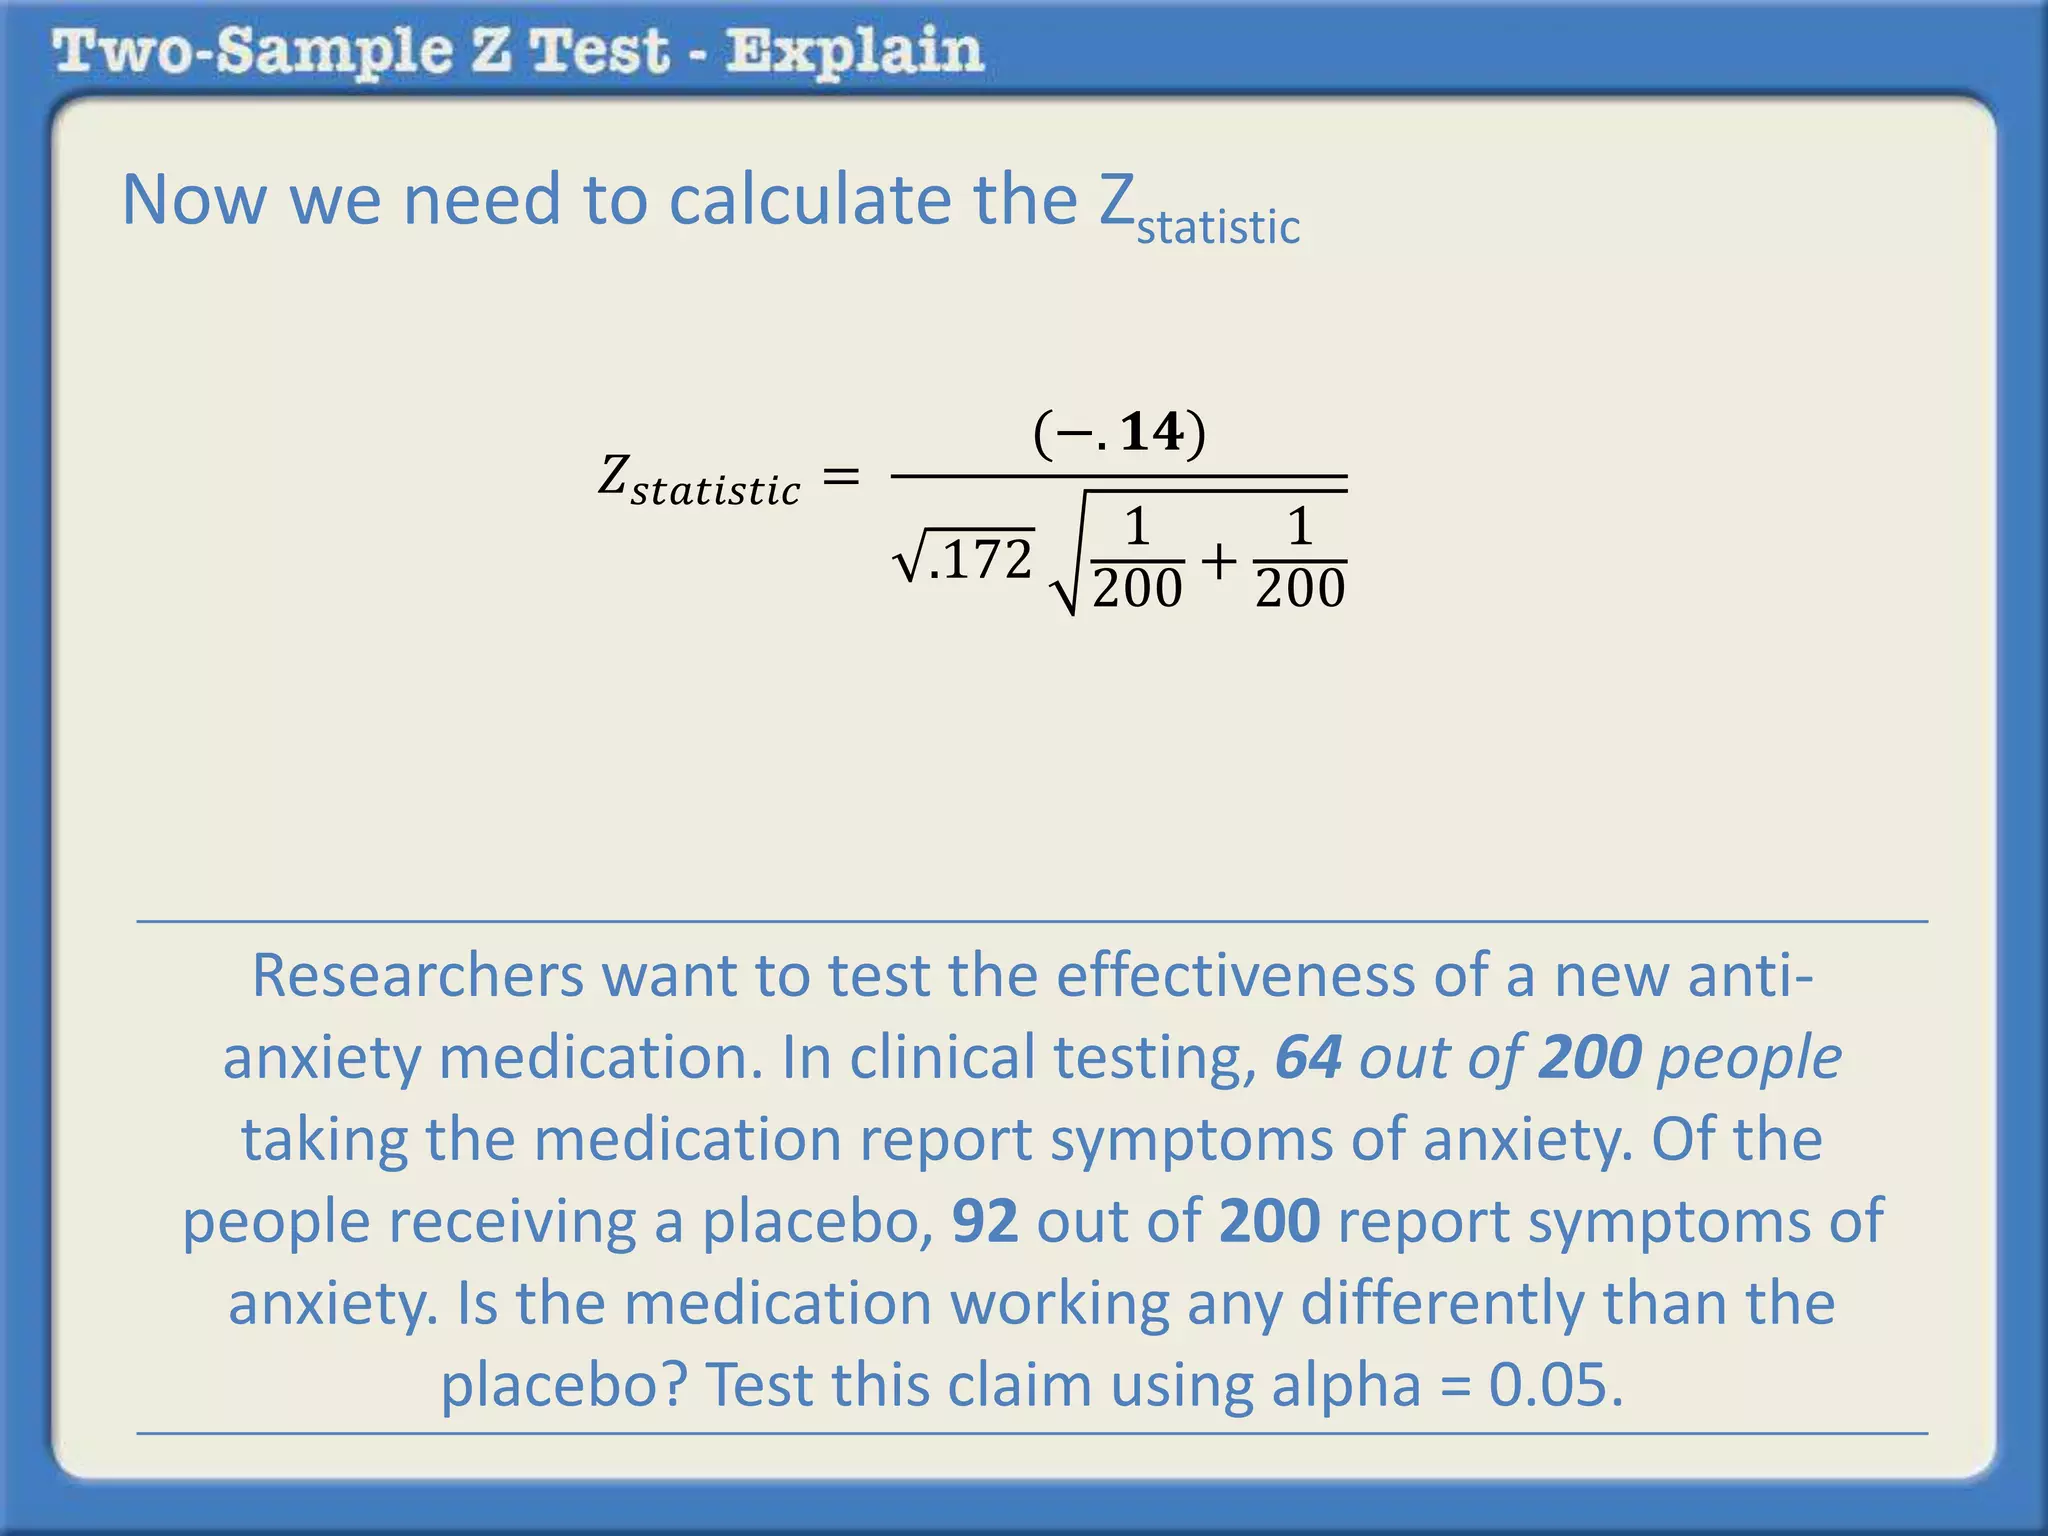
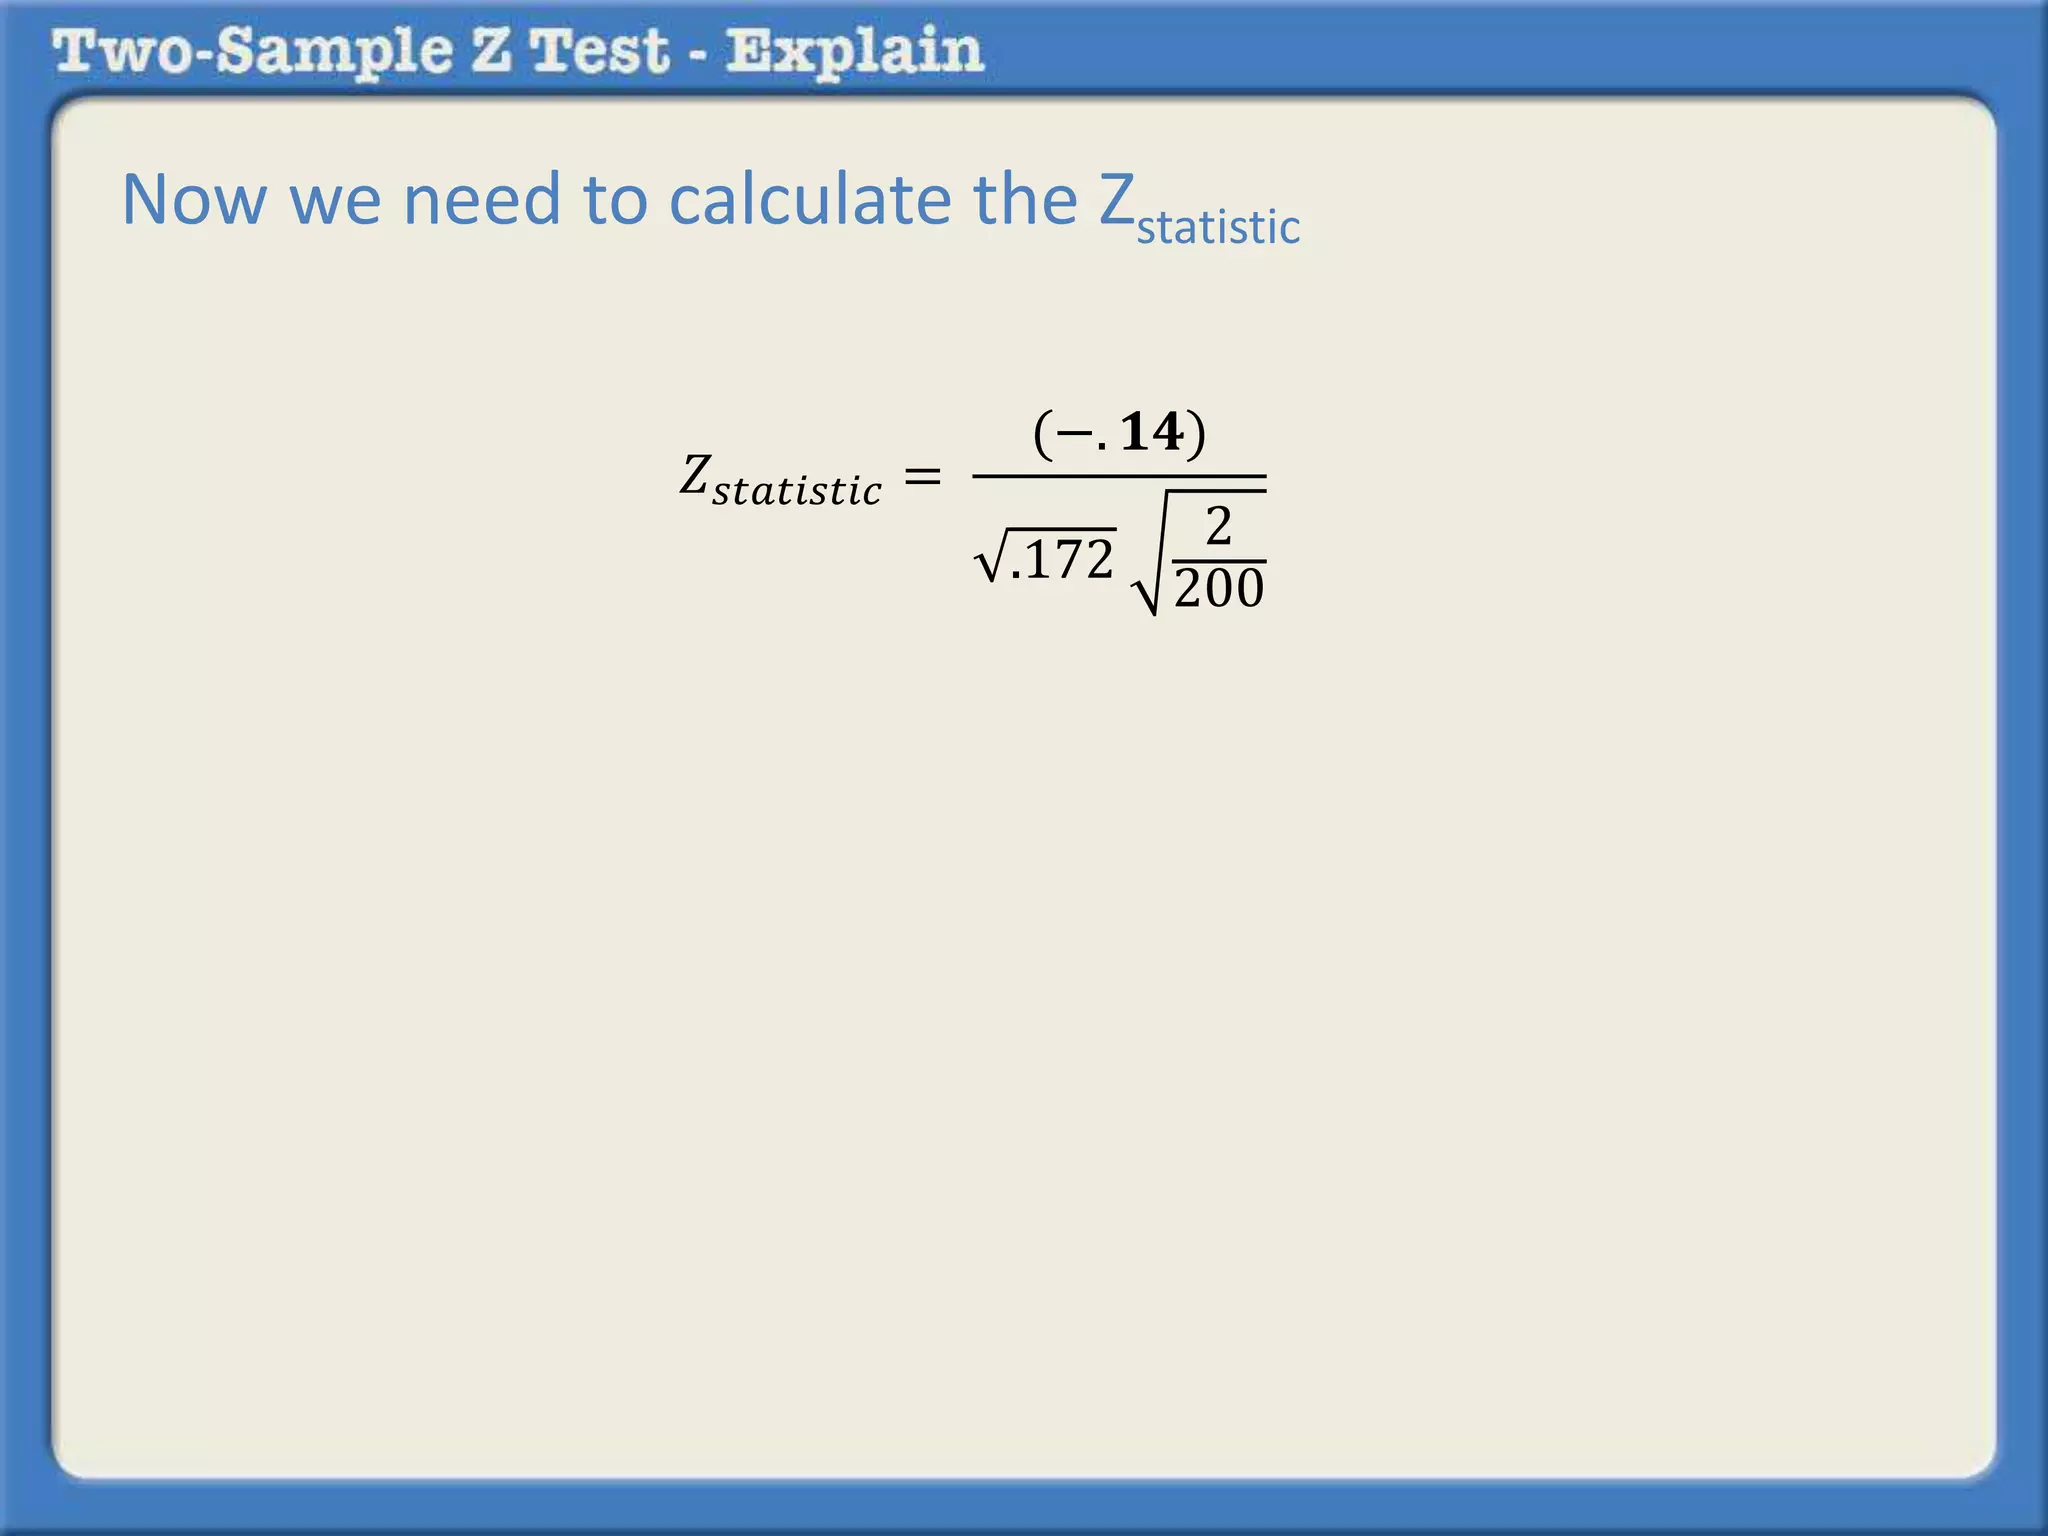


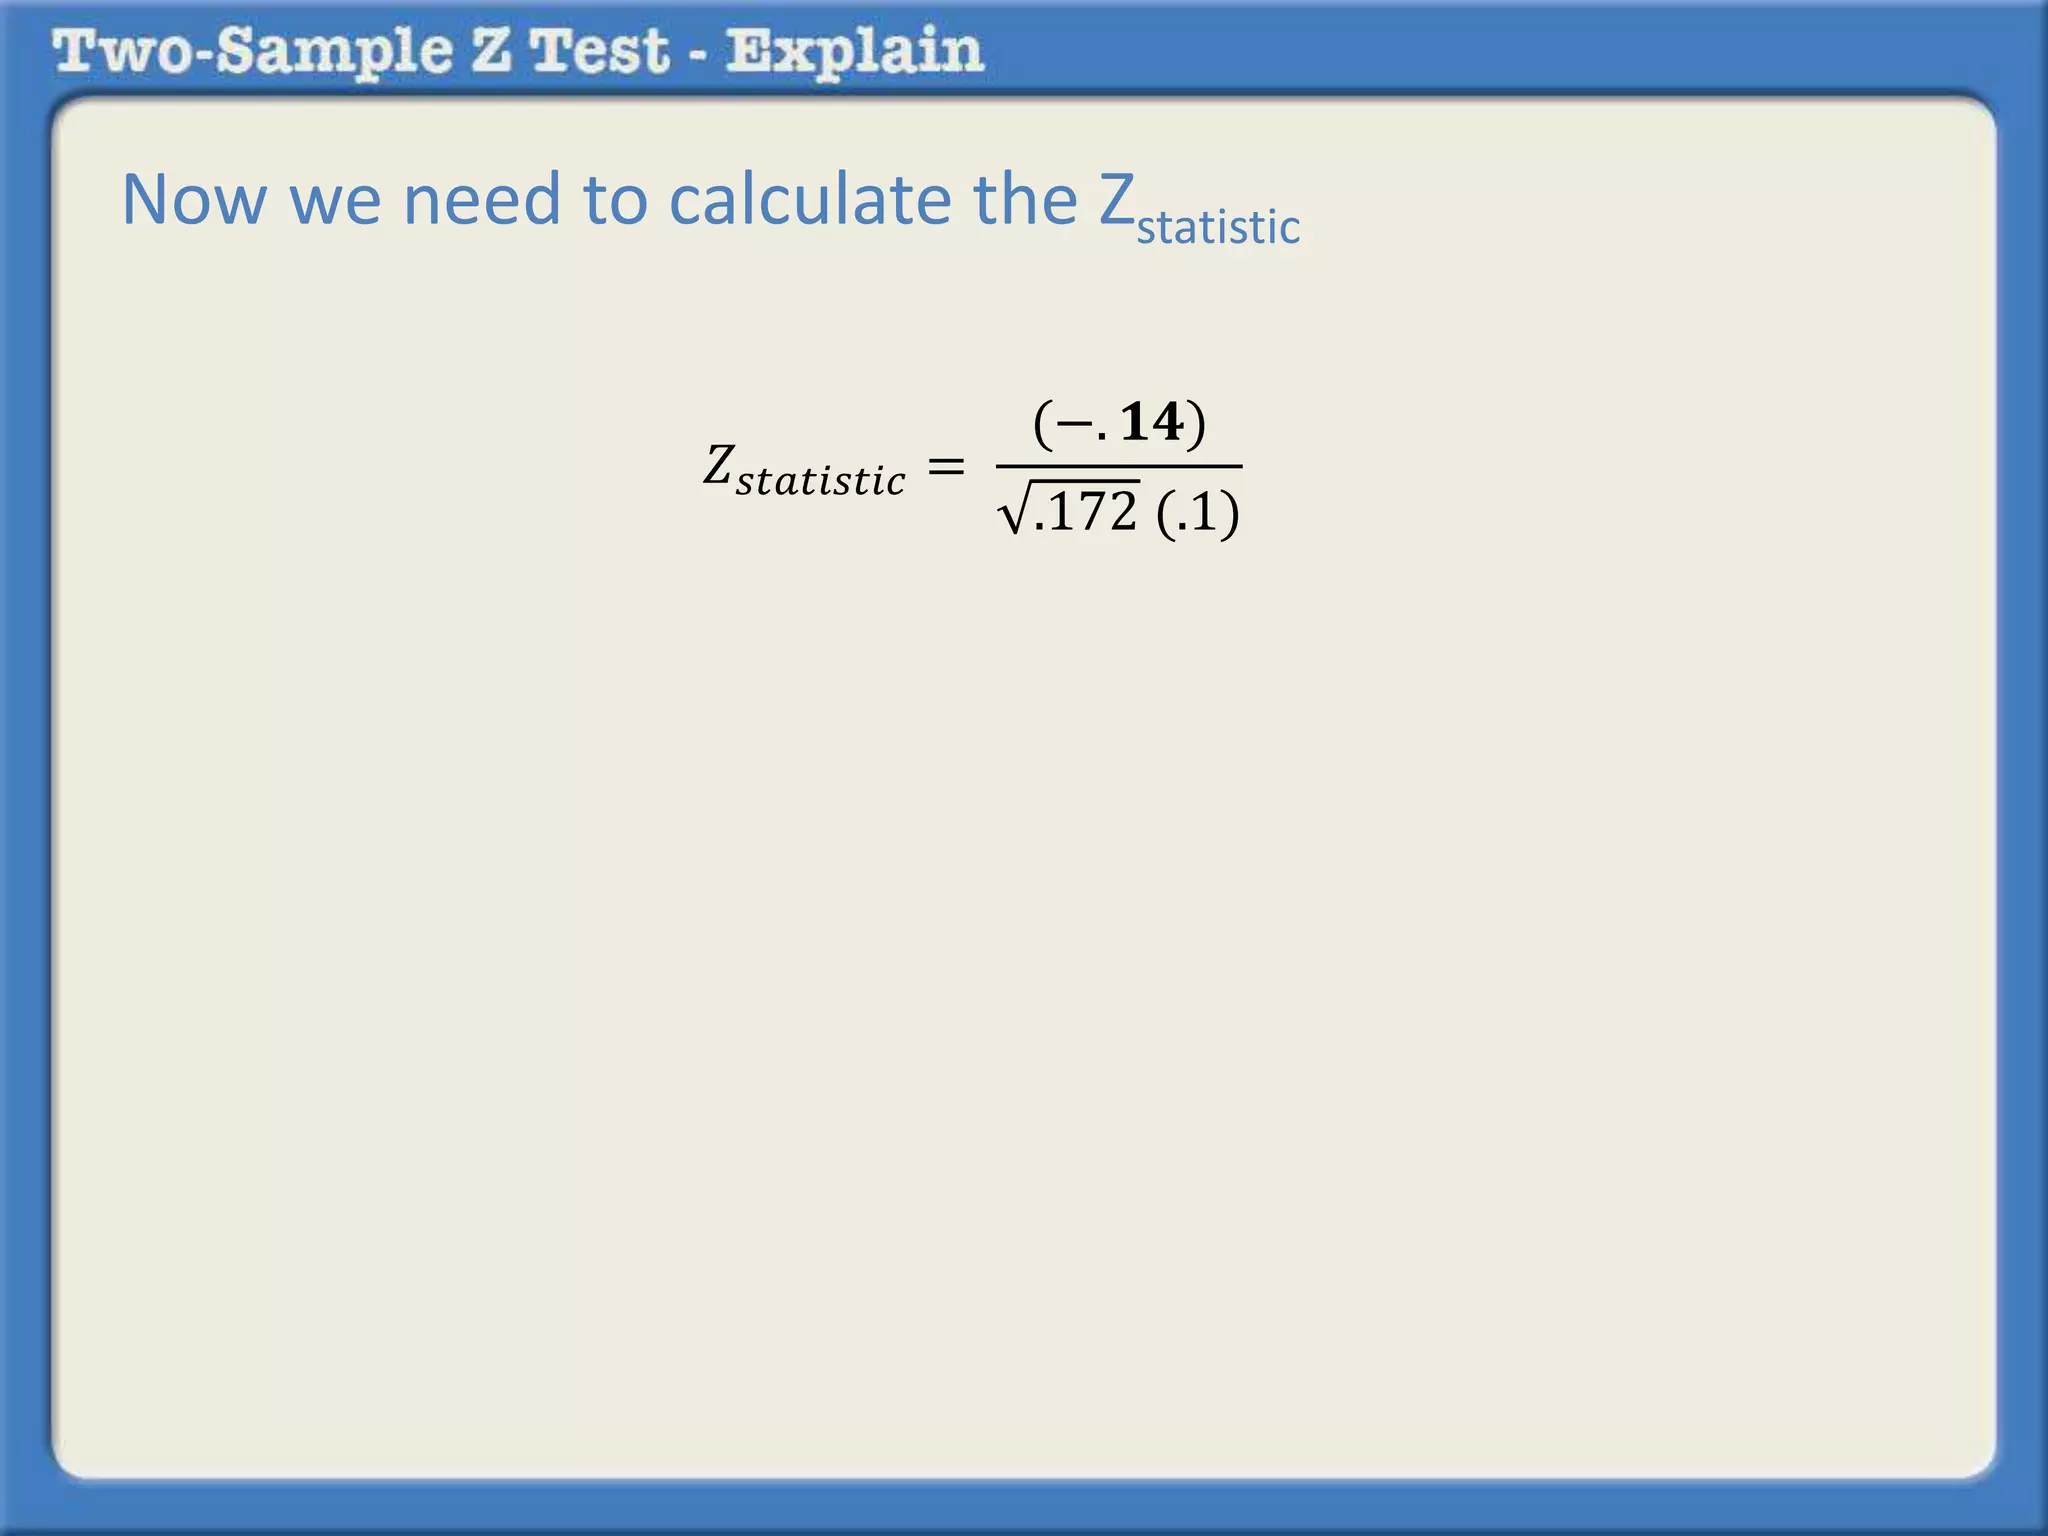
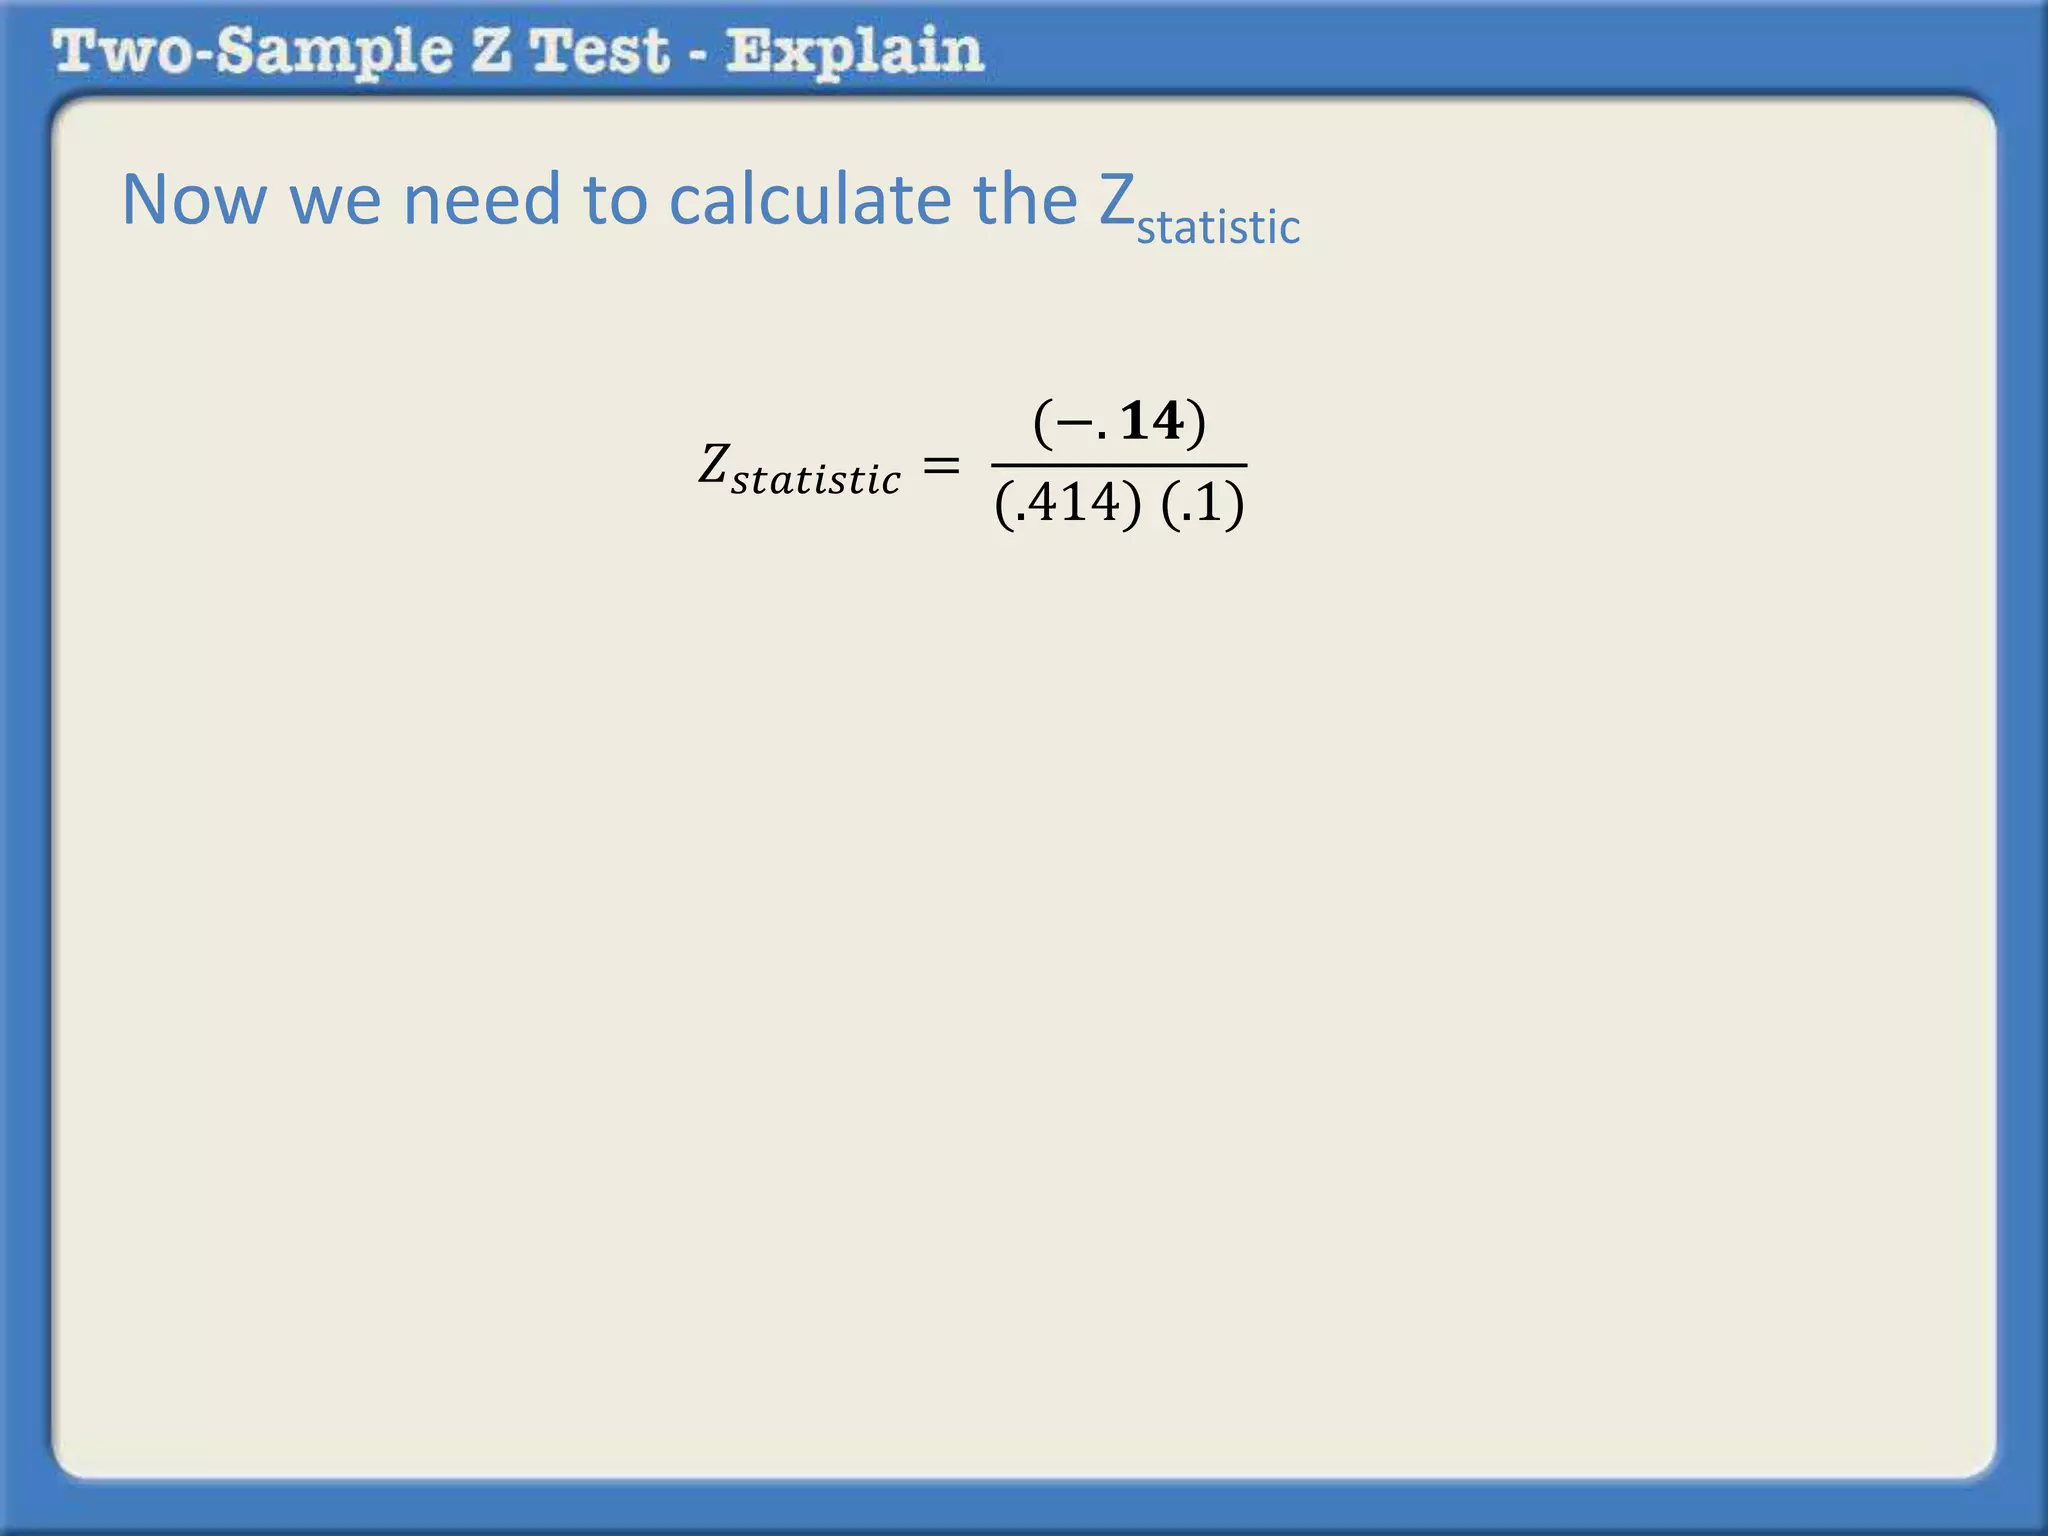
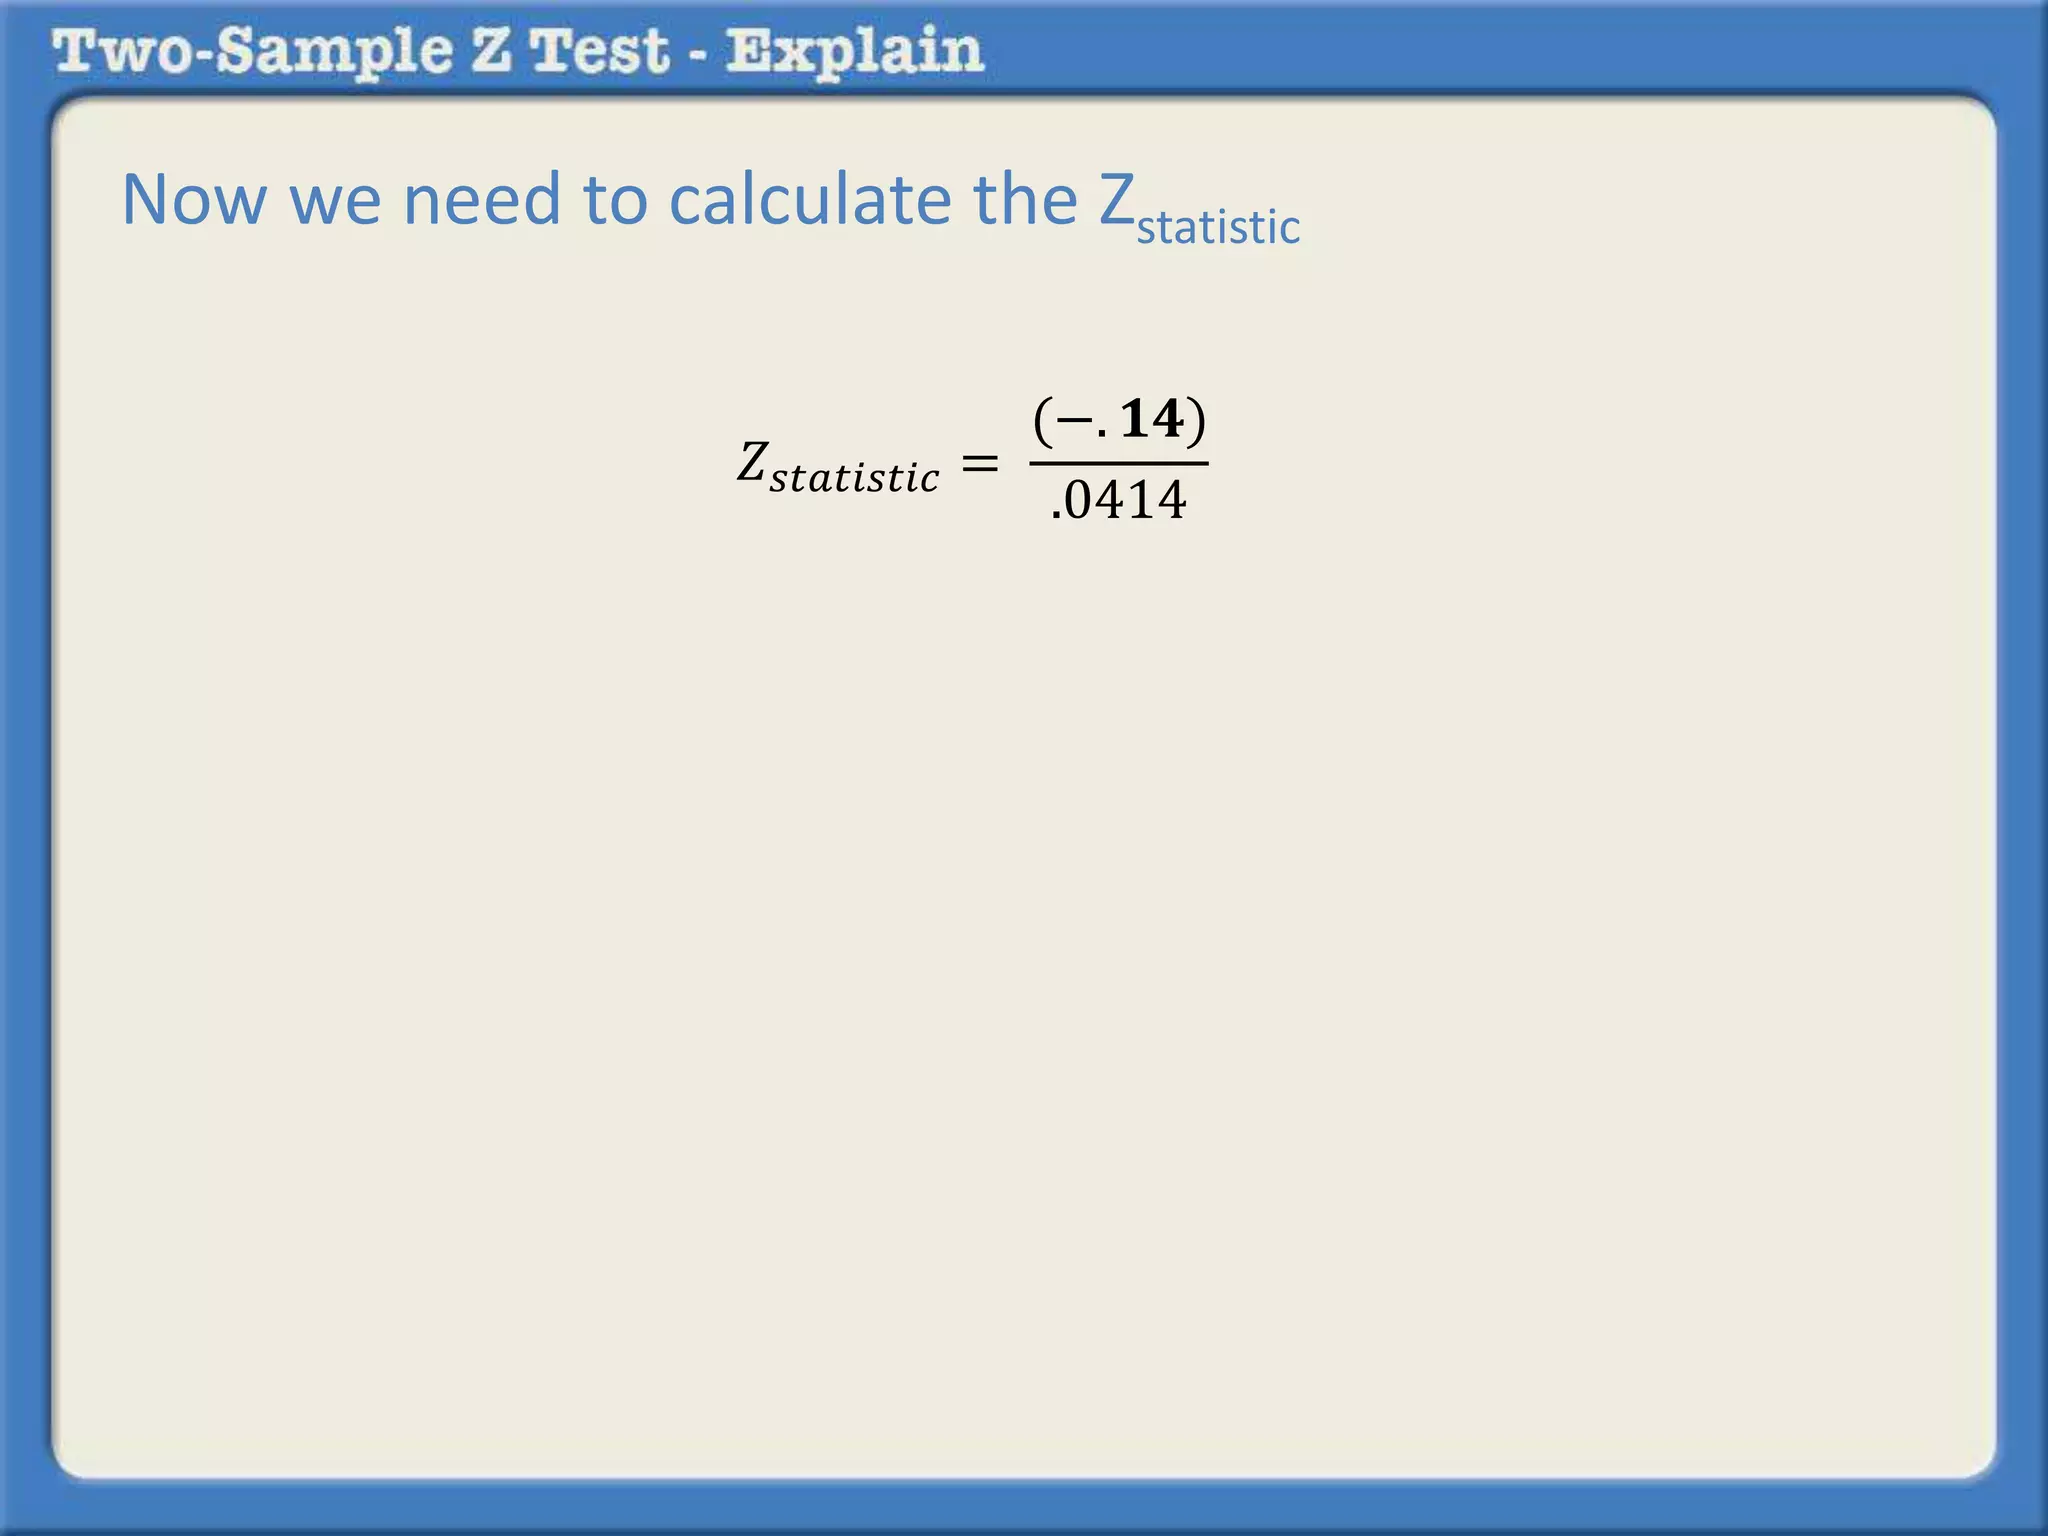
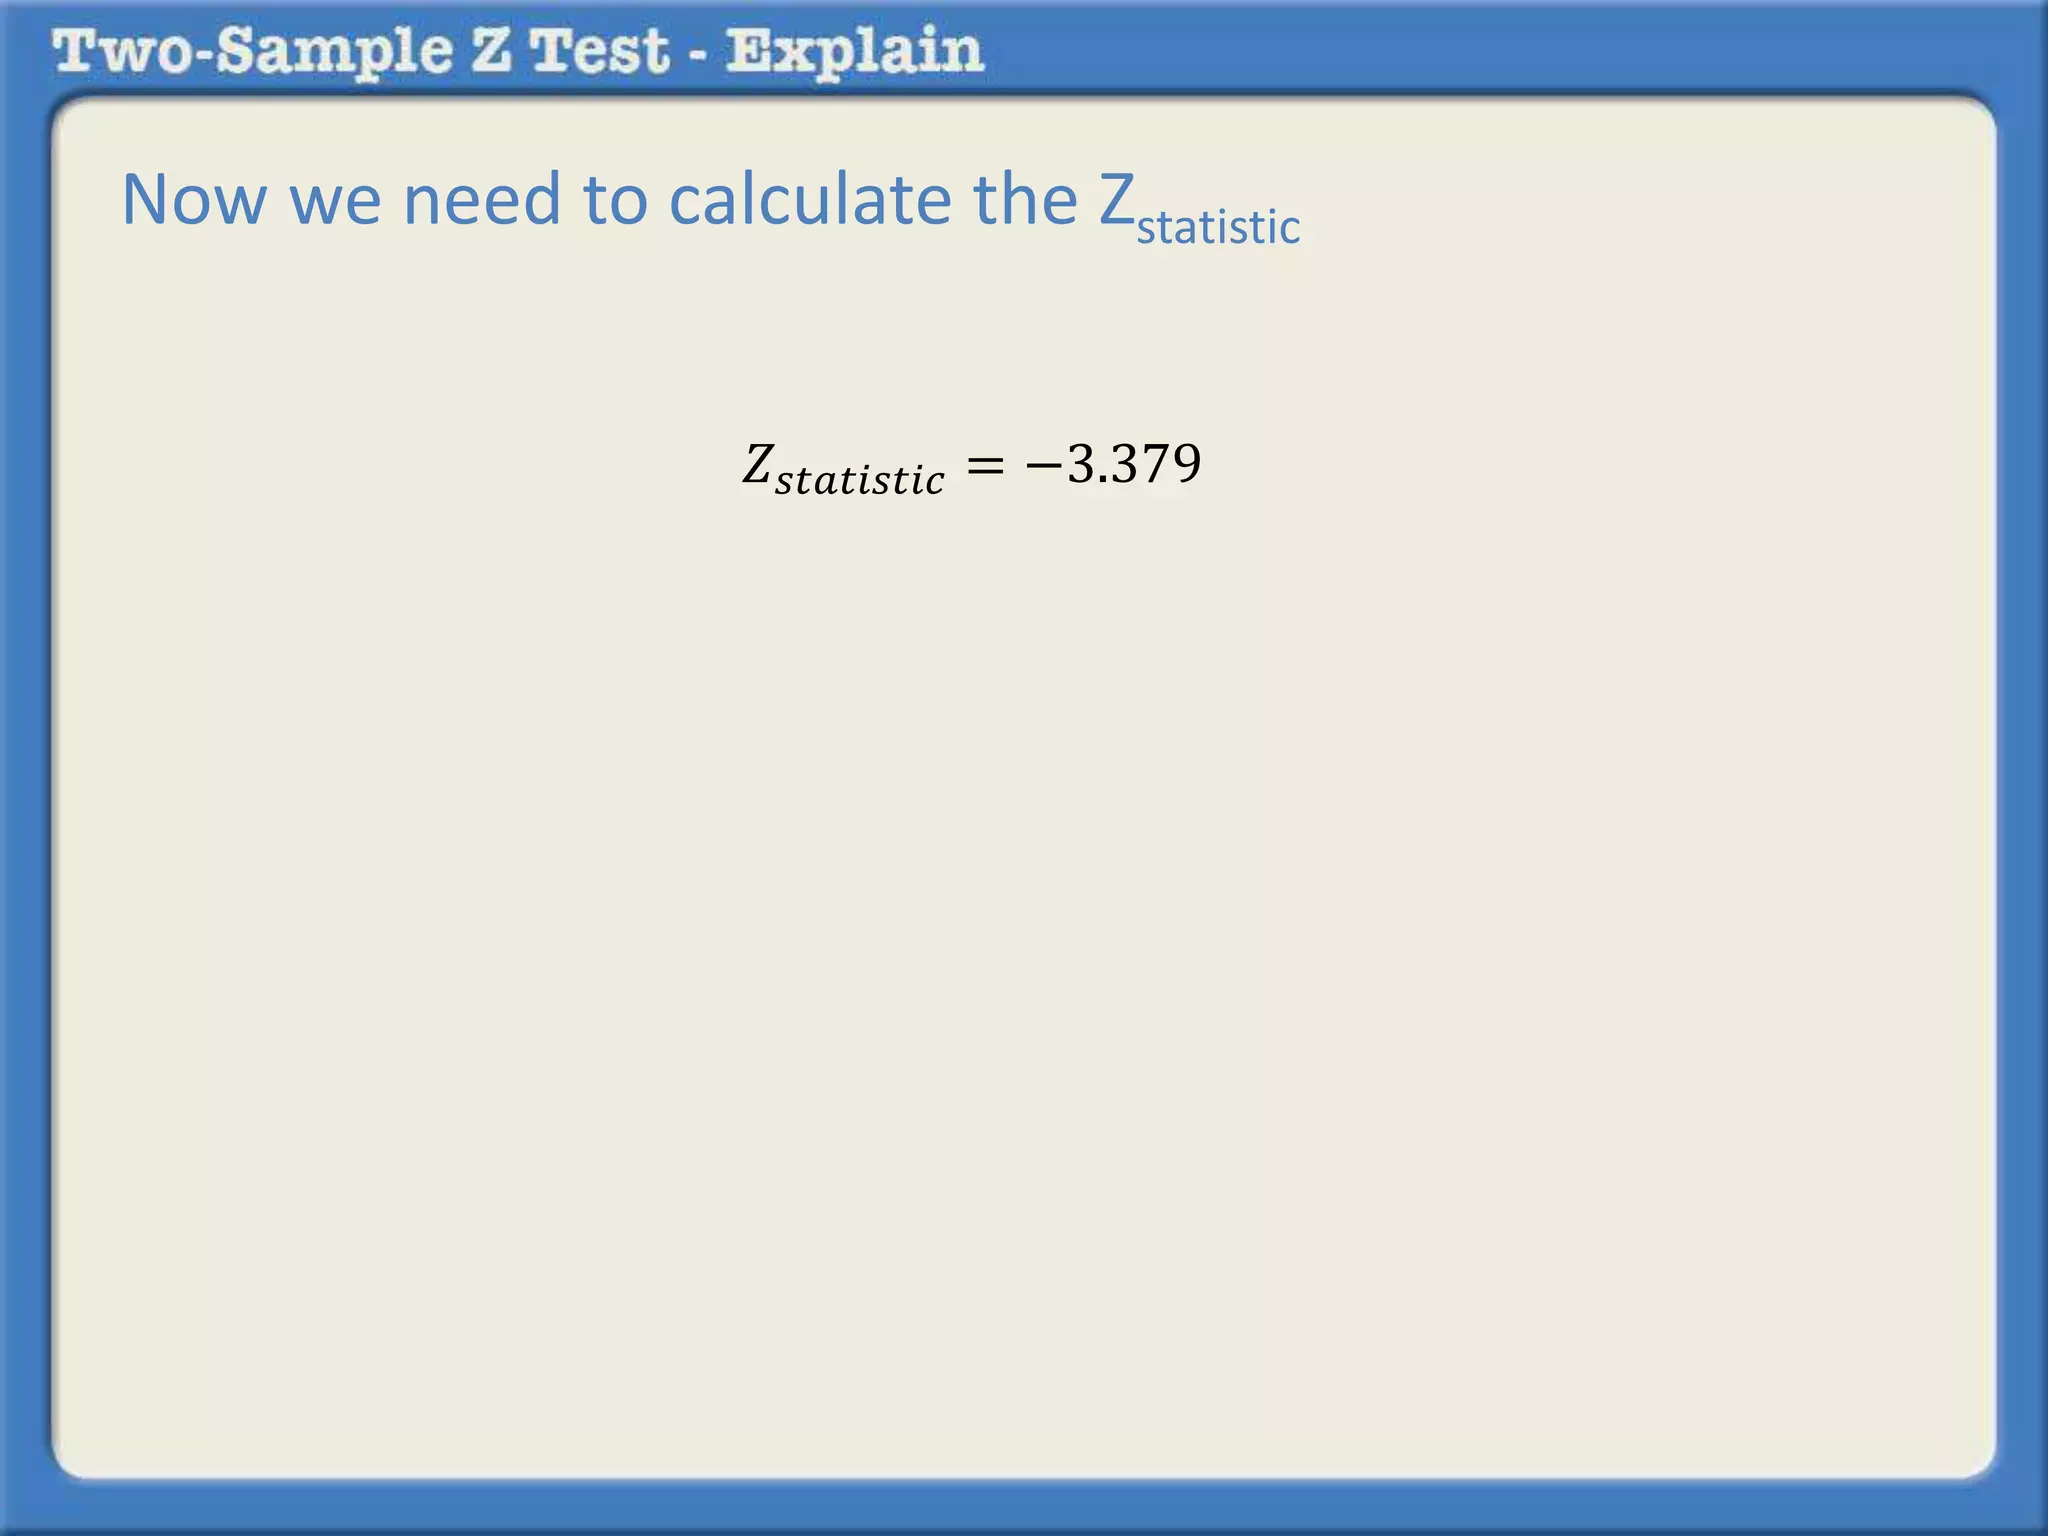
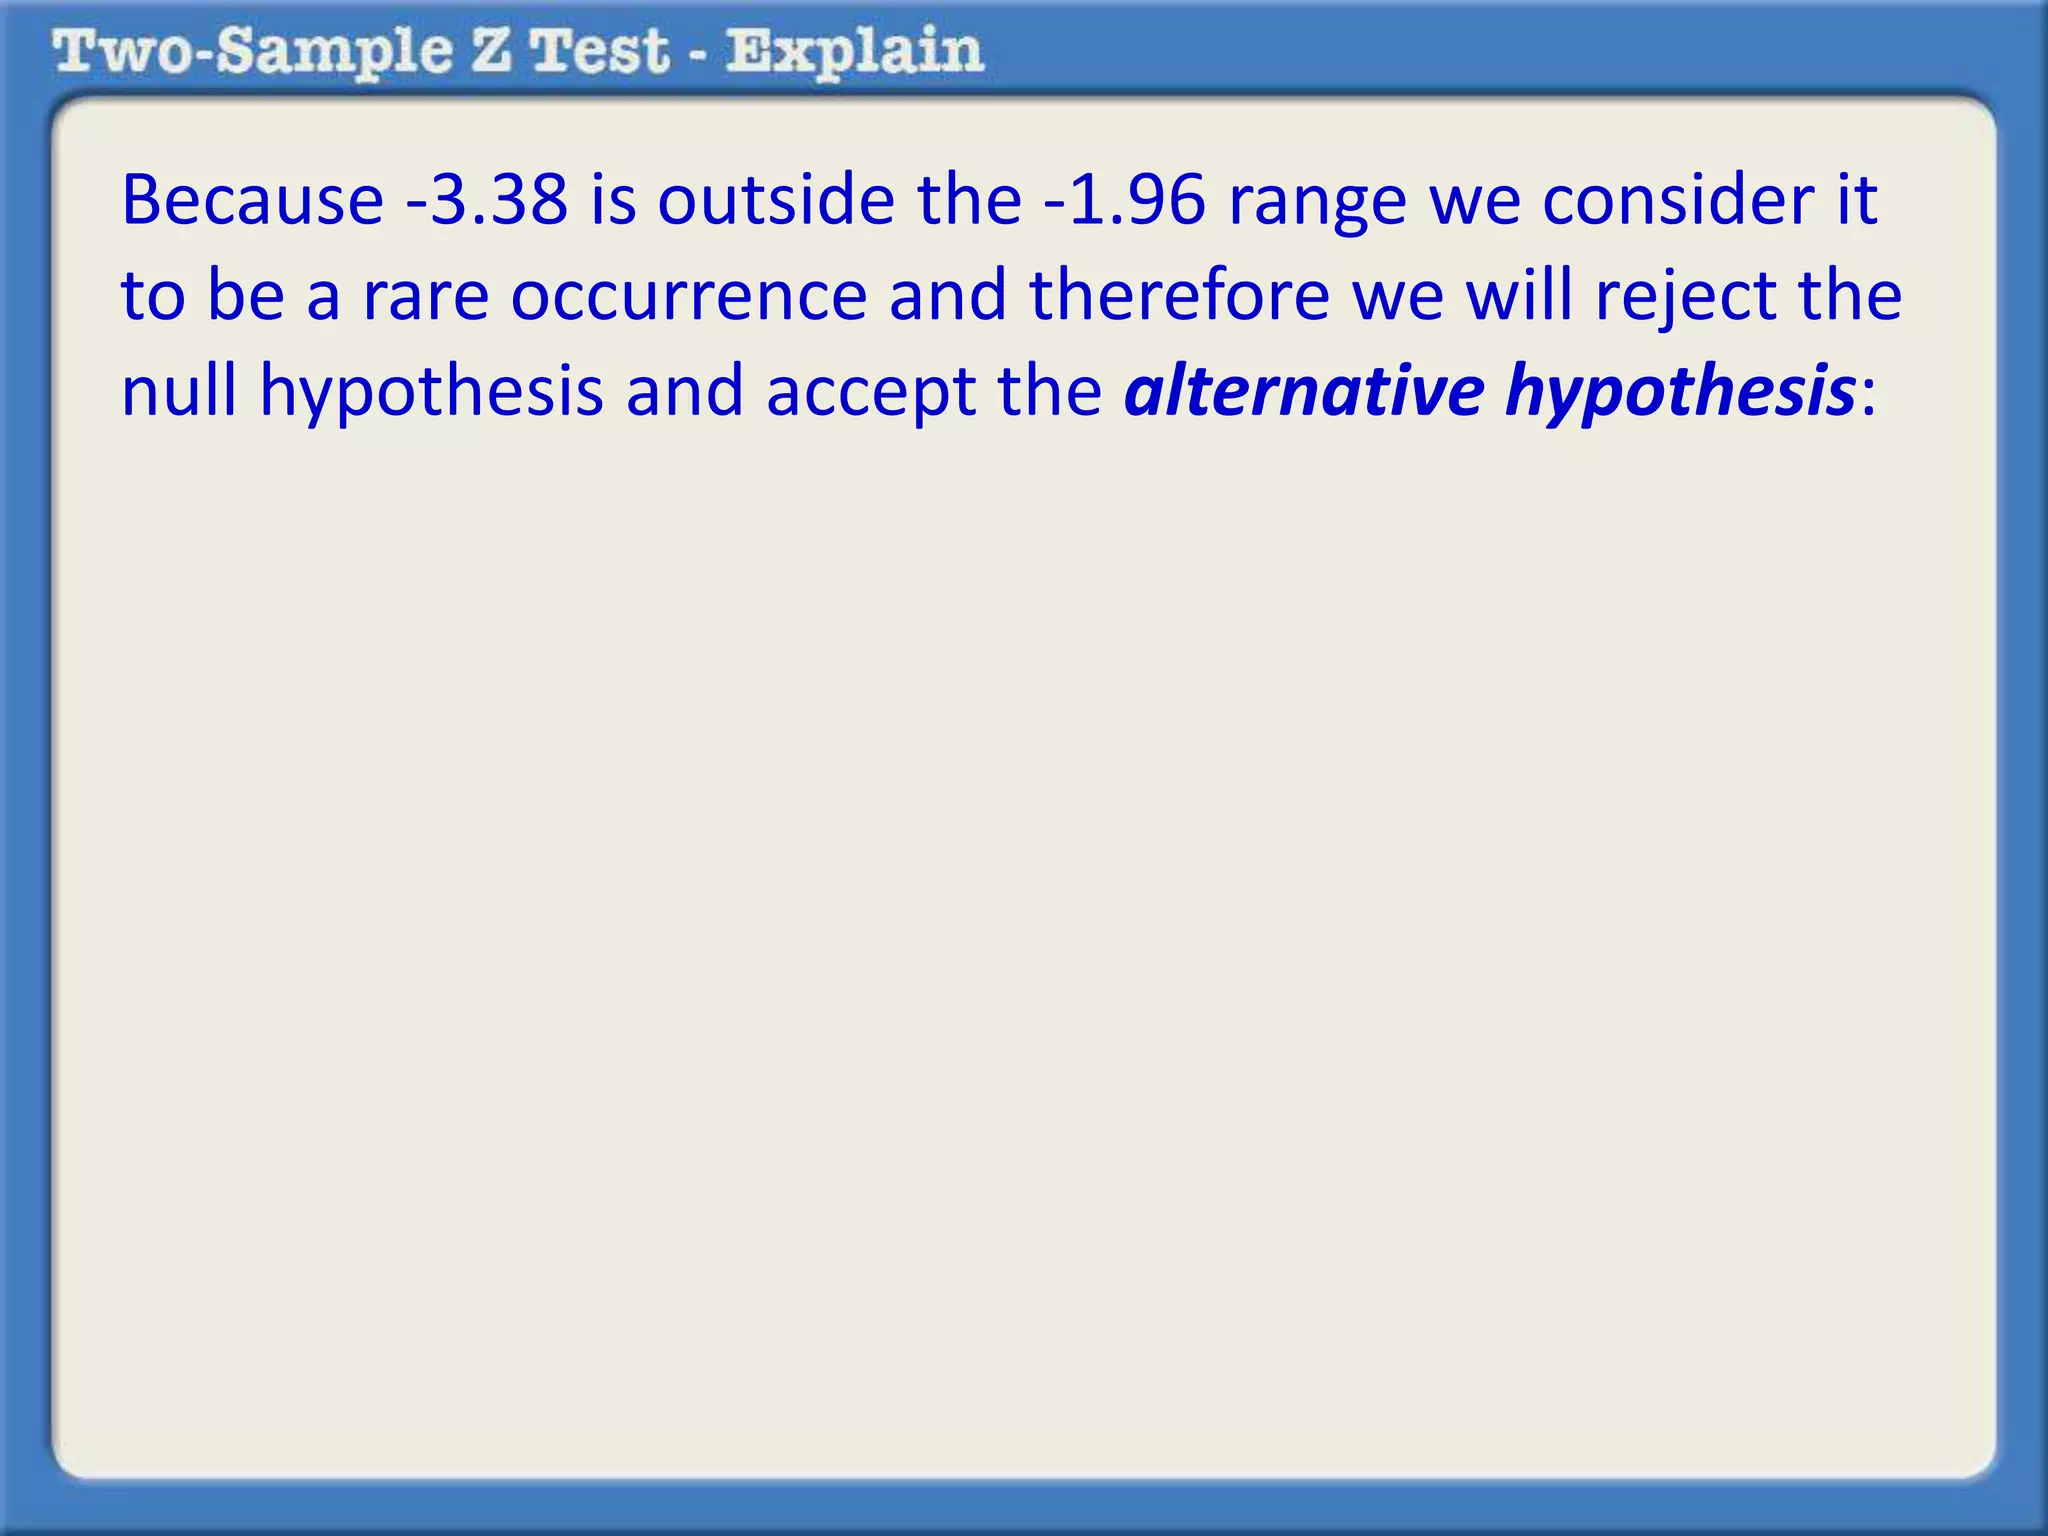
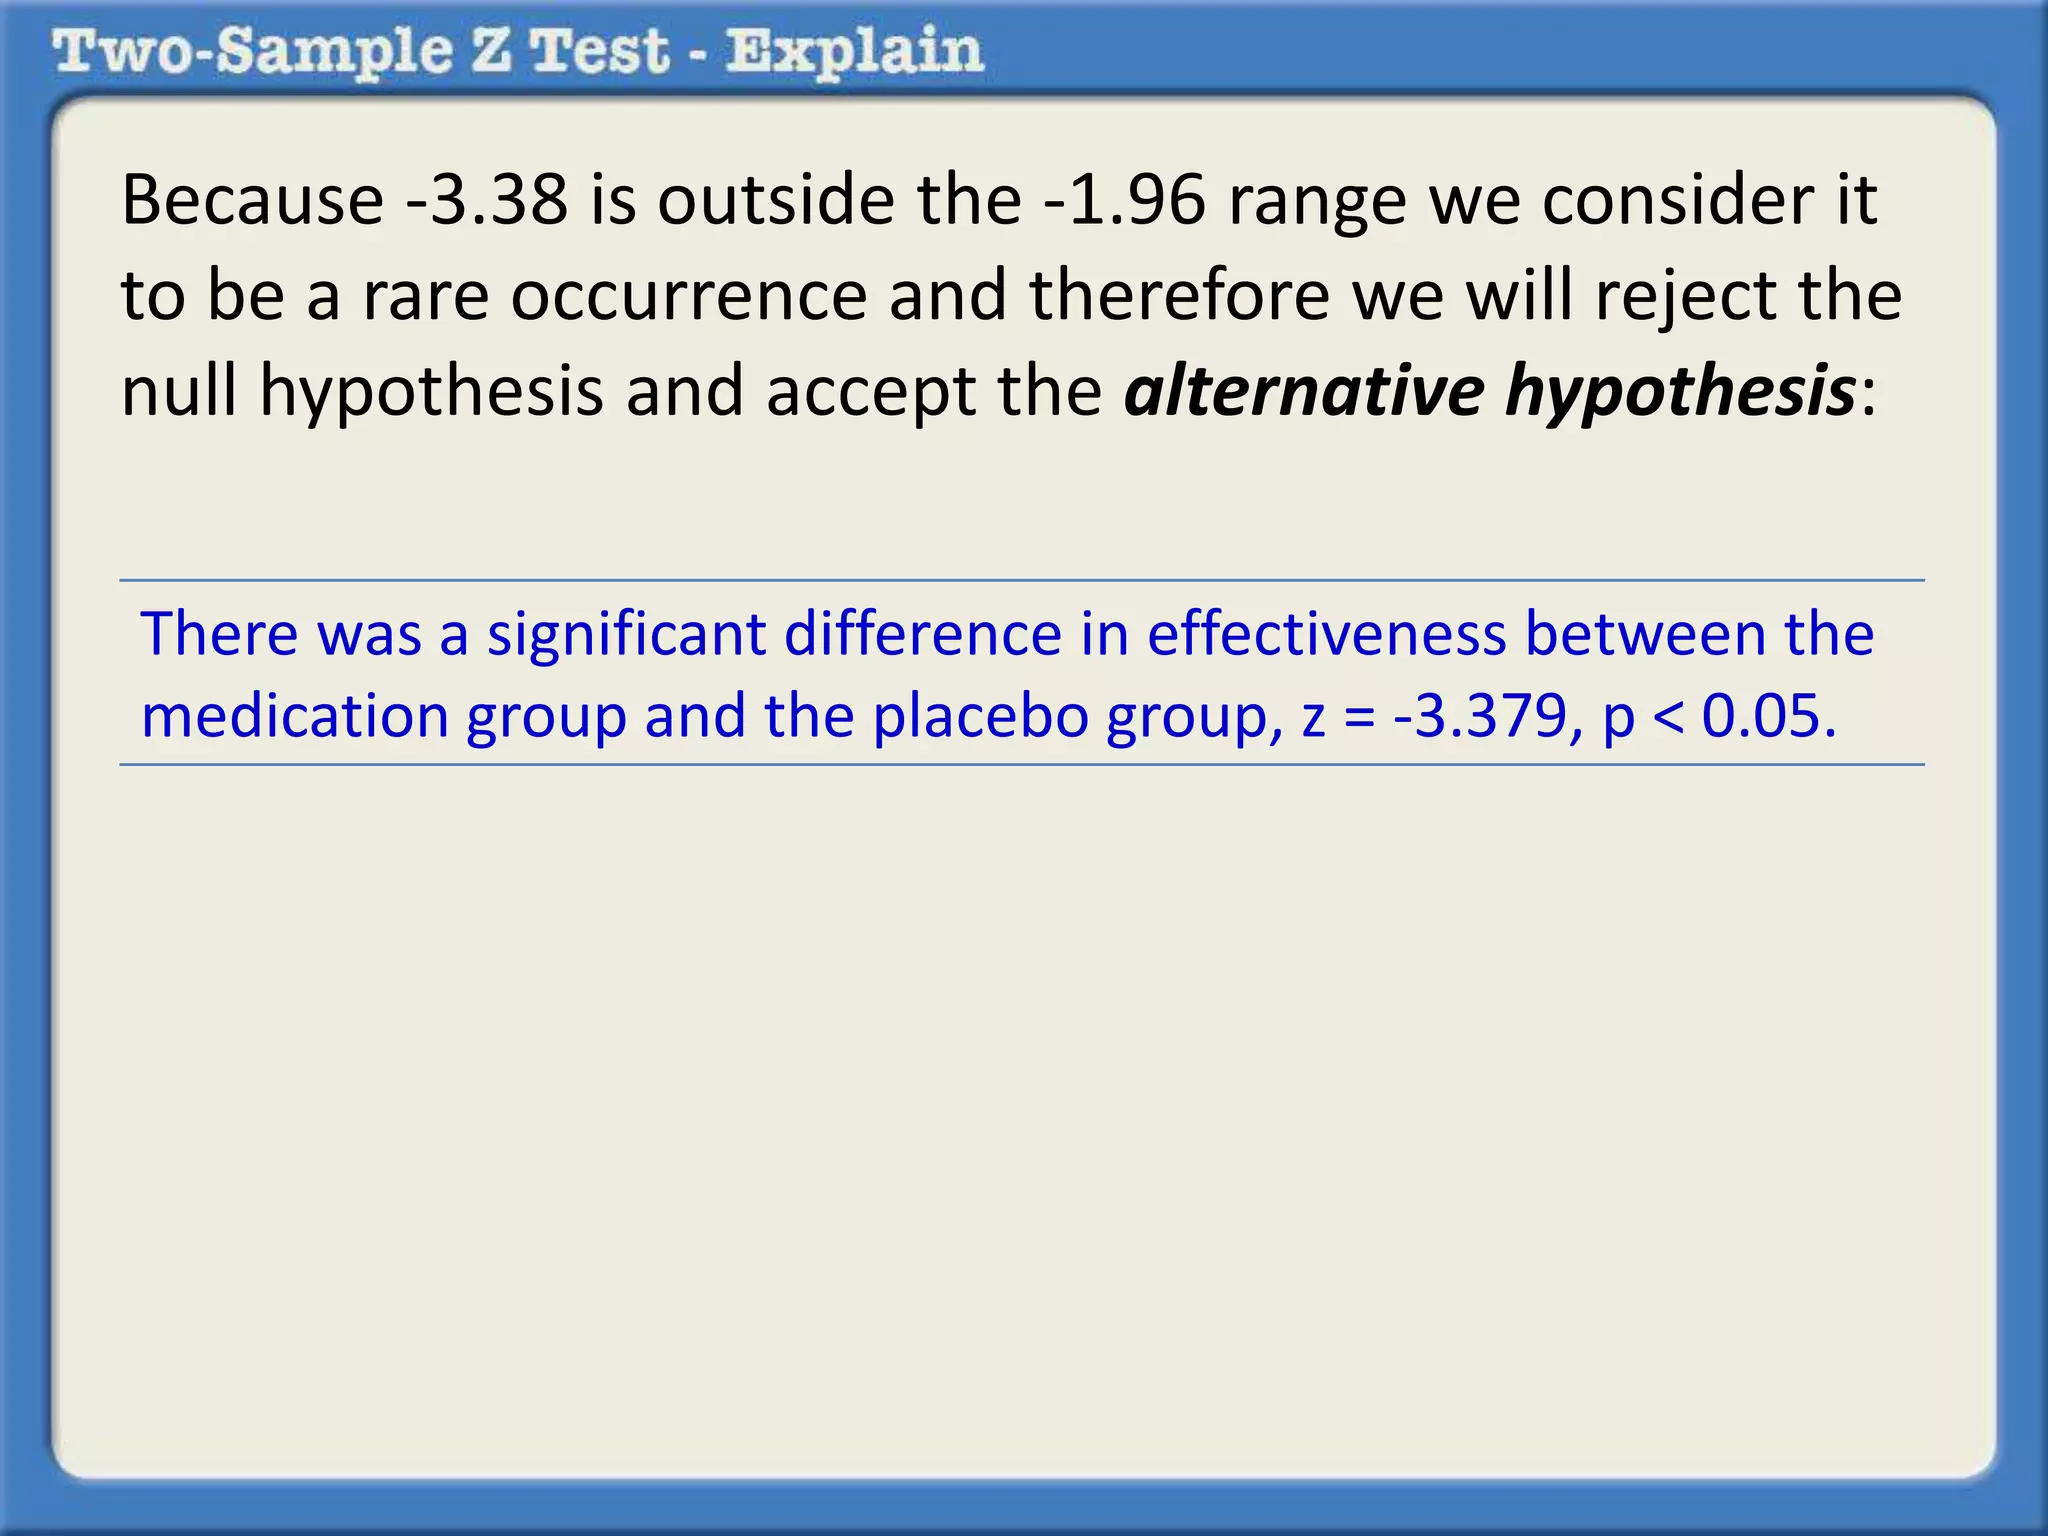

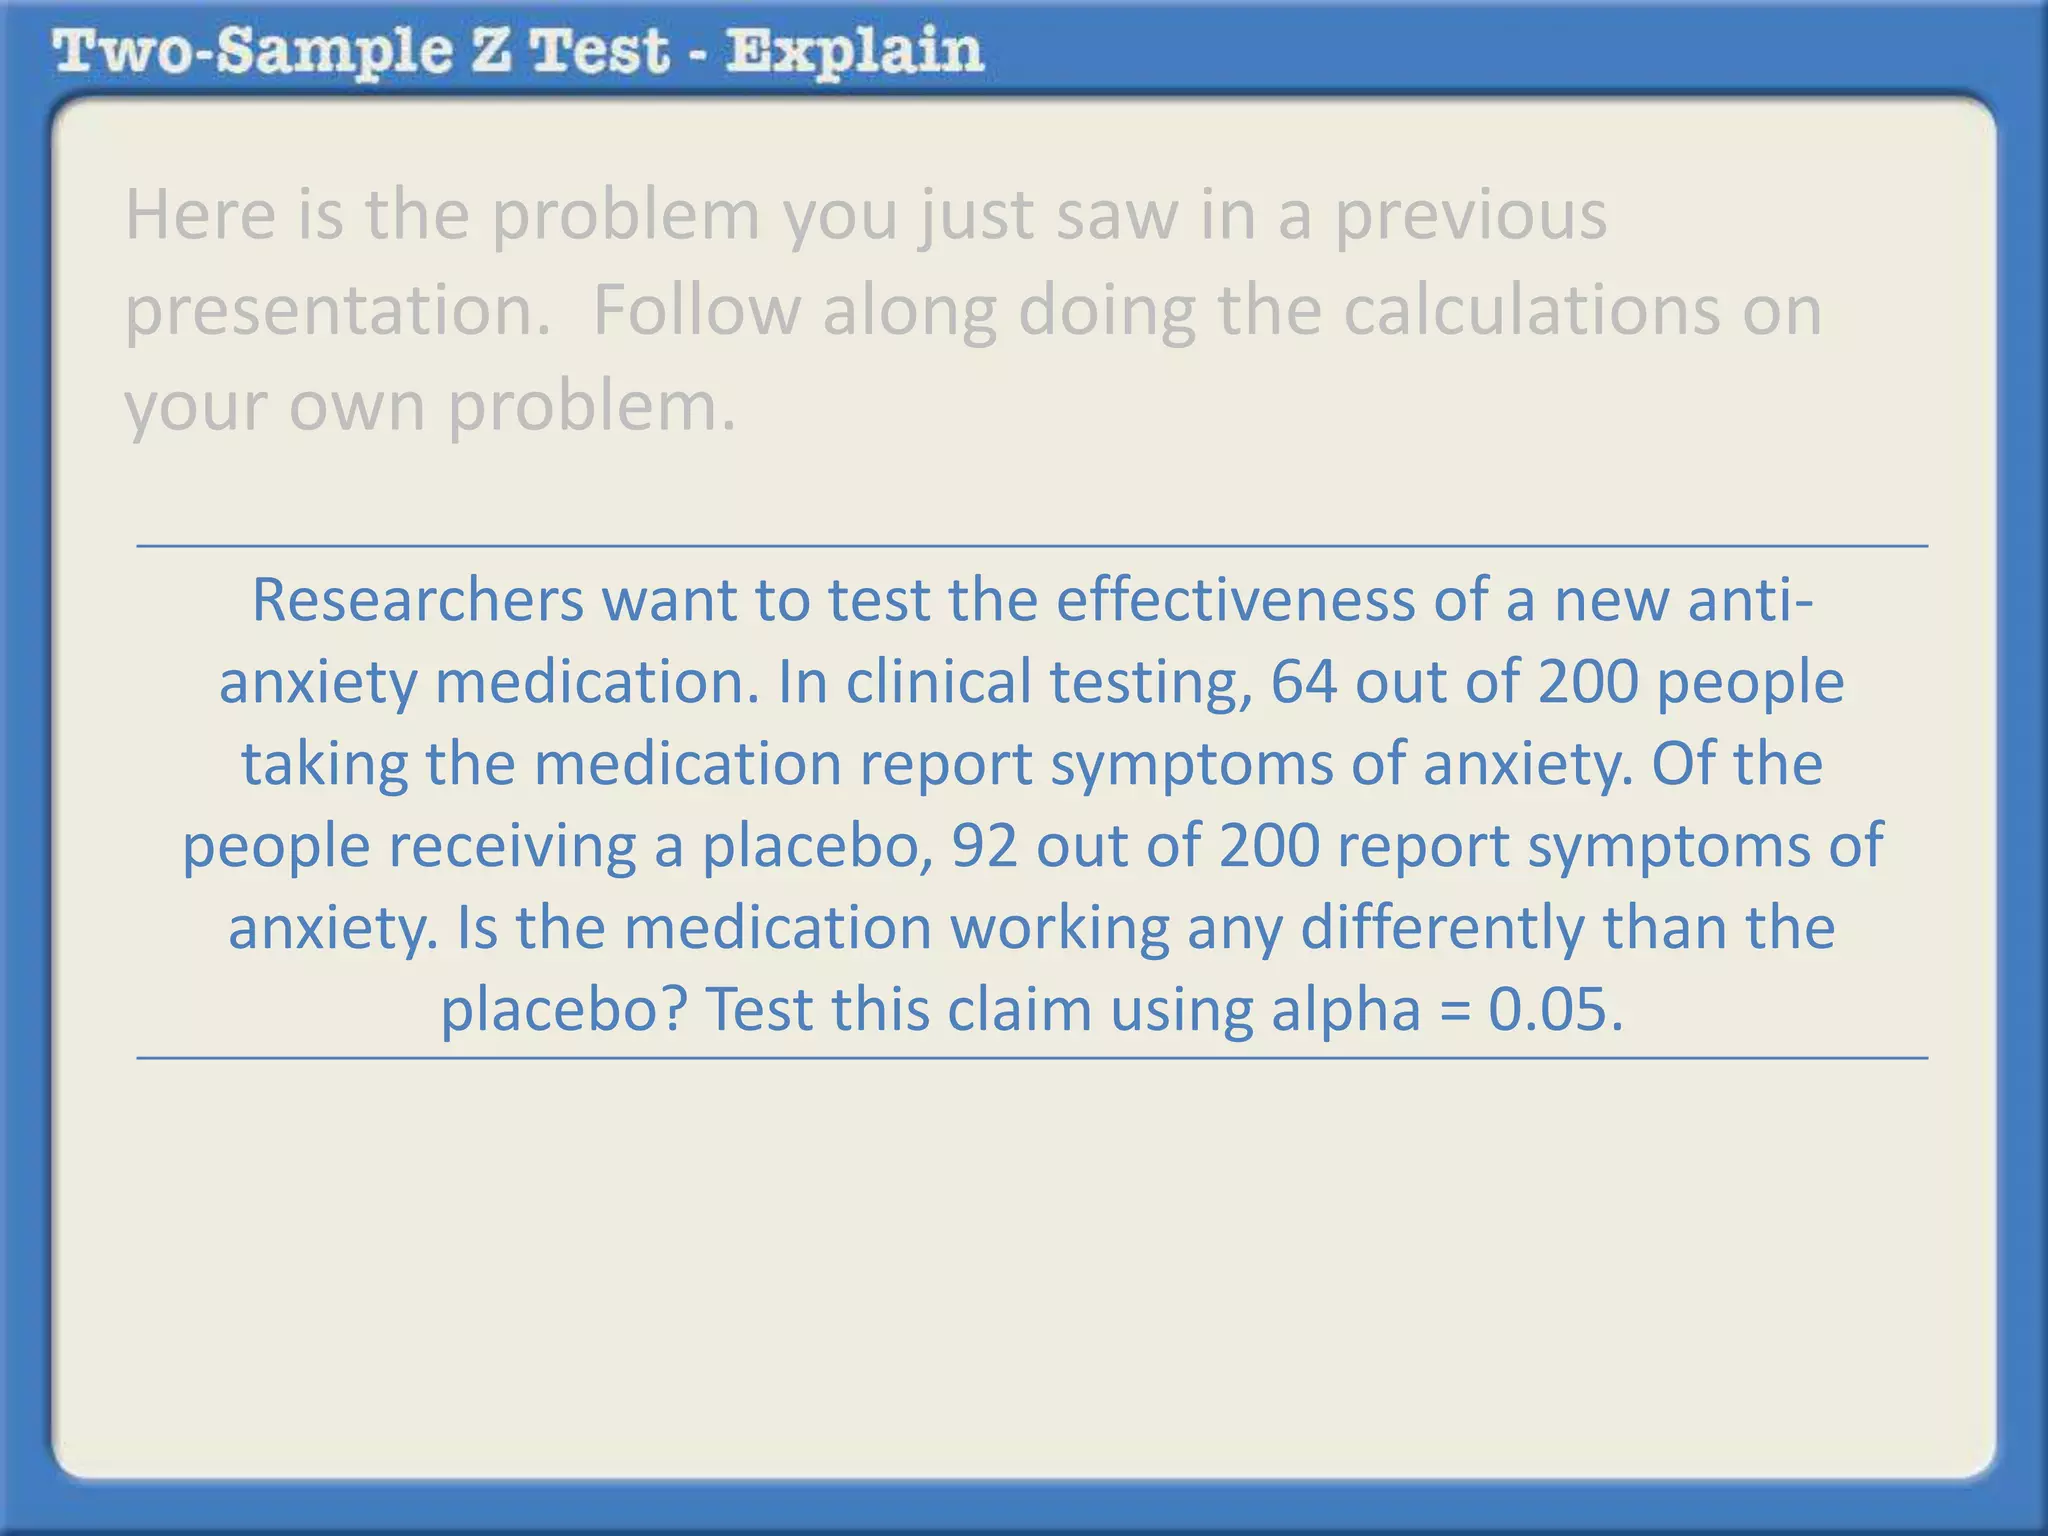
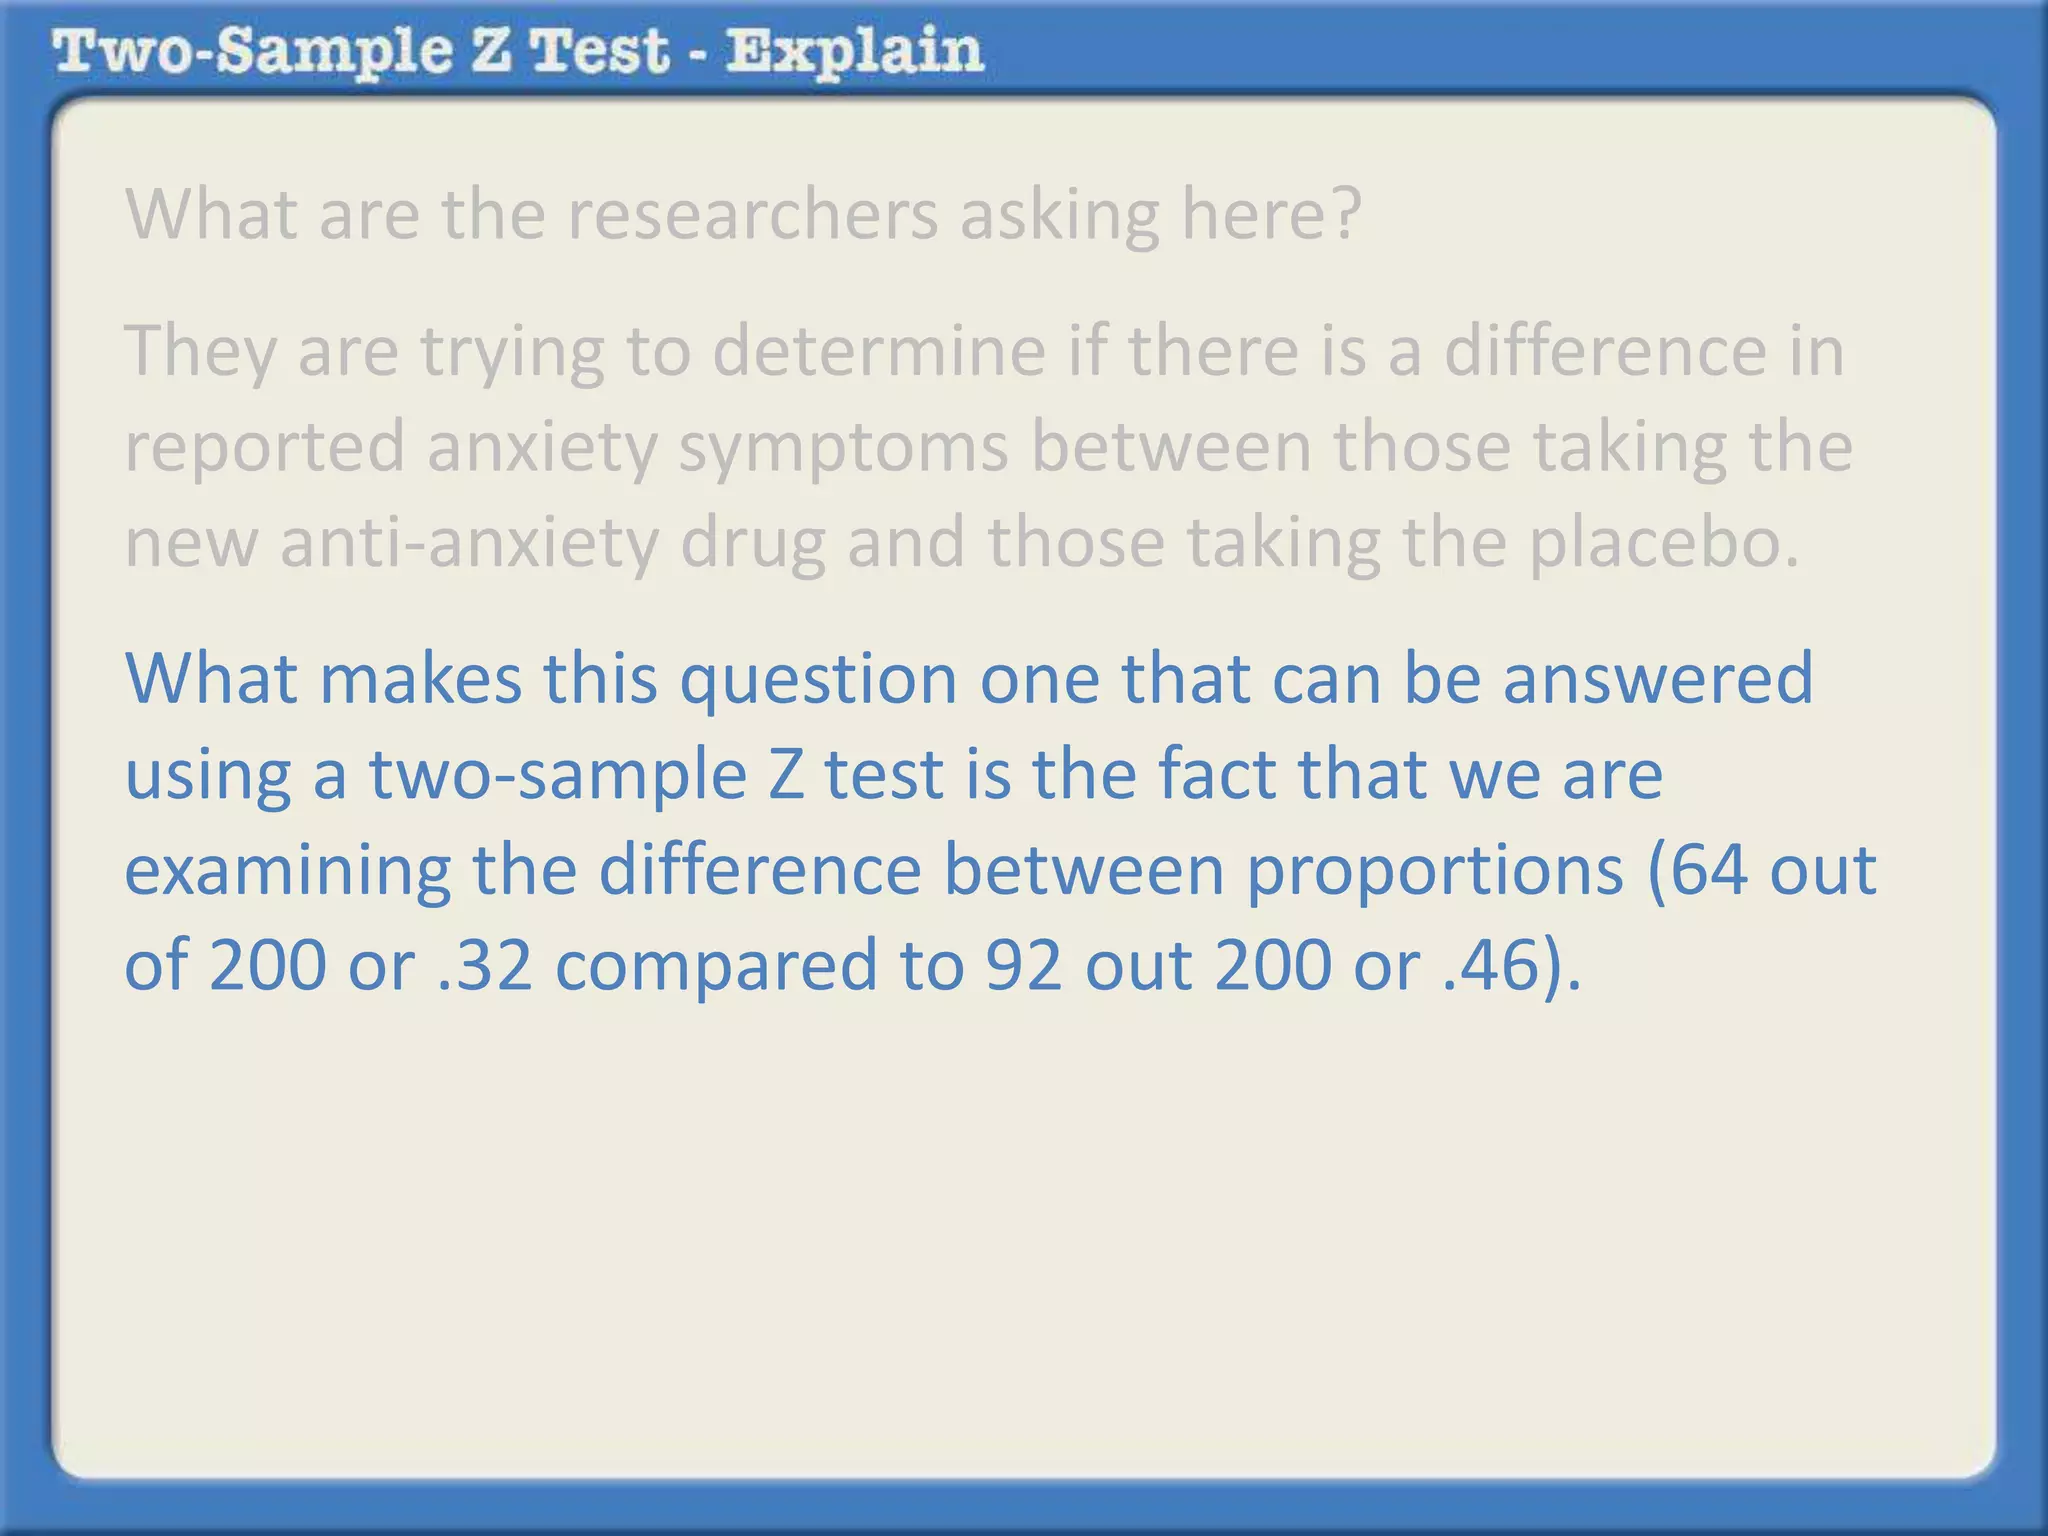
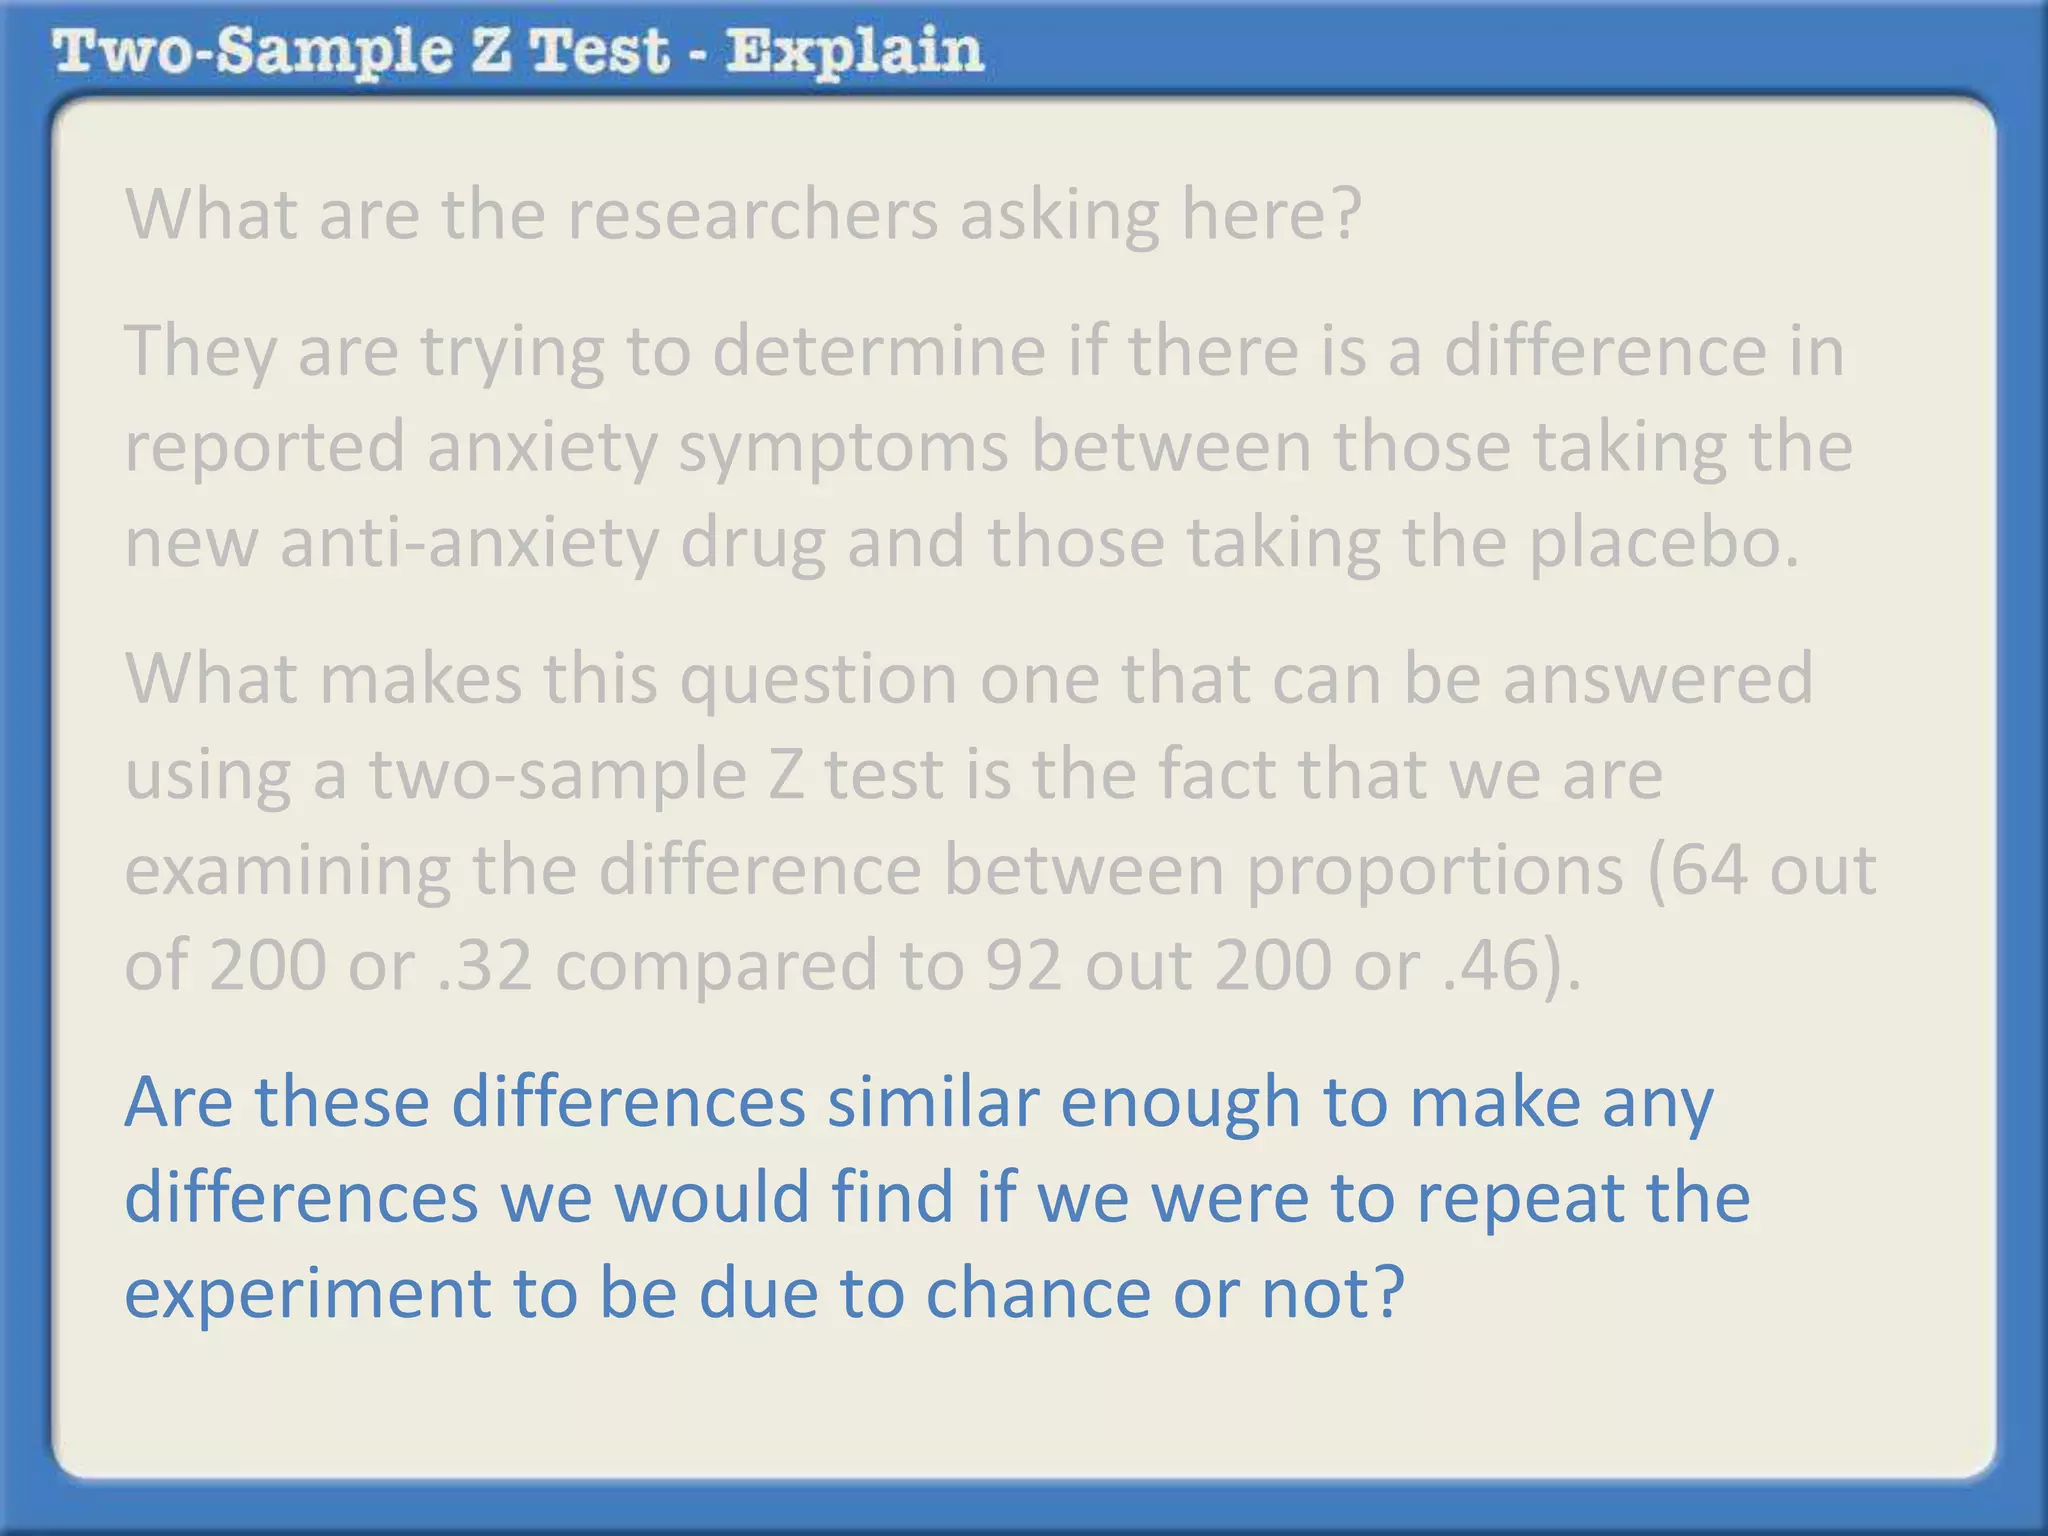
The document describes how to calculate a two-sample z-test by hand to determine if there is a statistically significant difference between the reported anxiety symptoms of patients taking a new anti-anxiety medication versus a placebo. It provides the formula for the z-statistic and walks through calculating it step-by-step for a sample problem where 64 out of 200 patients taking the medication reported anxiety symptoms compared to 92 out of 200 patients taking the placebo. The calculated z-statistic is then compared to critical values to determine whether to reject or fail to reject the null hypothesis that there is no difference between the groups.