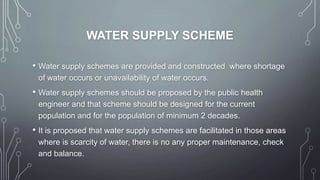
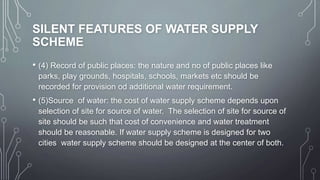
ENVIRONMENTAL
ENGINEERING
WATER SUPPLY SCHEME(WATER QUANTITY
,WATER DEMANDS, AND VARIATION IN WATER
DEMANDS.)
BY. M.Z.J
WATER SUPPLY SCHEME
• Water supply schemes are provided and constructed where shortage
of water occurs or unavailability of water occurs.
• Water supply schemes should be proposed by the public health
engineer and that scheme should be designed for the current
population and for the population of minimum 2 decades.
• It is proposed that water supply schemes are facilitated in those areas
where is scarcity of water, there is no any proper maintenance, check
and balance.
SILENT FEATURES OF WATER SUPPLY
SCHEME
• (1)Population forecast: Water supply schemes should be designed to serve
satisfactory at least population of 3 decades.
• (2)Assessment of water demand: depending upon the population the total
water requirements should be estimated for a town or city including
domestic, public, industrial etc demands.
• (3)Record of industry: the nature and no of industries in a town should be
recorded because industries require much water for running and
maintenance . This record should be updated from time to time.
SILENT FEATURES OF WATER SUPPLY
SCHEME
• (4) Record of public places: the nature and no of public places like
parks, play grounds, hospitals, schools, markets etc should be
recorded for provision od additional water requirement.
• (5)Source of water: the cost of water supply scheme depends upon
selection of site for source of water. The selection of site for source of
site should be such that cost of convenience and water treatment
should be reasonable. If water supply scheme is designed for two
cities water supply scheme should be designed at the center of both.
WATER QUANTITY
• When designing the water supply project for a town or city, it is
essential to determine the detailed quantity of a water required for
various purposes by the city.
• But as there are so many aspects involved in demand of water, it is
impossible to precisely figure out the actual demand.
• Certain empirical formula and thumb rules are used in determining the
water demand, which is very near to the real demand.
WATER QUANTITY ESTIMATION
• The quantity of water required for municipal uses for which the water
supply scheme has to be designed requires following data:
• Water consumption rate (Per Capita Demand in litres per day per
head)
• Population to be served.
• Quantity= Per capita demand x Population
TYPES OF WATER DEMANDS
• . Domestic water demand
• The amount of water necessary in the residences for drinking, bathing,
cooking, washing etc is known as domestic water demand and
primarily depends on the habits, social status, weather and traditions of the
people.
• Under normal conditions, the domestic consumption of water is about
135 litres/day/capita.
• But in developed countries this figure may be 325 340 litres/day/capita
because of use of air coolers, air conditioners, maintenance of lawns,
automatic household appliances.
• Industrial water demand
• The water needed in the industries mostly relies on the kind of
industries that are established within the town. The water needed by
various industries like paper mills, Cloth mills, Cotton mills, Breweries,
Sugar refineries etc. comes under industrial use. About 50 l/c/d or 20
– 25% of total water demand is normally considered as industrial
water demand.
• Institutional and commercial water demand
• This type of water demand includes the water requirement for the
public buildings other than residences.
• Commercial buildings, Malls, Colleges, Hotels, Bus depots and other
similar public buildings comes within this category. Commercial
demand 20l/c/d
• Public use water demand
• Volume of water necessary for public utility needs like for washing and
sprinkling on roads, cleaning of sewers, watering of public
parks, gardens, public fountains etc comes under public demand.
• Usually Public demand 20 l/c/d or 5 % of total water demand for city
is considered for public use while designing water supply scheme.
• Fire water demand
• Water requirement for firefighting purpose fall under this head. The volume
of water necessary for fire fighting is usually computed by making use of
various empirical formula. For water demand kuichings formula provides
acceptable results.
• Q = 3182 Sqroot (p)
• where,
• Q = volume of water required in Lits / Hour
• p = population of city in thousands
• Wastage and Losses
• There are always losses and wastage occurs in pipeline while water
distribution. The main reasons for this are listed below
• Damage pipe line and or faulty accessories like valves, fittings etc.
• Water tabs kept open in public or residences causing water wastage
• Due to illegal and unauthorized connections
• While calculating the total amount of water of a town; allowance of 50
l/c/d 270 l/c/d or 12- 15% of total quantity of water is designed to make
up for losses, thefts and wastage of water.
FACTORS AFFECTING PER CAPITA
DEMAND:
• Size of the city: Per capita demand for big cities is generally large as
compared to that for smaller towns as big cities have severed houses.
• Presence of industries.
• Climatic conditions: water usage is more in summer less in winter.
• Pressure in the distribution system.
• Efficiency of water works administration: Leaks in water mains and
services; and unauthorized use of water can be kept to a minimum by
surveys.
• Cost of water.as cost will increase wastage will decrease, because
people will avoid to waste water in their interest in order to minimize
FLUCTUATIONS IN RATE OF DEMAND
• Average Daily Per Capita Demand
= Quantity Required in 12 Months/ (365 x Population)
• If this average demand is supplied at all the times, it will not be
sufficient to meet the fluctuations.
• Seasonal variation: The demand peaks during summer. Firebreak
outs are generally more in summer, increasing demand. So, there is
seasonal variation .
• Daily variation depends on the activity. People draw out more water
on Sundays and Festival days, thus increasing demand on these
days.
• Hourly variations are very important as they have a wide range. During
active household working hours i.e. from six to ten in the morning and
four to eight in the evening, the bulk of the daily requirement is taken.
During other hours the requirement is negligible. Moreover, if a fire
breaks out, a huge quantity of water is required to be supplied during
short duration, necessitating the need for a maximum rate of hourly
supply.
• As the population decreases, the fluctuation rate increases.
• Maximum daily demand = 1.8 x average daily demand.
• Peak demand=1.5 x average daily demand.
•

water quality, water demands

  • 1.
    ENVIRONMENTAL ENGINEERING WATER SUPPLY SCHEME(WATERQUANTITY ,WATER DEMANDS, AND VARIATION IN WATER DEMANDS.) BY. M.Z.J
  • 2.
    WATER SUPPLY SCHEME •Water supply schemes are provided and constructed where shortage of water occurs or unavailability of water occurs. • Water supply schemes should be proposed by the public health engineer and that scheme should be designed for the current population and for the population of minimum 2 decades. • It is proposed that water supply schemes are facilitated in those areas where is scarcity of water, there is no any proper maintenance, check and balance.
  • 3.
    SILENT FEATURES OFWATER SUPPLY SCHEME • (1)Population forecast: Water supply schemes should be designed to serve satisfactory at least population of 3 decades. • (2)Assessment of water demand: depending upon the population the total water requirements should be estimated for a town or city including domestic, public, industrial etc demands. • (3)Record of industry: the nature and no of industries in a town should be recorded because industries require much water for running and maintenance . This record should be updated from time to time.
  • 4.
    SILENT FEATURES OFWATER SUPPLY SCHEME • (4) Record of public places: the nature and no of public places like parks, play grounds, hospitals, schools, markets etc should be recorded for provision od additional water requirement. • (5)Source of water: the cost of water supply scheme depends upon selection of site for source of water. The selection of site for source of site should be such that cost of convenience and water treatment should be reasonable. If water supply scheme is designed for two cities water supply scheme should be designed at the center of both.
  • 5.
    WATER QUANTITY • Whendesigning the water supply project for a town or city, it is essential to determine the detailed quantity of a water required for various purposes by the city. • But as there are so many aspects involved in demand of water, it is impossible to precisely figure out the actual demand. • Certain empirical formula and thumb rules are used in determining the water demand, which is very near to the real demand.
  • 6.
    WATER QUANTITY ESTIMATION •The quantity of water required for municipal uses for which the water supply scheme has to be designed requires following data: • Water consumption rate (Per Capita Demand in litres per day per head) • Population to be served. • Quantity= Per capita demand x Population
  • 7.
    TYPES OF WATERDEMANDS • . Domestic water demand • The amount of water necessary in the residences for drinking, bathing, cooking, washing etc is known as domestic water demand and primarily depends on the habits, social status, weather and traditions of the people. • Under normal conditions, the domestic consumption of water is about 135 litres/day/capita. • But in developed countries this figure may be 325 340 litres/day/capita because of use of air coolers, air conditioners, maintenance of lawns, automatic household appliances.
  • 8.
    • Industrial waterdemand • The water needed in the industries mostly relies on the kind of industries that are established within the town. The water needed by various industries like paper mills, Cloth mills, Cotton mills, Breweries, Sugar refineries etc. comes under industrial use. About 50 l/c/d or 20 – 25% of total water demand is normally considered as industrial water demand.
  • 9.
    • Institutional andcommercial water demand • This type of water demand includes the water requirement for the public buildings other than residences. • Commercial buildings, Malls, Colleges, Hotels, Bus depots and other similar public buildings comes within this category. Commercial demand 20l/c/d
  • 10.
    • Public usewater demand • Volume of water necessary for public utility needs like for washing and sprinkling on roads, cleaning of sewers, watering of public parks, gardens, public fountains etc comes under public demand. • Usually Public demand 20 l/c/d or 5 % of total water demand for city is considered for public use while designing water supply scheme.
  • 11.
    • Fire waterdemand • Water requirement for firefighting purpose fall under this head. The volume of water necessary for fire fighting is usually computed by making use of various empirical formula. For water demand kuichings formula provides acceptable results. • Q = 3182 Sqroot (p) • where, • Q = volume of water required in Lits / Hour • p = population of city in thousands
  • 12.
    • Wastage andLosses • There are always losses and wastage occurs in pipeline while water distribution. The main reasons for this are listed below • Damage pipe line and or faulty accessories like valves, fittings etc. • Water tabs kept open in public or residences causing water wastage • Due to illegal and unauthorized connections • While calculating the total amount of water of a town; allowance of 50 l/c/d 270 l/c/d or 12- 15% of total quantity of water is designed to make up for losses, thefts and wastage of water.
  • 13.
    FACTORS AFFECTING PERCAPITA DEMAND: • Size of the city: Per capita demand for big cities is generally large as compared to that for smaller towns as big cities have severed houses. • Presence of industries. • Climatic conditions: water usage is more in summer less in winter. • Pressure in the distribution system. • Efficiency of water works administration: Leaks in water mains and services; and unauthorized use of water can be kept to a minimum by surveys. • Cost of water.as cost will increase wastage will decrease, because people will avoid to waste water in their interest in order to minimize
  • 14.
    FLUCTUATIONS IN RATEOF DEMAND • Average Daily Per Capita Demand = Quantity Required in 12 Months/ (365 x Population) • If this average demand is supplied at all the times, it will not be sufficient to meet the fluctuations. • Seasonal variation: The demand peaks during summer. Firebreak outs are generally more in summer, increasing demand. So, there is seasonal variation . • Daily variation depends on the activity. People draw out more water on Sundays and Festival days, thus increasing demand on these days.
  • 15.
    • Hourly variationsare very important as they have a wide range. During active household working hours i.e. from six to ten in the morning and four to eight in the evening, the bulk of the daily requirement is taken. During other hours the requirement is negligible. Moreover, if a fire breaks out, a huge quantity of water is required to be supplied during short duration, necessitating the need for a maximum rate of hourly supply. • As the population decreases, the fluctuation rate increases. • Maximum daily demand = 1.8 x average daily demand. • Peak demand=1.5 x average daily demand. •