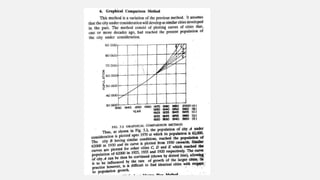
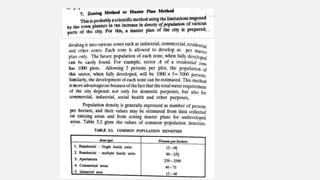
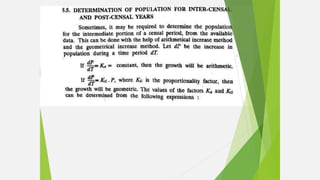
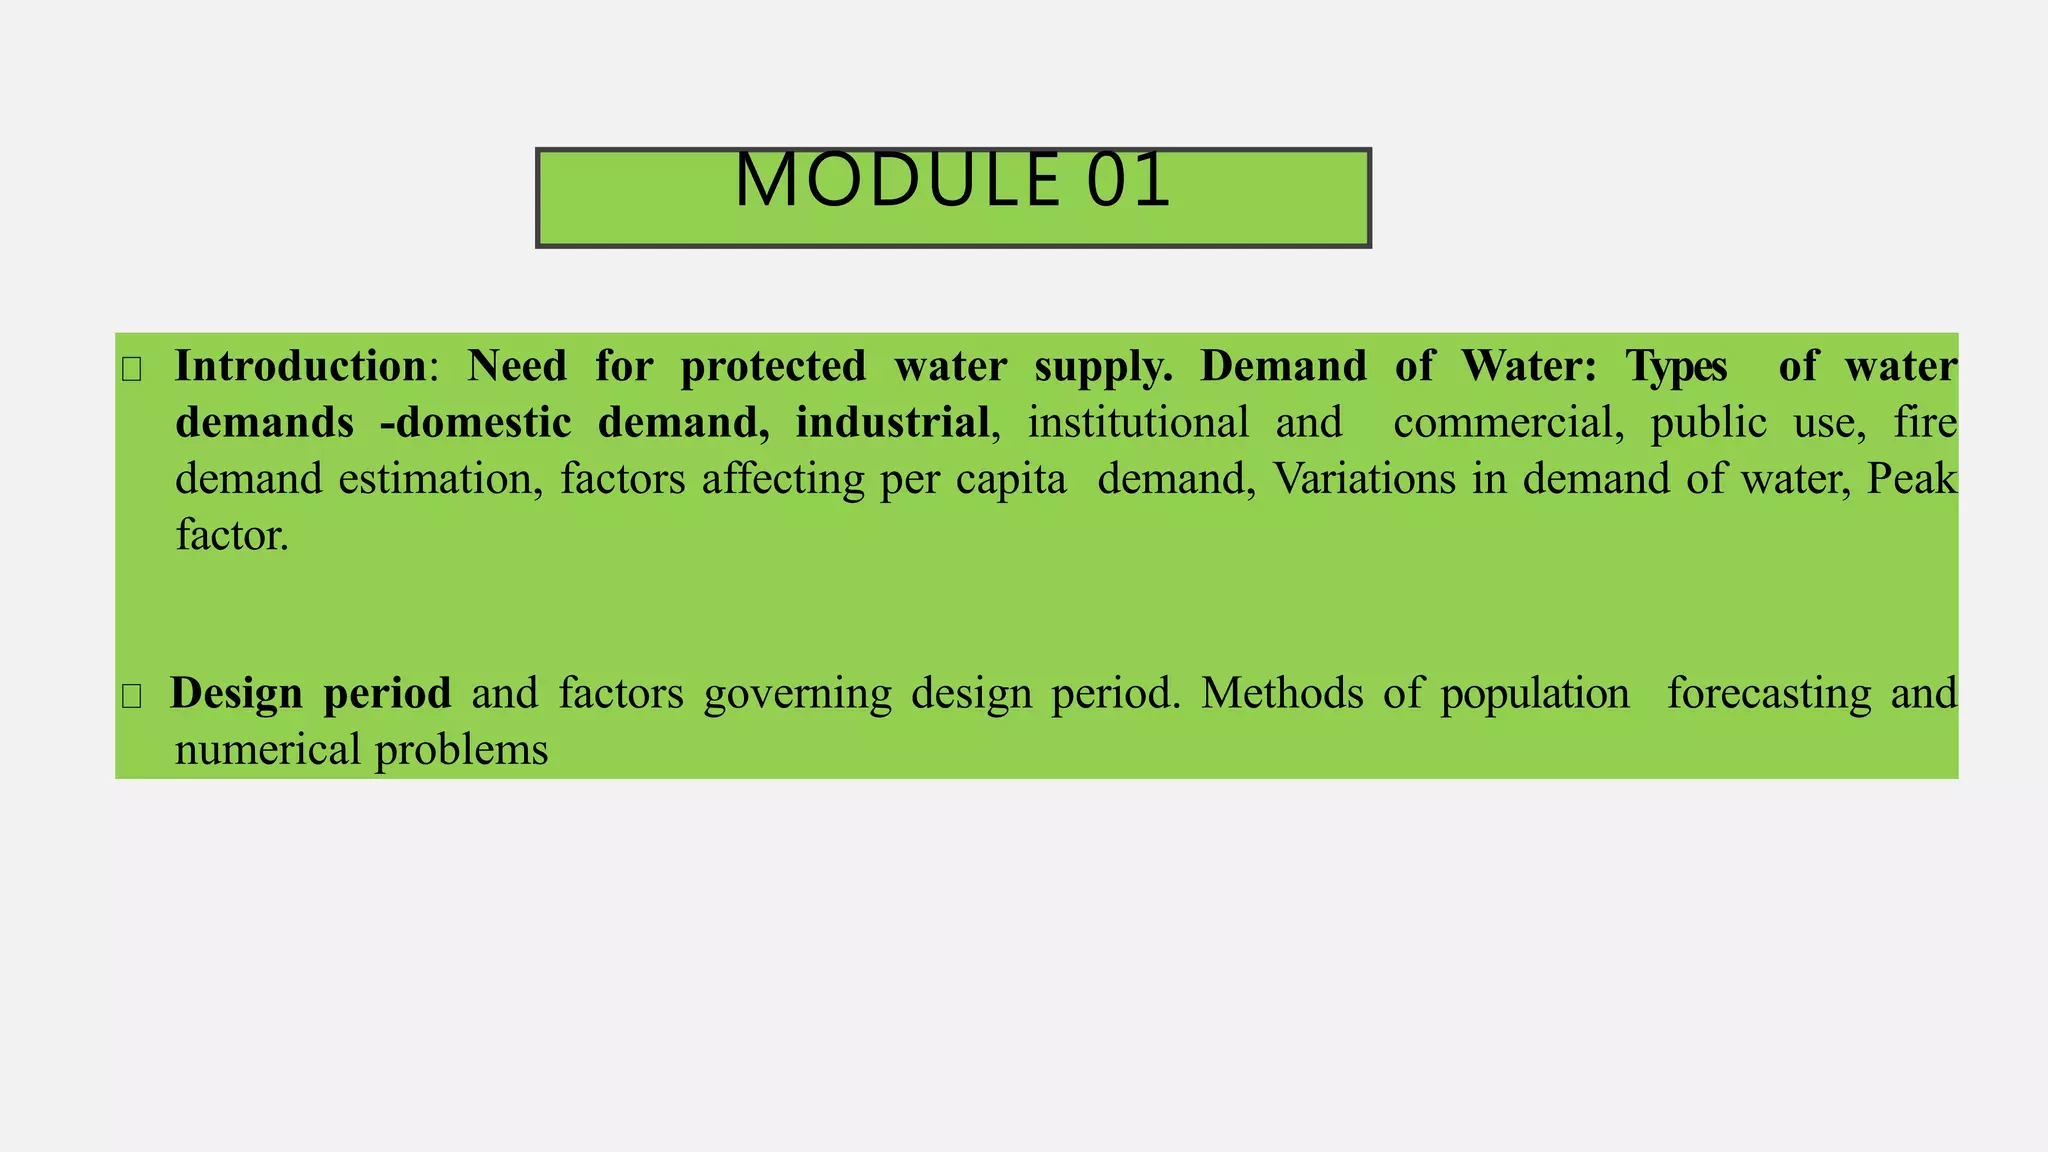
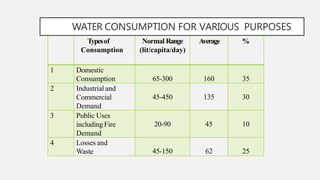
1. The document discusses the need for protected water supply and outlines the various types of water demands that must be considered, including domestic, industrial, institutional, public use, and fire demands.
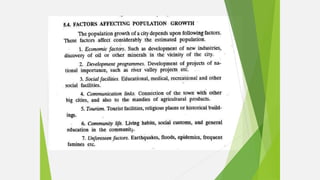
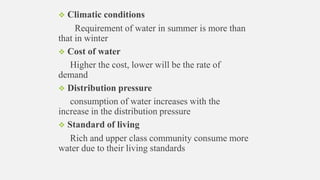
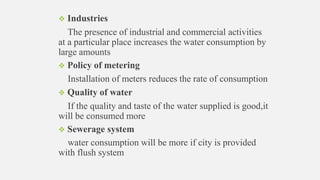
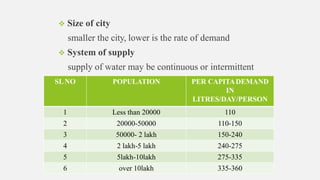
2. Key factors that affect per capita water demand are discussed, such as climate, cost of water, distribution pressure, standard of living, presence of industries, and the sewerage system.
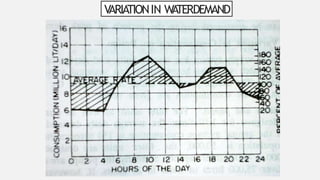
3. There are wide variations in water demand by season, month, day, and hour that must be accounted for in water supply system design through consideration of peak versus average demand.


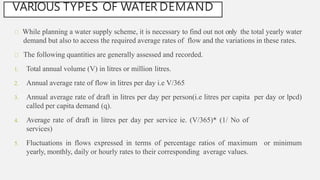
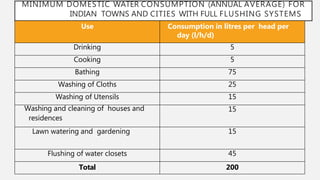


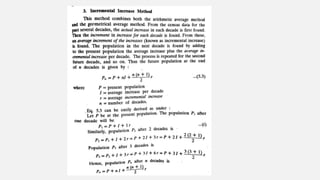
![ARITHMETIC INCREASE METHOD
This method is based on the assumption that the
population is increasing at a constant rate.
The rate of change of population with time is constant.
The population after ‘n’ decades can be determined by
the formula
Pn =[P+n. ¯x] where
Pn - Forecasted population after ‘n’ decades from the
present
Po -Population at present
n - No. of decades
x –Average of population increase in the known decades](https://image.slidesharecdn.com/wst-210621121602/85/Water-resource-treatment-46-320.jpg)
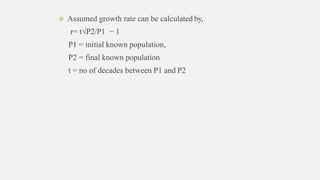
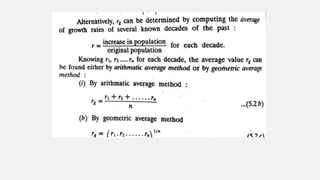
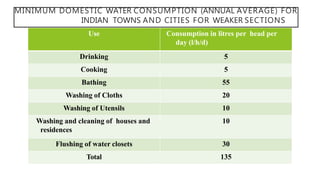
![GEOMETRIC INCREASE METHOD
This method is based on the assumption that the
percentage increase in population from decade
to decade remains constant.
In this method the average percentage of growth of
last few decades is determined.
The population at the end of ‘n’ decades is
calculated by- Pn = PO [1 +r/100]where
Po - initial population
Pn -future population
r - assumed growth rate](https://image.slidesharecdn.com/wst-210621121602/85/Water-resource-treatment-48-320.jpg)