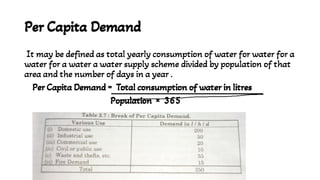
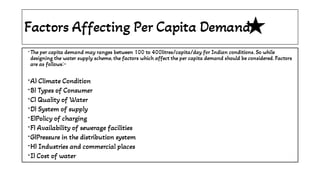
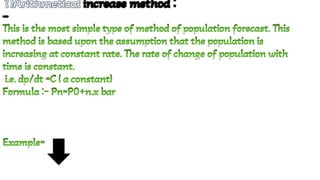
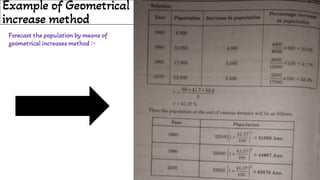
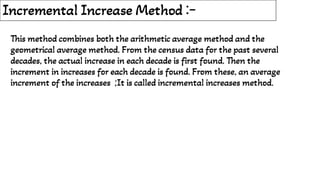
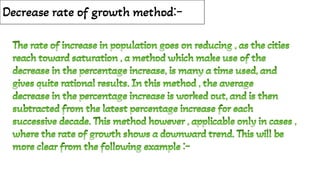
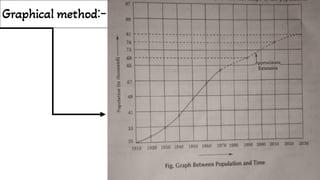
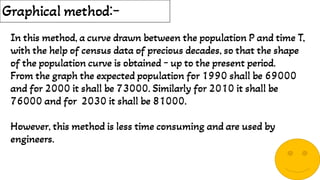
Chapter-2
Quantity of water
MADE BY RAKSHIT
MADE BY RAKSHIT
QUANTITY OF WATER REQUIRED
QUANTITY OF WATER REQUIRED -
It is essential to determine the total quantity of water required for van
purposes by the city or town while designing the water supply scheme
of particular city or town. This total quantity of water determined,
enables determine the size and capacity of all the constituents of the
water supply scheme.
•The quantity of water required depends upon the two important
factors. These factors are -
•The quantity of water required depends upon the two important
factors. These factors are -
(1) The probable population estimated at the end of the design period.
(2) rate of water consumed per capita per day.
VARIOUS TYPES OF DEMANDS
• VARIOUS TYPES OF DEMANDS - It is very difficult to assess the
quantity of water demanded by the public, since there are many
factors affecting water consumption. Certain thumb rules and
empirical formulas are, therefore, generally used to assess this
quantity, which may give fairly accurate results. The use of a
particular method or a formula for a particular case has, therefore, to
be decided by the intelligence and foresightedness of the designer. The
various types of water demands, may be broken down into the
following groups:
It is very difficult to assess the
quantity of water demanded by the public, since there are many
factors affecting water consumption. Certain thumb rules and
empirical formulas are, therefore, generally used to assess this
quantity, which may give fairly accurate results. The use of a
particular method or a formula for a particular case has, therefore, to
be decided by the intelligence and foresightedness of the designer. The
various types of water demands, may be broken down into the
following groups:
VARIOUS TYPES OF WATER DEMANDS
(1) Domestic water demand
(2) Institution and commercial water demand
(3) Industrial water demand
(4) Fire demand
(5) Public use demand
(6) Water required to compensate losses in waste and thefts.
So let discuss
Domestic Water Demand - This includes the water required in private
building for cooking, washing. Bathing, gardening, sanitary purposes
etc. The domestic water demand depends upon the living conditions of
the consumer. As per IS: 1172-1963 water required for domestic
purposes for average Indian conditions per head per day may be taken
as 135 litre. Table 2.1 shows the details of water requirement for
domestic purposes. The total domestic water consumption may amount
to 50 to 60% of the total water consumption.
Minimum Domestic Water Consumption (Annual
Average) in Small Indian Towns and Cities
Different use Consumption in l/h/d
Drinking 5
Cooking 5
Bathing 55
Washing of clothes 20
Washing of utensils 10
Washing and cleaning of house 10
Flushing of water closets,etc. 30
Total 135
Institution and Commercial Water Demand:
-
Institution and Commercial Water Demand - Office buildings, stores,
hotels, ware houses, shopping centres, health centres, schools, temples,
cinema houses, bus and railway stations etc. Are include in commercial
centres and commercial buildings. The quantity of water consumed in
these buildings is known as commercial demand of water. The water
requirements of commercial and public places may be up to 50 litres /
capita / day. The water supply requirements for various public building
other than residential are given in Table 2.2 .
Industrial Water Demand :-
Industrial Water Demand - This consumption includes water used in
factories. This demand depends upon the nature of the city, number of
industries and types of industries. On an average, 20 to 25% of the
total water demand may be allowed for this type of demand in the
design. The approximate quantity of water required for some of the
manufacturing Unit are shown in table.
Fire Demand :-
It is the quantity of water required for fighting a fire outbreak. For
high value cities , water requirement for this purpose is particularly
essential.
For Indian conditions a moderate allowance of one litre per head per
day for fire demand may be quite sufficient.
Public Use Demand :-
Public Use Demand - This demand of water includes quantity of
water required for public utility purposes such as washing and
sprinkling on roads, cleaning of sewers, flushing of streets, water for
public parks, gardens etc. A provision of about 10% of the total
consumption is made while designing the water works for a city, to
meet the water demand public use.
The public-use demand of water for public purposes shall be taken as
given in table 1 and the water requirements for Live Stock is given in
table 2 below. Consumption of water for irrigation purposes in cities is
given in Table 3.
TABLE 1
TABLE 2
TABLE 3
Water Required to Compensate Losses in
Waste and Thefts
The following are the reasons under this head:
(a) Stolen water due to unauthorised water connections.
(b) Bad plumbing that results leakage from joints and fittings.
(c) Damaged meters etc.
(d) Leaving public water taps open.
Per Capita Demand
It may be defined as total yearly consumption of water for water for a
water for a water a water supply scheme divided by population of that
area and the number of days in a year .
Per Capita Demand = Total consumption of water in litres
Population × 365
Factors Affecting Per Capita Demand
•
•
•
•
•
•
•
•
•
•
The per capita demand may ranges between 100 to 400litres/capita/day for Indian conditions. So while
designing the water supply scheme, the factors which affect the per capita demand should be considered. Factors
are as follows:-
A) Climate Condition
B) Types of Consumer
C) Quality of Water
D) System of supply
E)Policy of charging
F) Availability of sewerage facilities
G)Pressure in the distribution system
H) Industries and commercial places
I) Cost of water
a) Climatic Condition :-
In hot condition the consumption of water is generally more because
everybody takes bath twice or thrice and washes clothes .More water is used
for drinking and also more water is consumed in running coolers etc. Hence ,
water consumption is much more in summer than that in winter.
In hot condition the consumption of water is generally more because
everybody takes bath twice or thrice and washes clothes .More water is used
for drinking and also more water is consumed in running coolers etc. Hence ,
water consumption is much more in summer than that in winter.
In hot condition the consumption of water is generally more because
everybody takes bath twice or thrice and washes clothes .More water is used
for drinking and also more water is consumed in running coolers etc. Hence ,
water consumption is much more in summer than that in winter.
In hot condition the consumption of water is generally more because
everybody takes bath twice or thrice and washes clothes .More water is used
for drinking and also more water is consumed in running coolers etc. Hence ,
water consumption is much more in summer than that in winter.
In hot condition the consumption of water is generally more because
everybody takes bath twice or thrice and washes clothes .More water is used
for drinking and also more water is consumed in running coolers etc. Hence ,
water consumption is much more in summer than that in winter.
b) Types of Consumer
b) Types of Consumer :-
b) Types of Consumer
Per capita consumption ore demand of water is also affected by the
class or category of the consumer and their standard of living.
Greater quantity of water is consumed by the people having higher
economic status and higher standard and highly standards of
living in comparison of middle class and lower class communities.
C) Quality of water :-
• If the quality of supplied water is good then the consumption of
water is more and if quality of water is poor then the consumption of
water will be lesser.
d) System of supply :-
֍
֍
֍Consumption of water will be lesser in intermittent water supply
system and more in continuous water supply system.
֍
e)Sewerage facilities :-
•
•
•
If there is sewerage facility then consumption of water increases.
Because in sewerage system more water is required to dispose off
waste in comparison of old conservation system.
If there is sewerage facility then consumption of water increases.
Because in sewerage system more water is required to dispose off
waste in comparison of old conservation system.
If there is sewerage facility then consumption of water increases.
Because in sewerage system more water is required to dispose off
waste in comparison of old conservation system.
If there is sewerage facility then consumption of water increases.
Because in sewerage system more water is required to dispose off
waste in comparison of old conservation system.
f) Policy of charging :-
If the water meters are used for calculation of water
consumption and charged according to consumption then the
consumption of water decreases. On the other hand if the
charges are fixed type then the consumption of water increases.
If the water meters are used for calculation of water
consumption and charged according to consumption then the
consumption of water decreases. On the other hand if the
charges are fixed type then the consumption of water increases.
If the water meters are used for calculation of water
consumption and charged according to consumption then the
consumption of water decreases. On the other hand if the
charges are fixed type then the consumption of water increases.
If the water meters are used for calculation of water
consumption and charged according to consumption then the
consumption of water decreases. On the other hand if the
charges are fixed type then the consumption of water increases.
If the water meters are used for calculation of water
consumption and charged according to consumption then the
consumption of water decreases. On the other hand if the
charges are fixed type then the consumption of water increases.
g)Industrial and commercial places:-
• If industrial and commercial are in large quantity in an area then more
water is required. For that area which results on increases in per capita
demand. Some industries need huge quantity of water.
If industrial and commercial are in large quantity in an area then more
water is required. For that area which results on increases in per capita
demand. Some industries need huge quantity of water.
h)Pressure in the distribution system:-
If the pressure is high in the distribution system then in that case water
will be available at great height and also the losses due to leakage are
considerably increases.
If the pressure is high in the distribution system then in that case water
will be available at great height and also the losses due to leakage are
considerably increases.
Design Period :-
The future period or the number of years for
which the water works are designed, is known as design period .
The future period or the number of years for
which the water works are designed, is known as design period .
The future period or the number of years for
which the water works are designed, is known as design period .
Variation in the rate of demand :-
Therefore, variation of
demand can be mainly classified into following categories:-
Therefore, variation of
demand can be mainly classified into following categories:-
Therefore, variation of
demand can be mainly classified into following categories:-
1) Seasonal variation
2) Weekly variation
2) Weekly variation
3) Daily variation
3) Daily variation
4) Hour variation
4) Hour variation
•
•
•
variation :- seasonal variation occur due to the large use
of water in summer season, lesser use in winter , and much less in
rainy season .
variation :- seasonal variation occur due to the large use
of water in summer season, lesser use in winter , and much less in
rainy season .
variation :- seasonal variation occur due to the large use
of water in summer season, lesser use in winter , and much less in
rainy season .
variation :- seasonal variation occur due to the large use
of water in summer season, lesser use in winter , and much less in
rainy season .
1)Seasonal variation :- seasonal variation occur due to the large use
of water in summer season, lesser use in winter , and much less in
rainy season .
2)Weekly variation :- If the weekly consumption is recorded then it
will be noted that even in one season , there are variations in the
consumption of water for every week.
2)Weekly variation :- If the weekly consumption is recorded then it
will be noted that even in one season , there are variations in the
consumption of water for every week.
2)Weekly variation :- If the weekly consumption is recorded then it
will be noted that even in one season , there are variations in the
consumption of water for every week.
2)Weekly variation :- If the weekly consumption is recorded then it
will be noted that even in one season , there are variations in the
consumption of water for every week.
2)Weekly variation :- If the weekly consumption is recorded then it
will be noted that even in one season , there are variations in the
consumption of water for every week.
3)Daily variation :- These variations depend on the general habits of
people ,climatic conditions and character of the city as industrial ,
commercial or residential
3)Daily variation :- These variations depend on the general habits of
people ,climatic conditions and character of the city as industrial ,
commercial or residential
3)Daily variation :- These variations depend on the general habits of
people ,climatic conditions and character of the city as industrial ,
commercial or residential
3)Daily variation :- These variations depend on the general habits of
people ,climatic conditions and character of the city as industrial ,
commercial or residential
3)Daily variation :- These variations depend on the general habits of
people ,climatic conditions and character of the city as industrial ,
commercial or residential
•
•
•
•
•
•
•
POPULATION FORECASTING :-
After selecting the design period and per capita, the next step is to determine the
population for the prescribed design period. The present population and past population
may be obtained from the records . The population goes on increasing year by births,
decreased by deaths , increased or decreased by migration and increased or decreased
due to any other reason . The population is affected by all the four above factors . The
future prediction of population depends upon these .
Methods of population forecasting :-
1)Arithmetical increase method.
2)Geometrical increase method.
3)Incremental increase method.
4)Decrease rate of growth method.
5)Graphical extension method.
1)Arithmetical increase method :
-
1)Arithmetical increase method :
-
1)Arithmetical increase method :
-
1)Arithmetical increase method :
-
1)Arithmetical increase method :
-
1)Arithmetical increase method :
-
1)Arithmetical increase method :
-
1)Arithmetical increase method :
-
This is the most simple type of method of population forecast. This
method is based upon the assumption that the population is
increasing at constant rate. The rate of change of population with
time is constant.
This is the most simple type of method of population forecast. This
method is based upon the assumption that the population is
increasing at constant rate. The rate of change of population with
time is constant.
i.e. dp/dt =C ( a constant)
Formula :- Pn=P0+n.x bar
Example=
Example=
Geometrical Increase Method :-
This method is based on the assumption that the % increase in
the population from decade to decade or for a constant
interval of time remains constant .
Example of Geometrical
increase method
Forecast the population by means of
geometrical increases method :-
Incremental Increase Method :-
This method combines both the arithmetic average method and the
geometrical average method. From the census data for the past several
decades, the actual increase in each decade is first found. Then the
increment in increases for each decade is found. From these, an average
increment of the increases ;It is called incremental increases method.
Example:-
Calculate the population for the decade
1980,1990 and 2000 by incremental
increases method when the following data
is given
Decrease rate of growth method:-
The rate of increase in population goes on reducing , as the cities
reach toward saturation , a method which make use of the
decrease in the percentage increase, is many a time used, and
gives quite rational results. In this method , the average
decrease in the percentage increase is worked out, and is then
subtracted from the latest percentage increase for each
successive decade. This method however , applicable only in cases ,
where the rate of growth shows a downward trend. This will be
more clear from the following example :-
Graphical method:-
Graphical method:-
In this method, a curve drawn between the population P and time T,
with the help of census data of precious decades, so that the shape
of the population curve is obtained – up to the present period.
From the graph the expected population for 1990 shall be 69000
and for 2000 it shall be 73000. Similarly for 2010 it shall be
76000 and for 2030 it shall be 81000.
However, this method is less time consuming and are used by
engineers.

Quantity of water-1.pdf

  • 1.
    Chapter-2 Quantity of water MADEBY RAKSHIT MADE BY RAKSHIT
  • 2.
    QUANTITY OF WATERREQUIRED QUANTITY OF WATER REQUIRED - It is essential to determine the total quantity of water required for van purposes by the city or town while designing the water supply scheme of particular city or town. This total quantity of water determined, enables determine the size and capacity of all the constituents of the water supply scheme. It is essential to determine the total quantity of water required for van purposes by the city or town while designing the water supply scheme of particular city or town. This total quantity of water determined, enables determine the size and capacity of all the constituents of the water supply scheme. •The quantity of water required depends upon the two important factors. These factors are - •The quantity of water required depends upon the two important factors. These factors are - (1) The probable population estimated at the end of the design period. (1) The probable population estimated at the end of the design period. (2) rate of water consumed per capita per day. (2) rate of water consumed per capita per day.
  • 3.
    VARIOUS TYPES OFDEMANDS • VARIOUS TYPES OF DEMANDS - It is very difficult to assess the quantity of water demanded by the public, since there are many factors affecting water consumption. Certain thumb rules and empirical formulas are, therefore, generally used to assess this quantity, which may give fairly accurate results. The use of a particular method or a formula for a particular case has, therefore, to be decided by the intelligence and foresightedness of the designer. The various types of water demands, may be broken down into the following groups: It is very difficult to assess the quantity of water demanded by the public, since there are many factors affecting water consumption. Certain thumb rules and empirical formulas are, therefore, generally used to assess this quantity, which may give fairly accurate results. The use of a particular method or a formula for a particular case has, therefore, to be decided by the intelligence and foresightedness of the designer. The various types of water demands, may be broken down into the following groups:
  • 4.
    VARIOUS TYPES OFWATER DEMANDS (1) Domestic water demand (2) Institution and commercial water demand (3) Industrial water demand (4) Fire demand (5) Public use demand (6) Water required to compensate losses in waste and thefts.
  • 5.
    So let discuss DomesticWater Demand - This includes the water required in private building for cooking, washing. Bathing, gardening, sanitary purposes etc. The domestic water demand depends upon the living conditions of the consumer. As per IS: 1172-1963 water required for domestic purposes for average Indian conditions per head per day may be taken as 135 litre. Table 2.1 shows the details of water requirement for domestic purposes. The total domestic water consumption may amount to 50 to 60% of the total water consumption.
  • 6.
    Minimum Domestic WaterConsumption (Annual Average) in Small Indian Towns and Cities Different use Consumption in l/h/d Drinking 5 Cooking 5 Bathing 55 Washing of clothes 20 Washing of utensils 10 Washing and cleaning of house 10 Flushing of water closets,etc. 30 Total 135
  • 7.
    Institution and CommercialWater Demand: - Institution and Commercial Water Demand - Office buildings, stores, hotels, ware houses, shopping centres, health centres, schools, temples, cinema houses, bus and railway stations etc. Are include in commercial centres and commercial buildings. The quantity of water consumed in these buildings is known as commercial demand of water. The water requirements of commercial and public places may be up to 50 litres / capita / day. The water supply requirements for various public building other than residential are given in Table 2.2 .
  • 9.
    Industrial Water Demand:- Industrial Water Demand - This consumption includes water used in factories. This demand depends upon the nature of the city, number of industries and types of industries. On an average, 20 to 25% of the total water demand may be allowed for this type of demand in the design. The approximate quantity of water required for some of the manufacturing Unit are shown in table.
  • 10.
    Fire Demand :- Itis the quantity of water required for fighting a fire outbreak. For high value cities , water requirement for this purpose is particularly essential. For Indian conditions a moderate allowance of one litre per head per day for fire demand may be quite sufficient.
  • 11.
    Public Use Demand:- Public Use Demand - This demand of water includes quantity of water required for public utility purposes such as washing and sprinkling on roads, cleaning of sewers, flushing of streets, water for public parks, gardens etc. A provision of about 10% of the total consumption is made while designing the water works for a city, to meet the water demand public use. The public-use demand of water for public purposes shall be taken as given in table 1 and the water requirements for Live Stock is given in table 2 below. Consumption of water for irrigation purposes in cities is given in Table 3.
  • 12.
  • 13.
    Water Required toCompensate Losses in Waste and Thefts The following are the reasons under this head: (a) Stolen water due to unauthorised water connections. (b) Bad plumbing that results leakage from joints and fittings. (c) Damaged meters etc. (d) Leaving public water taps open.
  • 14.
    Per Capita Demand Itmay be defined as total yearly consumption of water for water for a water for a water a water supply scheme divided by population of that area and the number of days in a year . Per Capita Demand = Total consumption of water in litres Population × 365
  • 15.
    Factors Affecting PerCapita Demand • • • • • • • • • • The per capita demand may ranges between 100 to 400litres/capita/day for Indian conditions. So while designing the water supply scheme, the factors which affect the per capita demand should be considered. Factors are as follows:- A) Climate Condition B) Types of Consumer C) Quality of Water D) System of supply E)Policy of charging F) Availability of sewerage facilities G)Pressure in the distribution system H) Industries and commercial places I) Cost of water
  • 16.
    a) Climatic Condition:- In hot condition the consumption of water is generally more because everybody takes bath twice or thrice and washes clothes .More water is used for drinking and also more water is consumed in running coolers etc. Hence , water consumption is much more in summer than that in winter. In hot condition the consumption of water is generally more because everybody takes bath twice or thrice and washes clothes .More water is used for drinking and also more water is consumed in running coolers etc. Hence , water consumption is much more in summer than that in winter. In hot condition the consumption of water is generally more because everybody takes bath twice or thrice and washes clothes .More water is used for drinking and also more water is consumed in running coolers etc. Hence , water consumption is much more in summer than that in winter. In hot condition the consumption of water is generally more because everybody takes bath twice or thrice and washes clothes .More water is used for drinking and also more water is consumed in running coolers etc. Hence , water consumption is much more in summer than that in winter. In hot condition the consumption of water is generally more because everybody takes bath twice or thrice and washes clothes .More water is used for drinking and also more water is consumed in running coolers etc. Hence , water consumption is much more in summer than that in winter. b) Types of Consumer b) Types of Consumer b) Types of Consumer :- b) Types of Consumer Per capita consumption ore demand of water is also affected by the Per capita consumption ore demand of water is also affected by the Per capita consumption ore demand of water is also affected by the class or category of the consumer and their standard of living. Greater quantity of water is consumed by the people having higher economic status and higher standard and highly standards of living in comparison of middle class and lower class communities. Per capita consumption ore demand of water is also affected by the class or category of the consumer and their standard of living. Greater quantity of water is consumed by the people having higher economic status and higher standard and highly standards of living in comparison of middle class and lower class communities.
  • 17.
    C) Quality ofwater :- • If the quality of supplied water is good then the consumption of water is more and if quality of water is poor then the consumption of water will be lesser. d) System of supply :- ֍ ֍ ֍Consumption of water will be lesser in intermittent water supply system and more in continuous water supply system. ֍
  • 18.
    e)Sewerage facilities :- • • • Ifthere is sewerage facility then consumption of water increases. Because in sewerage system more water is required to dispose off waste in comparison of old conservation system. If there is sewerage facility then consumption of water increases. Because in sewerage system more water is required to dispose off waste in comparison of old conservation system. If there is sewerage facility then consumption of water increases. Because in sewerage system more water is required to dispose off waste in comparison of old conservation system. If there is sewerage facility then consumption of water increases. Because in sewerage system more water is required to dispose off waste in comparison of old conservation system. f) Policy of charging :- f) Policy of charging :- f) Policy of charging :- f) Policy of charging :- If the water meters are used for calculation of water consumption and charged according to consumption then the consumption of water decreases. On the other hand if the charges are fixed type then the consumption of water increases. If the water meters are used for calculation of water consumption and charged according to consumption then the consumption of water decreases. On the other hand if the charges are fixed type then the consumption of water increases. If the water meters are used for calculation of water consumption and charged according to consumption then the consumption of water decreases. On the other hand if the charges are fixed type then the consumption of water increases. If the water meters are used for calculation of water consumption and charged according to consumption then the consumption of water decreases. On the other hand if the charges are fixed type then the consumption of water increases. If the water meters are used for calculation of water consumption and charged according to consumption then the consumption of water decreases. On the other hand if the charges are fixed type then the consumption of water increases.
  • 19.
    g)Industrial and commercialplaces:- • If industrial and commercial are in large quantity in an area then more water is required. For that area which results on increases in per capita demand. Some industries need huge quantity of water. If industrial and commercial are in large quantity in an area then more water is required. For that area which results on increases in per capita demand. Some industries need huge quantity of water. h)Pressure in the distribution system:- If the pressure is high in the distribution system then in that case water will be available at great height and also the losses due to leakage are considerably increases. If the pressure is high in the distribution system then in that case water will be available at great height and also the losses due to leakage are considerably increases.
  • 20.
    Design Period :- Thefuture period or the number of years for which the water works are designed, is known as design period . The future period or the number of years for which the water works are designed, is known as design period . The future period or the number of years for which the water works are designed, is known as design period . Variation in the rate of demand :- Variation in the rate of demand :- Therefore, variation of demand can be mainly classified into following categories:- Therefore, variation of demand can be mainly classified into following categories:- Therefore, variation of demand can be mainly classified into following categories:- 1) Seasonal variation 1) Seasonal variation 2) Weekly variation 2) Weekly variation 3) Daily variation 3) Daily variation 4) Hour variation 4) Hour variation
  • 21.
    • • • variation :- seasonalvariation occur due to the large use of water in summer season, lesser use in winter , and much less in rainy season . variation :- seasonal variation occur due to the large use of water in summer season, lesser use in winter , and much less in rainy season . variation :- seasonal variation occur due to the large use of water in summer season, lesser use in winter , and much less in rainy season . variation :- seasonal variation occur due to the large use of water in summer season, lesser use in winter , and much less in rainy season . 1)Seasonal variation :- seasonal variation occur due to the large use of water in summer season, lesser use in winter , and much less in rainy season . 2)Weekly variation :- If the weekly consumption is recorded then it will be noted that even in one season , there are variations in the consumption of water for every week. 2)Weekly variation :- If the weekly consumption is recorded then it will be noted that even in one season , there are variations in the consumption of water for every week. 2)Weekly variation :- If the weekly consumption is recorded then it will be noted that even in one season , there are variations in the consumption of water for every week. 2)Weekly variation :- If the weekly consumption is recorded then it will be noted that even in one season , there are variations in the consumption of water for every week. 2)Weekly variation :- If the weekly consumption is recorded then it will be noted that even in one season , there are variations in the consumption of water for every week. 3)Daily variation :- These variations depend on the general habits of people ,climatic conditions and character of the city as industrial , commercial or residential 3)Daily variation :- These variations depend on the general habits of people ,climatic conditions and character of the city as industrial , commercial or residential 3)Daily variation :- These variations depend on the general habits of people ,climatic conditions and character of the city as industrial , commercial or residential 3)Daily variation :- These variations depend on the general habits of people ,climatic conditions and character of the city as industrial , commercial or residential 3)Daily variation :- These variations depend on the general habits of people ,climatic conditions and character of the city as industrial , commercial or residential
  • 22.
    • • • • • • • POPULATION FORECASTING :- POPULATIONFORECASTING :- POPULATION FORECASTING :- POPULATION FORECASTING :- After selecting the design period and per capita, the next step is to determine the population for the prescribed design period. The present population and past population may be obtained from the records . The population goes on increasing year by births, decreased by deaths , increased or decreased by migration and increased or decreased due to any other reason . The population is affected by all the four above factors . The future prediction of population depends upon these . After selecting the design period and per capita, the next step is to determine the population for the prescribed design period. The present population and past population may be obtained from the records . The population goes on increasing year by births, decreased by deaths , increased or decreased by migration and increased or decreased due to any other reason . The population is affected by all the four above factors . The future prediction of population depends upon these . Methods of population forecasting :- Methods of population forecasting :- Methods of population forecasting :- Methods of population forecasting :- 1)Arithmetical increase method. 1)Arithmetical increase method. 1)Arithmetical increase method. 1)Arithmetical increase method. 2)Geometrical increase method. 2)Geometrical increase method. 2)Geometrical increase method. 2)Geometrical increase method. 3)Incremental increase method. 3)Incremental increase method. 3)Incremental increase method. 3)Incremental increase method. 4)Decrease rate of growth method. 4)Decrease rate of growth method. 4)Decrease rate of growth method. 4)Decrease rate of growth method. 5)Graphical extension method. 5)Graphical extension method. 5)Graphical extension method. 5)Graphical extension method.
  • 23.
    1)Arithmetical increase method: - 1)Arithmetical increase method : - 1)Arithmetical increase method : - 1)Arithmetical increase method : - 1)Arithmetical increase method : - 1)Arithmetical increase method : - 1)Arithmetical increase method : - 1)Arithmetical increase method : - This is the most simple type of method of population forecast. This method is based upon the assumption that the population is increasing at constant rate. The rate of change of population with time is constant. This is the most simple type of method of population forecast. This method is based upon the assumption that the population is increasing at constant rate. The rate of change of population with time is constant. i.e. dp/dt =C ( a constant) i.e. dp/dt =C ( a constant) Formula :- Pn=P0+n.x bar Formula :- Pn=P0+n.x bar Example= Example=
  • 26.
    Geometrical Increase Method:- This method is based on the assumption that the % increase in the population from decade to decade or for a constant interval of time remains constant .
  • 27.
    Example of Geometrical increasemethod Forecast the population by means of geometrical increases method :-
  • 28.
    Incremental Increase Method:- This method combines both the arithmetic average method and the geometrical average method. From the census data for the past several decades, the actual increase in each decade is first found. Then the increment in increases for each decade is found. From these, an average increment of the increases ;It is called incremental increases method.
  • 29.
    Example:- Calculate the populationfor the decade 1980,1990 and 2000 by incremental increases method when the following data is given
  • 30.
    Decrease rate ofgrowth method:- The rate of increase in population goes on reducing , as the cities reach toward saturation , a method which make use of the decrease in the percentage increase, is many a time used, and gives quite rational results. In this method , the average decrease in the percentage increase is worked out, and is then subtracted from the latest percentage increase for each successive decade. This method however , applicable only in cases , where the rate of growth shows a downward trend. This will be more clear from the following example :- The rate of increase in population goes on reducing , as the cities reach toward saturation , a method which make use of the decrease in the percentage increase, is many a time used, and gives quite rational results. In this method , the average decrease in the percentage increase is worked out, and is then subtracted from the latest percentage increase for each successive decade. This method however , applicable only in cases , where the rate of growth shows a downward trend. This will be more clear from the following example :-
  • 32.
  • 33.
    Graphical method:- In thismethod, a curve drawn between the population P and time T, with the help of census data of precious decades, so that the shape of the population curve is obtained – up to the present period. From the graph the expected population for 1990 shall be 69000 and for 2000 it shall be 73000. Similarly for 2010 it shall be 76000 and for 2030 it shall be 81000. However, this method is less time consuming and are used by engineers.