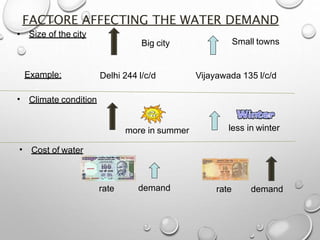
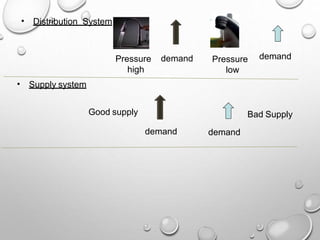
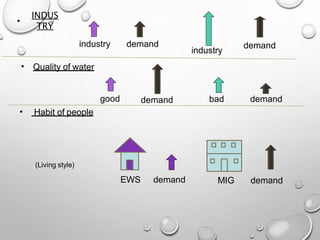
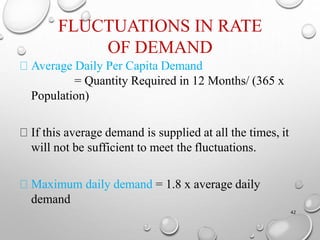
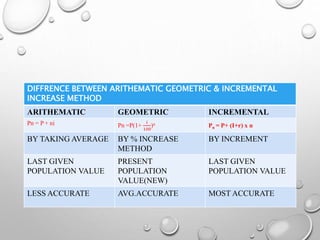
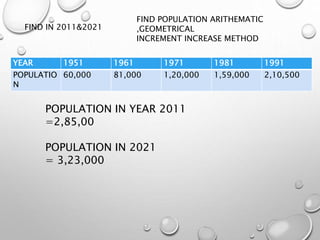
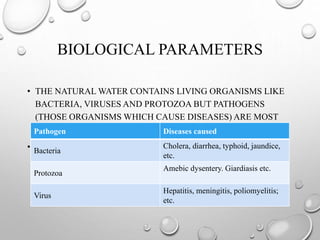
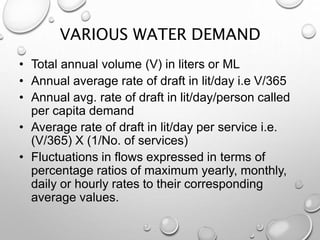
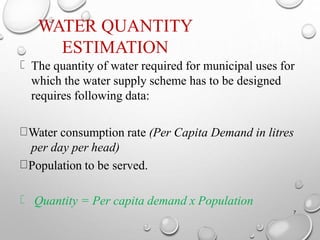
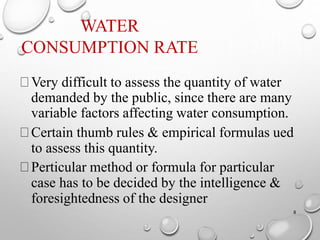
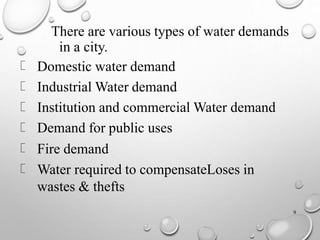
The document discusses various factors related to estimating water quantity and demand for municipal water supply schemes. It describes how to calculate domestic, industrial, commercial, and public water demands. It also discusses factors that affect per capita water demand and methods for estimating future populations like birth rate, death rate, migration, and different forecasting techniques. The key considerations in determining the design period of a water supply scheme are also outlined.


![NATIONAL BOARD OF FIRE UNDER WRITERS FORMULA:
Q=4637 √P[1-0.01√P]
(THIS FORMULA IS NOT SUITABLE FOR INDIAN CONDITION.)
FREEMAN’S FORMULA: Q=1136[P/10+10]
BUSTON’S FORMULA: Q=5663 √P
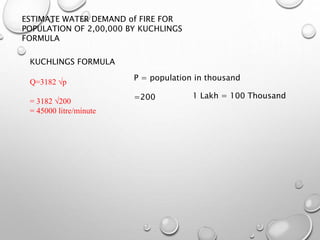
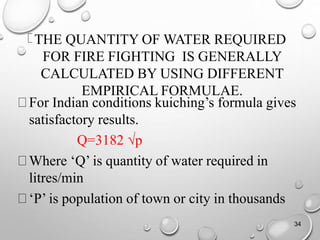
WHERE ‘Q’ IS QUANTITY OF WATER REQUIRED IN LITRES/MIN
‘P’ IS POPULATION OF TOWN OR CITY IN THOUSANDS](https://image.slidesharecdn.com/qualityquantityofwater-201106085915/85/Quality-amp-quantity-of-water-31-320.jpg)