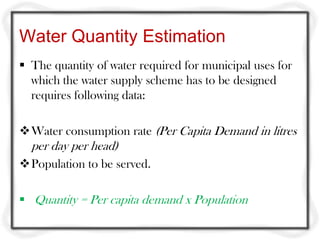
The document discusses factors that affect estimating water quantity requirements for a municipality. It outlines that water quantity is calculated using per capita demand and population served. Per capita demand can vary significantly based on climate, industry, economic status and more. The document then examines different types of water demands and factors like losses, fluctuations, design periods, and population forecasting methods used to estimate future water quantity needs.
water demand, types of demand, factors affecting per capita demand, design periods, losses in wastes & thefts, varion in demand, coincident draft,effect of variations on components of water supply schemes, factors affecting design periods, population forecasting methods, problems on population forecasting, etc
supplying wholesome water to consumers with suitable methods in economical way,to exist human life water is very important as air is,so,as a civil engineer's we have to supply safe water to consumers in economical way,in this we are going to explain about component parts of water supply scheme,systems of water distribution and layouts of distribution system according to their suitability.
Sources of water, Assessment of domestic and industrial requirement, Impurities in
water, Indian standards for drinking water, Water borne diseases and their control.
Introduction to water supply engg. by Prof. D S.Shahdhavalsshah
Introduction to water supply Engineering. Basic definitions in water supply engineering. Importance of water supply engineering.
Financing of water supply schemes. Flow diagram of water supply scheme, layouts of water supply schemes, etc.
Water demand, Types of demands, Factors affecting per capita demand, waste and losses, variations in demand, design periods, population forecasting methods & problems.
Lecture notes of Environmental Engineering-II as per Solapur university syllabus of TE CIVIL.
Prepared by
Prof S S Jahagirdar,
Associate Professor,
N K Orchid college of Engg and Technology,
Solapur
This presentation includes the estimation of storm sewage generated as a result of storm/rainfall events. It includes the detailed usage of rational formula for quantity estimation with solved examples.
Transport of Pollution in Atmosphere: Plume behaviour under different atmospheric
conditions, Mathematical models of dispersion of air pollutants, Plume behaviour in valley and terrains. Plume behaviour under different meteorological conditions, Concept of isoplates
Introduction:
Necessity of irrigation- scope of irrigation engineering- benefits and ill effects of irrigation- irrigation development in India- types of irrigation systems, Soil-water plant relationship: Classification of soil water- soil
moisture contents- depth of soil water available to plants-permanent
and ultimate wilting point
Water requirements of crops:
Depth of water applied during irrigation- Duty of water and deltaimprovement
of duty- command area and intensity of irrigation consumptive use of water and evapotranspiration- irrigation efficiencies- assessment of irrigation water
Air Pollution control- at source-equipments for control of air pollution-For particulate matter-Settling chambers-Fabric filters-Scrubbers-Cyclones-Electrostatic precipitators
, For Gaseous pollutants-control by absorption-adsorption-scrubbers-secondary combustion after burners, Working principles advantages and disadvantages
Effects of Air Pollution on human beings, plants and animals and Properties. Global
effects-Green house effect, Ozone depletion, heat island, dust storms, Automobile pollution sources and control, Photochemical smog, Future engines and fuels
History of Air pollution and episodes, Sources of air pollution and types, Introduction
to meteorology and transport of air pollution: Global winds, Headley cells, wind rose terrestrial wind profile, Effects of terrain and topography on winds, lapse rate, maximum mixing depths, plume rise
Canal fall- necessity and location- types of falls- Cross regulator and
distributory head regulator- their functions, Silt control devices, Canal
escapes- types of escapes.
Introduction, hydrologic cycle, climate and water m1Bibhabasu Mohanty
Introduction, Hydrologic cycle, Climate and water availability, Water balances,
Precipitation: Forms, Classification, Variability, Measurement, Data analysis, Evaporation and its measurement, Evapotranspiration and its measurement, Penman Monteith method. Infiltration: Factors affection infiltration, Horton’s equation and Green Ampt method.
Water treatment is any process that improves the quality of water to make it appropriate for a specific end-use. The end use may be drinking, industrial water supply, irrigation, river flow maintenance, water recreation or many other uses, including being safely returned to the environment. Water treatment removes contaminants and undesirable components, or reduces their concentration so that the water becomes fit for its desired end-use. This treatment is crucial to human health and allows humans to benefit from both drinking and irrigation use.
Sources, intake structures and water demand in Water Supply Schemes Vaibhav Kambale
This Slide deals with Sources, intake structures and water demand in Water Supply Schemes in Details Manner . All the Aspects Related to Source of Wate, Water Demand Calculations, Design Period Considerations has along with the population forecasting methods has been explained
Air Quality Sampling and Monitoring: Stack sampling, instrumentation and methods of analysis of SO2, CO etc, legislation for control of air pollution and automobile
pollution
Definition, Composition of atmospheric air, Classification and sources of air
pollutants. Effects of air pollution on human, plant and material, Air pollution control methods, equipment and safety.
Levels in planning, Functional requirements of water resources projects, steps in
water resources planning, Environmental aspects in water resources planning.
Definition of drought, Causes of drought, measures for water conservation and
augmentation, drought contingency planning. Water harvesting: rainwater
collection, small dams, runoff enhancement, runoff collection, ponds, tanks.
Types- selection of the suitable site for the diversion headwork components
of diversion headwork- Causes of failure of structure on pervious foundation- Khosla’s theory- Design of concrete sloping
glacis weir.
Hydraulic Design of Sewer:
Hydraulic formulae, maximum and minimum velocities in sewer, hydraulic
characteristics of circular sewer in running full and partial full conditions,
laying and testing of sewer, sewer appurtenances and network.
2024.06.01 Introducing a competency framework for languag learning materials ...Sandy Millin
http://sandymillin.wordpress.com/iateflwebinar2024
Published classroom materials form the basis of syllabuses, drive teacher professional development, and have a potentially huge influence on learners, teachers and education systems. All teachers also create their own materials, whether a few sentences on a blackboard, a highly-structured fully-realised online course, or anything in between. Despite this, the knowledge and skills needed to create effective language learning materials are rarely part of teacher training, and are mostly learnt by trial and error.
Knowledge and skills frameworks, generally called competency frameworks, for ELT teachers, trainers and managers have existed for a few years now. However, until I created one for my MA dissertation, there wasn’t one drawing together what we need to know and do to be able to effectively produce language learning materials.
This webinar will introduce you to my framework, highlighting the key competencies I identified from my research. It will also show how anybody involved in language teaching (any language, not just English!), teacher training, managing schools or developing language learning materials can benefit from using the framework.
Operation “Blue Star” is the only event in the history of Independent India where the state went into war with its own people. Even after about 40 years it is not clear if it was culmination of states anger over people of the region, a political game of power or start of dictatorial chapter in the democratic setup.
The people of Punjab felt alienated from main stream due to denial of their just demands during a long democratic struggle since independence. As it happen all over the word, it led to militant struggle with great loss of lives of military, police and civilian personnel. Killing of Indira Gandhi and massacre of innocent Sikhs in Delhi and other India cities was also associated with this movement.
The Indian economy is classified into different sectors to simplify the analysis and understanding of economic activities. For Class 10, it's essential to grasp the sectors of the Indian economy, understand their characteristics, and recognize their importance. This guide will provide detailed notes on the Sectors of the Indian Economy Class 10, using specific long-tail keywords to enhance comprehension.
For more information, visit-www.vavaclasses.com
The Art Pastor's Guide to Sabbath | Steve ThomasonSteve Thomason
What is the purpose of the Sabbath Law in the Torah. It is interesting to compare how the context of the law shifts from Exodus to Deuteronomy. Who gets to rest, and why?
Welcome to TechSoup New Member Orientation and Q&A (May 2024).pdfTechSoup
In this webinar you will learn how your organization can access TechSoup's wide variety of product discount and donation programs. From hardware to software, we'll give you a tour of the tools available to help your nonprofit with productivity, collaboration, financial management, donor tracking, security, and more.
The French Revolution, which began in 1789, was a period of radical social and political upheaval in France. It marked the decline of absolute monarchies, the rise of secular and democratic republics, and the eventual rise of Napoleon Bonaparte. This revolutionary period is crucial in understanding the transition from feudalism to modernity in Europe.
For more information, visit-www.vavaclasses.com
Palestine last event orientationfvgnh .pptxRaedMohamed3
An EFL lesson about the current events in Palestine. It is intended to be for intermediate students who wish to increase their listening skills through a short lesson in power point.
1. Module
-I
Water
quantities
Requirement
Bibhabasu Mohanty
Asst. Prof.
Dept. of civil Engineering
SALITER, Ahmedabad
2. Course Content...
Factors affecting per capita demand, waste and
losses, variations in demand, design periods,
population forecasting methods.
3. Water Quantity Estimation
The quantity of water required for municipal uses for
which the water supply scheme has to be designed
requires following data:
Water consumption rate (Per Capita Demand in litres
per day per head)
Population to be served.
Quantity = Per capita demand x Population
4. Water Consumption Rate
Very difficult to assess the quantity of water demanded
by the public, since there are many variable factors
affecting water consumption.
There are various types of water demands in a city.
5. Domestic water demand
Industrial demand
Institution and commercial demand
Demand for public use
Fire demand
Loses and wastes
6. Domestic water demand
water required in the houses for
drinking, bathing, cooking, washing etc.
mainly depends upon the habits, social
status, climatic conditions and customs of the
people.
As per IS: 1172-1963, under normal
conditions, the domestic consumption of water
in India is about 135 litres/day/capita.
7. The details of the domestic consumption are
a) Drinking ------ 5 litres
b) Cooking ------ 5 litres
c) Bathing ------ 55 litres
d) Clothes washing ------20 litres
e) Utensils washing ------10 litres
f) House washing ------ 10 litres
--------------------------
135 litres/day/capita
8. Industrial demand
The water required in the industries mainly
depends on the type of industries, which are
existing in the city.
The water required by factories, paper mills,
Cloth mills, Cotton mills, Breweries, Sugar
refineries etc. comes under industrial use.
The quantity of water demand for industrial
purpose is around 20 to 25% of the total
demand of the city.
9. Institution and commercial demand
Universities, Institution, commercial buildings
and commercial centres including office
buildings, warehouses, stores, hotels, shopping
centres, health centres, schools, temple, cinema
houses, railway and bus stations etc comes
under this category.
10. Demand for public use
Quantity of water required for public utility
purposes such as for washing and sprinkling on
roads, cleaning of sewers, watering of public
parks, gardens, public fountains etc. comes
under public demand.
To meet the water demand for public
use, provision of 5% of the total consumption is
made designing the water works for a city.
11. The requirements of water for public utility shall be
taken as…
Sl.No. Purpose Water Requirements
1 Public parks 1.4 litres/m2/day
2 Street washing 1.0-1.5 litres/m2/day
3 Sewer cleaning 4.5 litres/head/day
12. Fire demand
During the fire breakdown large quantity of
water is required for throwing it over the fire to
extinguish it, therefore provision is made in the
water work to supply sufficient quantity of water
or keep as reserve in the water mains for this
purpose.
13. The quantity of water required for fire fighting
is generally calculated by using different
empirical formulae.
For Indian conditions kuiching’s formula gives
satisfactory results.
Q=3182 √p
Where ‘Q’ is quantity of water required in
litres/min
‘P’ is population of town or city in thousands
14. Loses and wastes
Losses due to defective pipe joints, cracked and
broken pipes, faulty valves and fittings.
Losses due to, continuous wastage of water.
Losses due to unauthorised and illegal
connections.
While estimating the total quantity of water of a
town; allowance of 15% of total quantity of
water is made to compensate for losses, thefts
and wastage of water.
15. Water Consumption for Various Purposes
Types of Normal Average %
Consumption Range
(lit/capita/day)
1 Domestic
Consumption 65-300 160 35
2 Industrial and
Commercial 45-450 135 30
Demand
3 Public Uses
including Fire 20-90 45 10
Demand
4 Losses and
Waste 45-150 62 25
16. Per capita demand
If ‘Q’ is the total quantity of water required by
various purposes by a town per year and ‘p’ is
population of town, then per capita demand will
be
Q
Per capita demand = ------------------ litres/day
P x 365
17. Per capita demand of the town depends on various
factors like standard of living, no. and type of
commercial places in a town etc.
For an average Indian town, the requirement of water
in various uses is as under-
Domestic purpose -------- 135 litres/c/d
Industrial use -------- 40 litres/c/d
Public use -------- 25 litres/c/d
Fire Demand -------- 15 litres/c/d
Losses, Wastage and thefts -------- 55 litres/c/d
--------------------------
Total : 270 litres/capita/day
18. Factors affecting per capita demand
Size of the city: Per capita demand for big cities
is generally large as compared to that for
smaller towns .
Presence of industries-
Climatic conditions-
Habits of people and their economic status-
Pressure in the distribution system-
19. Quality of water: If water is aesthetically & medically
safe, the consumption will increase .
Efficiency of water works administration: Leaks in
water mains and services; and unauthorised use of
water can be kept to a minimum by surveys.
Cost of water-
Policy of metering and charging method: Water tax is
charged in two different ways: on the basis of meter
reading and on the basis of certain fixed monthly rate.
20. Fluctuations in Rate of Demand
Average Daily Per Capita Demand
= Quantity Required in 12 Months/ (365 x
Population)
If this average demand is supplied at all the times, it
will not be sufficient to meet the fluctuations.
Maximum daily demand = 1.8 x average daily demand
21. Maximum hourly demand of maximum day i.e. Peak
demand
= 1.5 x average hourly demand
= 1.5 x Maximum daily demand/24
= 1.5 x (1.8 x average daily demand)/24
= 2.7 x average daily demand/24
= 2.7 x annual average hourly demand
22. Seasonal variation: The demand peaks during
summer. Firebreak outs are generally more in
summer, increasing demand. So, there is seasonal
variation .
Daily variation depends on the activity. People draw
out more water on Sundays and Festival days, thus
increasing demand on these days.
23. Hourly variations are very important as they have a
wide range. During active household working hours
i.e. from six to ten in the morning and four to eight in
the evening, the bulk of the daily requirement is taken.
During other hours the requirement is negligible.
Moreover, if a fire breaks out, a huge quantity of water
is required to be supplied during short duration,
necessitating the need for a maximum rate of hourly
supply.
24. So, an adequate quantity of water must be available to
meet the peak demand.
To meet all the fluctuations, the supply pipes, service
reservoirs and distribution pipes must be properly
proportioned.
The water is supplied by pumping directly and the
pumps and distribution system must be designed to
meet the peak demand.
25. The effect of monthly variation influences the design
of storage reservoirs and the hourly variations
influences the design of pumps and service reservoirs.
As the population decreases, the fluctuation rate
increases.
26. Design Periods
The future period for which a provision is made in the
water supply scheme is known as the design period.
Design period is estimated based on the following:
Useful life of the component, considering
obsolescence, wear, tear, etc.
Expandability aspect.
27. Anticipated rate of growth of population, including
industrial, commercial developments & migration-
immigration.
Available resources.
Performance of the system during initial period.
28. Population Forecasting Methods
The various methods adopted for estimating future
populations .
The particular method to be adopted for a particular
case or for a particular city depends largely on the
factors discussed in the methods, and the selection is
left to the discretion and intelligence of the designer.
30. Arithmetic Increase Method
This method is based on the assumption that the
population is increasing at a constant rate.
The rate of change of population with time is constant.
The population after ‘n’ decades can be determined
by the formula
Pn = P + n.c where
P → population at present
n → No. of decades
c → Constant determined by the average of increase
of ‘n’ decades
31. Geometric Increase Method
This method is based on the assumption that the
percentage increase in population from decade to
decade remains constant.
In this method the average percentage of growth of last
few decades is determined.
The population at the end of ‘n’ decades is calculated
by- Pn = P {1+ IG/100} where
P → population at present
C → average percentage of growth of ‘n’ decades
32. Incremental Increase Method
This method is improvement over the above
two methods.
The average increase in the population is
determined by the arithmetical method and to
this is added the average of the net incremental
increase once for each future decade.