Downloaded 676 times


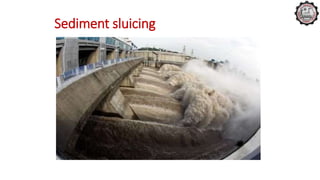
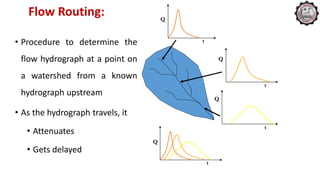
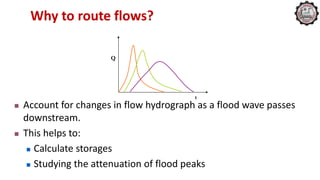
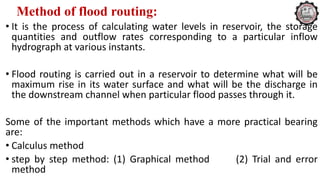


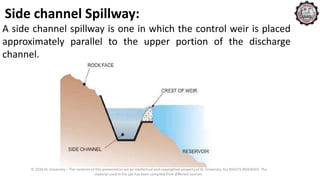

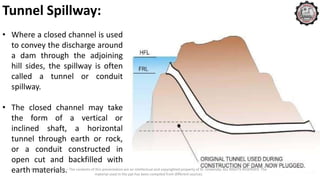
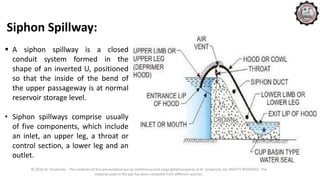

This document discusses reservoir planning and design. It describes how reservoirs are created by constructing dams across rivers. Investigations including engineering surveys, geological studies, and hydrological analyses are conducted. Reservoirs have different levels like full reservoir level and minimum drawdown level. Storage zones include live, dead, and flood storage. Methods to determine reservoir capacity and yield using mass inflow and demand curves are presented. Factors affecting reservoir sedimentation and management techniques are outlined. Flow routing methods like graphical and trial and error are described to model flood waves passing through reservoirs. Spillway types including free overfall are also summarized.


