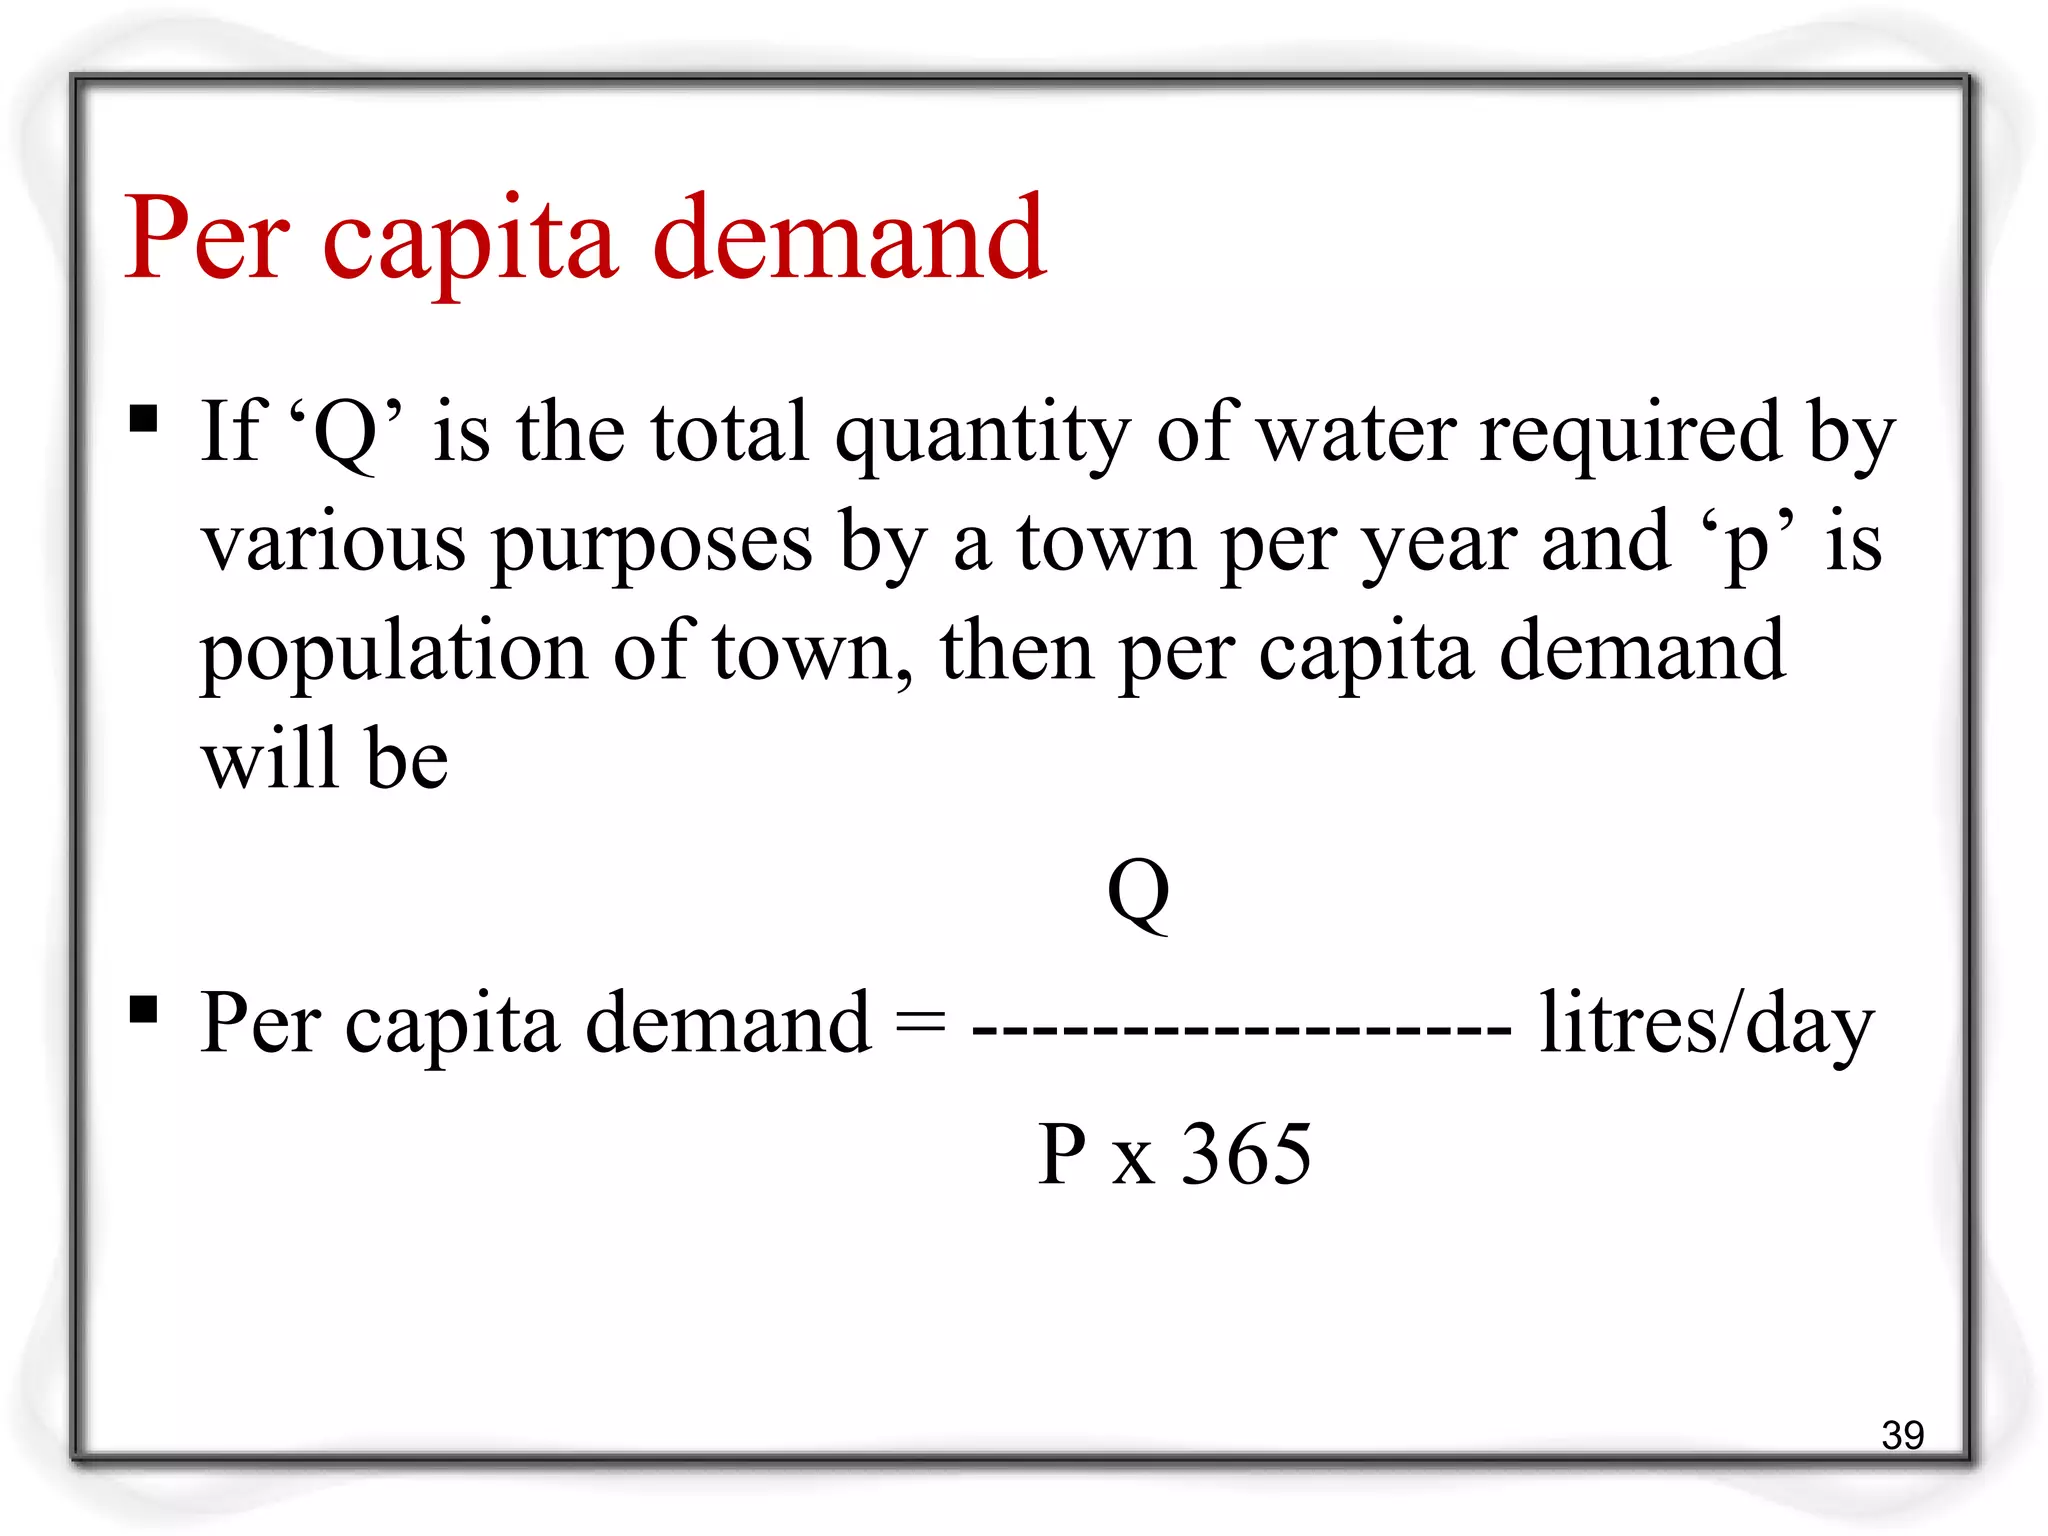
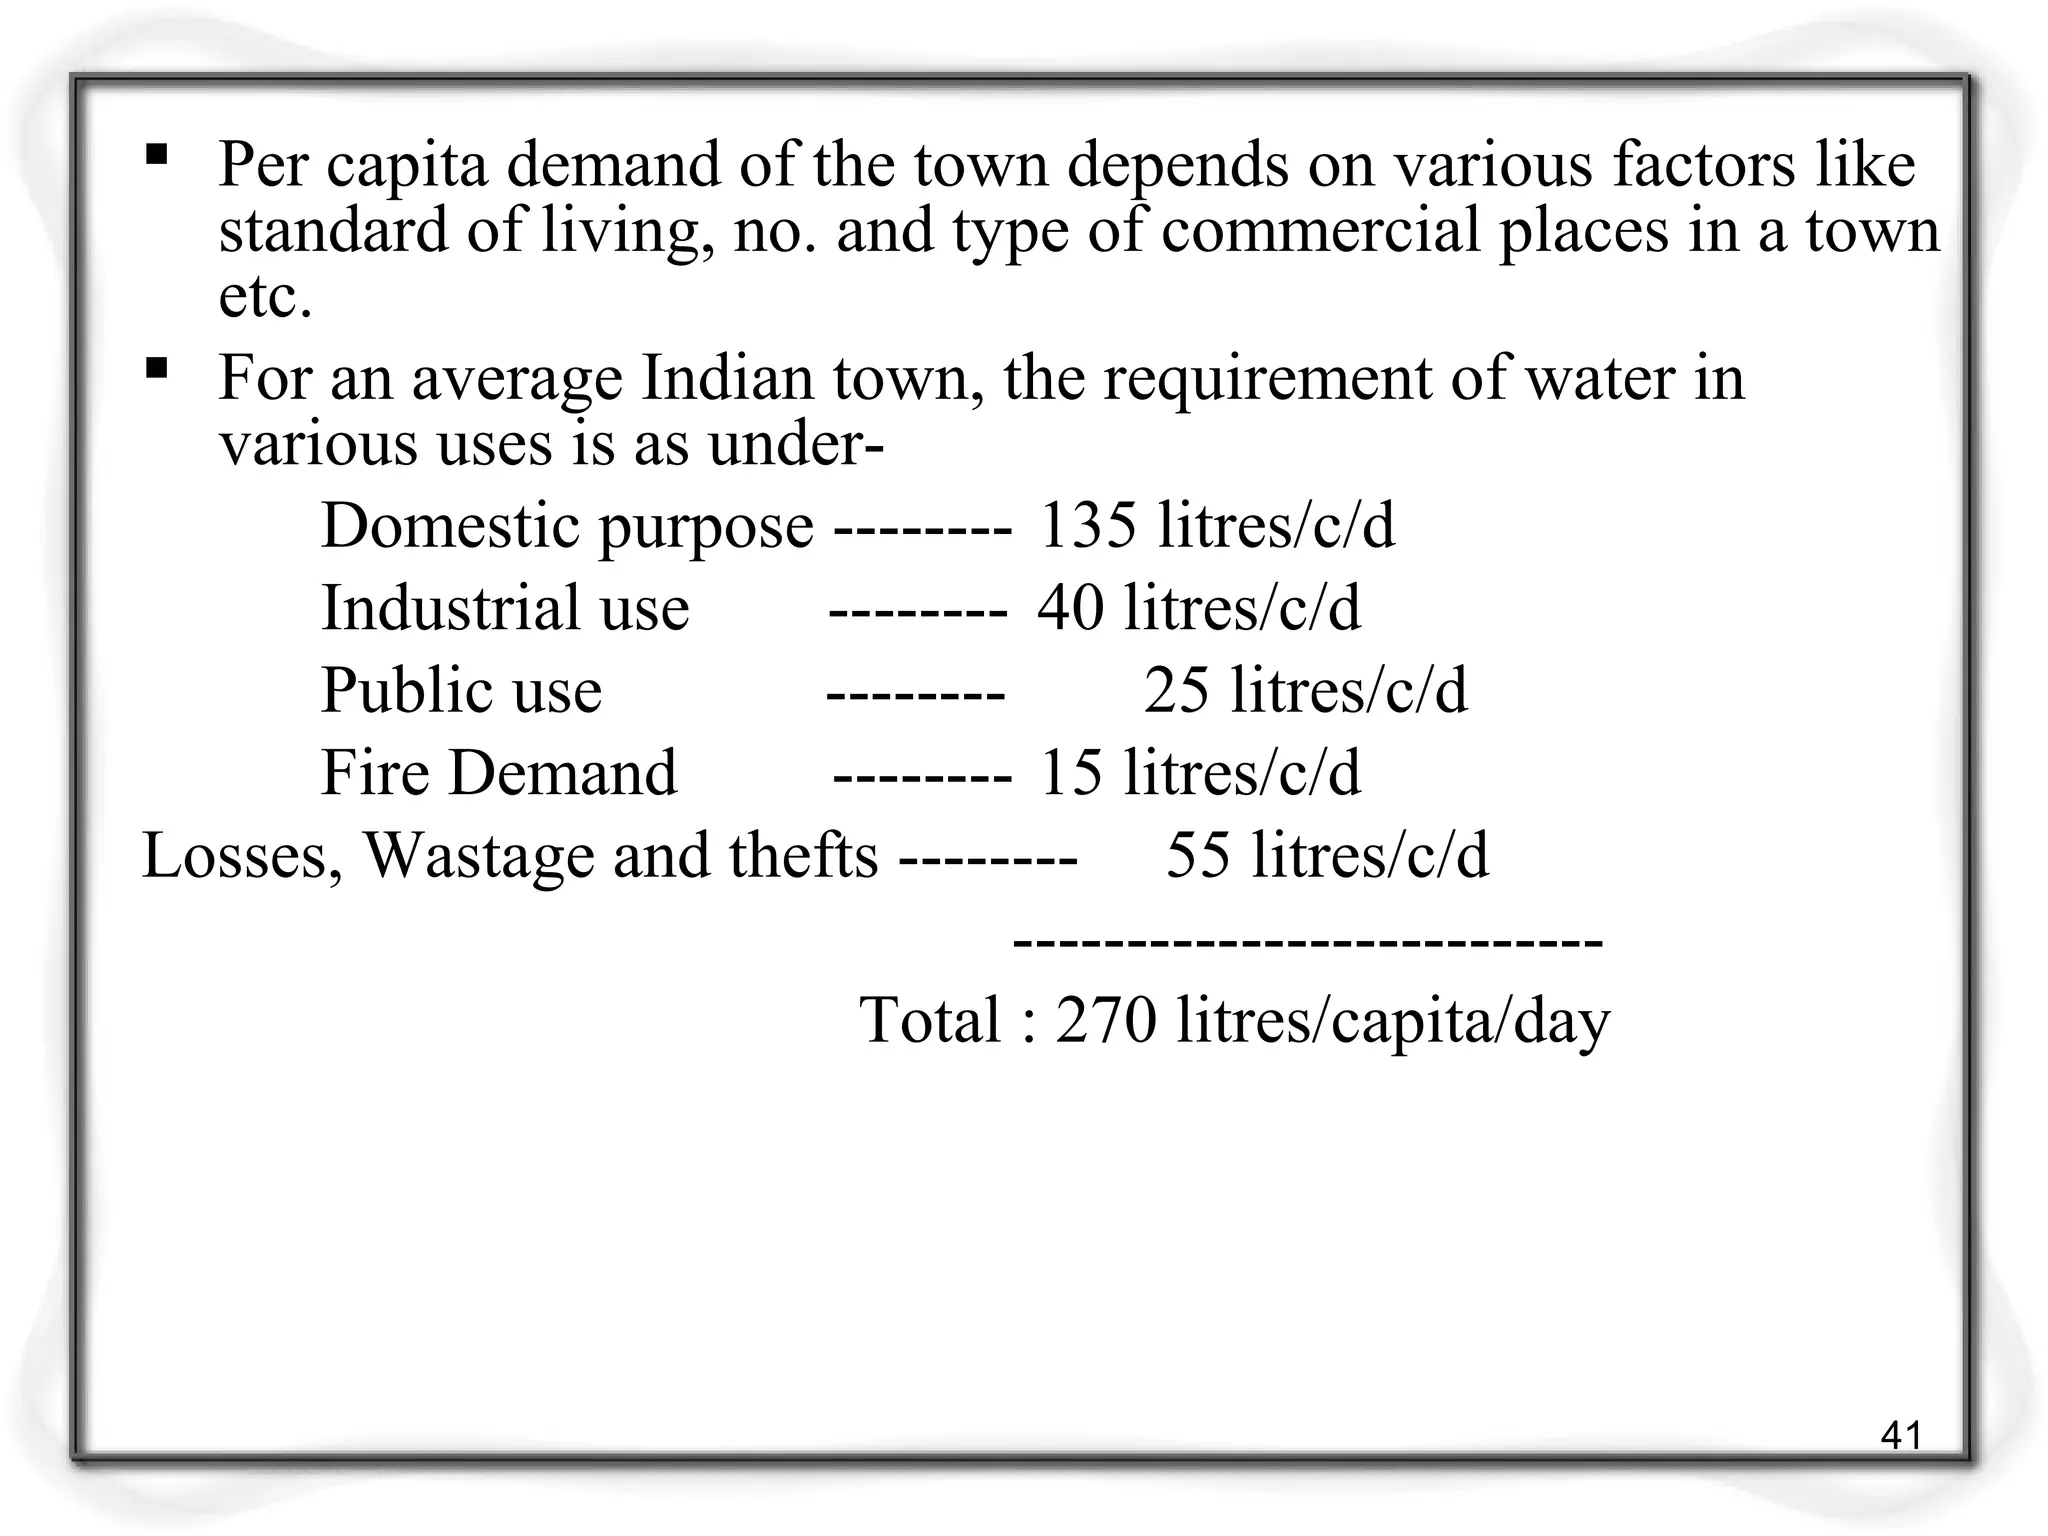
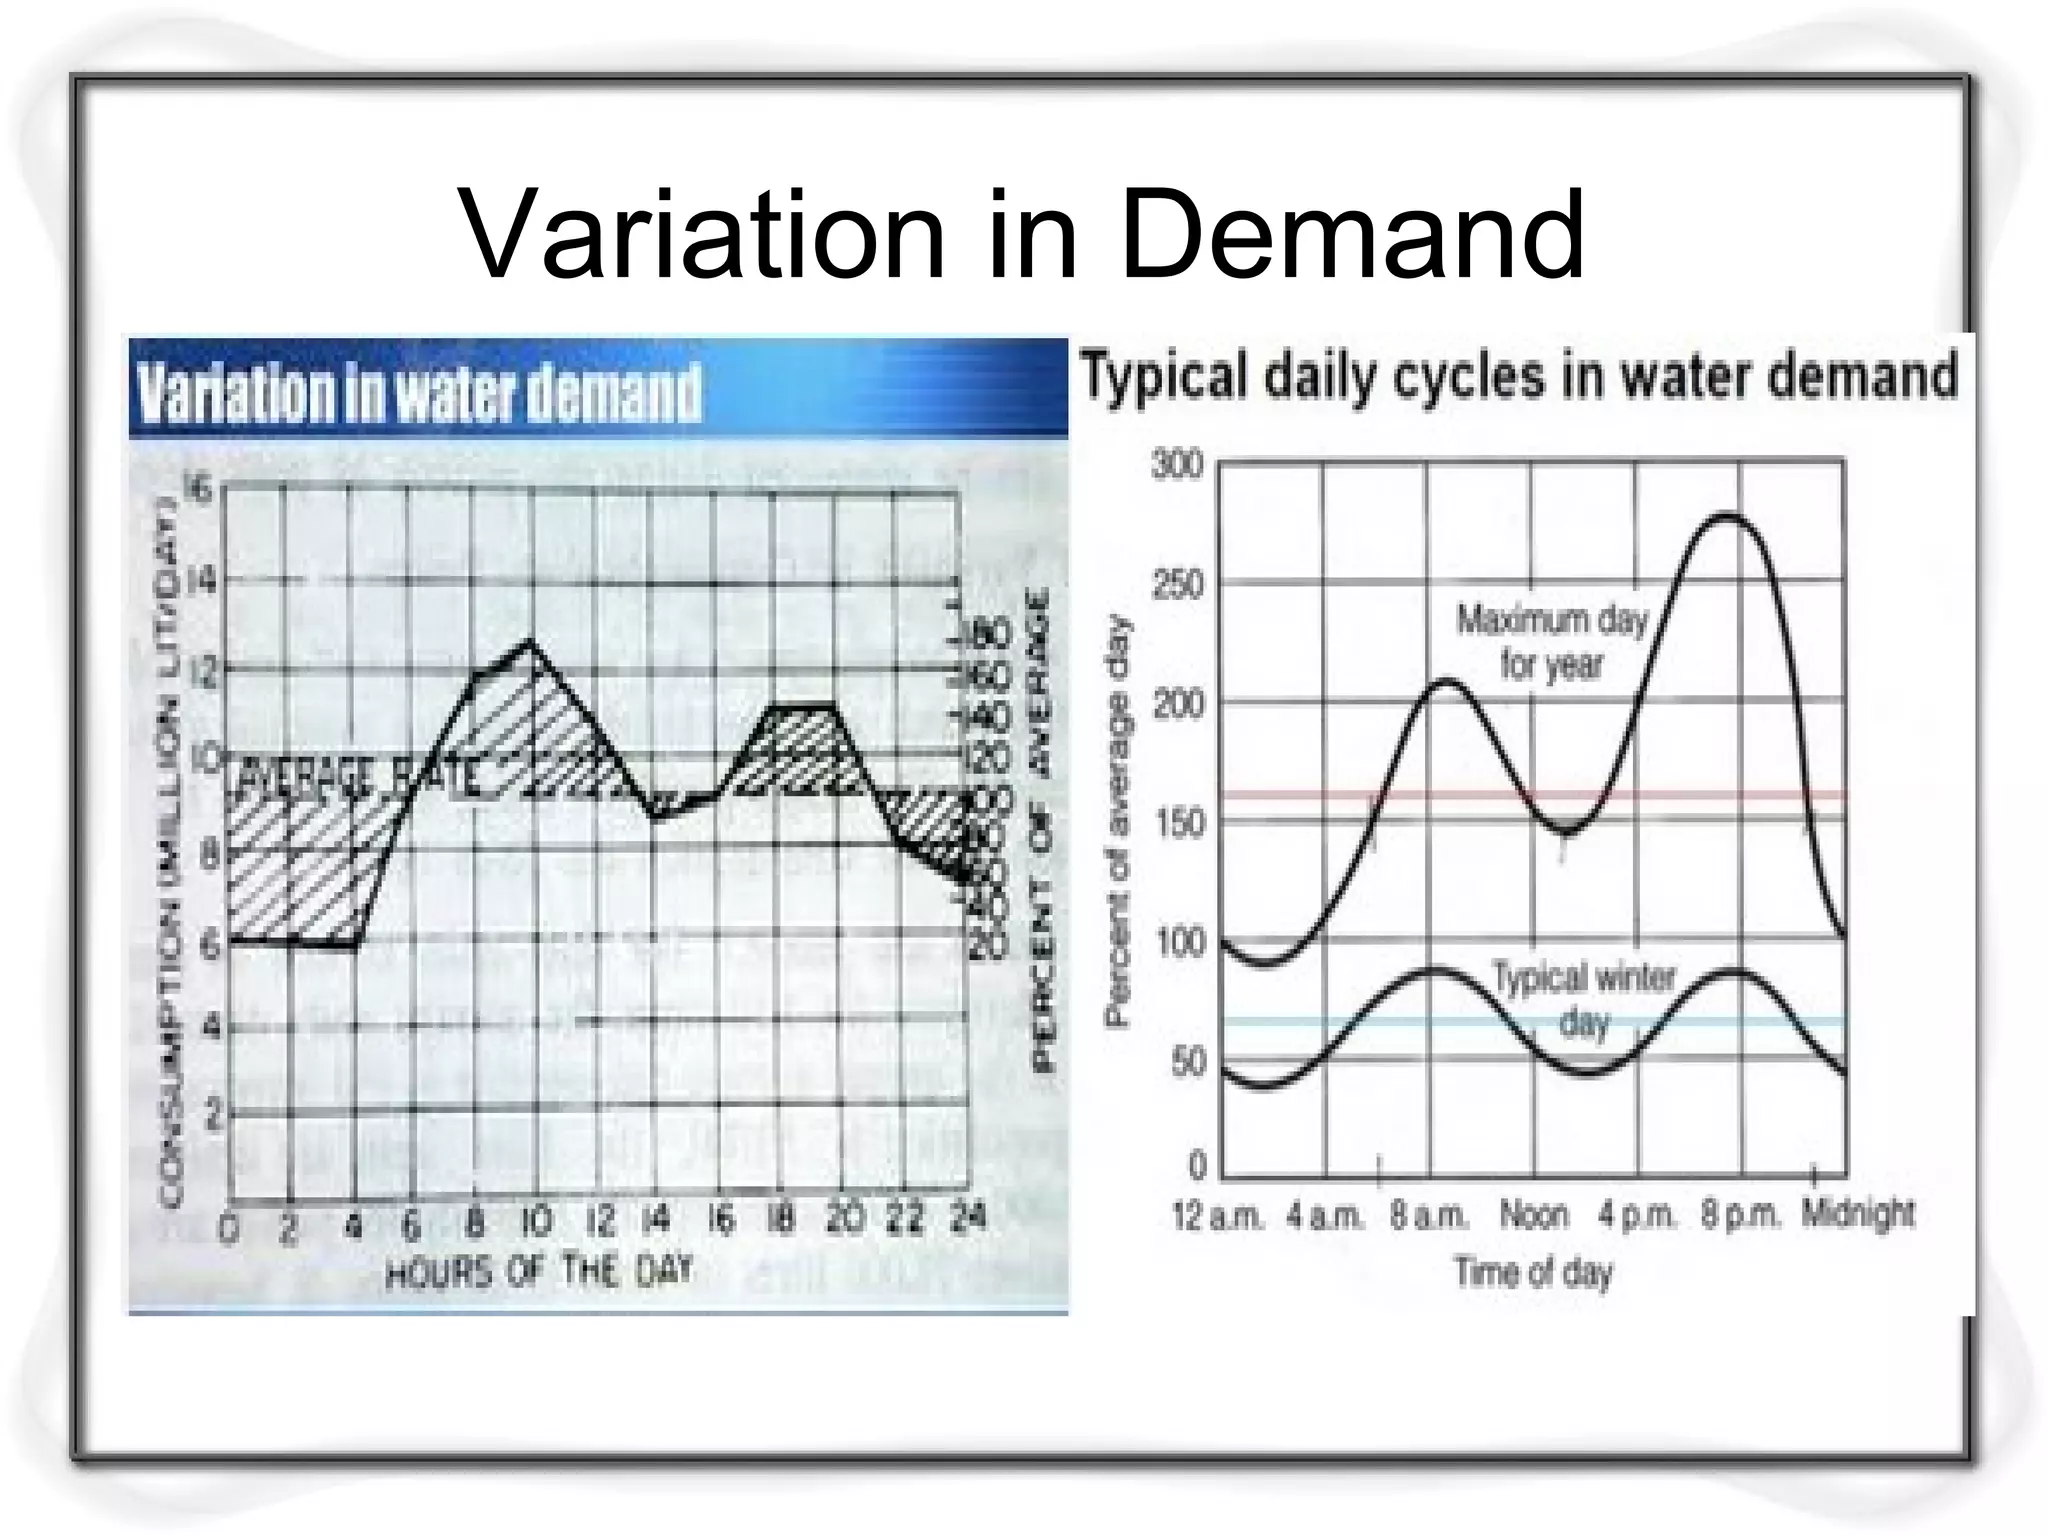
water demand, types of demand, factors affecting per capita demand, design periods, losses in wastes & thefts, varion in demand, coincident draft,effect of variations on components of water supply schemes, factors affecting design periods, population forecasting methods, problems on population forecasting, etc
5. Course Content...
Water demand, Types of demands, Factors
affecting per capita demand, waste and losses,
variations in demand, design periods,
population forecasting methods & problems.
5
7. Various Water Demand
• Total annual volume (V) in liters or ML
• Annual average rate of draft in lit/day i.e V/365
• Annual avg. rate of draft in lit/day/person called
per capita demand
• Average rate of draft in lit/day per service i.e.
(V/365) X (1/No. of services)
• Fluctuations in flows expressed in terms of
percentage ratios of maximum yearly, monthly,
daily or hourly rates to their corresponding
average values.
8. Water Quantity Estimation
The quantity of water required for municipal uses for
which the water supply scheme has to be designed
requires following data:
Water consumption rate (Per Capita Demand in litres
per day per head)
Population to be served.
Quantity = Per capita demand x Population
8
9. Water Consumption Rate
Very difficult to assess the quantity of water
demanded by the public, since there are many
variable factors affecting water consumption.
Certain thumb rules & empirical formulas ued
to assess this quantity.
Perticular method or formula for perticular
case has to be decided by the intelligence &
foresightedness of the designer
9
10. There are various types of water demands
in a city.
Domestic water demand
Industrial Water demand
Institution and commercial Water demand
Demand for public uses
Fire demand
Water required to compensateLoses in
wastes & thefts
10
15. Domestic water demand
water required in the houses for drinking,
bathing, cooking, washing, lawn sprinkling,
gardening, sanitary purposes etc.
mainly depends upon the habits, social status,
climatic conditions and customs of the people.
As per IS: 1172-1963, under normal
conditions, the domestic consumption of water
in India is about 135(weaker & LIG) - 200
(full flushing) litres/day/capita.
15
16. Full flushing system
The details of the domestic consumption are
a) Drinking ------ 5 litres
b) Cooking ------ 5 litres
c) Bathing ------ 75 litres
d) Clothes washing ------ 25 litres
e) Utensils washing ------ 15 litres
f) House washing ------ 15 litres
g) Flushing of waterCloset, etc------------ 45 liters
h) Lawn watering & gardening------------ 15 liters
--------------------------
200 litres/day/capita
17. Weaker section & LIG
The details of the domestic consumption are
a) Drinking ------ 5 litres
b) Cooking ------ 5 litres
c) Bathing ------ 55 litres
d) Clothes washing ------ 20 litres
e) Utensils washing ------ 10 litres
f) House washing ------ 10 litres
g) Flushing of water
Closet, etc ------- 30 litres
--------------------------
135 litres/day/capita
17
18. Total domestic water consumption usually
accounts to 50-60% of total water consumption
The Is code lays down a limit on domestic water
consumption between 135-225 l/h/d
In developed & effluent country like USA, this
figure this figure usually goes as high as 340 l/h/d.
This is because more water is consumed in rich
living in air-cooling, bathing in bath-tubs, dish
washing of utensils, car washing, home laundries,
garbage grinders,etc
Domestic water demand = designPopulation x Per capita
domestic demand
19.
20. Industrial demand
Industrial water demand = Water demand of
Existing or likely to be started industries in
near future.
this quantity vary with types & no. of
industries, which are existing in the city.
Per capita consumption on account of
industrial needs is generally taken as 50 l/h/d
In industrial city this demand may be as high
as 450 l/c/d
20
21. Industrial demand
The water required by factories, paper mills, Cloth
mills, Cotton mills, Breweries, Sugar refineries etc.
comes under industrial use.
The quantity of water demand for industrial purpose
is around 20 to 25% of the total demand of the city.
Automobiles- 40kl/vechile, Paper - 200-400
kl/Tonne, Petroleum Refinery- 1-2 kl/tonne of crude,
Steel- 200-250 kl/tonne, distillery- 122-170 kl/ kl,
Textile- 80-140 kl/tonne of goods, special
Qualitypaper- 400-1000kl/tonne.
21
22. Institution and commercial demand
Universities, Institution, commercial buildings
and commercial centres including office
buildings, warehouses, stores, hotels, shopping
centres, health centres, schools, temple,
cinema houses, railway and bus stations etc
comes under this category.
On an average this value is taken as 20 l/h/d &
for highly commerciallised cities it may be
50l/c/d
22
23. Indivisual water requirement
S.
No.
Type of Institution or Commercial establishment Avg demand in l/h/d
1 offices 45-90
2 Hostels 135-180
3 Restaurants 70 per seat
4 schools a) day school 45-90
b) Residential 135-225
5 Factories a) Where bath rooms are provided 45-90
b) No bath rooms provided 30-60
6 Hospitals ( Including laundry) a) beds less than 100 340 per bed
b) beds more than 100 450 per bed
7 Nurses homes & medical quarters 135-225
8 Cinema hall 15
9 Airports 70
10 Railway station 23-70
29. Demand for public use
Quantity of water required for public utility
purposes such as for washing and sprinkling
on roads, cleaning of sewers, watering of
public parks, gardens, public fountains etc.
comes under public demand.
To meet the water demand for public use,
provision of 5% of the total consumption is
made designing the water works for a city.
A figure of 10 l/c/d is usually added.
29
30. Sl.No. Purpose Water Requirements
1 Public parks 1.4 litres/m2/day
2 Street washing 1.0-1.5 litres/m2/day
3 Sewer cleaning 4.5 litres/head/day
The requirements of water for public utility shall be
taken as…
30
32. Fire demand
During the fire breakdown large quantity of
water is required for throwing it over the fire
to extinguish it, therefore provision is made in
the water work to supply sufficient quantity of
water or keep as reserve in the water mains for
this purpose.
Fire hydrants are usually fitted in water mains
at about 100 150 m apart & fire fighting pump
is fittedto it in case of fire.
32
33. These pumps throw water at very high pressure.
Pressure available at fire hydrants be of the order
of 100 to 150 kn/m2
& should be maintained even
after 4 to 5 hours of constant use.
Three stream jets are simulteneously thrown from
each fire hydrant; One on burning property & one
each on adjacent propertyon either side of the
burning property.the discharge of each stream
should be 1100lit/min.
The per capita fire demand is generally ignored
while computing total per capita demand.
Kilo liters of water req. = 100 (P)1/2
P= population in
thousands
34. The quantity of water required for fire fighting
is generally calculated by using different
empirical formulae.
For Indian conditions kuiching’s formula gives
satisfactory results.
Q=3182 √p
Where ‘Q’ is quantity of water required in
litres/min
‘P’ is population of town or city in thousands
34
37. Loses and wastes
Losses due to defective pipe joints, cracked
and broken pipes, faulty valves and fittings.
Losses due to, continuous wastage of water.
Losses due to unauthorised and illegal
connections.
While estimating the total quantity of water of
a town; allowance of 15% of total quantity of
water is made to compensate for losses, thefts
and wastage of water.
37
38. Water Consumption for Various Purposes
Types of
Consumption
Normal
Range
(lit/capita/da
y)
Average %
1 Domestic
Consumption 65-300 160 35
2 Industrial and
Commercial
Demand
45-450 135 30
3 Public Uses
including Fire
Demand
20-90 45 10
4 Losses and
Waste 45-150 62 25
38
39. Per capita demand
If ‘Q’ is the total quantity of water required by
various purposes by a town per year and ‘p’ is
population of town, then per capita demand
will be
Q
Per capita demand = ------------------ litres/day
P x 365
39
40. Break up of Per Capita Demand for an Average
Indian City
USE Demand in l/h/d
Domestic use 200
Industrial use 50
Commercial use 20
Civic use or public use 10
Wastes & thefts, etc 55
Total 335 = per capita Demand (q)
41. Per capita demand of the town depends on various factors like
standard of living, no. and type of commercial places in a town
etc.
For an average Indian town, the requirement of water in
various uses is as under-
Domestic purpose -------- 135 litres/c/d
Industrial use -------- 40 litres/c/d
Public use -------- 25 litres/c/d
Fire Demand -------- 15 litres/c/d
Losses, Wastage and thefts -------- 55 litres/c/d
--------------------------
Total : 270 litres/capita/day
41
42. Factors affecting per capita demand
1Size of the city: Per capita demand for big
cities is generally large as compared to that for
smaller towns .
2Presence of industries & commercial activities
3Climatic conditions
4Habits of people and their economic status
5Pressure in the distribution system
6Quality of water supplied
7Developement of sewerage facility
8System of supply
9Cost of water
• 10policy of metering & Method of charging
42
43. 11Quality of water: If water is aesthetically &
medically safe, the consumption will increase .
12Efficiency of water works administration: Leaks in
water mains and services; and unauthorised use of
water can be kept to a minimum by surveys.
13Cost of water-
14Policy of metering and charging method: Water tax
is charged in two different ways: on the basis of
meter reading and on the basis of certain fixed
monthly rate. 43
44. FACTORE AFFECTING THE WATER DEMAND
Big city
• Size of the city
Small towns
Example: Delhi 244 l/c/d Vijayawada 135 l/c/d
• Climate condition
less in wintermore in summer
• Cost of water
rate demand rate demand
45. • Supply system
Bad Supply
• Distribution System
Good supply
demandPressure
high
Pressure
low
demand
demand demand
46. • Industry
• Quality of water
good demand demandbad
demand demandindustryindustry
• Habit of people
demand demandEWS MIG
(Living style)
47. Factors affecting losees & Wastes
• Water tight joints
• Pressure in distribution system
• System of supply
• Metering
• Unauthorised connections
51. Fluctuations in Rate of Demand
Average Daily Per Capita Demand
= Quantity Required in 12 Months/ (365 x
Population)
If this average demand is supplied at all the times, it
will not be sufficient to meet the fluctuations.
Maximum daily demand = 1.8 x average daily
demand
51
52. Maximum hourly demand of maximum day i.e. Peak
demand
= 1.5 x average hourly demand
= 1.5 x Maximum daily demand/24
= 1.5 x (1.8 x average daily demand)/24
= 2.7 x average daily demand/24
= 2.7 x annual average hourly demand
52
53. Seasonal variation: The demand peaks during
summer. Firebreak outs are generally more in
summer, increasing demand. So, there is seasonal
variation .
Daily variation depends on the activity. People draw
out more water on Sundays and Festival days, thus
increasing demand on these days.
53
54. Hourly variations are very important as they have a
wide range. During active household working hours
i.e. from six to ten in the morning and four to eight in
the evening, the bulk of the daily requirement is
taken. During other hours the requirement is
negligible.
Moreover, if a fire breaks out, a huge quantity of
water is required to be supplied during short duration,
necessitating the need for a maximum rate of hourly
supply.
54
55. So, an adequate quantity of water must be available to
meet the peak demand.
To meet all the fluctuations, the supply pipes, service
reservoirs and distribution pipes must be properly
proportioned.
The water is supplied by pumping directly and the
pumps and distribution system must be designed to
meet the peak demand.
55
56. The effect of monthly variation influences the design
of storage reservoirs and the hourly variations
influences the design of pumps and service reservoirs.
As the population decreases, the fluctuation rate
increases.
Coincident Draft: It is extremely improbable that a
fire may braek out when water is being drawn by the
consumers at maximum hourly draft. Hence total
draft is not taken as sum of maximum hourly demand
& fire demand, but is taken as sum of maximum daily
demand & fire demand, or the maximum hourly
demand, whichever is more. The maximum daily
demand when added to fire draft for working out total
draft, is known as coincident draft.
56
57. Effect of variations on components of water supply
scheme
• Source of supply such as wells, etc may be designed for
maximum daily consumption.
• The pipe mains from source to service reservoirs may be
designed for maximum daily consumption
• Filters & other units of treatment unit- Maximum daily
draft. An additional provision of reserve is made for
break-down & repairs. Hence designed for twice the
daily avg. demand instead of 1.8 times the avg. daily
• Pumps for lifting the water- Maximum daily draft plus
some reserve for break-down & repairs. Hence designed
for twice the daily avg. demand instead of 1.8 times the
avg. daily.
58. Design Periods
The future period for which a provision is made in the
water supply scheme is known as the design period.
Design period is estimated based on the following:
(Factors affecting Design Period)
1Useful life of the component, considering
2obsolescence, wear, tear, etc.
3Expandability aspect.
4Rate of interest
58
59. 5Anticipated rate of growth of population, including
industrial, commercial developments & migration-
immigration.
6Available resources.
7Performance of the system during initial period.
8The rate of interest on borrowing.
59
60. Sr. no. Item Design Period in Years
1 Storage by dams 50
2 Intake works 30
3 Pumping 1Pump house 30
2Electric motors & pumps 15
4 Water treatment units 15
5
Pipe connections to several treatment units &
other small appurtenances
30
6 Raw water & clear water conveying units 30
7
Clear water reservoirs, balancing reservoirs,
ESR,GSR, etc
15
8 Distribution system 30
Design period for different components of water supply
scheme ( GoI Mannual)
66. Population Forecasting Methods
The present population of city is determined by
conducting an official enumeration, called census.
Population growth- a) Births b) Deaths c) Migrations.
The various methods adopted for estimating future
populations .
The particular method to be adopted for a particular
case or for a particular city depends largely on the
factors discussed in the methods, and the selection is
left to the discretion and intelligence of the designer.
66
67.
68.
69. Arithmetic Increase Method
Geometric Increase Method
Incremental Increase Method
Decreasing Rate of Growth Method
Simple Graphical Method
Comparative Graphical Method
The master plan method
The apportionment method
The logistic curve method
69
72. Arithmetic Increase Method
This method is based on the assumption that the
population is increasing at a constant rate.
The rate of change of population with time is
constant. The population after ‘n’ decades can be
determined by the formula
Pn = P0 + n.x where
P0 → population at present
n → No. of decades
x → average of Population increase of ‘n’ decades
72
73. Geometric Increase Method
This method is based on the assumption that the
percentage increase in population from decade to
decade remains constant.
In this method the average percentage of growth of
last few decades is determined.
The population at the end of ‘n’ decades is calculated
by- Pn = P0 {1+ r/100}n
where
P0 → population at present
r → average percentage of growth of ‘n’ decades
r = (r1+r2+---+rn)/t r = t
r1.r2....rt r = t (P2/P1) - 1
73
74. Incremental Increase Method
This method is improvement over the above
two methods.
The average increase in the population is
determined by the arithmetical method and to
this is added the average of the net incremental
increase once for each future decade.
Pn = P0 + nx + n(n+1) .y
74
77. Assignment No.2 (CO2)
• Define per capita demand. What are the various types of demands of
growing town. Mention these demands per capita basis.
• Enlist & discuss the factors that affect per capita demand.
• Discuss the factors affecting losses & Wastages in water supply.
• What is meant by variations in the rate of demand? what are the effects of
these variations on the design of various units of a water supply scheme?
Sketch the fluctuations in demand for typical Indian conditions. Define
Coincident draft.
• What is design period? State & explain various factors affecting it.
• Explain various methods of population forecasting. Solve any four problems
on population forecasting.(one problem by simple graphical method)(A/M-
12)
• Give the requirements of good water meter. (MU- N/D- 2016)