Water requirement | Civil Engineering | Environmental Engineering 1
2.
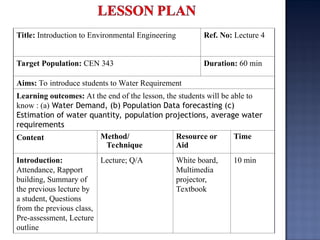
Title: Introduction toEnvironmental Engineering Ref. No: Lecture 4
Target Population: CEN 343 Duration: 60 min
Aims: To introduce students to Water Requirement
Learning outcomes: At the end of the lesson, the students will be able to
know : (a) Water Demand, (b) Population Data forecasting (c)
Estimation of water quantity, population projections, average water
requirements
Content Method/
Technique
Resource or
Aid
Time
Introduction:
Attendance, Rapport
building, Summary of
the previous lecture by
a student, Questions
from the previous class,
Pre-assessment, Lecture
outline
Lecture; Q/A White board,
Multimedia
projector,
Textbook
10 min
3.
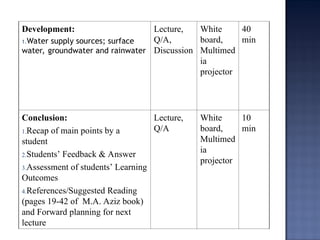
Development:
1.Water supply sources;surface
water, groundwater and rainwater
Lecture,
Q/A,
Discussion
White
board,
Multimed
ia
projector
40
min
Conclusion:
1.Recap of main points by a
student
2.Students’ Feedback & Answer
3.Assessment of students’ Learning
Outcomes
4.References/Suggested Reading
(pages 19-42 of M.A. Aziz book)
and Forward planning for next
lecture
Lecture,
Q/A
White
board,
Multimed
ia
projector
10
min
4.
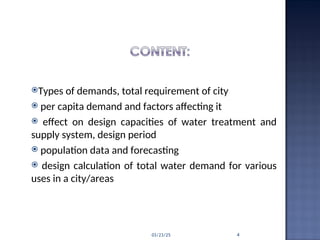
Types of demands,total requirement of city
per capita demand and factors affecting it
effect on design capacities of water treatment and
supply system, design period
population data and forecasting
design calculation of total water demand for various
uses in a city/areas
03/23/25 4
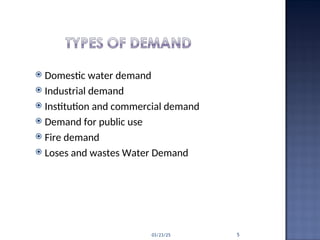
5.
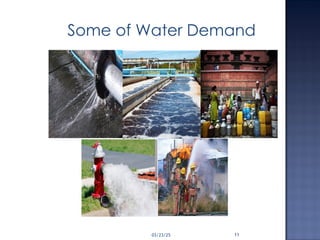
Domestic waterdemand
Industrial demand
Institution and commercial demand
Demand for public use
Fire demand
Loses and wastes Water Demand
03/23/25 5
6.
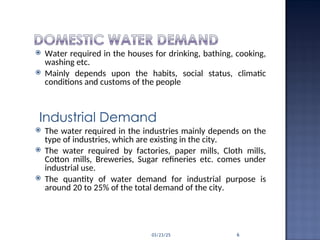
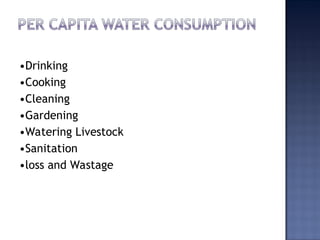
Water requiredin the houses for drinking, bathing, cooking,
washing etc.
Mainly depends upon the habits, social status, climatic
conditions and customs of the people
Industrial Demand
The water required in the industries mainly depends on the
type of industries, which are existing in the city.
The water required by factories, paper mills, Cloth mills,
Cotton mills, Breweries, Sugar refineries etc. comes under
industrial use.
The quantity of water demand for industrial purpose is
around 20 to 25% of the total demand of the city.
03/23/25 6
7.
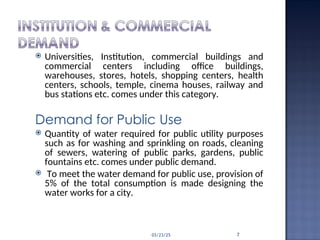
Universities, Institution,commercial buildings and
commercial centers including office buildings,
warehouses, stores, hotels, shopping centers, health
centers, schools, temple, cinema houses, railway and
bus stations etc. comes under this category.
Demand for Public Use
Quantity of water required for public utility purposes
such as for washing and sprinkling on roads, cleaning
of sewers, watering of public parks, gardens, public
fountains etc. comes under public demand.
To meet the water demand for public use, provision of
5% of the total consumption is made designing the
water works for a city.
03/23/25 7
8.
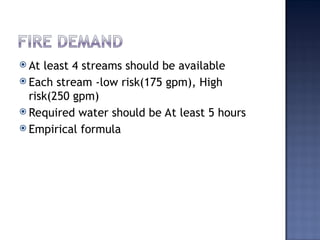
At least4 streams should be available
Each stream -low risk(175 gpm), High
risk(250 gpm)
Required water should be At least 5 hours
Empirical formula
9.
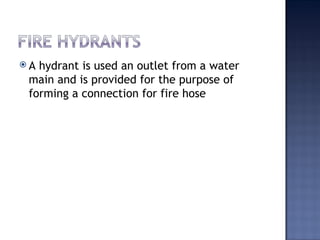
A hydrantis used an outlet from a water
main and is provided for the purpose of
forming a connection for fire hose
10.
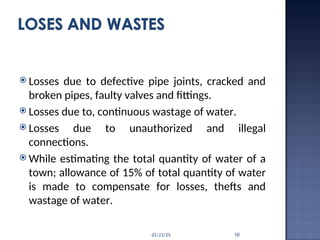
Losses dueto defective pipe joints, cracked and
broken pipes, faulty valves and fittings.
Losses due to, continuous wastage of water.
Losses due to unauthorized and illegal
connections.
While estimating the total quantity of water of a
town; allowance of 15% of total quantity of water
is made to compensate for losses, thefts and
wastage of water.
03/23/25 10
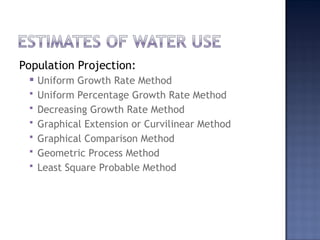
The designof water supply system is the
framing of an estimate giving the total water
required by the community
Two factors
1.probable population at
the end of the design period
2.Rate of water supply per
capita per day
13.
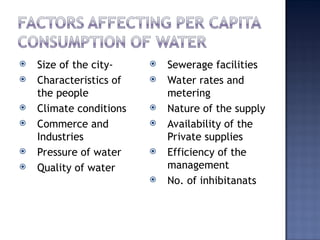
Size ofthe city-
Characteristics of
the people
Climate conditions
Commerce and
Industries
Pressure of water
Quality of water
Sewerage facilities
Water rates and
metering
Nature of the supply
Availability of the
Private supplies
Efficiency of the
management
No. of inhibitanats